





Impact Statement
Shale oil and gas resources are strategic assets for global energy security, yet their commercial development is often constrained by the low flowback efficiency of fracturing fluids. This retained water poses significant operational risks and environmental concerns, including high freshwater demand and potential groundwater impacts. This review addresses these challenges by systematically synthesising the complex mechanisms of spontaneous imbibition, which governs fluid redistribution and hydrocarbon productivity. We interpret water uptake as a dynamic, multiphysics process driven by the synergy of capillary forces, chemical osmotic pressure and clay hydration. By highlighting the continuous evolution of pore networks during fluid invasion, this work establishes a comprehensive conceptual foundation for understanding long-term flow behaviour. These insights provide industry and government stakeholders with a scientific basis to optimise hydraulic-fracturing designs and flowback-management strategies. Ultimately, this synthesis supports the development of more accurate predictive models and promotes more sustainable and efficient resource recovery.
1. Introduction
With the progressive depletion of conventional hydrocarbon reserves, unconventional plays, specifically shale oil and gas, have emerged as vital global energy assets. These formations are characterised by nanodarcy-scale matrix permeability, pronounced heterogeneity and pervasive networks of nanopores and throats that significantly restrict fluid transport. Consequently, commercial viability depends on horizontal drilling integrated with multistage hydraulic fracturing to establish interconnected fracture networks and maximise the stimulated reservoir volume (Lei et al. Reference Lei, Xu, Cai, Guan, Wang, Bi, Li, Li, Ding, Fu, Tong, Li and Zhang2022; You et al. Reference You, Zhou, Kang, Yang, Cui and Cheng2019). This engineering approach bypasses limitations in matrix flow and underpins the rapid expansion of the global shale industry.
Despite the effectiveness of hydraulic fracturing, shale reservoirs consistently exhibit low flowback recovery, and a significant portion of the injected aqueous phase remains unrecovered over short production time scales. Flowback ratios frequently fall below 50% in major shale gas plays and may drop to under 5% in specific reservoirs (Wang et al. Reference Wang, Pan and Zhang2016; Wu et al. Reference Wu, Di, Zhang, Li, Zhang, Wang and Zhou2021), indicating extensive liquid retention within the matrix. Field observations from different shale plays also show that water recovery varies substantially among formations, with low recovery commonly reported in gas shale systems such as the Barnett, Marcellus and Haynesville shales and different recovery behaviors observed in liquid-rich systems such as the Bakken and Eagle Ford formations (Singh Reference Singh2016). For example, residual treatment water in the Marcellus and Haynesville gas shales has been interpreted to be retained partly because capillary and osmotic forces drive water into the shale matrix rather than allowing it to migrate freely out of the formation (Engelder et al. Reference Engelder, Cathles and Bryndzia2014). This phenomenon introduces both operational and environmental challenges, including a high demand for freshwater and potential risks to groundwater integrity (Abraham et al. Reference Abraham, Liberatore, Aziz, Burnett, Cizmas and Richardson2023; Birdsell et al. Reference Birdsell, Rajaram, Dempsey and Viswanathan2015), as well as the possibility of formation damage that compromises well performance (Xu et al. Reference Xu, Li and Lu2017). Retained water is traditionally associated with elevated water saturation in the vicinity of the wellbore and water blocking, which reduces the relative permeability of hydrocarbons. However, field observations of extended shut-in or soaking periods often correlate with improved production rates. These findings suggest that fluid retention is not merely an operational loss but is governed by complex physicochemical processes during interactions between the fractures and the matrix.
Evidence suggests that large-scale water retention in shale is driven by spontaneous imbibition, primarily regulated by capillary suction and chemical potential gradients. The intricate networks of pore throats and clay-rich mineralogy provide a high specific surface area and a strong potential for fluid invasion (Li et al. Reference Li, Singh and Cai2019 b; Wang et al. Reference Wang, Gao, Fei, Liu, Wang, Li and Liu2023). Water transport into these nanopores is a dynamic, multiphysics process involving advection–diffusion transport, clay hydration kinetics, ion exchange and electric double-layer effects. In some instances, these interactions trigger the propagation of microfractures induced by hydration (Binazadeh et al. Reference Binazadeh, Xu, Jiang, Zolfaghari and Dehghanpour2015). Crucially, in water-wet or mixed-wet systems, the imbibed phase can displace in situ hydrocarbons through counter-current imbibition, a mechanism often cited as the primary driver for production gains following shut-in periods. Thus, shale imbibition acts as a complex phenomenon that potentially induces formation damage while simultaneously enhancing recovery under specific reservoir conditions. Extensive experimental and modelling studies across different shale systems have demonstrated that water imbibition is controlled by the combined effects of pore structure, wettability, bedding anisotropy, clay content, salinity contrast and fluid–rock fluid-rock interactions (Dehghanpour et al. Reference Dehghanpour, Lan, Saeed, Fei and Qi2013; Roychaudhuri et al. Reference Roychaudhuri, Tsotsis and Jessen2013). Early gas shale studies showed that brine and oil imbibition cannot be fully explained by classical capillary scaling because water adsorption and hydration-induced microfracturing may alter the shale matrix during imbibition (Dehghanpour et al. Reference Dehghanpour, Lan, Saeed, Fei and Qi2013). Studies on Canadian gas shales developed workflows to estimate water loss during shut-in periods after fracturing operations (Makhanov et al. Reference Makhanov, Habibi, Dehghanpour and Kuru2014), whereas investigations of Barnett shale highlighted the importance of nanopore connectivity and depth-dependent wettability for fluid uptake and gas transport (Gao & Hu Reference Gao and Hu2016; Hu et al. Reference Hu, Ewing and Rowe2015). Other studies showed that rock fabric and bedding orientation significantly affect water imbibition and salt diffusion in gas shales (Ghanbari & Dehghanpour Reference Ghanbari and Dehghanpour2015). More recent imaging studies, including neutron imaging and X-ray computed tomography, have further enabled direct visualisation of water migration and fracture–matrix exchange in Eagle Ford and other heterogeneous shale systems (DiStefano et al. Reference DiStefano, Cheshire, McFarlane, Kolbus, Hale, Perfect, Bilheux, Santodonato, Hussey, Jacobson, Lamanna, Bingham, Starchenko and Anovitz2017; Kurotori et al. Reference Kurotori, Murugesu, Zahasky, Vega, Druhan, Benson and Kovscek2023; Peng et al. Reference Peng, LaManna, Periwal and Shevchenko2023).
Research in this field has transitioned from macroscopic, phenomenological observations to multiscale characterisation and mechanistic analysis. Initial studies quantified imbibition capacity by evaluating the influence of mineralogy, total organic carbon, bedding orientation and fluid properties such as salinity and surface tension. Recent advancements in imaging at the micro- and nanometre scales, including low-field nuclear magnetic resonance (LF-NMR), micro-/nano-computed tomography (micro-/nano-CT) and environmental scanning electron microscopy (ESEM), have enabled the visualisation of fluid migration pathways and the tracking of structural evolution induced by hydration. At the same time, molecular dynamics simulations and multiscale numerical models have provided increasingly detailed insight into fluid–rock interfacial interactions and transport behaviour under confinement. Existing review articles have substantially advanced the understanding of shale imbibition from the perspectives of wettability, osmotic transport and general fluid-retention behaviour. However, the interplay among capillarity, chemical osmosis, clay hydration and the accompanying evolution of pore structure and pore-network connectivity is often discussed in a relatively disconnected manner.
On the basis of these developments, this review provides a systematic synthesis of the mechanisms, controlling factors, monitoring strategies and numerical frameworks governing shale water imbibition. Particular emphasis is placed on viewing imbibition as a dynamic, cross-scale process in which multiphysics coupling and pore/pore-network evolution jointly control fluid invasion, retention and displacement behaviour. We first summarise kinetics at the pore scale driven by capillary suction and coupled physicochemical processes, specifically diffusion and osmosis. Subsequently, we evaluate the governing factors categorised by geological attributes, fluid chemistry and engineering conditions. We then review advanced monitoring techniques for characterising the evolution of pore structures and changes in rock mechanical properties. Finally, we assess current theoretical models and multiscale numerical simulations, addressing their validity and parametrisation, while outlining future research directions to optimise imbibition management for efficient shale resource recovery.
2. Kinetic mechanisms of water imbibition in shales
2.1. Capillarity-driven imbibition
During post-fracturing shut-in and flowback, capillary-driven spontaneous imbibition represents the primary conduit for aqueous-phase penetration into the multiscale pore–fracture networks of the shale matrix (Wang et al. Reference Wang, Gao, Fei, Liu, Wang, Li and Liu2023). As a self-driven transport process, imbibition is governed by the competition between interfacial interactions and pore-scale pressure gradients, seeking a state of thermodynamic equilibrium. Deciphering these capillary-driven mechanisms is pivotal for quantifying pore-scale fluid retention, mitigating the risk of water blockage and ultimately assessing the long-term impacts on gas transmissivity and reservoir productivity (Meng et al. Reference Meng, Liu, Zhang, Zhang, Zhang and Li2024; Rego et al. Reference Rego, Eltahan and Sepehrnoori2022). The capillary interpretation of spontaneous imbibition has a long history in porous-media physics and petroleum engineering. Classical studies treated imbibition as a wetting-phase invasion process controlled by interfacial tension, contact angle, pore radius and viscous resistance, providing the basis for later applications to gas-saturated reservoir rocks and fractured porous media (Li & Horne Reference Li and Horne2001; Morrow Reference Morrow1990).
2.1.1. Interfacial energetics and thermodynamic driving force
Spontaneous imbibition is physically manifested as the systemic propensity for Gibbs free energy minimisation. Shale architectures, composed of diverse inorganic minerals (e.g. quartz, feldspar and phyllosilicates), typically possess high surface energies. Prior to fluid contact, dry pore walls exist in a high-energy state associated with solid–gas interfaces. Upon contact with a wetting aqueous phase, the adhesion tension at the solid–liquid interface overcomes liquid–liquid cohesion, facilitating the displacement of the gas phase. This reduction in interfacial free energy provides the fundamental impetus that sustains fluid invasion against viscous dissipation, allowing for penetration into progressively finer pore structures (Morrow Reference Morrow1990).
In practice, the magnitude and effectiveness of this driving force depend strongly on shale wettability and its spatial heterogeneity. Shale comprises inorganic minerals, clay-rich domains and organic matter, leading to pronounced variability in surface chemistry and pore-wall affinity. Consequently, mixed wettability and wettability compartmentalisation have been widely reported in shale systems with different mineralogical and organic-matter compositions, reflecting the coexistence of hydrophilic inorganic surfaces, clay-rich domains and relatively hydrophobic organic pores (Arif et al. Reference Arif, Zhang and Iglauer2021; Liu et al. Reference Liu, Yang, Chu, Brownlow, Walker and Lu2025; Siddiqui et al. Reference Siddiqui, Chen, Iglauer and Roshan2019), as schematically illustrated in Figure 1. Under mixed-wet conditions, the wetting phase preferentially invades connected hydrophilic pathways that offer larger free-energy reductions, whereas invasion into hydrophobic or oil-wet organic pores may be limited by capillary entry pressures or effectively suppressed (Arif et al. Reference Arif, Zhang and Iglauer2021; Siddiqui et al. Reference Siddiqui, Chen, Iglauer and Roshan2019).
Schematic of a mixed-wettability capillary model for shale pores. The model illustrates the coexistence of water-wet ( $h_{w}$
) and oil-wet (
$h_{w}$
) and oil-wet ( $h_{o}$
) domains within a pore of diameter D and length L. The left-hand panel shows the longitudinal distribution of water and oil with respective contact angles
$h_{o}$
) domains within a pore of diameter D and length L. The left-hand panel shows the longitudinal distribution of water and oil with respective contact angles $\theta _{w}$
and
$\theta _{w}$
and $\theta _{o}$
. The right-hand panel defines the wettability fraction
$\theta _{o}$
. The right-hand panel defines the wettability fraction $f_{w}$
, representing the surface heterogeneity that governs the thermodynamic driving force for spontaneous water imbibition (adapted from Pu et al. (Reference Pu, Yang and Wang2025)).
$f_{w}$
, representing the surface heterogeneity that governs the thermodynamic driving force for spontaneous water imbibition (adapted from Pu et al. (Reference Pu, Yang and Wang2025)).
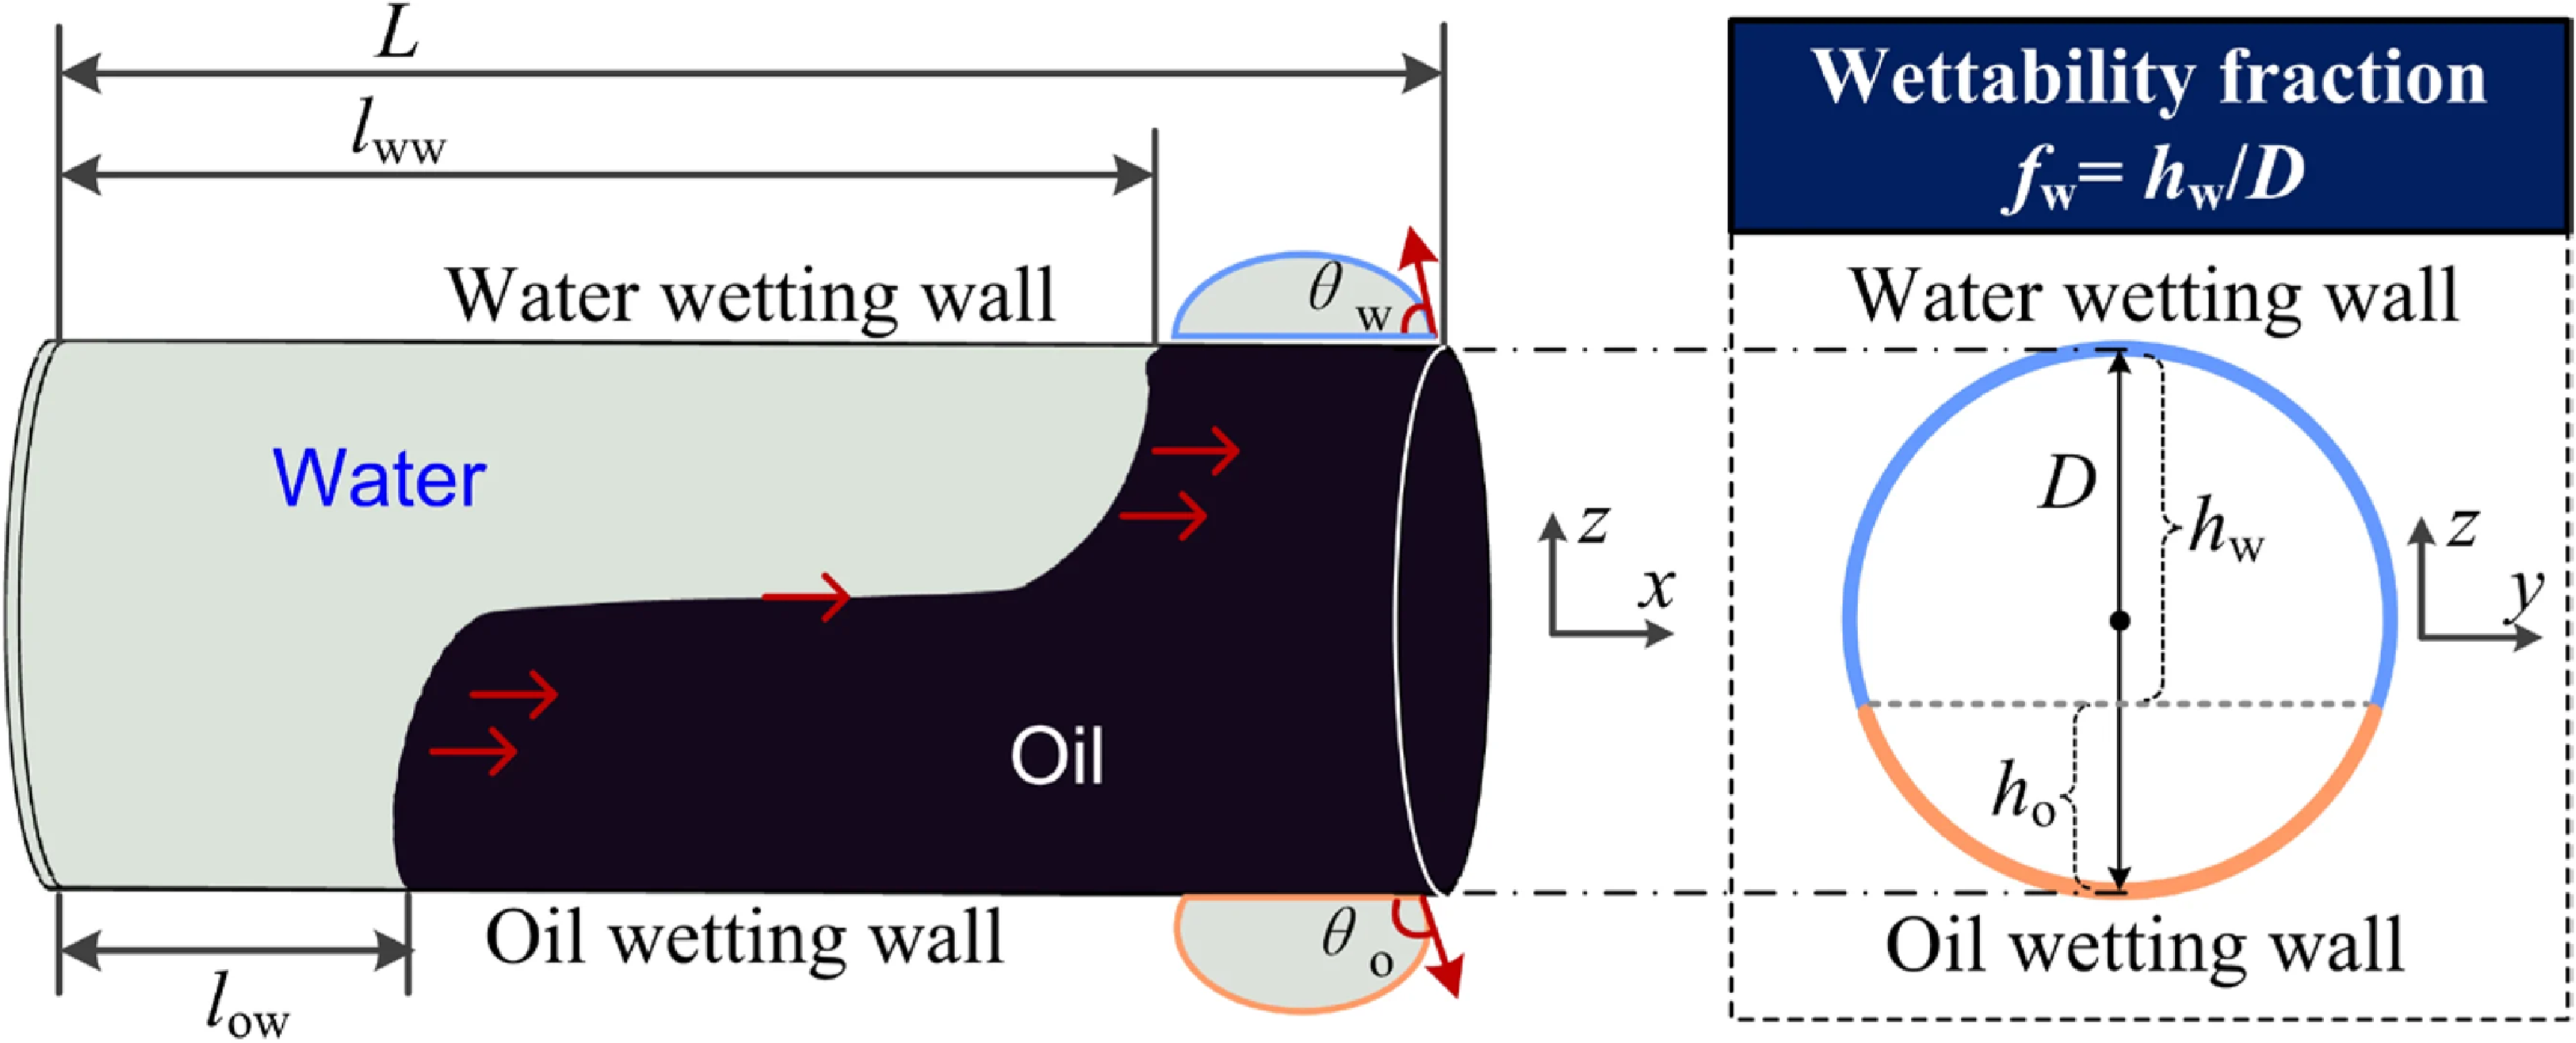
Figure 1 Long description
The schematic depicts a mixed-wettability capillary model for shale pores, illustrating the coexistence of water-wet and oil-wet domains within a pore of diameter D and length L. The left-hand panel shows the longitudinal distribution of water and oil with respective contact angles. The right-hand panel defines the wettability fraction, representing the surface heterogeneity that governs the thermodynamic driving force for spontaneous water imbibition.
2.1.2. Pressure-gradient mechanism induced by curved liquid interfaces
Under micro- to nanoscale confinement, a wetting aqueous phase typically forms a meniscus that is concave towards the non-wetting gas phase. Surface tension acting to reduce interfacial area gives rise to a capillary pressure difference, $P_{c}$
, which in a two-phase system is commonly defined as
$P_{c}$
, which in a two-phase system is commonly defined as
 \begin{equation}P_{c}=P_{non\text{-}\textit{wetting}}-P_{\textit{wetting}}=\frac{2\mathit{\sigma }\cos\theta }{r},\end{equation}
where $\sigma$
denotes the interfacial tension,
$\sigma$
denotes the interfacial tension, $\theta$
the contact angle and
$\theta$
the contact angle and $r$
the effective pore-throat radius.
$r$
the effective pore-throat radius.
In water-wet systems, the pressure deficiency at the meniscus generates a capillary pressure gradient that drives fluid into the pore space. This gradient serves as the primary mechanism for spontaneous imbibition at the pore-throat scale (Gao et al. Reference Gao, Fan, Hu, Jiang, Cheng and Xuan2019). Because shale pore throats are predominantly non-circular and angular rather than smooth cylinders in Figure 2, the radius r in (2.1) should be regarded as an effective length scale. In angular pores, wetting films may advance along corners even when the central pore body remains occupied by the non-wetting phase, leading to imbibition behaviour that deviates from ideal cylindrical-capillary predictions. Therefore, capillary pressure and viscous resistance require corrections for shape factors, corner-flow pathways and pore-throat roughness, as demonstrated by classical studies on non-circular and triangular capillaries (Mason & Morrow Reference Mason and Morrow1991; Ransohoff & Radke Reference Ransohoff and Radke1988) and summarised in more recent reviews (Cai et al. Reference Cai, Chen, Liu, Li and Sun2022).
Representative geometric configurations of capillaries for modelling pore-scale imbibition. The schematic summarises various non-circular and irregular geometries, including angular (triangular, square, rectangular) and axially varying (sinusoidal, convergent–divergent, curved) capillaries. These models are used to characterise the shape factors and corner-flow effects that occur in complex shale pore networks, providing more realistic descriptions than idealised cylindrical tubes (adapted from Cai et al. (Reference Cai, Chen, Liu, Li and Sun2022)).
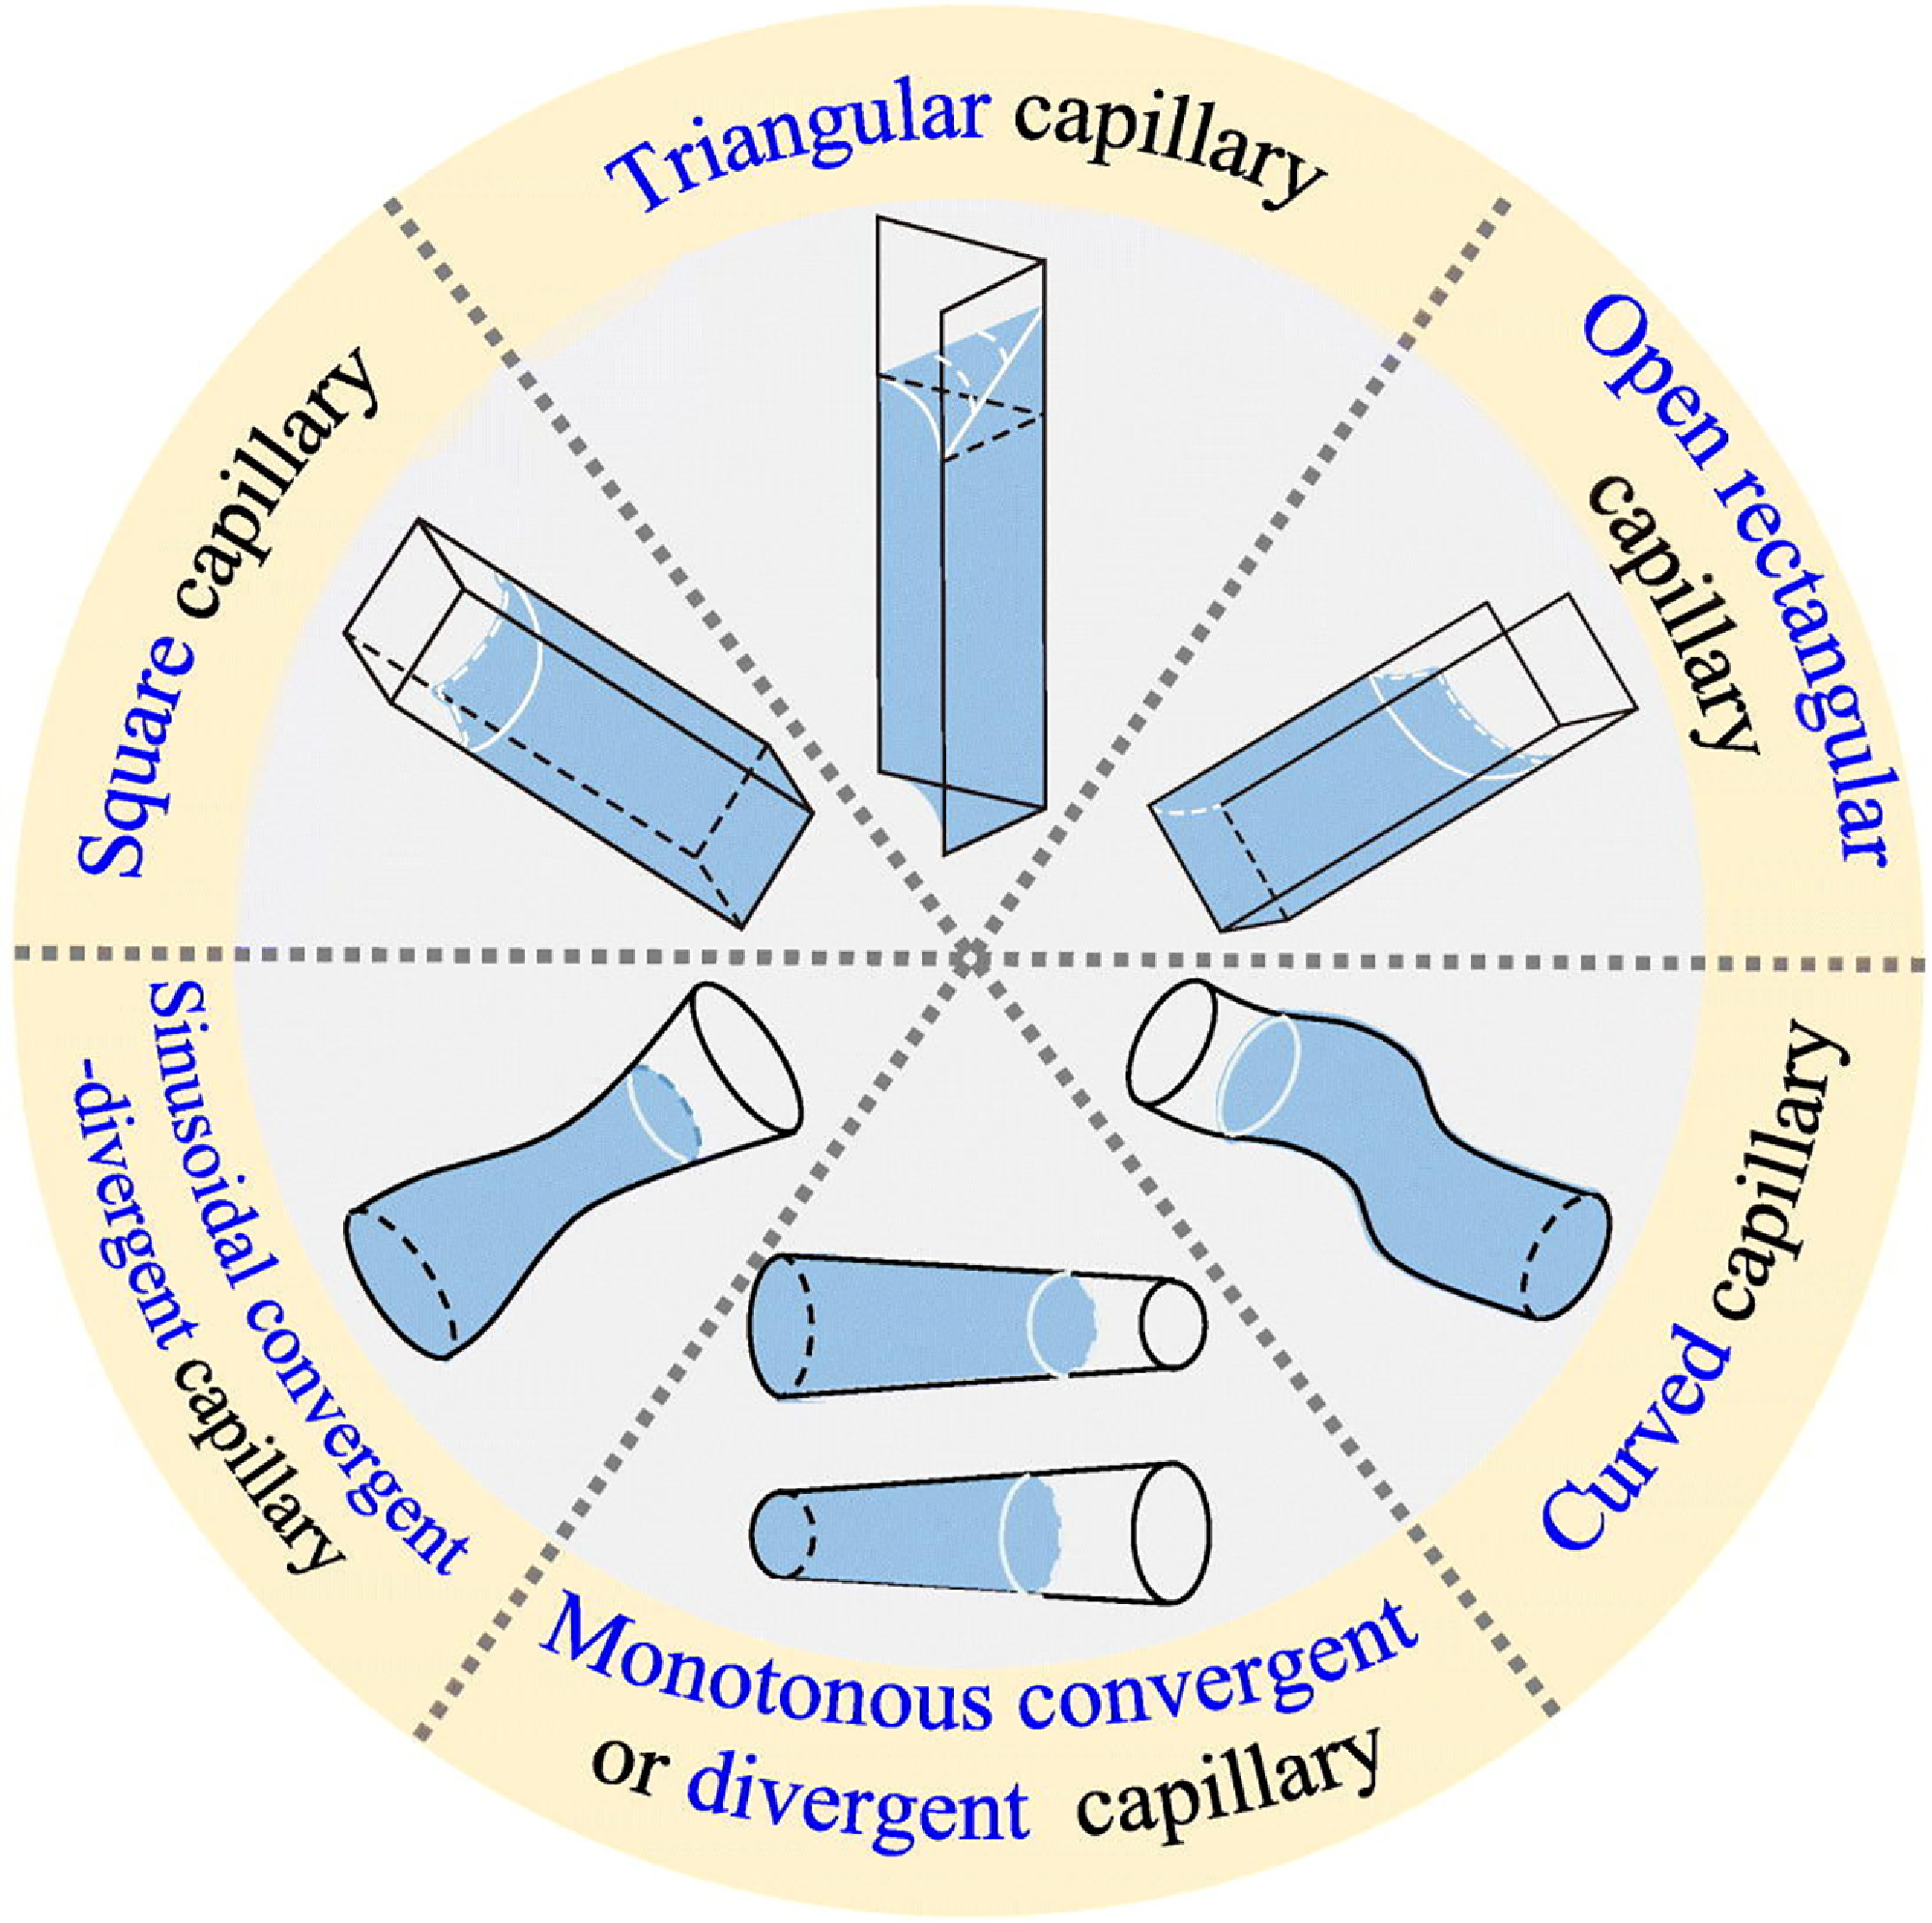
Figure 2 Long description
The diagram illustrates different non-circular and irregular geometries of capillaries, including triangular, square, rectangular, sinusoidal, convergent-divergent, and curved capillaries. These models are used to characterize shape factors and corner-flow effects in complex shale pore networks, providing more realistic descriptions than idealized cylindrical tubes.
The capillary driving force in shale is profoundly dependent on scale. Given that a substantial portion of pore throats reside in the nano-to-micrometre range (Loucks et al. Reference Loucks, Reed, Ruppel and Jarvie2009), the resulting capillary pressure can exceed several hundred MPa in Figure 3. Such high pressures significantly impede the recovery of fracturing fluids, leading to extensive fluid retention within the reservoir matrix (Shen et al. Reference Shen, Li, Cihan, Lu and Liu2019 a).
High-magnitude capillary pressure curves in shale as a function of water saturation. The plots illustrate the relationship between capillary pressure and water saturation at temperatures of 30 and 50 °C. In the low-saturation regime, capillary pressure reaches several hundred MPa, highlighting the immense resistance to fluid flowback within nanoporous shale matrices. These high pressures contribute to the significant retention of fracturing fluids observed in reservoir scales (adapted from Shen et al. (Reference Shen, Li, Cihan, Lu and Liu2019 a)).
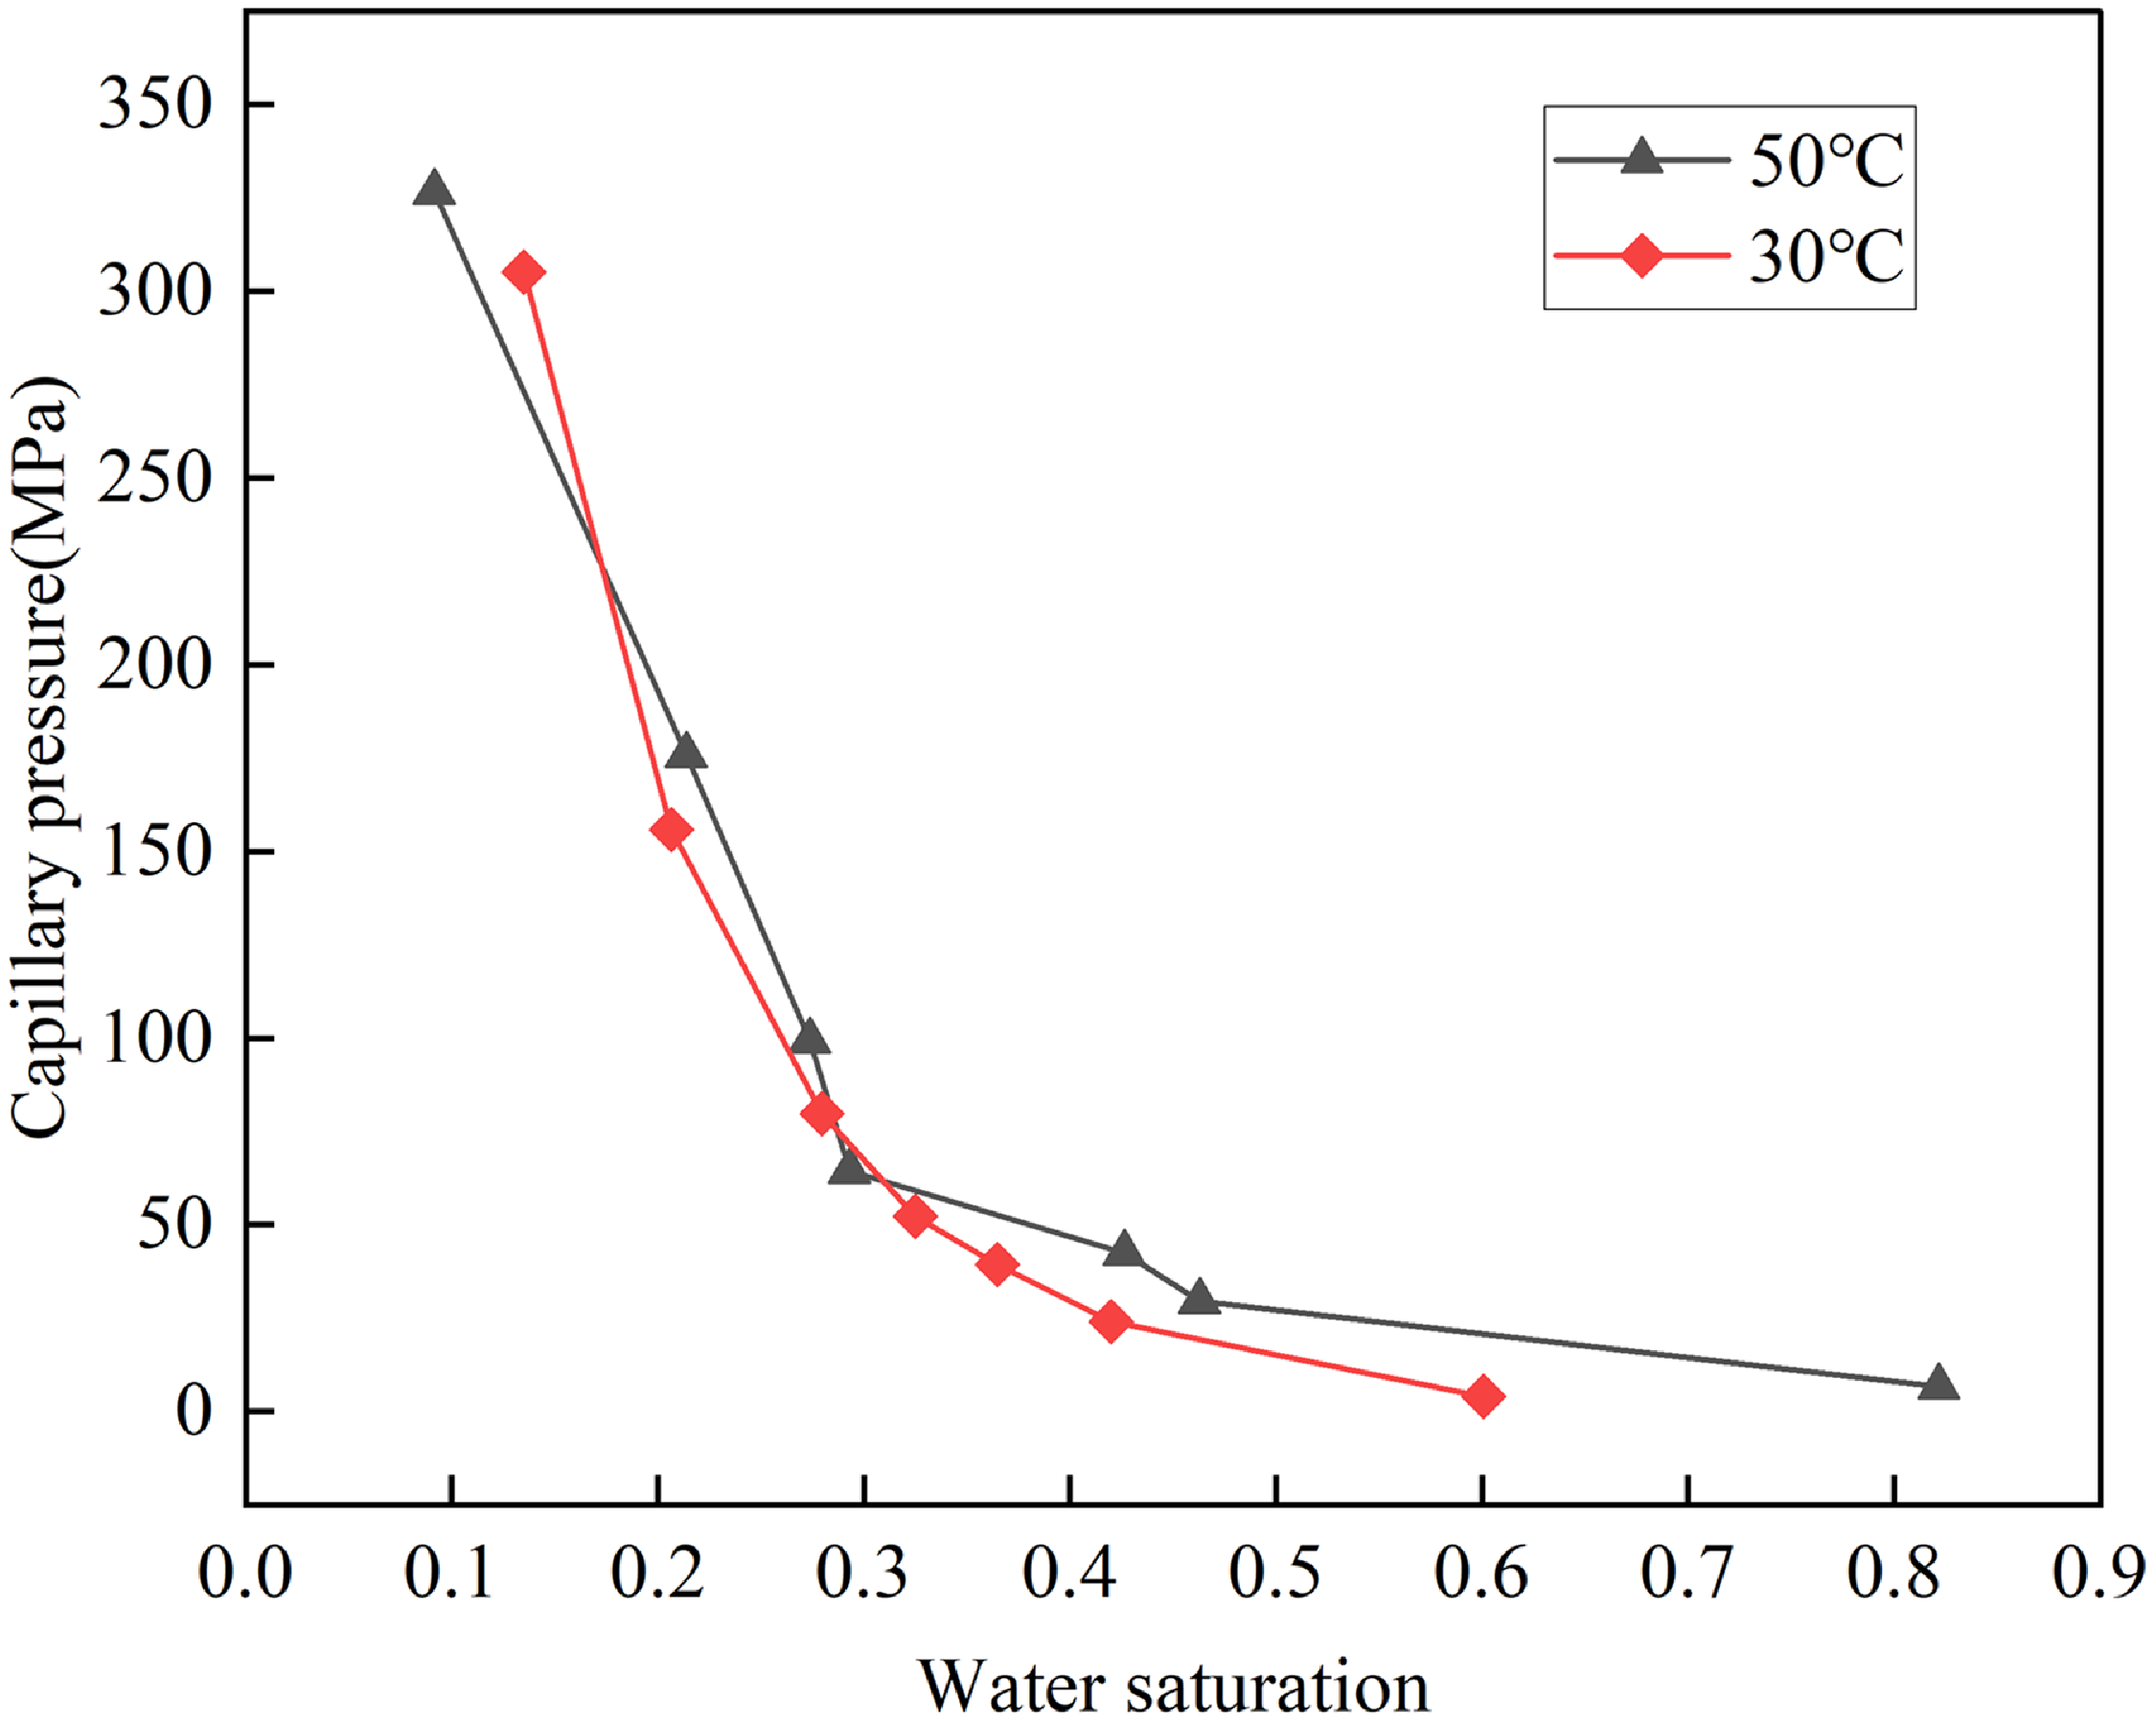
Figure 3 Long description
The line graph presents capillary pressure in megapascals on the y-axis and water saturation on the x-axis. Two data lines are shown: one for 30 degrees Celsius represented by red diamonds and another for 50 degrees Celsius represented by black triangles. At low water saturation, capillary pressure reaches several hundred megapascals, indicating high resistance to fluid flowback in nanoporous shale matrices. As water saturation increases, capillary pressure decreases sharply for both temperatures, with the 50 degrees Celsius line generally showing slightly lower pressures than the 30 degrees Celsius line. All values are approximated.
2.2. Physicochemical mechanisms
2.2.1. Semipermeable-membrane behaviour and osmotic transport in shales
While capillary forces often dominate fluid transport, osmotic pressure is increasingly identified as a critical driver of water invasion into the shale matrix (Fakcharoenphol et al. Reference Fakcharoenphol, Kurtoglu, Kazemi, Charoenwongsa and Wu2014; Pan et al. Reference Pan, Clarkson, Younis, Song, Debuhr, Ghanizadeh and Birss2021). Historically, petroleum engineering research focused on osmosis regarding drilling challenges, such as wellbore stability and fluid–shale interactions in saline formations (Mese Reference Mese1995; van Oort Reference van Oort1994). The concept of osmotic transport in shale has its roots in clay science and drilling engineering rather than in shale-reservoir development alone. Early studies on clay membranes demonstrated that charged clay-rich materials can behave as non-ideal semipermeable membranes, generating osmotically induced pressures under solute concentration gradients (Fritz Reference Fritz1986). In drilling engineering, coupled chemical–mechanical models further showed that hydraulic flow, ion diffusion, chemical osmosis and shale deformation must be considered together when evaluating shale–fluid interactions and wellbore stability (Mody & Hale Reference Mody and Hale1993; van Oort Reference van Oort2003). These early studies established the foundational concept of shale as a non-ideal semipermeable medium. Osmotic transport involves water migration across a semipermeable membrane driven by chemical potential gradients (Hu et al. Reference Hu, Zhao, Zhao, Wang, Zhao, Gao and Fu2020). In hydraulically fractured reservoirs, substantial salinity contrasts typically exist between injected fluids and in situ brines. Given the selective permeability of shale, these salinity gradients generate significant osmotic forces that regulate aqueous-phase migration.
At the pore scale, semipermeability arises primarily from clay minerals and the electric double layers formed at mineral–fluid interfaces (Olsen Reference Olsen1972). Negatively charged clay surfaces attract counterions, creating diffuse electric double layers in Figure 4. In narrow pore throats, the overlap of adjacent diffuse layers creates electrostatic barriers. This mechanism impedes the transport of hydrated ions (ionic sieving) but permits water passage (Li et al. Reference Li, Abass, Teklu and Cui2016 b; Zhao et al. Reference Zhao, Pu, Zhou, Jin, Han, Shi, Han, Ding, Zhang, Wang, Liu and Wang2021).
Microscopic mechanisms of the electric double layer and its impact on clay–water interactions in shales. (a) Schematic of the electric potential ( $\psi$
) distribution near a negatively charged clay surface. The model identifies the compact Stern layer and the diffusive layer, where the potential decays from the surface value (
$\psi$
) distribution near a negatively charged clay surface. The model identifies the compact Stern layer and the diffusive layer, where the potential decays from the surface value ( $\psi _{0}$
) towards the bulk solution. (b) Conceptual illustration of clay swelling and dispersion processes. The hydration of clay particles leads to interlayer expansion and subsequent particle separation beyond the slipping plane. In confined nanopores, the overlap of these diffusive layers creates an electrostatic barrier that facilitates ionic sieving and semipermeable membrane behaviour (adapted from Ding et al. (Reference Ding, Yu, Liu, Liang and Xiong2021) and Wang et al. (Reference Wang, Wang, Xia, Zhao, Masoodi and Xia2025)).
$\psi _{0}$
) towards the bulk solution. (b) Conceptual illustration of clay swelling and dispersion processes. The hydration of clay particles leads to interlayer expansion and subsequent particle separation beyond the slipping plane. In confined nanopores, the overlap of these diffusive layers creates an electrostatic barrier that facilitates ionic sieving and semipermeable membrane behaviour (adapted from Ding et al. (Reference Ding, Yu, Liu, Liang and Xiong2021) and Wang et al. (Reference Wang, Wang, Xia, Zhao, Masoodi and Xia2025)).
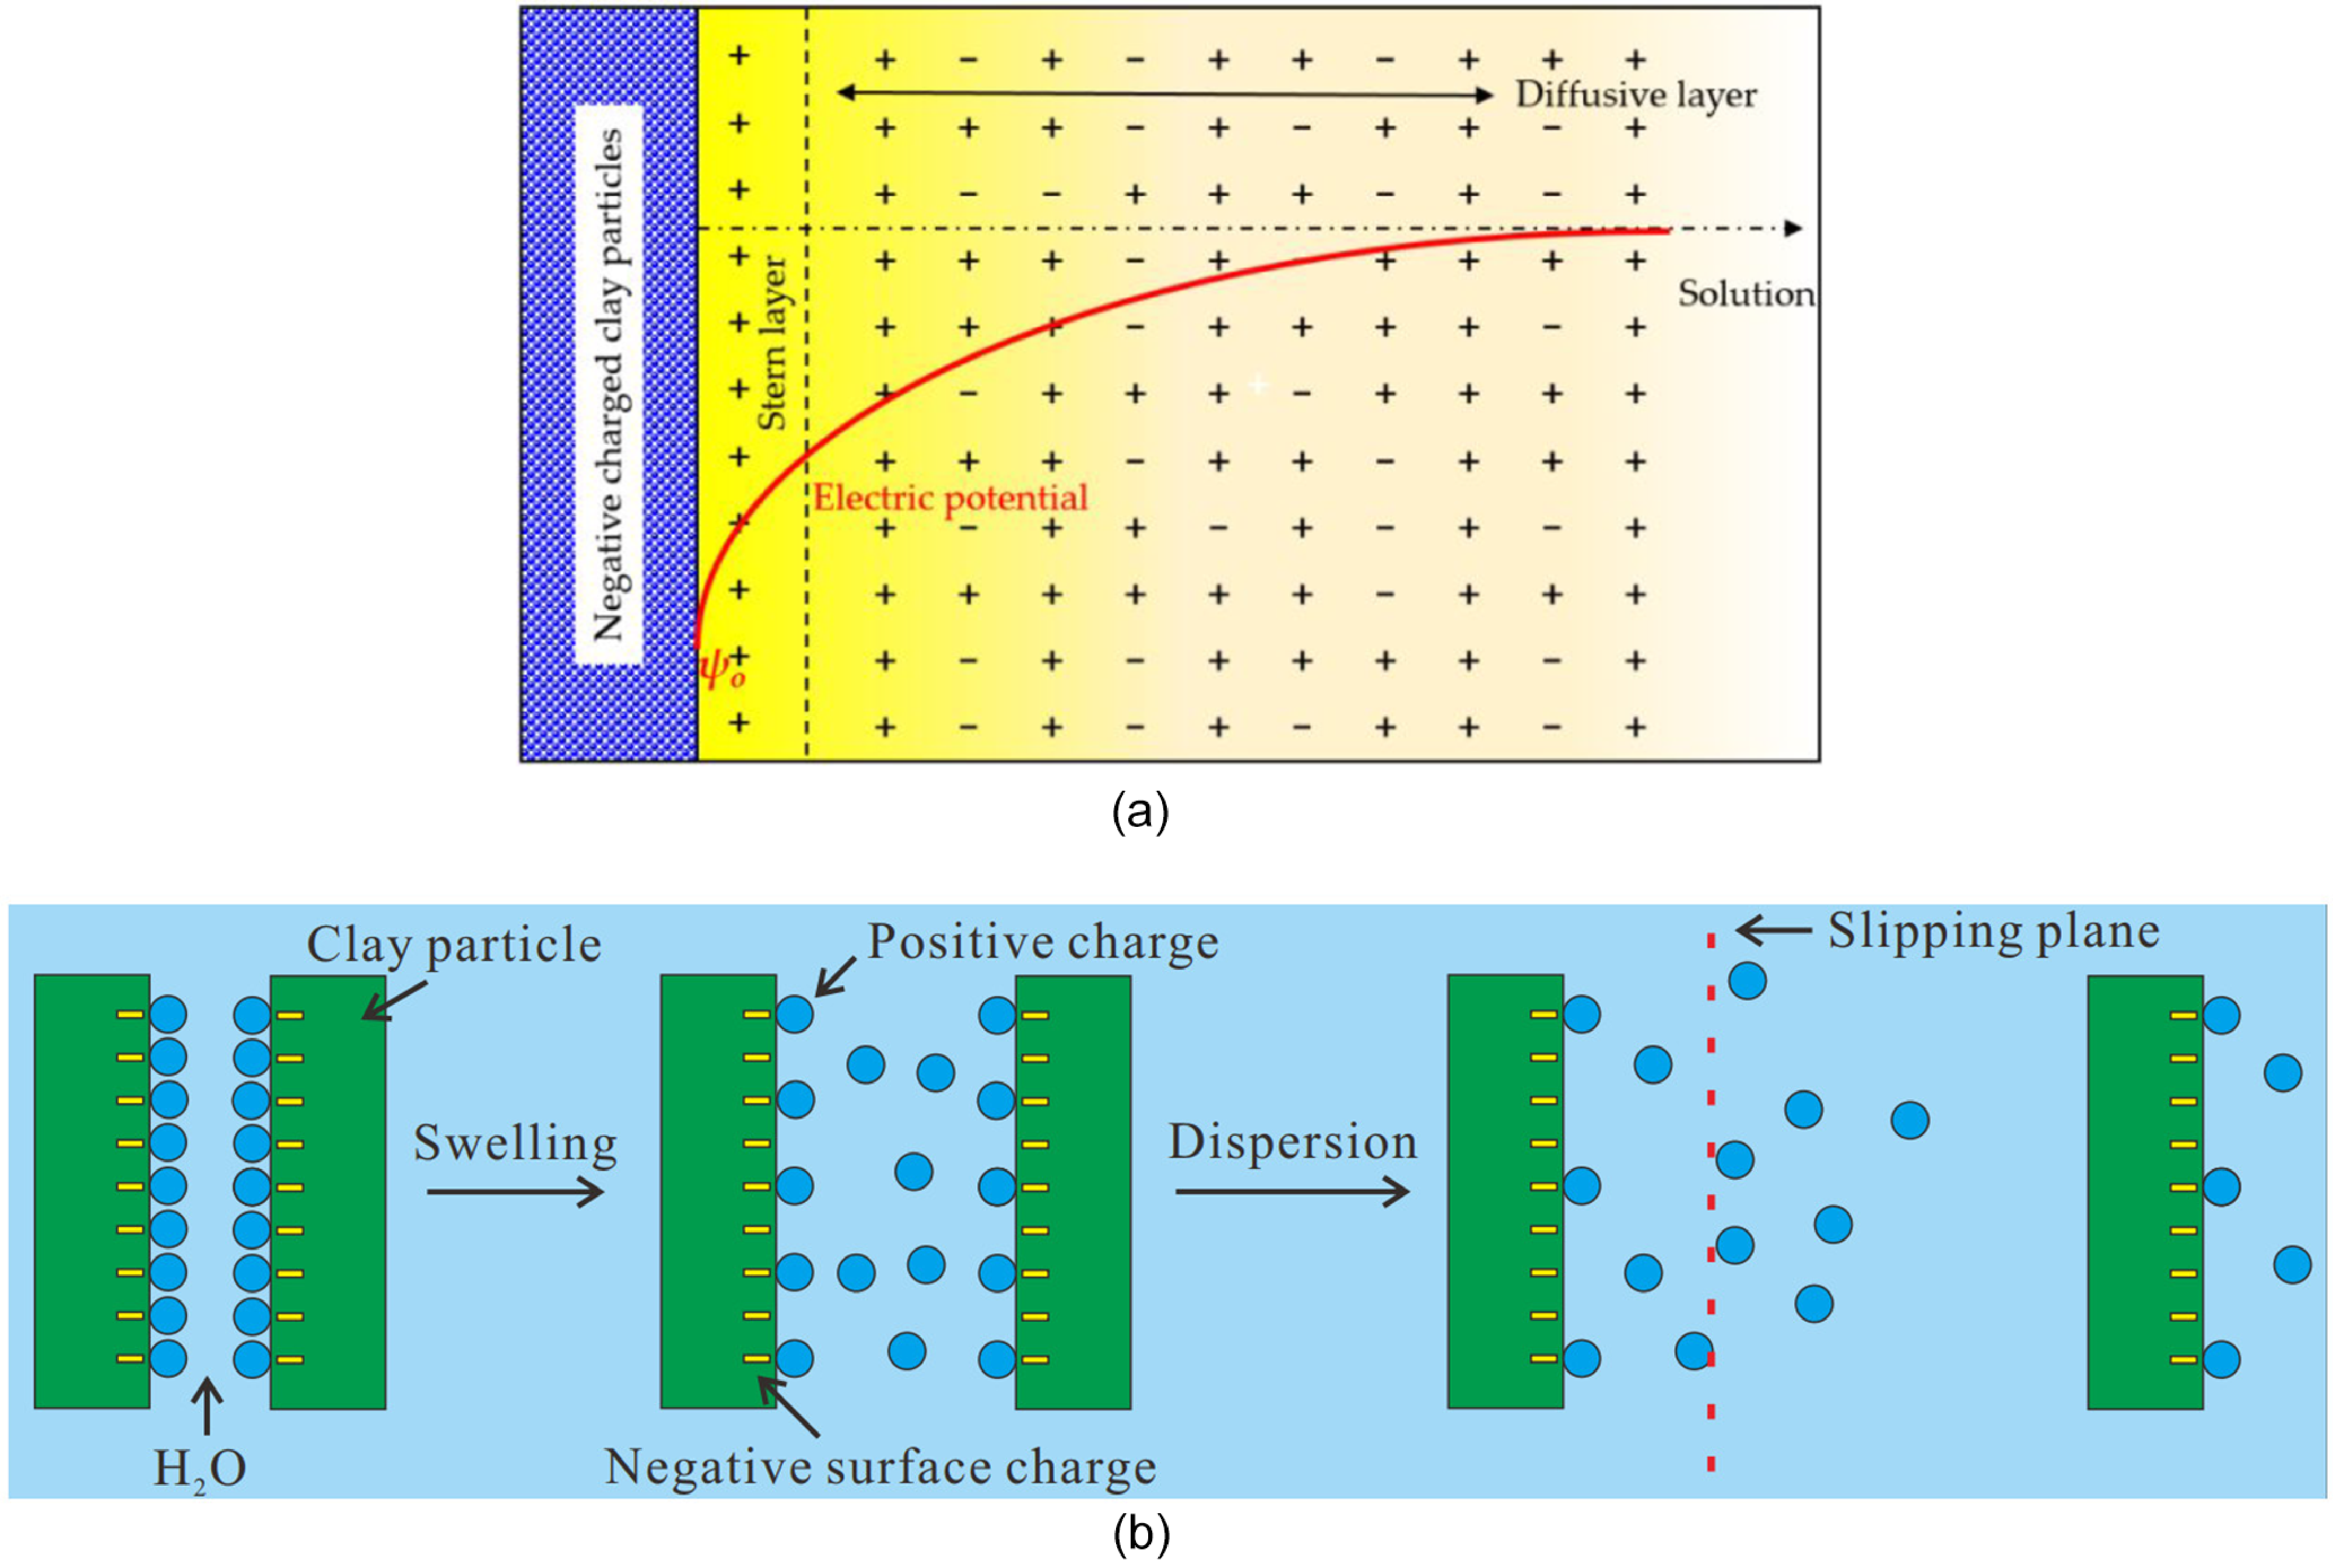
Figure 4 Long description
The first part of the diagram shows a schematic of the electric potential distribution near a negatively charged clay surface. It highlights the compact Stern layer and the diffusive layer, where the potential decays from the surface value towards the bulk solution. The second part of the diagram illustrates the conceptual processes of clay swelling and dispersion. It shows how the hydration of clay particles leads to interlayer expansion and subsequent particle separation beyond the slipping plane. In confined nanopores, the overlap of these diffusive layers creates an electrostatic barrier that facilitates ionic sieving and semipermeable membrane behavior.
Under reservoir conditions, shale matrices host both clay minerals and high-salinity connate water (Li et al. Reference Li, Li, Wang, Li and Xu2016 a; Xu et al. Reference Xu, Zhan and Wang2022). Consequently, the interaction between low-salinity fracturing fluids and in situ brines induces osmotic pressure gradients that drive water influx into the matrix in Figure 5 (Wang & Pan Reference Wang and Pan2016; Zhou et al. Reference Zhou, Li and Teklu2021). Notably, in specific oil-wet systems, osmosis may outweigh capillarity as the dominant invasion mechanism (Bui & Tutuncu Reference Bui and Tutuncu2017; Torcuk et al. Reference Torcuk, Uzun, Padin and Kazemi2019). Padin et al. (Reference Padin, Torcuk, Katsuki, Kazemi and Tutuncu2018) reinforce this by demonstrating that capillarity alone fails to account for the total water uptake in certain shale gas reservoirs, highlighting osmotic transport as a critical driver.
Schematic of osmotically driven water imbibition in the shale matrix. Low-salinity fracturing fluid interacts with high-salinity formation water . Clay minerals, interspersed among inorganic grains, function as semipermeable membranes. The resulting salinity gradient induces osmotic flux from the fracture into matrix pores. This process complements capillary forces, particularly in clay-rich formations with significant salinity contrasts (adapted from Su et al. (Reference Su, Sun, Wang, Guo, Xu, Li, Pu, Han and Shi2022)).
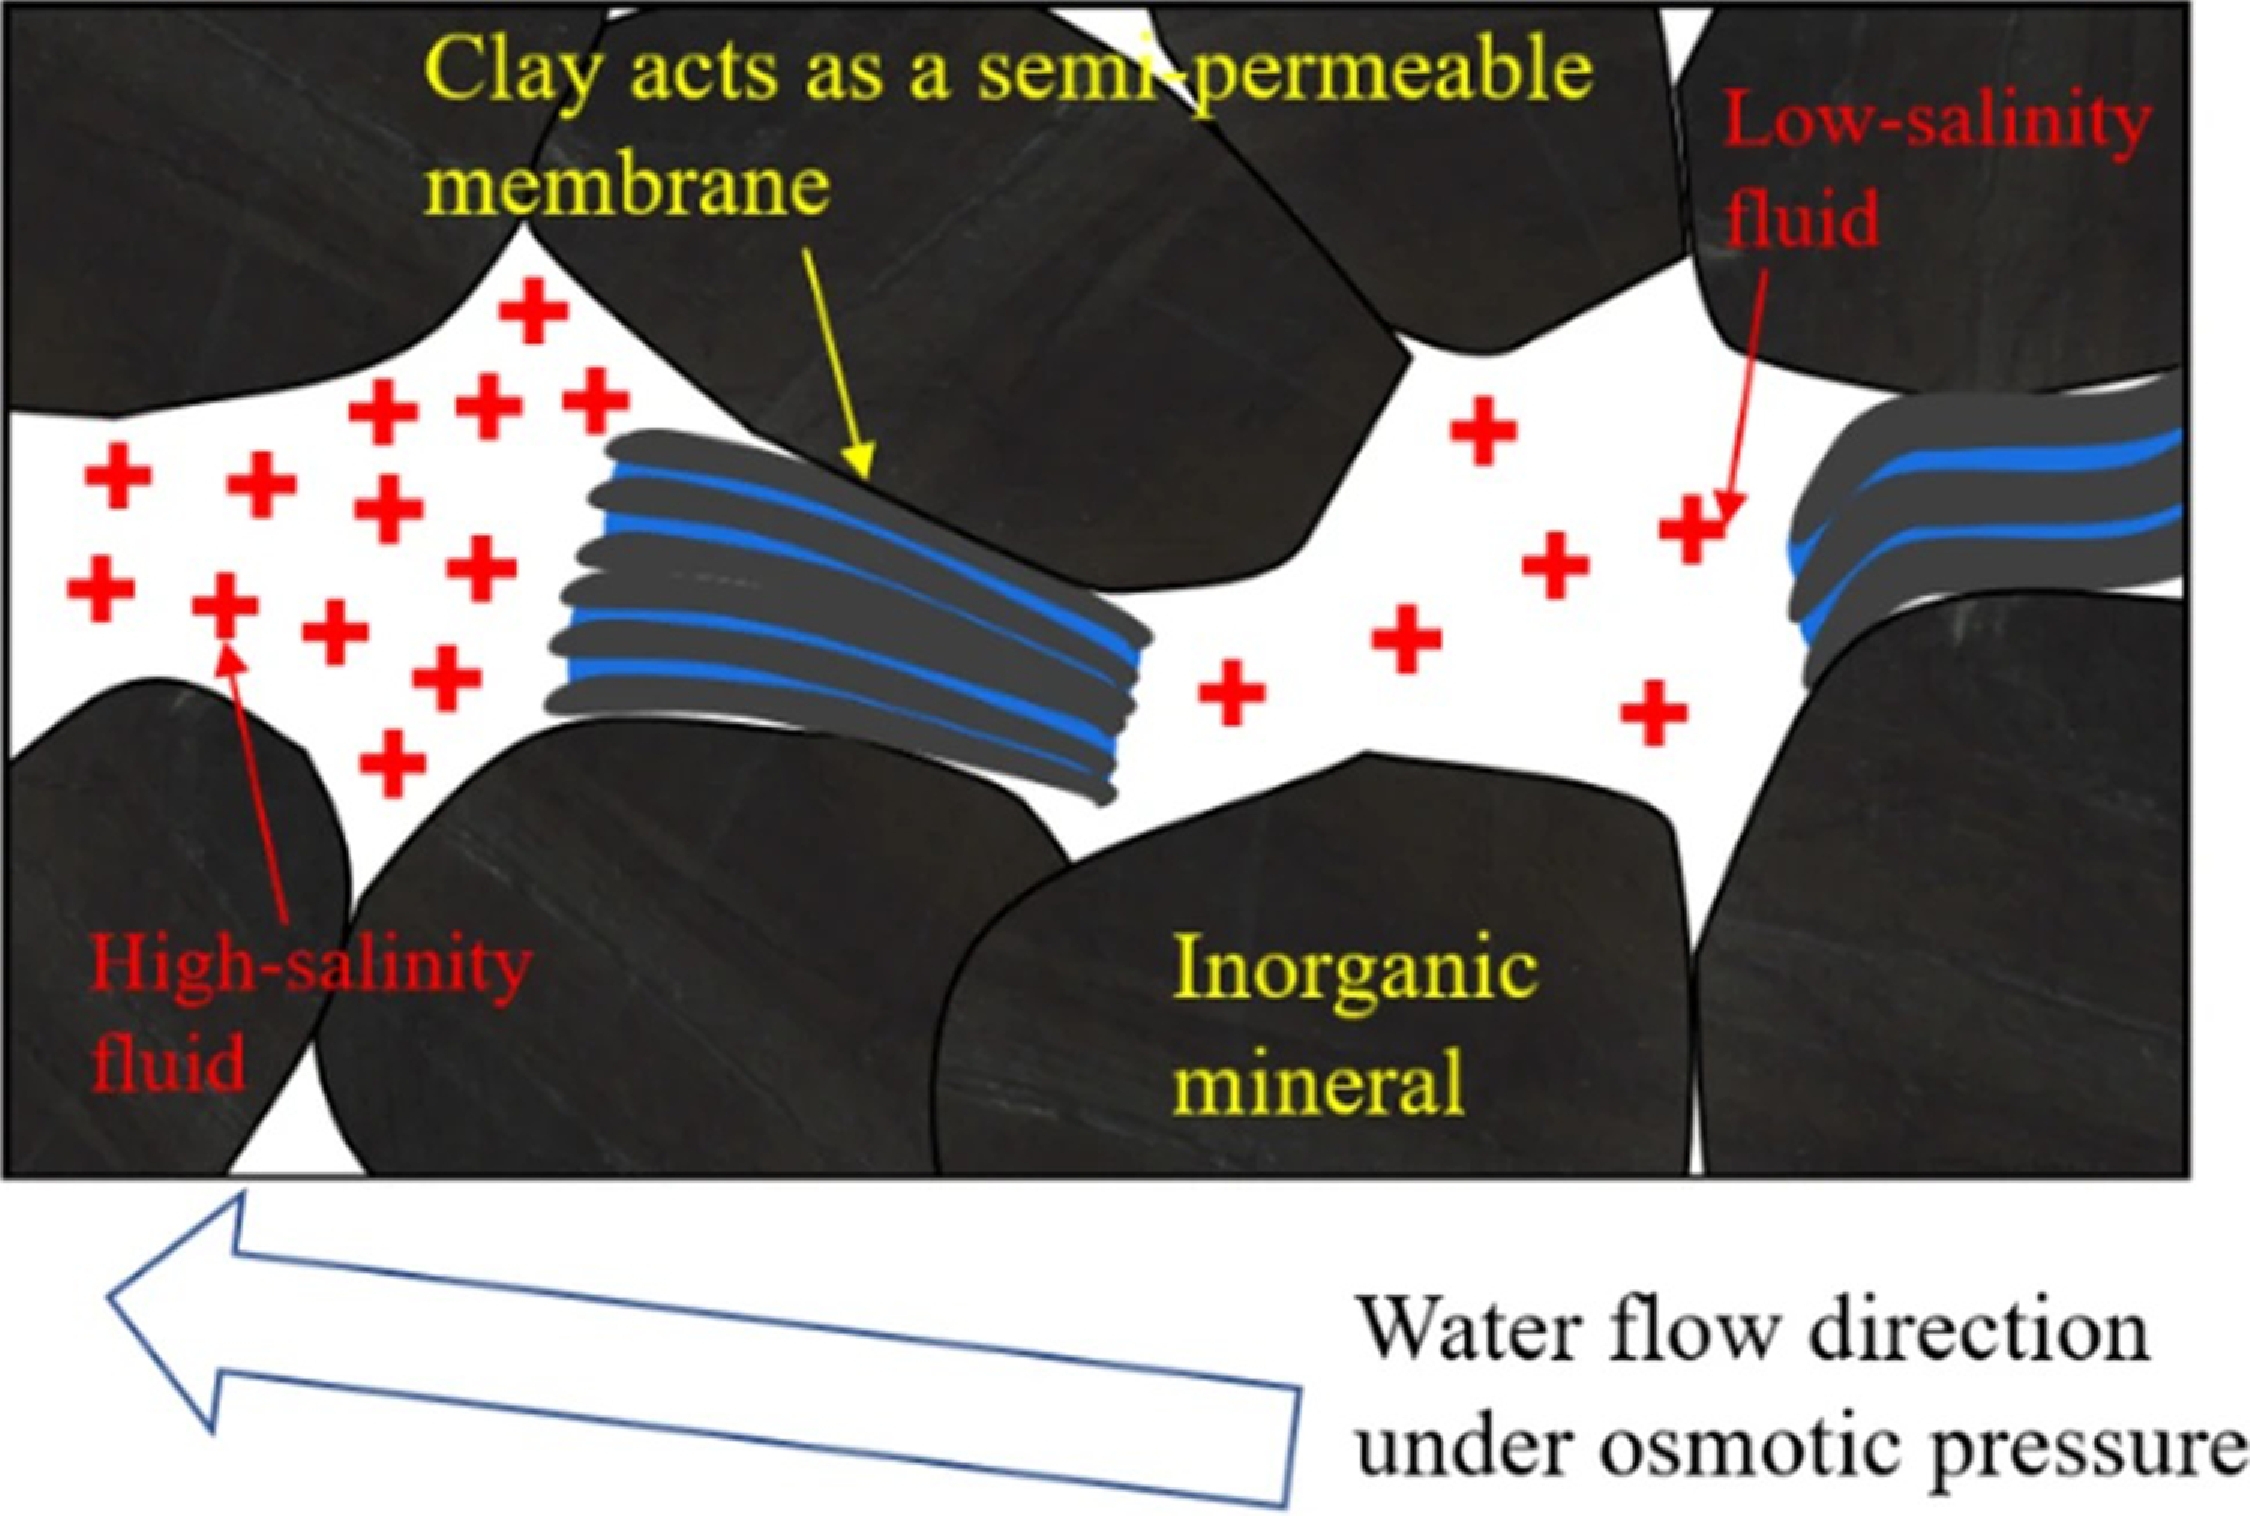
Figure 5 Long description
The diagram illustrates the process of osmotically driven water imbibition in the shale matrix. It shows low-salinity fracturing fluid interacting with high-salinity formation water. Clay minerals, interspersed among inorganic grains, function as semipermeable membranes. The resulting salinity gradient induces osmotic flux from the fracture into matrix pores. This process complements capillary forces, particularly in clay-rich formations with significant salinity contrasts.
2.2.2. Hydration kinetics of clay minerals
Beyond osmotic effects, clay hydration is a primary physicochemical driver of spontaneous imbibition (van Oort Reference van Oort1997; van Oort Reference van Oort2003). This mechanism involves water interaction with swelling clays (e.g. montmorillonite), causing interlayer expansion and structural reconfiguration. Such expansion dynamically alters pore architecture in Figure 6, driving fluid uptake while simultaneously reshaping transport pathways (Ding et al. Reference Ding, Yu, Liu, Gan, Liang and Xiong2025; Wang et al. Reference Wang, Wang, Xia, Zhao, Masoodi and Xia2025).
Two-dimensional cross-sections and three-dimensional CT reconstructions of shale samples illustrating structural modifications during clay hydration. In the two-dimensional slices of samples, labels A–D denote the expansion of fracture width, while E highlights the formation of new microfractures. The three-dimensional visualisations show the transition from the initial state to the hydrated state, reflecting the enhancement of fracture interconnectivity. The diameter of the circular field of view is 2.55 cm, providing a spatial scale for the observed fracture density.
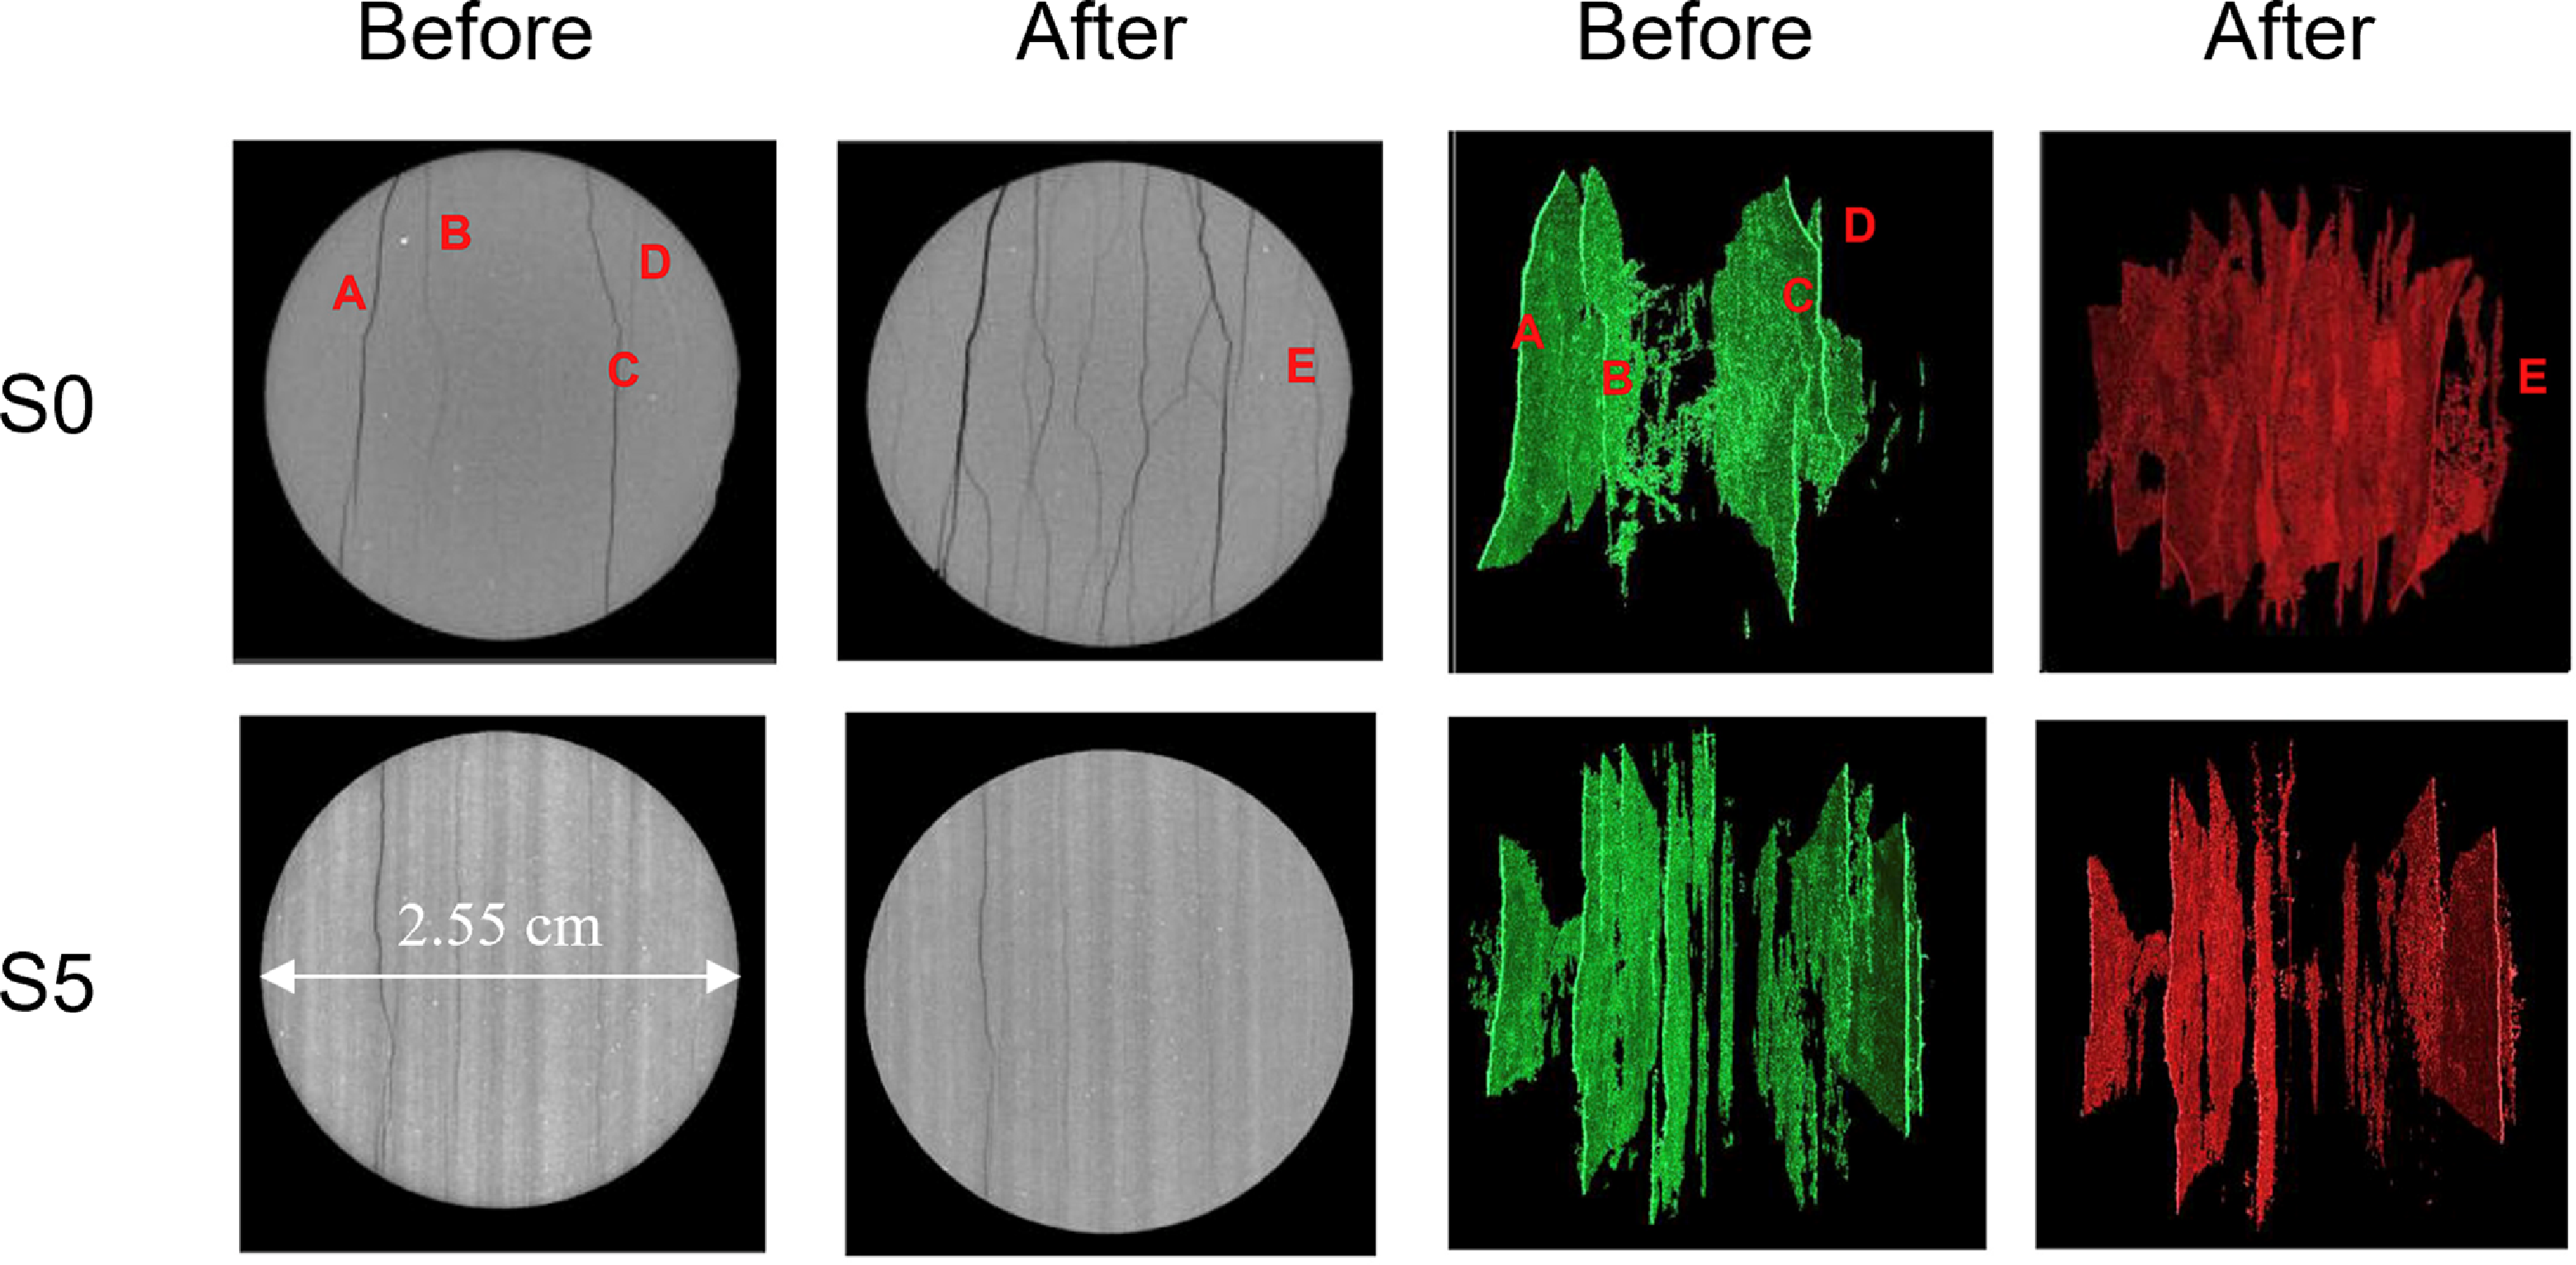
Figure 6 Long description
Two-dimensional cross-sections and three-dimensional CT reconstructions of shale samples illustrate structural modifications during clay hydration. In the two-dimensional slices of samples, labels A, B, C, D, and E denote the expansion of fracture width and the formation of new microfractures. The three-dimensional visualizations show the transition from the initial state to the hydrated state, reflecting the enhancement of fracture interconnectivity. The diameter of the circular field of view is 2.55 centimeters, providing a spatial scale for the observed fracture density.
Current literature highlights the conflicting effects of hydration on reservoir quality. Hydration-induced stress can generate microfractures, thereby enhancing connectivity and, in some instances, permeability (Dehghanpour et al. Reference Dehghanpour, Lan, Saeed, Fei and Qi2013; Ding et al. Reference Ding, Yu, Liu, Gan, Liang and Xiong2025). Conversely, excessive swelling constricts pore throats and triggers fines migration, potentially blocking pores and compromising permeability (Balaban et al. Reference Balaban, Vidal and Borges2015). Consequently, the research focus has shifted from viewing hydration merely as a wellbore stability issue to recognising its process-level significance in unconventional reservoir development.
Clay hydration has also been invoked to interpret low fracturing-fluid flowback and the potential contribution of shut-in imbibition to early-time production. Field observations and laboratory evidence suggest that some wells exhibiting low flowback can nevertheless achieve higher productivity, a phenomenon frequently attributed to shut-in-related imbibition and associated matrix–fracture interactions (Ge et al. Reference Ge, Yang, Shen, Ren, Meng, Ji and Wu2015; van Oort Reference van Oort2003; You et al. Reference You, Zhou, Kang, Yang, Cui and Cheng2019).
From a microscopic perspective, clay hydration is a multistage kinetic process rather than a single-step event, typically involving surface hydration, osmotic hydration and capillary condensation (Wang et al. Reference Wang, Wang, Xia, Zhao, Masoodi and Xia2025), as schematically illustrated in Figure 7. Surface hydration is generally the initial stage and is dominated by short-range interactions. Water molecules can adsorb directly onto hydrophilic surface sites (e.g. H+/OH− groups) via hydrogen bonding, or adsorb indirectly by forming hydration shells around exchangeable cations. This stage is commonly accompanied by an increase in interlayer spacing of the order of ∼1 nm (Rao et al. Reference Rao, Thyagaraj and Rao2013).
Schematic illustration of the multistage kinetic mechanisms involved in clay mineral hydration. (A) The non-hydrated state of clay platelets showing the distribution of exchangeable sodium cations. (B) The surface hydration stage, where water molecules adsorb onto hydrophilic sites and form hydration shells around cations, typically resulting in a discrete interlayer expansion. (C) The osmotic hydration stage, characterised by further water influx driven by concentration gradients, leading to more extensive swelling and structural reconfiguration of the clay matrix. These sequential stages collectively govern the hydration kinetics and the resulting modifications to shale transport pathways (adapted from Wysocki et al. (Reference Wysocki, Gaczo and Wysocka2018)).

Figure 7 Long description
The diagram shows three stages of clay mineral hydration. In the non-hydrated state, clay platelets display exchangeable sodium cations. During surface hydration, water molecules adsorb onto hydrophilic sites, forming hydration shells around cations and causing discrete interlayer expansion. In the osmotic hydration stage, further water influx driven by concentration gradients leads to extensive swelling and structural reconfiguration of the clay matrix. These stages collectively govern hydration kinetics and modify shale transport pathways.
As additional water enters the interlayer space and the spacing exceeds approximately 1 nm, the governing mechanism often transitions to osmotic hydration, which is controlled by longer-range electrostatic interactions. During this stage, hydrated cations redistribute and diffuse outward, promoting the development of diffuse electric double layers. Repulsive forces associated with electric-double-layer overlap further drive layer separation and swelling; under certain chemical environments and confinement conditions, this process may even induce partial delamination and dispersion of clay particles (Zhou et al. Reference Zhou, Zhang, Cheng, Jin, Ye and Wei2024). Synthesis studies suggest that, at equilibrium hydration, interlayer spacing can expand to ∼12 nm, after which external shear may further facilitate layer separation and particle dispersion. In contrast, capillary condensation refers to the accumulation of water within pores or interparticle voids driven by capillary forces, leading to the formation of liquid bridges. By modifying interparticle cementation and bonding forces, capillary condensation can regulate both swelling behaviour and permeability evolution.
In confined shale matrices, these hydration forces translate into significant mechanical stress. When the combined pore-fluid pressure and swelling stress exceed the matrix tensile strength, microfractures initiate (Dehghanpour et al. Reference Dehghanpour, Lan, Saeed, Fei and Qi2013; Wang et al. Reference Wang, Lyu and Cole2019). Thus, hydration does more than simply increase water uptake; it actively remodels the pore–fracture architecture. As demonstrated by Ding et al. (Reference Ding, Yu, Liu, Gan, Liang and Xiong2025) using nitrogen adsorption and mercury intrusion, pore structures undergo dynamic evolution during imbibition: hydration-induced damage increases pore volume, while fracture generation reduces tortuosity, creating new pathways for aqueous invasion.
Hydration kinetics therefore exert competing influences on imbibition. Mechanically, hydration-induced microfracturing enhances pore connectivity, potentially establishing a self-reinforcing cycle of water uptake and permeability enhancement (Ding et al. Reference Ding, Yu, Liu, Liang and Xiong2021; Meng et al. Reference Meng, Ge, Shen, Hu, Li, Gao, Tian and Chao2020). Conversely, excessive hydration can trigger formation damage. The migration or swelling of clays (e.g. illite, kaolinite) may constrict narrow flow channels (Wang et al. Reference Wang, Gao, Fei, Liu, Wang, Li and Liu2023). Ultimately, the macroscopic imbibition behaviour depends on the balance between fracture-enhanced permeability and swelling-induced blockage, dictated by fluid salinity and formation confinement.
2.3. Coupled dynamics
Spontaneous imbibition in shale reservoirs is a multiphysics transport process that cannot be adequately described by single-mechanism capillary models alone. It involves coupled pore-scale flow, physicochemical interactions and geomechanical responses. During post-fracturing shut-in and flowback, fluid migration is controlled by several concurrent mechanisms, including capillary suction, chemical osmosis, hydration-induced damage and multiphase flow resistance. The relative importance of these mechanisms also changes over time and across different parts of the reservoir (Wang et al. Reference Wang, Gao, Fei, Liu, Wang, Li and Liu2023; Wang et al. Reference Wang, Wang, Xia, Zhao, Masoodi and Xia2025).
2.3.1. Coupling of capillary and osmotic forces
The coupling between capillary pressure and chemical osmotic pressure provides the fundamental framework for understanding water imbibition in shale formations. The classical Young–Laplace equation captures the mechanical suction generated by curved menisci in micro- and nanopores, offering the initial driving force for fluid invasion into a dry matrix. However, significant chemical potential gradients often exist between low-salinity fracturing fluids and high-salinity formation waters. When combined with the semipermeable nature of clay-rich shale, osmotic pressure acts as a critical, non-negligible driving force for water transport (Li et al. Reference Li, Li, Wang, Li and Xu2016 a, Reference Li, Li, Wang, Li and Xu2016 b).
Studies of flowback retention have incorporated these processes into two-phase flow models driven by chemical potential gradients. These studies show that osmotic effects can strongly influence aqueous-phase flux in systems with micro- and nanoscale pore throats and large salinity contrasts. As a result, they contribute to low flowback efficiency and long-term fluid retention (Wang et al. Reference Wang, Pan and Zhang2016). Recent numerical studies indicate that neglecting solute transport leads to a systematic underestimation of imbibition volume and penetration depth. Models should therefore account for the transient decay of osmotic pressure as ion concentrations gradually equilibrate. Therefore, explicitly coupling solute diffusion equations with flow equations is crucial for accurately predicting imbibition dynamics in systems with high-salinity formation water and low-salinity fracturing fluids (Hu et al. Reference Hu, Zhao, Zhao, Wang, Zhao, Gao and Fu2020).
2.3.2. Dynamic pore-structure evolution and flow–solid coupling
The complexity of shale imbibition extends beyond the coupling of capillary and osmotic forces. It also involves fluid–solid interactions that alter the surrounding medium. Water uptake is not static. It is accompanied by continuous changes in pore architecture and wettability, which in turn modify flow pathways and hydraulic resistance. At the microscale, water adsorption and hydration on clay minerals and inorganic pore walls provide additional physicochemical driving forces. These processes also generate swelling stresses that may initiate microfractures. Classical spontaneous imbibition experiments reveal a notable discrepancy: in dry organic-rich shales, the aqueous phase imbibes much faster than the oil phase. This discrepancy cannot be fully explained by capillary scaling laws based only on viscosity and interfacial tension. Instead, it has been attributed to water adsorption and hydration-induced microfracturing, which can dynamically enhance matrix permeability (Dehghanpour et al. Reference Dehghanpour, Lan, Saeed, Fei and Qi2013).
Water adsorption and desorption behaviours in shale are highly dependent on clay content. In the early stages of imbibition, water preferentially accumulates in clay interlayers as bound water, reinforcing the idea that adsorption and hydration mechanisms are integral to the imbibition process and exert first-order control on fluid distribution (Zolfaghari et al. Reference Zolfaghari, Dehghanpour and Holyk2017). Sheng et al. (Reference Sheng2018) and Ma et al. (Reference Ma, Shen, Li, Yong, Liu and Lu2020 a, b) reported significant hysteresis between water adsorption and desorption in shale, as shown in Figure 8. Their results indicate that condensed water is more difficult to remove from smaller capillary pores than from larger ones. They also suggest that chemical interactions between water molecules and the shale surface contribute to the hysteresis loop. Subsequent experimental and numerical studies have shown that hydration-induced damage leads to time-dependent increases in pore volume and effective pore size, fostering a dynamic coupling between imbibition and pore structure evolution. Studies integrating imbibition experiments with pore structure characterisation techniques demonstrate that hydration significantly enlarges both pore volume and pore-throat radius. Dynamic imbibition models, which incorporate the temporal evolution of pore structure, driving forces and tortuosity, yield improved agreement with experimental data (Ding et al. Reference Ding, Yu, Liu, Gan, Liang and Xiong2025). Furthermore, microstructural analyses in materials science confirm that hydration can initiate new microfractures and propagate pre-existing ones, providing direct evidence for hydration-induced improvements in flow pathway conditions (Mese Reference Mese1995).
Water vapour adsorption–desorption isotherms for shale samples. The plots illustrate the relationship between water content and relative humidity. The significant hysteresis loops demonstrate that the depletion of condensed water from micropores is more difficult than from larger pores, reflecting strong chemical interactions between water molecules and the shale surface (adapted from Ma et al. (Reference Ma, Shen, Li, Yong, Liu and Lu2020 a)).
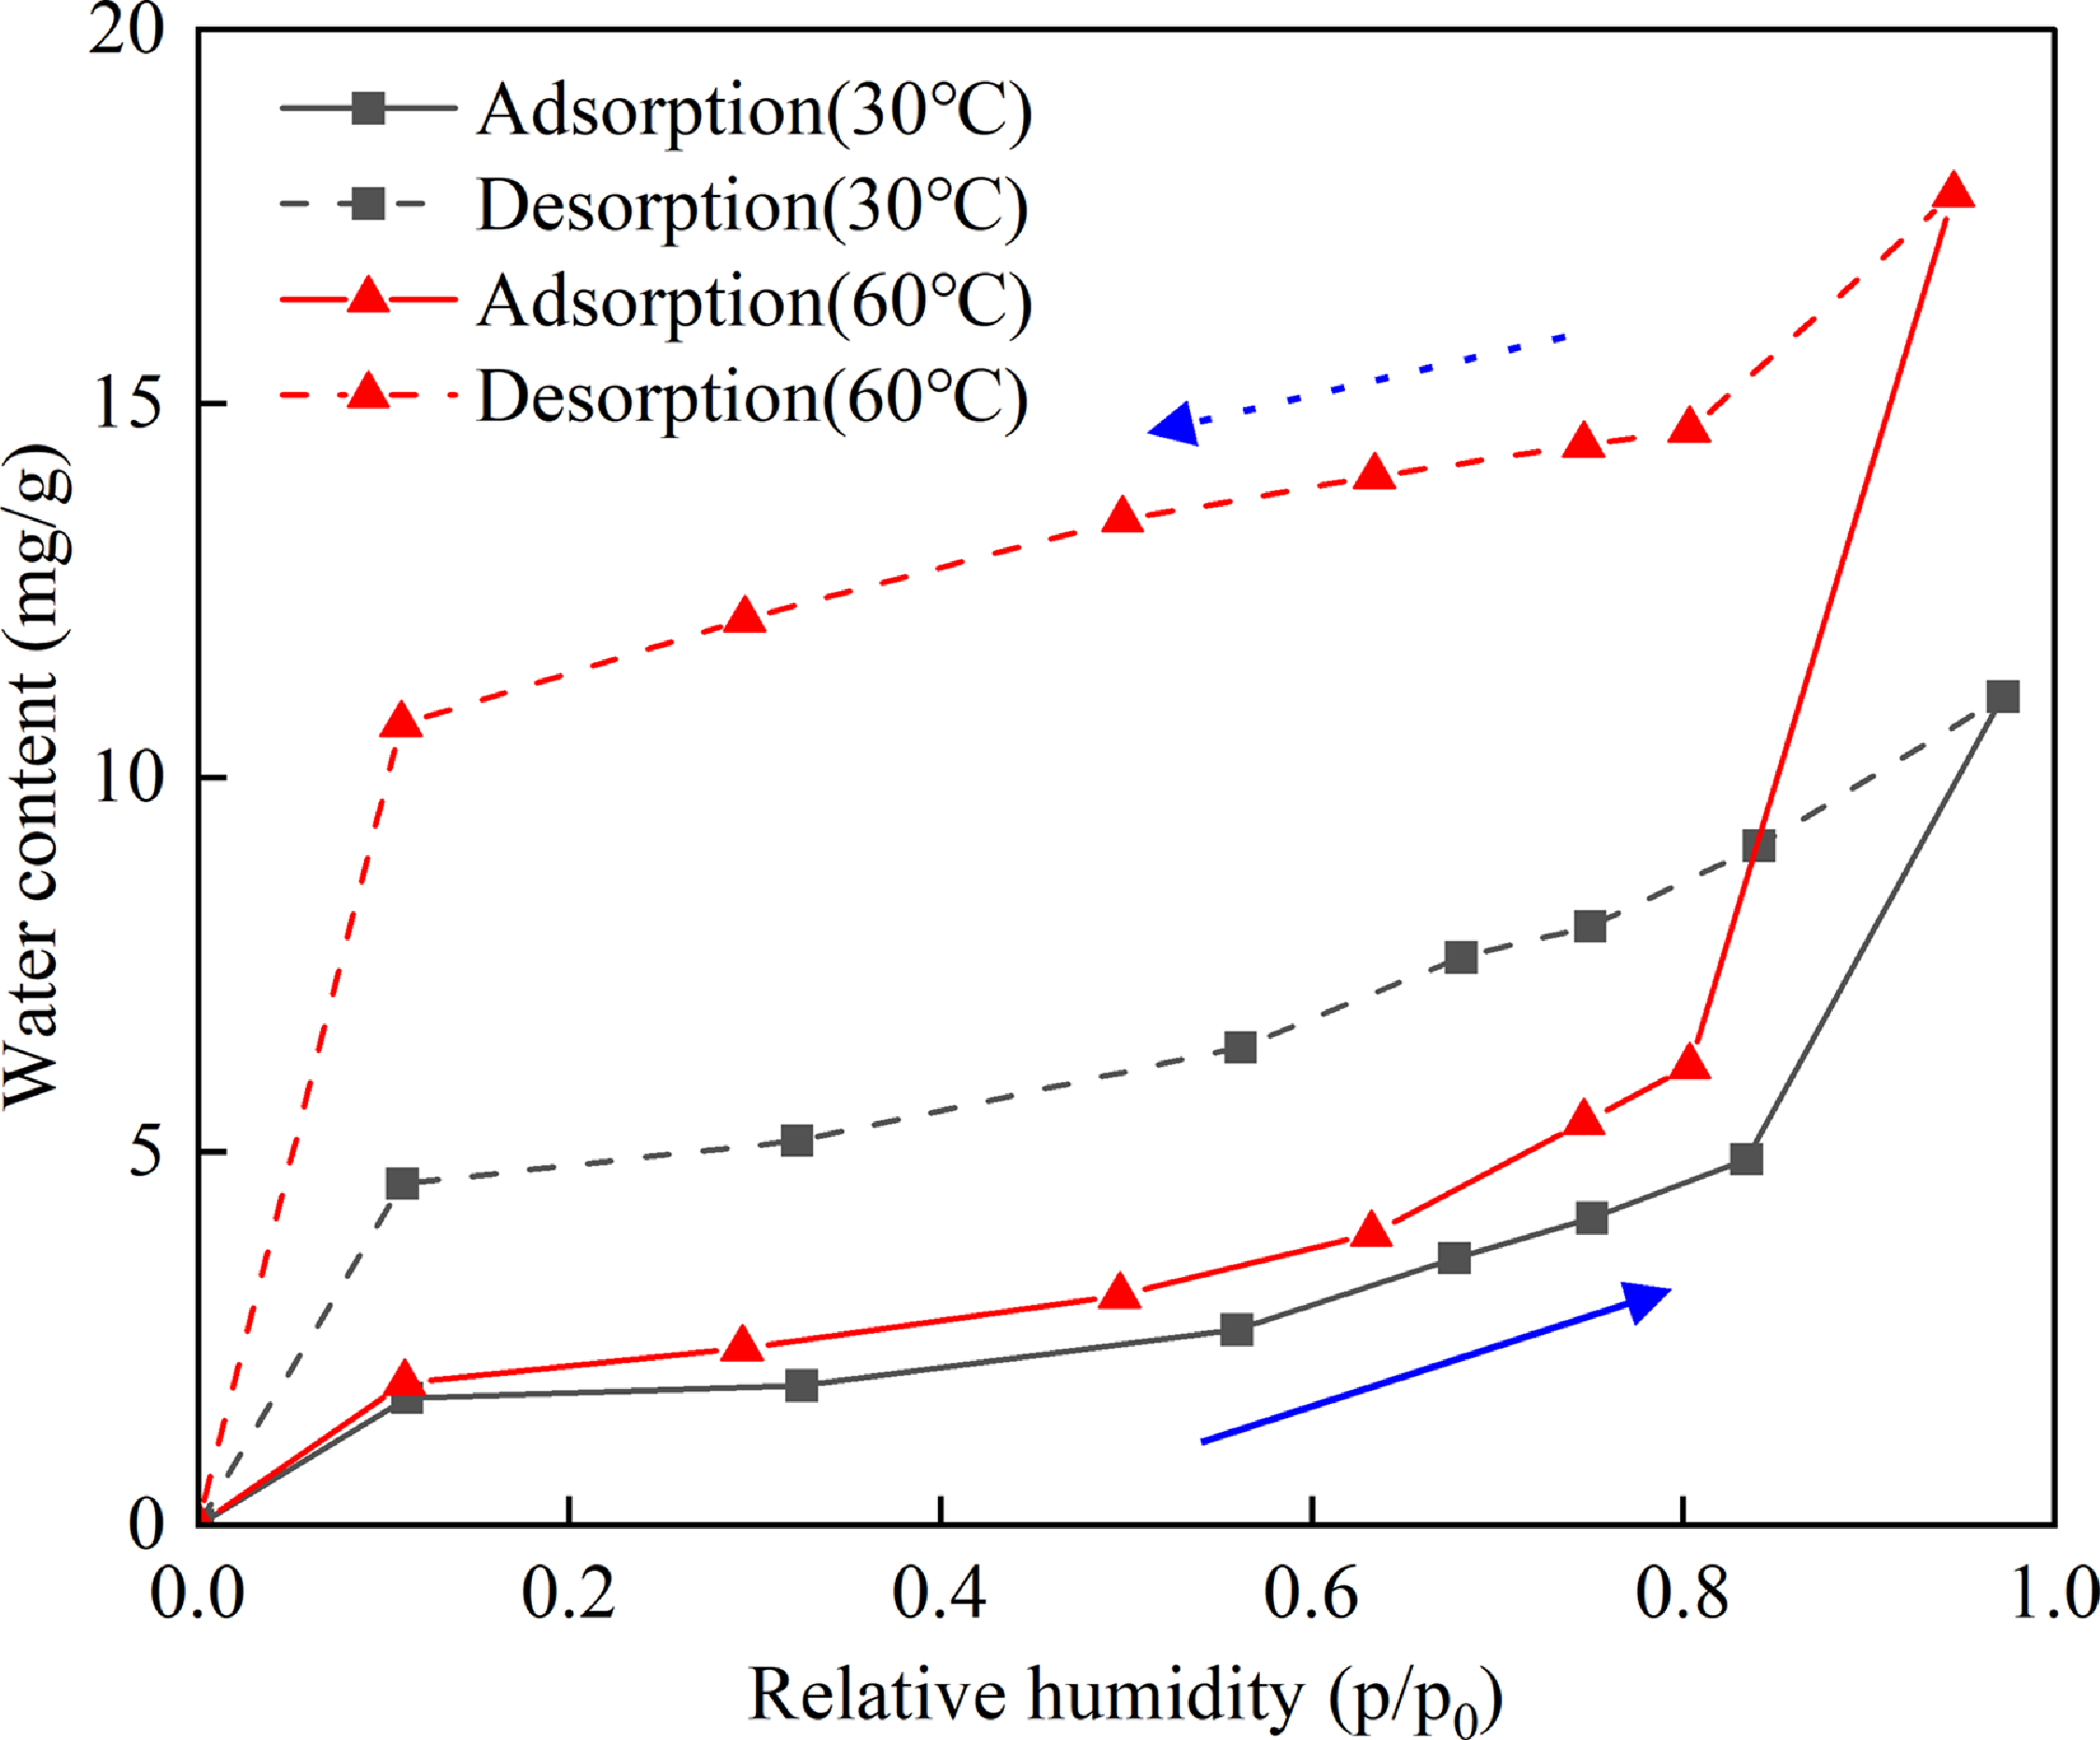
Figure 8 Long description
The line graph presents water vapor adsorption-desorption isotherms for shale samples, illustrating the relationship between water content in milligrams per gram and relative humidity. The graph includes four data lines: adsorption at 30 degrees Celsius, desorption at 30 degrees Celsius, adsorption at 60 degrees Celsius, and desorption at 60 degrees Celsius. The x-axis represents relative humidity ranging from 0.0 to 1.0, while the y-axis represents water content ranging from 0 to 20 milligrams per gram. The adsorption and desorption processes at 30 degrees Celsius are depicted with solid and dashed black lines, respectively, while those at 60 degrees Celsius are shown with solid and dashed red lines. The significant hysteresis loops indicate that the depletion of condensed water from micropores is more challenging than from larger pores, reflecting strong chemical interactions between water molecules and the shale surface. All values are approximated.
Fundamentally, spontaneous imbibition in shale is a spatiotemporal process controlled by coupled multiphysics mechanisms. In multiscale pore–fracture systems, capillary forces preferentially drive water into connected hydrophilic pore throats, whereas chemical osmotic pressure acts at interfaces under salinity gradients and semipermeable conditions. As diffusion, ion exchange, adsorption and hydration proceed, the driving forces do not remain constant. At the same time, pore restructuring can alter wettability and change whether flow pathways open or close. As a result, both flow resistance and the dominant driving mechanisms evolve continuously. This dynamic behaviour makes the system strongly nonlinear. It also indicates that imbibition, osmotic transport, adsorption-induced retention and reservoir-property evolution should be treated as an integrated system when evaluating flowback efficiency and production performance (You et al. Reference You, Zhou, Kang, Yang, Cui and Cheng2019).
3. Factors influencing water imbibition
Distinct from conventional reservoirs, shale formations exhibit high mechanical strength, compact heterogeneity, pronounced lamination and elevated organic content (Shen et al. Reference Shen, Song, Hu, Zhu and Zhu2019 b). Most shale gas is stored within micro- and nanoscale pores and microfractures in the shale matrix. After hydraulic fracturing, injected fluids invade the formation and displace the in situ gas. A thorough understanding of the factors governing fluid flow and imbibition in shale is crucial for elucidating shale transport behaviour and improving shale gas recovery. Numerous factors influence imbibition, including pore structure, pore-size distribution, wettability, types of flow spaces (organic pores, inorganic pores and microfractures), connectivity, capillary forces, mineral composition and fluid flow behaviour. This section reviews the controlling factors of shale imbibition from three perspectives: intrinsic geological factors, fluid properties and engineering conditions.
3.1. Geological factors
3.1.1. Pore-throat size distribution and connectivity
The microscopic architecture of pore throats fundamentally dictates fracturing fluid imbibition and migration pathways. Unlike conventional clastic reservoirs, shale formations exhibit distinct lamination, dense matrices and organic enrichment. Effective storage space comprises a complex combination of organic and inorganic nanopores coupled with microfractures. This classification has been widely recognised in mudrock and gas shale studies, where pore systems are commonly described in terms of interparticle, intraparticle and organic-matter-hosted pores with distinct connectivity and surface properties (Chalmers et al. Reference Chalmers, Bustin and Power2012; Loucks et al. Reference Loucks, Reed, Ruppel and Hammes2012). Multimethod studies on North American shale gas reservoirs further show that pore-size distributions and accessible porosity can vary substantially among formations such as the Barnett, Marcellus, Woodford, Haynesville and Doig shales (Clarkson et al. Reference Clarkson, Solano, Bustin, Bustin, Chalmers, He, Melnichenko, Radlinski and Blach2013; Li et al. Reference Li, Singh and Cai2019 b). Consequently, these reservoirs are defined by low porosity (typically 2 %–4 %), low permeability and pronounced heterogeneity in their pore-throat systems, which span nanometres to micrometres in broad distributions (Cai et al. Reference Cai, Jiao, Wang, He and Xia2024; Mustafa et al. Reference Mustafa, Mahmoud and Abdulraheem2019; Shen et al. Reference Shen, Song, Hu, Zhu and Zhu2019 b; Xia et al. Reference Xia, Yang, Gao, Li and Lin2021). Together, pore-throat size distribution, pore topology and connectivity define the effective fluid-accessible volume and the geometric constraints on migration (Mehrabi et al. Reference Mehrabi, Javadpour and Sepehrnoori2017). These structural parameters directly govern spontaneous imbibition efficiency. Macroscopically, permeability derived from this pore structure serves as a core determinant of imbibition kinetics. Microscopically, the heterogeneity of capillary potentials – induced by varying throat sizes – controls the preferential filling sequence and spatial fluid distribution.
In situ LF-NMR monitoring reveals a distinct filling hierarchy: under saturated conditions, stronger capillary forces drive fluids preferentially into smaller pores first, followed by gradual invasion into larger pores in Figure 9 (Meng et al. Reference Meng, Ge, Ji, Shen and Su2015). Beyond size distribution, connectivity limits the ultimate penetration depth. Research indicates that the generally poor connectivity of shale nanopores restricts fluid migration, resulting in kinetic exponents lower than those predicted by classical capillary models (Hu et al. Reference Hu, Ewing and Rowe2015). Conversely, micro-/nano-CT and NMR investigations in certain tight reservoirs identify well-connected “large-throat pathways” that act as dominant conduits for rapid mass exchange (Han et al. Reference Han, Gao and Han2015; Li, et al. Reference Li, Lu, Luo, Sun, Shen, Hu, Liu, Guan and Guo2019 a).
Temporal evolution of NMR T2 spectra during spontaneous water imbibition in shale samples. The transverse relaxation time (T2) serves as a proxy for pore size, where shorter times correspond to smaller pores. As indicated by the red dashed arrow, the signal amplitude increases as imbibition time progresses from 1 to 79 min. The initial growth of the peak at T2 < 1 ms demonstrates that smaller pores are preferentially filled due to higher capillary suction, followed by the gradual invasion of water into larger pore spaces. Each curve represents a specific measurement time as detailed in the legend (adapted from Meng et al. (Reference Meng, Ge, Ji, Shen and Su2015)).
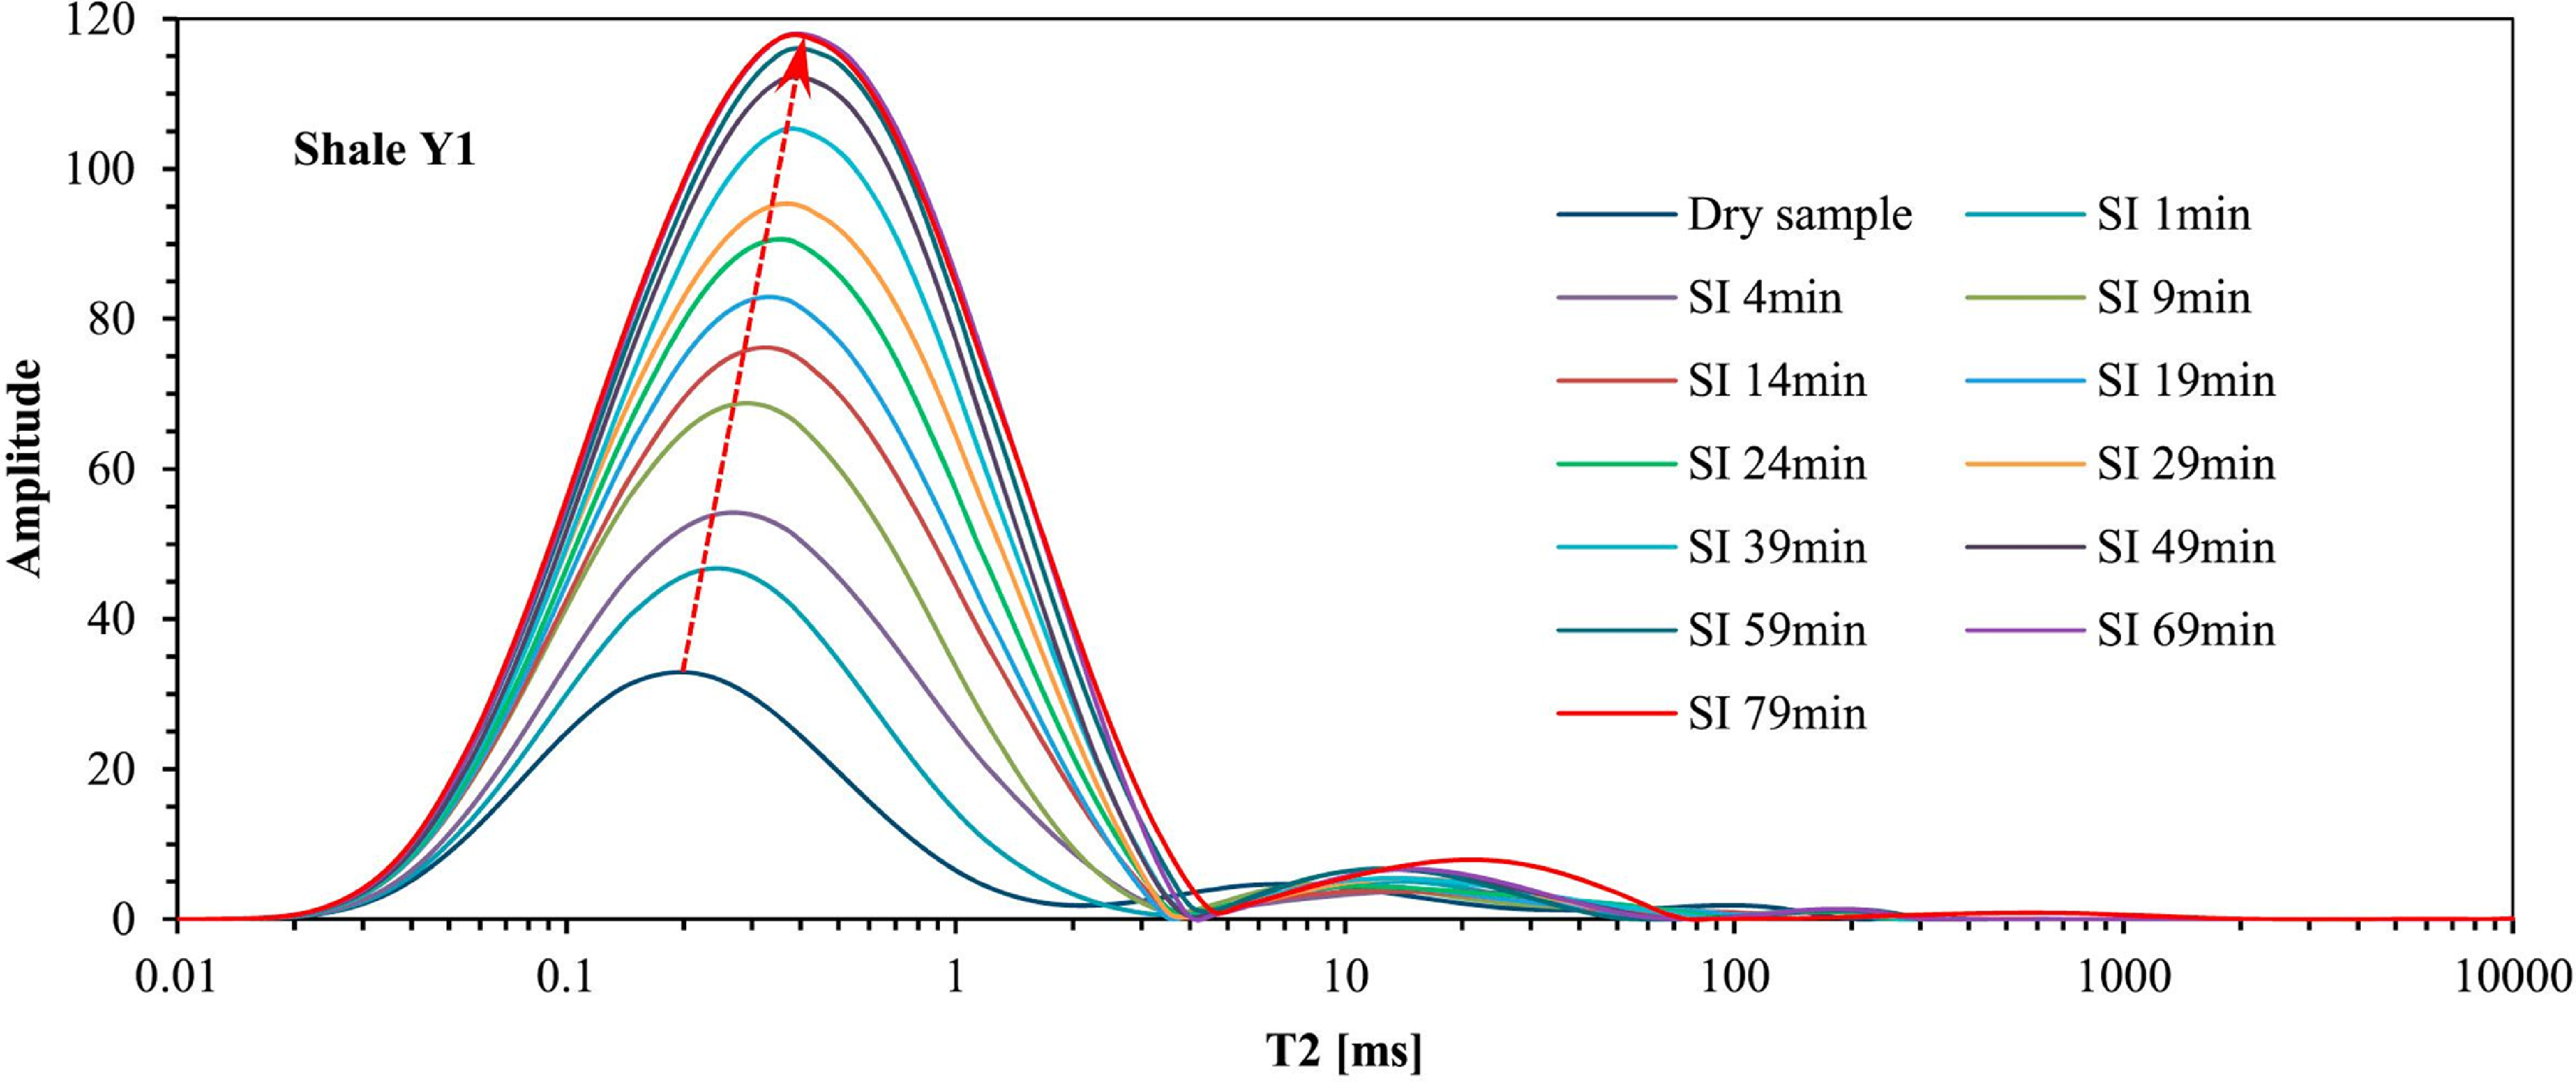
Figure 9 Long description
The line graph illustrates the temporal evolution of NMR T2 spectra during spontaneous water imbibition in a shale samples. The x-axis represents the transverse relaxation time (T2) in milliseconds, ranging from 0.01 to 10000 milliseconds. The y-axis represents the amplitude, ranging from 0 to 120. The graph includes multiple data lines, each representing a specific measurement time as detailed in the legend. The legend includes labels for a dry sample and various imbibition times ranging from 1 minute to 79 minutes. As indicated by the red dashed arrow, the signal amplitude increases as imbibition time progresses. The initial growth of the peak at T2 less than 1 millisecond demonstrates that smaller pores are preferentially filled due to higher capillary suction, followed by the gradual invasion of water into larger pore spaces. All values are approximated.
Macroscopic variability in shale imbibition behaviour is therefore not controlled solely by average pore size or bulk porosity. Instead, it reflects the interplay between a limited number of highly connected pathways and a large volume of poorly connected pore domains, whose relative contributions vary with time. Pore-throat connectivity is also not fixed. Fluid–rock interactions during imbibition can continuously modify effective flow pathways. After fracturing fluids enter the shale matrix, interactions with clay minerals may induce swelling and fines migration. These processes can constrict or block narrow throats, reduce effective connectivity, slow imbibition and impair permeability, with direct implications for engineering performance (Wang et al. Reference Wang, Gao, Fei, Liu, Wang, Li and Liu2023).
3.1.2. Mineral composition and clay content
Shale formations are typically composed of various mineral phases, including clay minerals, quartz, feldspar, calcite and pyrite. Among these, clay minerals exert a particularly strong influence on shale imbibition behaviour due to their hydrophilic surface sites, interlayer structures and pronounced water sensitivity. Clay minerals not only govern the adsorption capacity and hydration response of water molecules but also modulate imbibition dynamics by altering pore-throat geometry and flow-pathway connectivity (Loucks et al. Reference Loucks, Reed, Ruppel and Jarvie2009; Wang et al. Reference Wang, Feng, Yan and Liu2020). Both laboratory experiments and field observations consistently show a positive correlation between shale’s spontaneous imbibition capacity and its total clay content.
Experimental results further demonstrate that, as shown in Figure 10, the total volume of imbibed water generally increases with higher clay content. In clay-rich samples, the imbibed water volume can significantly exceed the pore volume inferred from measured porosity. This behaviour is attributed to the combined contributions of surface adsorption on clay minerals, interlayer hydration and associated microstructural responses, which provide water storage capacity beyond the nominal pore volume and may enhance displacement during spontaneous imbibition (Lu et al. Reference Lu, Li, Zhang, Li and Ma2021; Qian et al. Reference Qian, Li, Shen, Guo, Hu and Li2021).
Correlations between shale imbibition characteristics and total clay content. (a) Normalised imbibition capacity, defined as the ratio of average imbibed volume to nominal pore volume, as a function of clay concentration. The dashed line indicates a positive trend where imbibed volumes often exceed measured porosity in clay-rich samples. (b) Driving force coefficient versus total clay content, characterising the acceleration of imbibition rates in the presence of hydrophilic clay minerals. Different symbols (S, N, L, H, LM, LY, UY) represent various shale samples with distinct mineralogical compositions (adapted from Ge et al. (Reference Ge, Yang, Shen, Ren, Meng, Ji and Wu2015)).
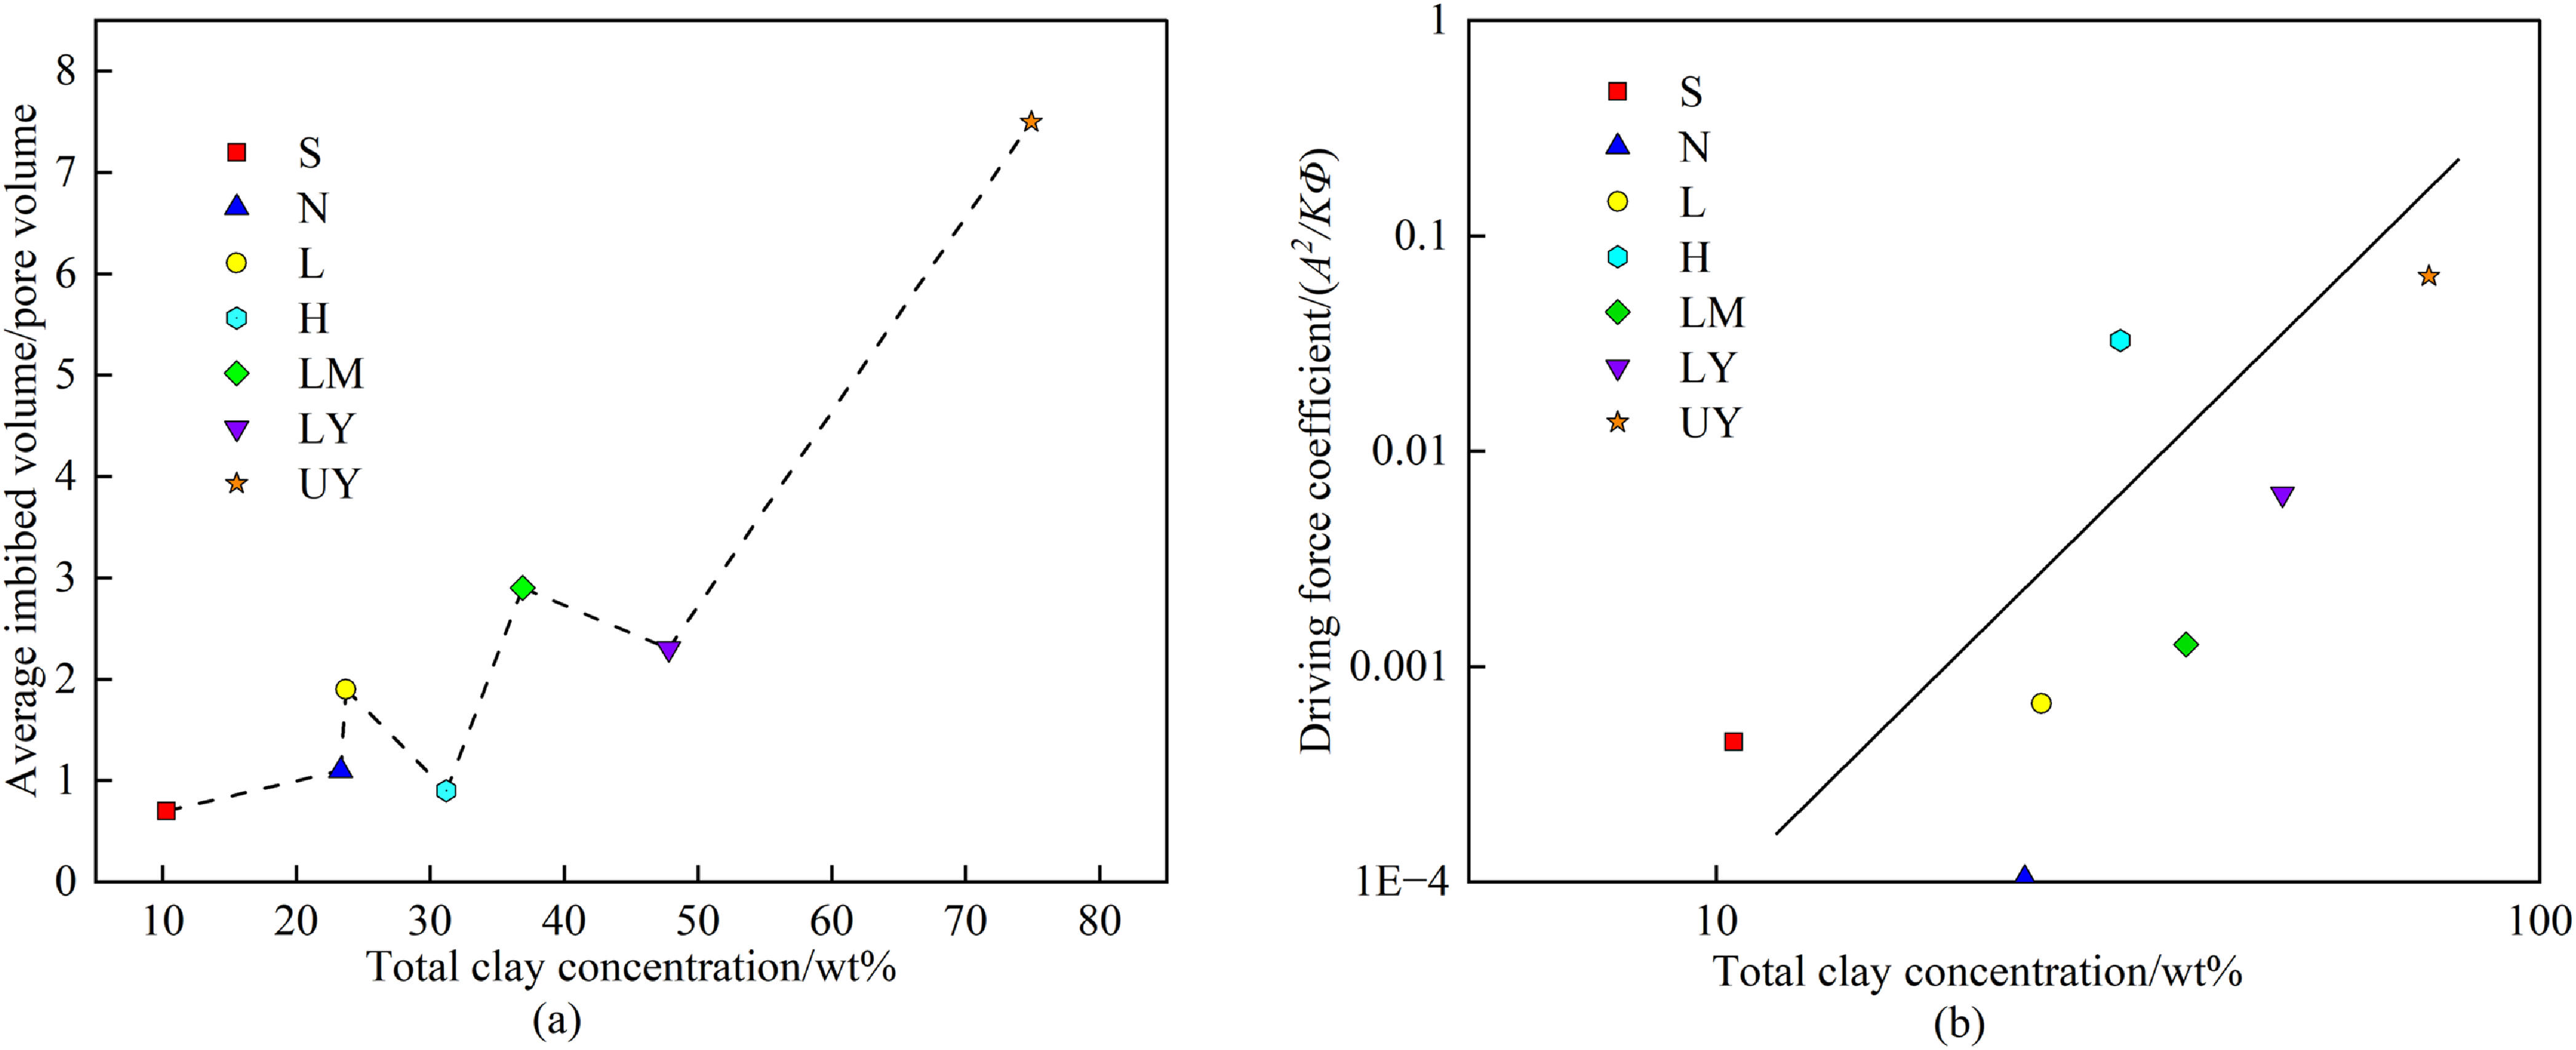
Figure 10 Long description
The image contains two graphs side by side. The first graph, a scatter plot with a dashed trend line, shows the normalized imbibition capacity as a function of clay concentration. The x-axis represents total clay concentration in weight percentage, ranging from 10 to 80. The y-axis represents the ratio of average imbibed volume to nominal pore volume, ranging from 0 to 8. Different symbols represent various shale samples with distinct mineralogical compositions. The dashed line indicates a positive trend where imbibed volumes often exceed measured porosity in clay-rich samples. The second graph, another scatter plot, shows the driving force coefficient versus total clay content. The x-axis represents total clay concentration in weight percentage, ranging from 10 to 100. The y-axis represents the driving force coefficient on a logarithmic scale, ranging from 0.0001 to 1. Different symbols represent various shale samples with distinct mineralogical compositions. The line indicates a positive correlation, characterising the acceleration of imbibition rates in the presence of hydrophilic clay minerals.
Beyond total clay abundance, different clay mineral types contribute distinctly to imbibition behaviour. Studies have shown that shale imbibition capacity and ionic diffusion rates are positively correlated with kaolinite, chlorite and illite–smectite mixed layers, which substantially enhance the water-uptake potential of the reservoir. In contrast, illite content has a limited influence on imbibition rate and diffusion behaviour (Yang et al. Reference Yang, Hu, Yi, Zhang, He, Guo, Hou and Dong2019 b). Mechanistically, these differences are due to variations in surface charge characteristics, exchangeable cations, hydration shell formation and interlayer expandability among clay minerals, which lead to distinct contributions to water adsorption, pore-throat structural response and coupled imbibition–diffusion processes.
It is important to note that the influence of clay minerals on shale imbibition is not simply linear. A critical threshold often exists. When clay content is low to moderate, hydrophilic adsorption and hydration associated with clay minerals enhance water uptake and promote imbibition. However, excessive clay content can lead to hydration-induced swelling and fines migration, causing pore-throat constriction and widespread blockage. These processes suppress imbibition advancement and may impair permeability (Cheng et al. Reference Cheng, Su, Jiang, Shan, Jin, Li, Makeen and Zhu2025; Yang et al. Reference Yang, Wang, Tao, Leng and Yang2019 a). Thus, the ultimate impact of mineral composition on imbibition behaviour results from a dynamic competition between the water uptake driving capacity of clay minerals and the opposing effects of pore-throat blockage and increased structural resistance. The former enhances imbibition capacity and expands the effective contact area, while the latter limits imbibition extent and subsequent flowback by reducing effective connectivity and increasing flow resistance.
3.1.3. Bedding, microfractures and anisotropy
The bedding structure and development of microfracture networks in shale formations are fundamental factors contributing to the pronounced anisotropy observed in fluid migration. Micro- and nanoscale pores and microfractures serve as both the primary storage space for shale gas and essential pathways for fluid flow. Microfractures, including microcracks and grain-boundary fractures, significantly enhance mass transport capacity within the otherwise tight shale matrix. The extent of bedding development and its orientation exert a direct influence on the anisotropic nature of imbibition processes.
Incorporating the effect of rock fabric on water imbibition and salt diffusion, Ghanbari and Dehghanpour (Reference Ghanbari and Dehghanpour2015) demonstrated that imbibition rates are significantly higher when the imbibition direction is aligned with the bedding planes, compared with when it is perpendicular. From a mechanistic perspective, Xu et al. (Reference Xu, Gupta and Dehghanpour2019) observed that imbibition proceeds more rapidly along bedding-parallel directions. This behaviour is largely attributed to the fact that bedding planes and associated lamination-related fractures provide more continuous flow and diffusion pathways in the parallel direction, thereby minimising geometric resistance to fluid transport, such as tortuosity and local constriction effects. Consequently, the aqueous phase propagates more rapidly along bedding planes, thus extending the imbibition-affected zone.
Building on this understanding, Wang et al. (Reference Wang, Butler, Liu and Ahmed2011) observed in counter-current oil–water imbibition experiments that new microfractures progressively developed within the shale matrix as imbibition proceeded, with their propagation directions predominantly parallel to bedding planes. These newly generated microfracture networks further connected previously isolated pore systems, thereby markedly enhancing the overall imbibition capacity of the shale samples. Subsequently, Gao and Hu (Reference Gao and Hu2016) conducted spontaneous imbibition experiments on Barnett shale samples at different burial depths, comparing imbibition along directions parallel and perpendicular to bedding. Their findings further highlighted the influence of bedding structure on imbibition dynamics and wettability characteristics. In summary, bedding and microfractures provide initial preferential flow pathways and continuously regulate shale water uptake through dynamic propagation and expansion during fluid–solid interactions. This dynamic process exerts a sustained influence on imbibition efficiency.
Contribution of capillary force and osmotic pressure to the total imbibition driving force across different NaCl concentrations. As salinity increases from 0 wt% (deionised water) to 15 wt%, the total driving force decreases from 51 to 45 MPa. This suppression is primarily driven by the reduction in the osmotic component as the salinity contrast between the fracturing fluid and formation water diminishes. Note that hatching patterns are provided to ensure the data are distinguishable in greyscale or for colour-blind readers (adapted from Ding et al. (Reference Ding, Liu, Liang, Xiong and Hou2022)).
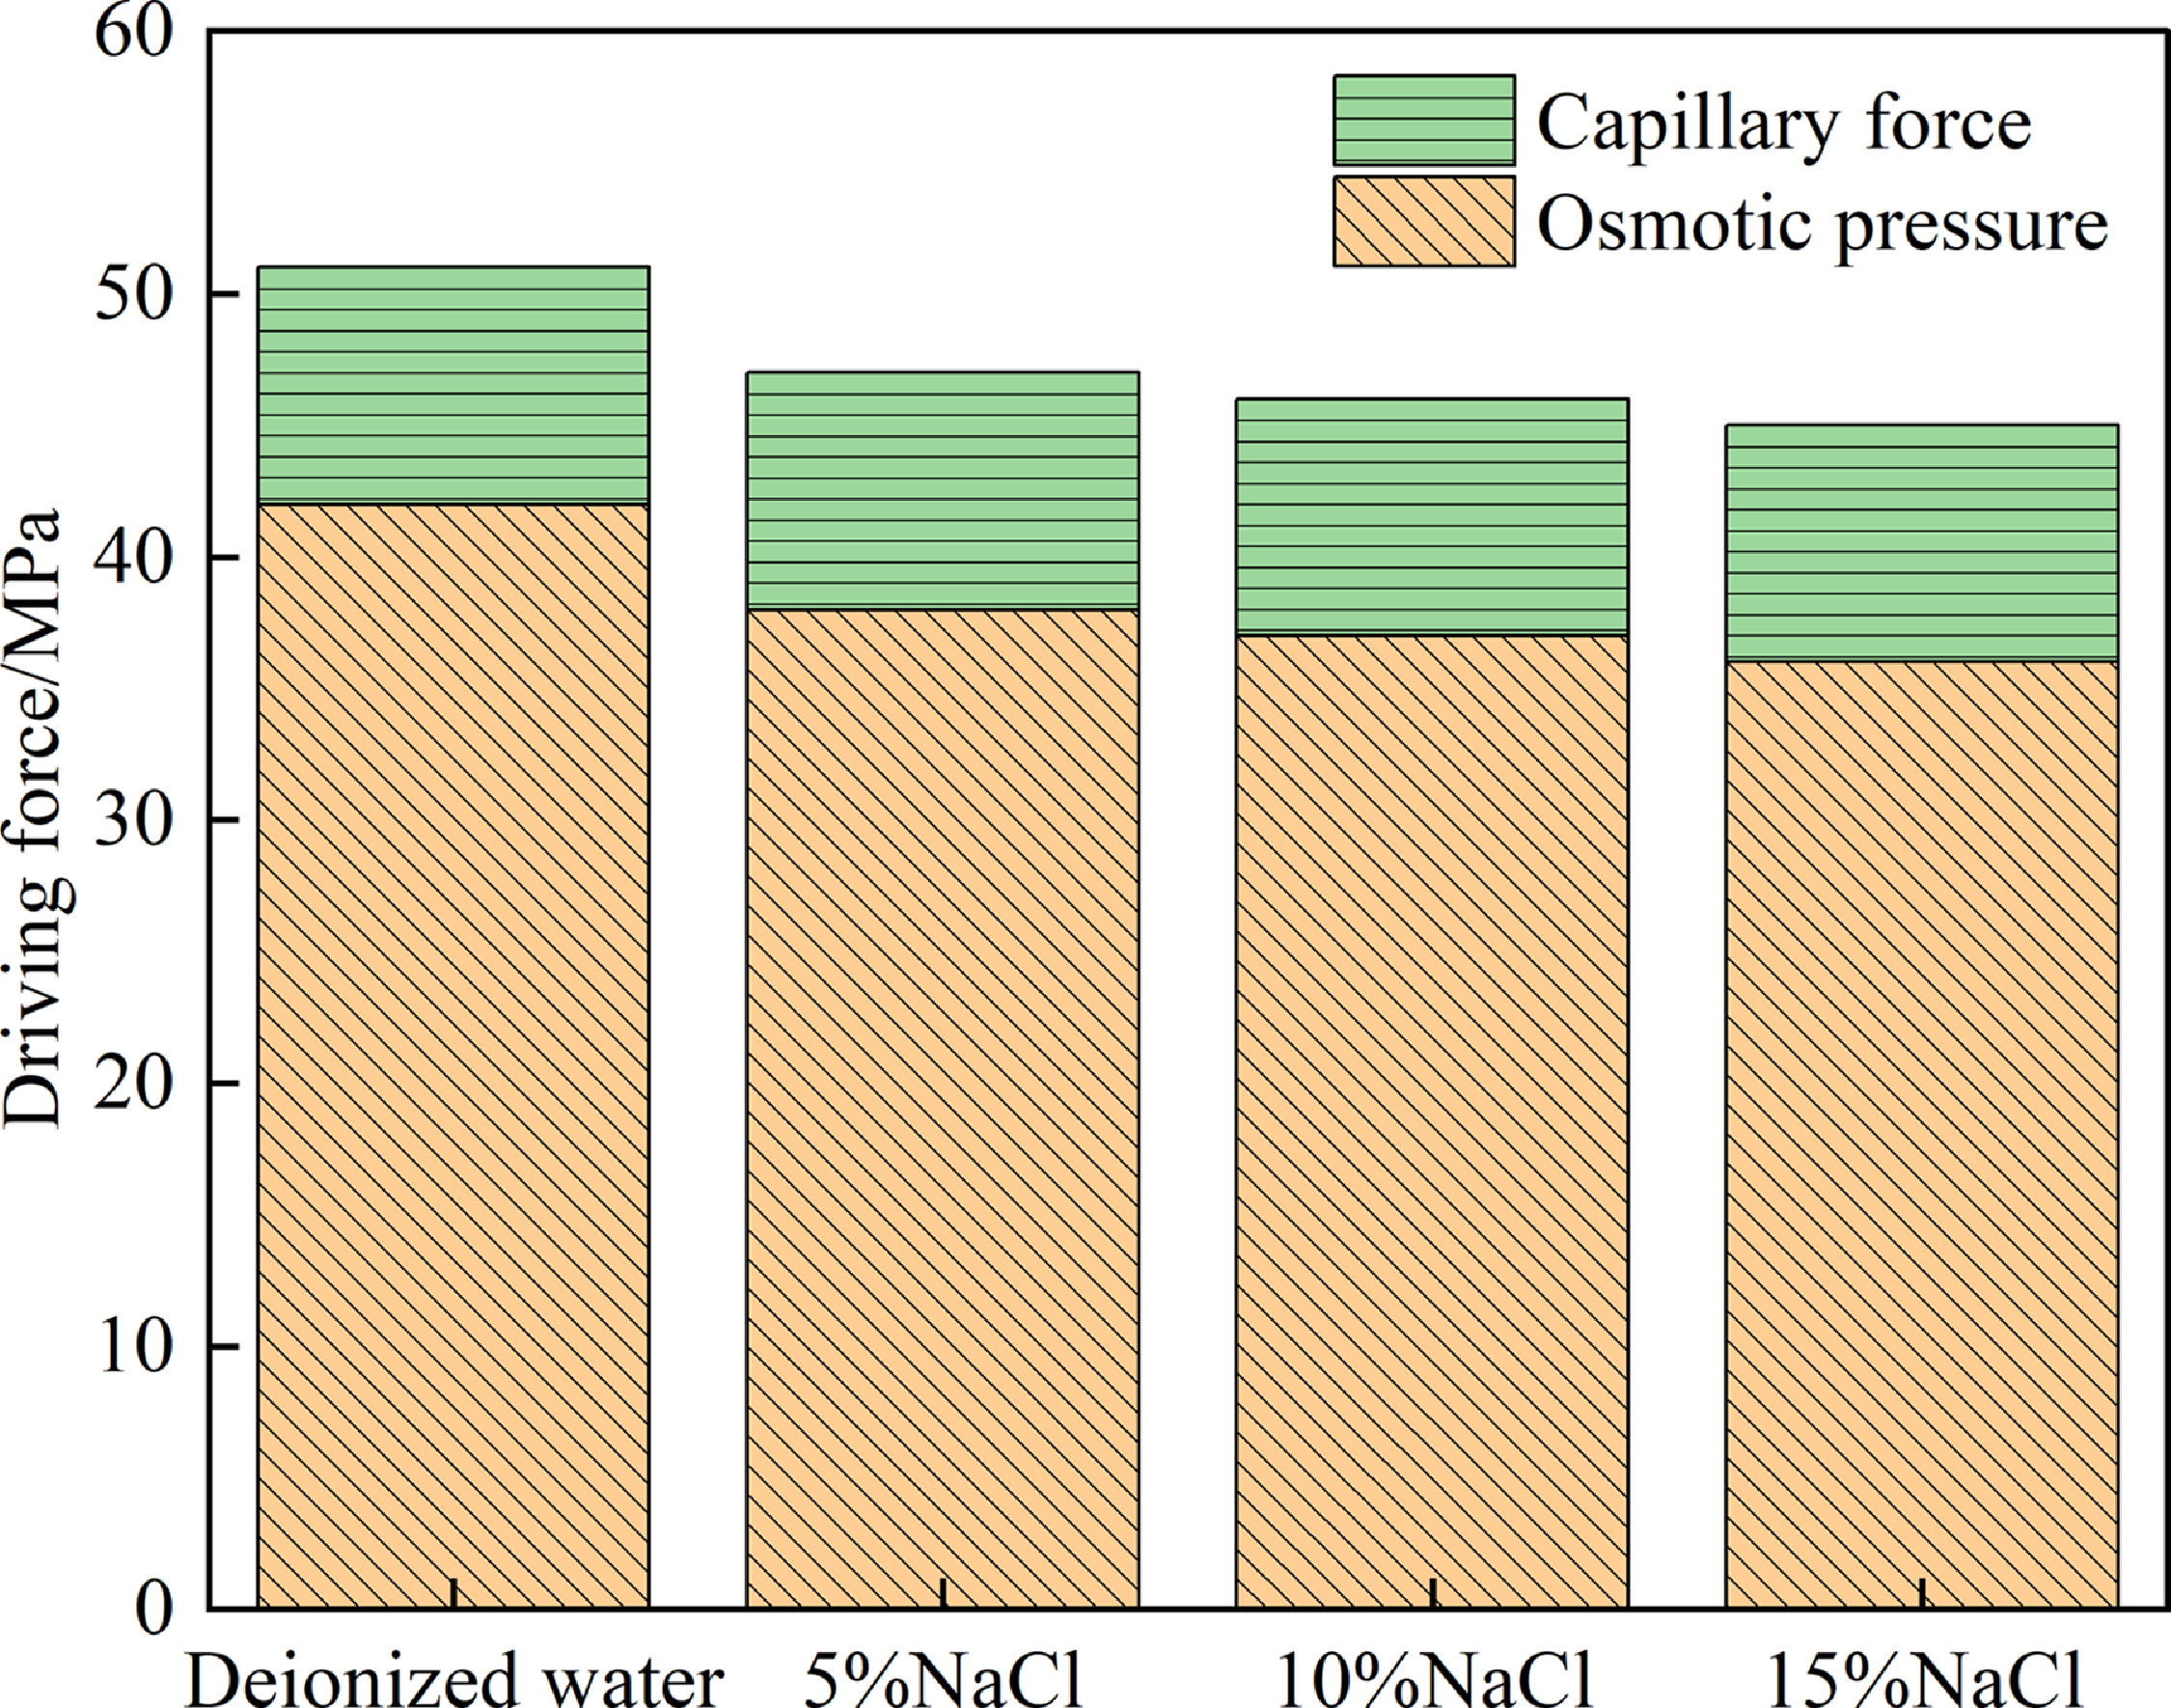
Figure 11 Long description
The bar graph compares the driving force in megapascals (MPa) across different NaCl concentrations: deionized water, 5 percentage NaCl, 10 percentage NaCl, and 15 percentage NaCl. The graph features four vertical, stacked bars. The x-axis labels the different NaCl concentrations, while the y-axis measures the driving force in MPa, ranging from 0 to 60. Each bar is divided into two segments: a green segment representing capillary force and a hatched segment representing osmotic pressure. As the NaCl concentration increases, the total driving force decreases from 51 MPa in deionized water to 45 MPa in 15 percentage NaCl. The reduction in the osmotic component is more pronounced with increasing salinity. All values are approximated.
3.2. Fluid properties
3.2.1. Salinity and ionic composition
The salinity and ionic composition of fracturing fluids are critical determinants of spontaneous imbibition in shale reservoirs, directly affecting imbibition rate, fluid uptake and hydrocarbon displacement efficiency. Wang et al. (Reference Wang, Feng, Yan and Liu2020) highlighted that imbibition in shale systems is primarily governed by the coupling of capillary forces and clay-mediated chemical osmosis. Consequently, variations in fluid salinity and ionic makeup can significantly alter the intensity and kinetics of the imbibition process.
Fakcharoenphol et al. (Reference Fakcharoenphol, Kurtoglu, Kazemi, Charoenwongsa and Wu2014) demonstrated that in fractured shale systems, osmotic pressure becomes a dominant driver when a concentration contrast exists between low-salinity fracturing fluids and high-salinity formation water. This osmotic drive enhances imbibition and promotes counter-current hydrocarbon displacement. Conversely, Ding et al. (Reference Ding, Liu, Liang, Xiong and Hou2022) and Zhu et al. (Reference Zhu, Li, Li, Li, Cao and Li2022) showed through experiments and modelling that adding salt ions to deionised water reduces water activity, thereby lowering the chemical potential, as shown in Figure 11. Macroscopically, this reduction yields lower imbibition rates and reduced imbibition extent. Phenomenologically, low-salinity systems typically exhibit stronger imbibition responses, whereas increasing salinity suppresses imbibition. Furthermore, Xu (Reference Xu2021) and Yang et al. (Reference Yang, Wang, Xu, Guo and Li2023) reported that the elevated chemical potential gradients associated with salinity contrasts correlate directly with enhanced imbibition intensity.
Beyond total salinity, the specific ionic species markedly influence imbibition behaviour. For instance, potassium chloride (KCl)-based systems consistently exhibit lower imbibition capacity compared with deionised water. Ge et al. (Reference Ge, Yang, Shen, Ren, Meng, Ji and Wu2015) indicated that KCl suppresses clay swelling and minimises microfracture generation, resulting in significantly lower fluid uptake. Xiong et al. (Reference Xiong, Chen, Liang, Xiao, Chen and Yang2020), investigating the Longmaxi Formation, observed that cationic surfactants increase the contact angle, while KCl solutions inhibit clay swelling; these combined effects significantly reduce imbibition capacity. They suggested that cations suppress clay hydration, thereby retarding imbibition rates. Similarly, related reviews note that the adsorption of cationic surfactants or inorganic ions onto rock surfaces reduces water wettability and permeability, hindering spontaneous invasion (Cao et al. Reference Cao, Deng, Xiao, Liu, Pan and Cao2023; Li et al. Reference Li, Lei, Shen, Martyushev and Hu2023). Thus, even at equivalent salinity levels, different ionic systems can drive substantial variations in imbibition capacity and displacement efficiency through mechanisms such as hydration inhibition and wettability alteration.
3.2.2. Wettability
Wettability characterises the fluid spreading tendency and interfacial affinity on rock surfaces, serving as a fundamental control on the direction, intensity and spatial selectivity of spontaneous imbibition. Shale formations, composed of mixed organic and inorganic phases, exhibit significant wettability heterogeneity, where pore networks range from oil-wet to water-wet states (Mukherjee et al. Reference Mukherjee, Dang, Rai and Sondergeld2020). These contrasts dictate macroscopic imbibition responses: the aqueous phase selectively invades hydrophilic pore domains to establish flow pathways, whereas entry into oil-wet or weakly water-wet pores is restricted, causing non-uniform advancement of the imbibition front.
Shale’s mineralogical composition inherently creates a dual-wettability system. Organic-rich regions are typically oil-wet, favouring the oil phase, while inorganic mineral matrices are hydrophilic and drive water uptake (Yassin et al. Reference Yassin, Dehghanpour, Wood and Lan2016). This spatial differentiation governs fluid entry: water spontaneously invades inorganic networks, but access to oil-wet organic pores remains substantially hindered.
Crucially, wettability determines whether capillary forces drive or impede flow. In oil-wet or weakly water-wet pores (characterised by large contact angles), capillary forces oppose fluid invasion, acting as a capillary barrier. Under these conditions, the dominant driving mechanism must shift from capillarity to clay-induced osmotic pressure to overcome this resistance. This transition highlights the critical role of osmotic effects in reservoirs with poor water wettability.
Chemical wettability modification, specifically using surfactants to shift oil-wet surfaces towards water-wet states, can significantly enhance spontaneous imbibition and oil displacement (Standnes & Austad Reference Standnes and Austad2000). Experimental studies by Sun et al. (Reference Sun, Pu, Xin and Wu2012) under high-temperature conditions demonstrated that water-wet, low-permeability cores achieved higher recovery factors than oil-wet counterparts, with surfactants improving flow and displacement performance more significantly in oil-wet systems. In contrast, numerical simulations by Sheng (Reference Sheng2018) suggested that, in shale development scenarios, simply reducing interfacial tension or aggressively altering wettability may not guarantee optimal performance. These findings indicate that the effectiveness of wettability modification must be evaluated within the context of specific reservoir conditions.
3.3. Engineering conditions
3.3.1. Confining pressure and in situ stress
Confining pressure and in situ stress are defining mechanical factors that differentiate idealised laboratory conditions from complex subsurface environments. The in situ stress state simultaneously alters shale pore structures and critically regulates the initiation of microfractures during spontaneous imbibition. While water uptake and clay swelling frequently induce microfracturing under unconfined laboratory conditions, in situ stress strongly inhibits this mechanism in realistic reservoir settings.
Mechanically, microfractures develop in the shale matrix only when the combined pore fluid pressure and hydration-induced swelling stress exceed the rock’s tensile strength. Siddiqui et al. (Reference Siddiqui, Chen, Iglauer and Roshan2019) utilised micro-CT imaging to compare rock microstructures under unconfined versus stress-constrained conditions. Their findings confirmed that the stress state fundamentally dictates pore-scale evolution. High in situ stress generally suppresses fracture initiation and aperture opening. Consequently, laboratory observations regarding hydration-induced fracturing and permeability enhancement may overstate potential field performance (Wang et al. Reference Wang, Wang, Xia, Zhao, Masoodi and Xia2025). Liu et al. (Reference Liu, Shen, Wang, Ge and Yao2019) further emphasised that the stress field magnitude controls fracture density and development, thereby acting as a primary determinant of imbibition pathway connectivity.
Beyond fracture mechanics, the pressure environment governs fluid transport kinetics. Studies on Longmaxi Formation shale indicate that environmental pressure dictates seepage efficiency. Comparative experiments at 0.1, 5 and 10 MPa demonstrated that pressurised conditions yield significantly higher seepage rates than unpressurised states, with total seepage volume scaling positively with pressure, as shown in Figure 12 (Zhu & Li Reference Zhu and Li2021). These results suggest that in engineering practice, fluid invasion efficiency is determined by the cumulative balance of formation fluid pressure, operational pressure and confining stress.
Temporal evolution of spontaneous imbibition rates in Longmaxi shale under varying pressure conditions. The plot compares the imbibition kinetics at 0.1, 5 and 10 MPa. Higher environmental pressures significantly accelerate the initial imbibition rate, although all samples exhibit a characteristic power-law decay over time.

Figure 12 Long description
The line graph illustrates the temporal evolution of spontaneous imbibition rates in Longmaxi shale under varying pressure conditions. The x-axis represents imbibition time in hours, ranging from 0 to 40 hours. The y-axis represents the imbibition rate in milliliters per hour, ranging from 0 to 0.30 milliliters per hour. Three data lines are plotted: one for 10 megapascals (black circles), one for 5 megapascals (red triangles), and one for 0.1 megapascals (blue diamonds). Higher environmental pressures significantly accelerate the initial imbibition rate, with the 10 megapascals line starting at approximately 0.30 milliliters per hour, the 5 megapascals line starting at approximately 0.20 milliliters per hour, and the 0.1 megapascals line starting at approximately 0.15 milliliters per hour. All samples exhibit a characteristic power-law decay over time, with the imbibition rate decreasing rapidly within the first 10 hours and then leveling off. All values are approximated.
3.3.2. Temperature
Temperature is a crucial engineering parameter influencing spontaneous imbibition in shale reservoirs. Variations in temperature typically affect imbibition behaviour by altering fluid viscosity, interfacial tension and the strength of interfacial interactions, leading to changes in imbibition rate and cumulative imbibed volume. Since shale imbibition involves capillary forces, interfacial effects and potentially coupled physicochemical processes operating across multiscale pore-throat systems, temperature responses observed under different experimental set-ups and boundary conditions do not always exhibit a monotonic trend.
Studies on Longmaxi Formation shale have shown that increasing temperature promotes both seepage and imbibition processes, with both imbibition rate and total imbibed volume increasing as temperature rises (Zhu & Li Reference Zhu and Li2021). Single-core experiments have indicated that elevated temperature can reduce imbibition rates and cumulative uptake, which has been attributed to temperature-induced reductions in interfacial tension (Zhang et al. Reference Zhang, Liu, Liu and Zhong2022). Consequently, temperature elevation may either enhance or suppress imbibition, depending on the specific conditions.
These contrasting observations suggest that the effects of temperature are strongly dependent on factors such as the wettability background of the rock, pore-throat structure, fluid system and experimental loading conditions. More generally, temperature often acts in conjunction with other factors, such as wettability, to jointly shape imbibition behaviour. Therefore, temperature effects on shale imbibition should be evaluated within a multifactor coupling framework rather than in isolation (Huang et al. Reference Huang, Han, Lin, Yang and Zhang2024).
3.3.3. Shut-in duration and flowback strategies
Shut-in duration and flowback strategies are critical engineering parameters that govern the extent of spontaneous imbibition of fracturing fluids and the subsequent redistribution of fluids within the formation. The shut-in period provides a crucial time window for physicochemical interactions between fracturing fluids and reservoir rocks. During this stage, wetting fluids spontaneously imbibe into the shale matrix and effectively displace hydrocarbons from micropores, thereby enhancing ultimate recovery (Bertoncello et al. Reference Bertoncello, Wallace, Blyton, Honarpour and Kabir2014, Detournay Reference Detournay2020, Dou et al. Reference Dou, Yang, Dong, Li, Wang and Hou2024). This counter-current imbibition process occurring at the fracture–matrix interface promotes gas accumulation and pressure buildup within fracture networks, which can significantly increase early-time gas production rates after well opening (Ghanbari & Dehghanpour Reference Ghanbari and Dehghanpour2016; Shen et al. Reference Shen, Li, Ma, Cai, Lu and Zhou2021).
Shut-in duration correlates directly with displacement efficiency. For water-wet shale reservoirs, numerous studies have shown that moderately extending the shut-in period is generally associated with reduced flowback efficiency and lower water production rates, with some cases exhibiting no water production after reopening. These trends are often accompanied by increased oil or gas production, indicating that sufficient relaxation time allows fracturing fluids to penetrate deeper into the matrix and be retained through imbibition, thus alleviating near-wellbore water blockage (Singh Reference Singh2016). Experimental studies by Yu & Sheng (Reference Yu and Sheng2017) further quantified this relationship, demonstrating a strong positive correlation between extended soaking or shut-in periods and recovery during huff-and-puff injection processes within a specific time window.
Beyond static shut-in control, cyclic forced imbibition and flowback strategies can influence flow behaviour by altering the reservoir microstructure. Roychaudhuri et al. (Reference Roychaudhuri, Tsotsis and Jessen2019) reported that repeated cycles of forced imbibition followed by flowback can increase shale porosity. This dynamic enhancement of reservoir properties is primarily attributed to mineral dissolution induced by fluid–rock interactions and the generation of macrofractures. Consequently, optimised flowback strategies should not be viewed solely as fluid recovery operations, but rather as engineering approaches that leverage fluid–rock interactions to progressively improve reservoir flow capacity.
4. Experimental characterisation methods for water imbibition
4.1. Dynamic monitoring techniques
4.1.1. Gravimetric and volumetric quantitative methods
Gravimetric and volumetric methods are fundamental and widely used techniques for characterising the macroscopic kinetics of spontaneous imbibition in shale. Both approaches rely on tracking the cumulative change in fluid mass or volume over time to construct water uptake versus time curves, from which macroscopic imbibition rates and saturation evolution can be inferred.
In the gravimetric method, high-precision electronic balances are used to continuously monitor mass increases in shale samples during imbibition. For experiments conducted under high-temperature and high-pressure conditions, magnetic suspension balances are often employed to enable real-time weighing in sealed environments. In contrast, the volumetric method determines imbibed fluid volume by monitoring liquid-level changes using metering pumps or precision graduated tubes. While neither method provides direct information on pore-scale fluid distribution, both are crucial for quantifying total water uptake and evaluating wettability characteristics.
Compared with the volumetric approach, the gravimetric method effectively eliminates measurement errors associated with shale swelling during water uptake and is often regarded as the benchmark technique for quantifying imbibition behaviour. Liu et al. (Reference Liu, Yang, Chu, Brownlow, Walker and Lu2025) employed an improved experimental protocol to systematically investigate the effects of bedding orientation, contact area, porosity, initial water saturation and fluid type on imbibition curves and capacity, and further evaluated imbibition-induced changes in porosity and permeability. Makhanov et al. (Reference Makhanov, Habibi, Dehghanpour and Kuru2014) recorded sample mass variations during imbibition by repeatedly measuring weight with an electronic balance at different time intervals. These measurements yielded water uptake curves, which allowed for the analysis of liquid imbibition and shut-in fluid loss in gas shale systems.
4.1.2. Nuclear magnetic resonance monitoring techniques
Nuclear magnetic resonance techniques have become important tools for investigating the microscopic mechanisms of water imbibition in shale because they are sensitive to hydrogen nuclei and non-destructive. These methods include in situ relaxation measurements, two-dimensional correlation spectroscopy and magnetic resonance imaging (MRI). In situ LF-NMR is widely used to characterise pore-size distributions by measuring transverse relaxation time (T2) spectra. Since T2 values are positively correlated with pore radius, this method can be used to distinguish fluid filling in micropores from that in larger pores or fractures, as illustrated in Figure 13.
Experimental workflow for spontaneous imbibition testing combined with LF-NMR monitoring in shale samples (adapted from Qian et al. (Reference Qian, Li, Shen, Guo, Hu and Li2021)). The shale sample is first dried, then exposed to the imbibing brine/salt solution, weighed after imbibition and finally analysed by LF-NMR to characterise water distribution and pore-filling behaviour.
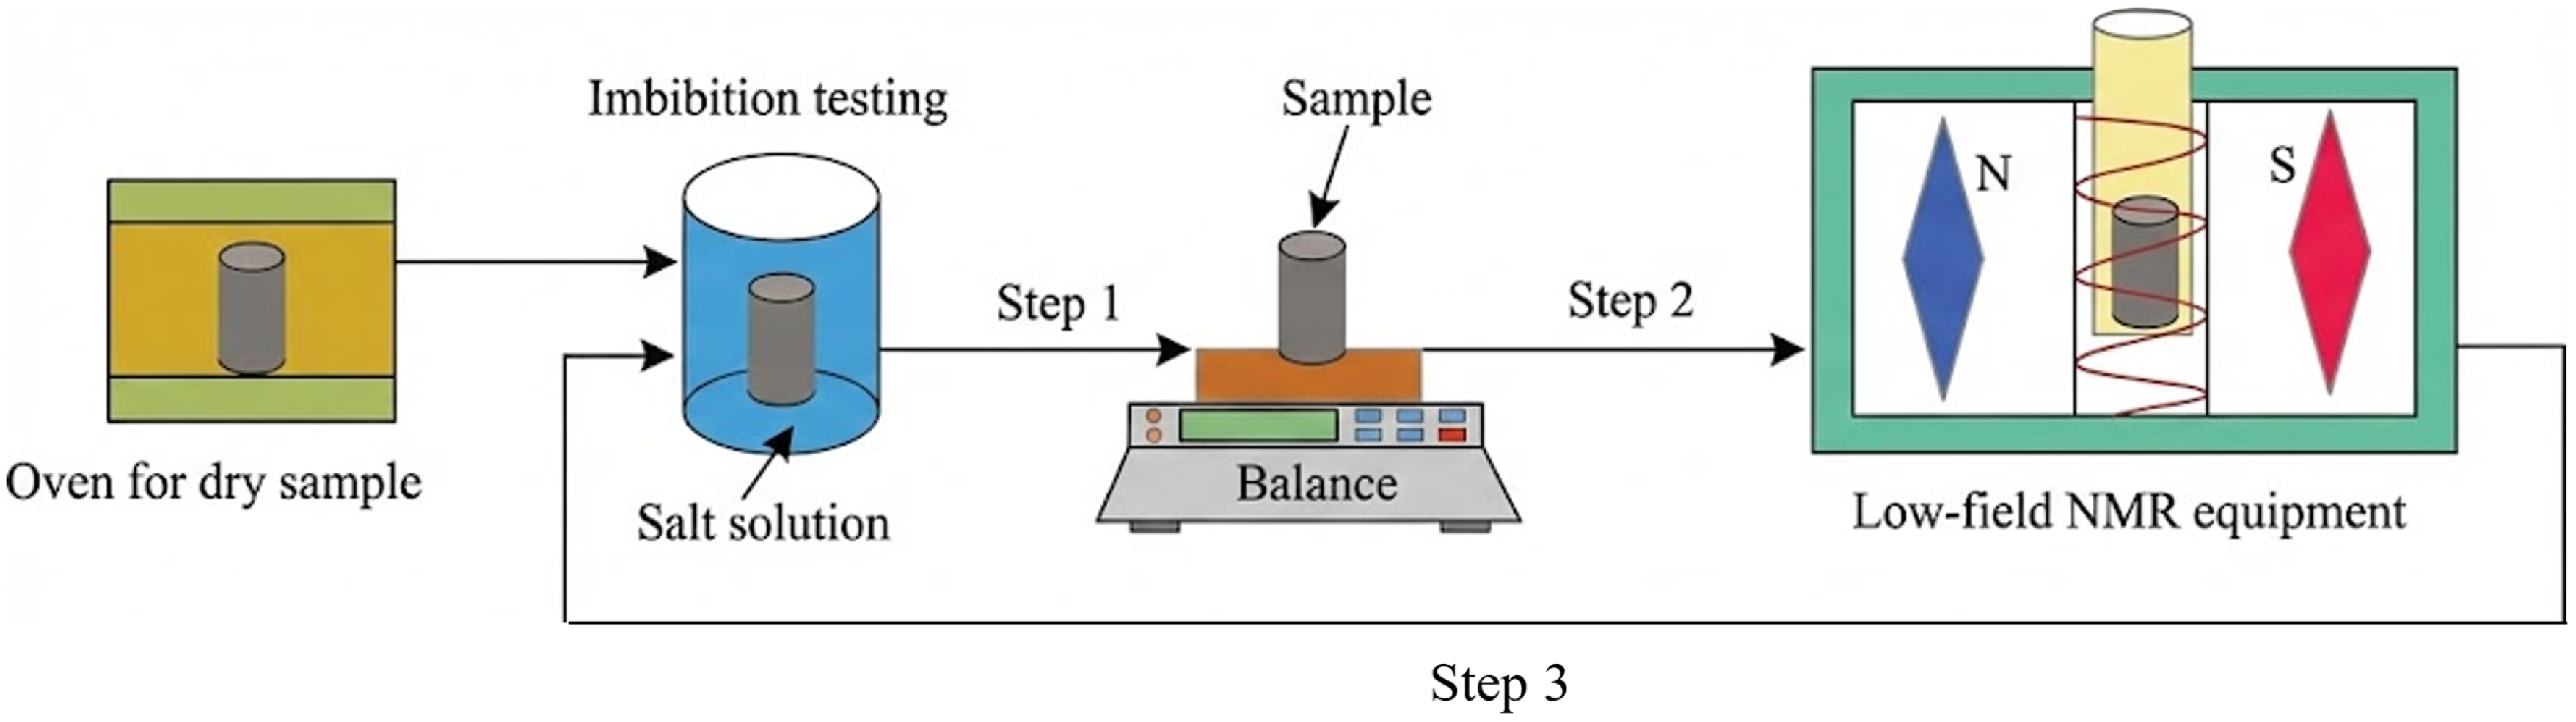
Figure 13 Long description
The diagram illustrates the experimental workflow for spontaneous imbibition testing combined with low-field nuclear magnetic resonance monitoring in shale samples. The process begins with drying the shale sample in an oven. The dried sample is then exposed to a salt solution for imbibition testing. After imbibition, the sample is weighed using a balance. Finally, the sample is analyzed using low-field nuclear magnetic resonance equipment to characterize water distribution and pore-filling behavior.
Fleury & Romero-Sarmiento (Reference Fleury and Romero-Sarmiento2016) and Kausik et al. (Reference Kausik, Fellah, Rylander, Singer, Lewis and Sinclair2016) showed that two-dimensional NMR methods based on T1–T2 correlation spectra can effectively separate immobile kerogen signals from mobile fluid signals. This capability significantly improves the accuracy of water-saturation evaluation in organic-rich shales. Their work established an important methodological basis for using multidimensional NMR to distinguish fluid occurrence states in complex shale pore systems. Building on this foundation, Zamiri et al. (Reference Zamiri, Marica, Romero-Zeron and Balcom2022) combined two-dimensional NMR relaxation correlation spectroscopy with SPRITE MRI to monitor fluid imbibition in shale. This integrated approach enabled core-plug-scale visualisation of oil and water in shale for the first time. It also distinguished fracture water from matrix pore water, thereby illustrating how bedding-scale heterogeneity controls fluid distribution.
Zhang et al. (Reference Zhang, Lu, Li, Chang, Zhang, Pang, Lin, Chen, Yin and Liu2023 b) further combined spontaneous imbibition experiments with NMR T2 analysis and T1–T2 mapping to quantify pore connectivity and its controlling factors. They showed that spontaneous imbibition tests can serve as effective proxies for connectivity assessment. In this framework, T2 spectra are used to monitor fluid invasion across different pore scales, whereas T1–T2 maps track the evolution of fluid occurrence states during imbibition. Zheng et al. (Reference Zheng, Jiang, Xiao, Zhu, Bernabé and Zhang2025) later conducted forced imbibition experiments on shale samples under different flow and confinement conditions and periodically measured NMR relaxation spectra. Their results showed that reducing effective stress enhances oil displacement driven by water imbibition, and that the displacement efficiency reaches a maximum when effective stress approaches zero and spontaneous imbibition dominates. To reduce the signal overlap between kerogen and pore water that is common in one-dimensional spectra, they further emphasised the value of two-dimensional T1–T2 NMR techniques for identifying organic matter, inorganic minerals and multiphase fluids in shale.
4.1.3. Radiation-based imaging techniques
Radiation-based imaging techniques leverage differences in neutron or X-ray attenuation as radiation penetrates rock samples to visualise fluid migration and structural evolution within shale and to enable digital reconstruction of pore–fracture systems. Neutron imaging, due to the exceptionally high attenuation cross-section of hydrogen for neutrons, offers sensitivity that far exceeds that of X-ray-based methods for detecting trace amounts of water in dense media. This makes neutron imaging particularly well suited for tracking imbibition fronts within shale matrices.
DiStefano et al. (Reference DiStefano, Cheshire, McFarlane, Kolbus, Hale, Perfect, Bilheux, Santodonato, Hussey, Jacobson, Lamanna, Bingham, Starchenko and Anovitz2017) used neutron imaging to quantify spontaneous water imbibition in Eagle Ford shale fractures with known geometries and orientations, and subsequently inverted the measured imbibition data using analytical solutions to estimate effective contact angles. Peng & Xiao (Reference Peng and Xiao2017) employed dynamic synchrotron-based micro-CT imaging to investigate multiphase oil–water spontaneous imbibition in shale samples, which allowed for the time-resolved observation of phase redistribution. Liu et al. (Reference Liu, Song, Liu, Lei and Zhu2020 a) integrated high-resolution X-ray CT scanning with microscale spontaneous imbibition experiments to quantitatively assess recovery driven by water imbibition. Through image segmentation and three-dimensional reconstruction, they provided a quantitative analysis of the pore-scale mechanisms associated with the Jamin effect. Kurotori et al. (Reference Kurotori, Murugesu, Zahasky, Vega, Druhan, Benson and Kovscek2023) combined micro-CT with clinical CT to directly track the spatiotemporal evolution of wetting-phase advancement in naturally heterogeneous shale samples across multiple scales. This multiscale approach elucidated the propagation and control mechanisms of imbibition in complex structures.
4.2. Post-imbibition property characterisation
4.2.1. Water occurrence states and fluid distribution
After the completion of imbibition, clarifying the states in which fluids are retained and their ultimate spatial distribution within pore networks is critical for evaluating water blockage and flowback efficiency. At this stage, the application of NMR techniques shifts from dynamic monitoring towards detailed discrimination of fluid occurrence states. By analysing transverse relaxation time (T2) cutoff values and T1/ T2 ratio characteristics, one can effectively identify interlayer clay-bound water, surface-adsorbed water and free pore water.
The primary advantage of this approach lies in its non-destructive quantification of water fractions associated with different binding-energy levels. By comparing changes in spectral area, peak position and spectral shape before and after imbibition, it becomes possible to distinguish pore occupancy caused by water invasion from capacity changes induced by pore or fracture expansion. This capability provides critical insight into the pore-scale mechanisms responsible for permeability impairment. Zhu et al. (Reference Zhu, Wang, You, Zhang, Gao, Zhang, Li, Wang and Cheng2023) employed NMR to compare pore-fluid responses after high-pressure soaking in different fracturing-fluid systems. This comparison allowed them to assess the impact of fluid invasion on micropore structure and reservoir damage. Ma et al. (Reference Ma, Wang, Zhou, Feng, Liu and Guo2020 b) systematically investigated T2 and T1–T2 responses of dry and water-saturated shale samples, demonstrating that signals from dry shale are closely associated with clay-structural water. They emphasised that corrections are required when using NMR to quantify pore volume or water content to avoid misinterpreting structural water as imbibed water.
Imaging-based re-scanning techniques, including neutron imaging and X-ray CT, focus primarily on revealing the spatial heterogeneity of fluids at macroscopic and mesoscopic scales. Neutron imaging enables observation of overall wetting depth and large-scale heterogeneity, whereas micro-CT provides insights into how local pore–fracture structures control wetting behaviour. Xue et al. (Reference Xue, Zhou, Jiang, Zhang, Dong and Guo2018) conducted comparative micro-CT studies on shale samples with varying water contents and demonstrated that hydration can increase both the number and aperture of fractures, and may even induce new ones. They further discussed how fracture development governs hydration intensity. These images provided direct evidence for post-imbibition structural evolution and its impact on flow properties. Peng et al. (Reference Peng, LaManna, Periwal and Shevchenko2023) proposed an integrated multiscale imaging framework combining neutron radiography, micro-CT and SEM to investigate the spatial heterogeneity of water uptake and water–oil displacement in shale matrices. Within this framework, micro-CT and SEM analyses helped clarify mechanistic controls associated with wettability and pore-size effects. Zhang et al. (Reference Zhang, Li, Yang, Liu and Wang2025) combined CT scanning with digital volume correlation to quantitatively document the evolution of fractures and weakened zones during hydration, emphasising the influence of hydration duration on fracture propagation patterns and associated mechanical degradation pathways.
4.2.2. Evolution of pore structure and connectivity
Shale formations are rich in clay minerals and are therefore highly susceptible to hydration-induced swelling, mineral dissolution and particle migration following water uptake. All these processes can lead to pronounced restructuring of pore architecture. Characterising this process demands both qualitative observation of morphological changes and quantitative assessment of the evolution of pore-size distribution and connectivity.
The SEM technique and its derivatives represent direct and widely used tools for visualising hydration-induced microstructural alterations. The SEM method employs an electron beam to scan sample surfaces and collects secondary-electron and backscattered-electron signals to obtain topographic and compositional contrast. When combined with energy-dispersive spectroscopy (EDS), SEM enables identification of mineral dissolution and precipitation, clay swelling and grain-boundary fracturing. This capability facilitates the direct recognition of hydration-induced microfractures as well as pore blockage or infilling. Typical features include pore-throat narrowing caused by clay expansion, grain-boundary opening and the formation of dissolution pits.
Gao et al. (Reference Gao, Mou, Zou, Zhang, Ma, Wang, Duan and Li2024) conducted hydration treatments on shale thin sections and cubic samples under constrained conditions and employed SEM in combination with acoustic emission monitoring to track microstructural evolution during hydration. Their observations were used to interpret the effects of hydration on breakdown pressure and fracture morphology. Dai et al. (Reference Dai, Sun, Zuo, Li, Wu, Tan, Lei, Lv and Li2025) performed comparative analyses of shale samples before and after soaking in fracturing fluids using field-emission SEM together with adsorption and mercury intrusion techniques, and reported evidence of clay infilling and pore-throat modification after soaking. These observations constitute a representative chain of evidence for pore-structure alteration following water imbibition or soaking. Qian et al. (Reference Qian, Jiang, Luo, Yang, Fu, Chen, Sun and Wang2024) further employed argon-ion polishing coupled with field-emission SEM to repeatedly observe the same locations on shale samples at different stages of water uptake. This time-lapse approach effectively captured the progressive evolution of pores and microfractures.
Gas adsorption techniques, including N2 and CO2 adsorption, offer complementary quantitative insights by measuring adsorption–desorption isotherms to derive specific surface area and pore-size distribution. Low-temperature CO2 adsorption, typically conducted at 273 K, is particularly effective for detecting micropores smaller than 2 nm, thus compensating for the diffusion limitations of N2 in the micropore regime. Zhang et al. (Reference Zhang, Li, Lai, Wu, Mao and Adenutsi2021) immersed shale samples in slickwater for varying durations and applied low-pressure nitrogen gas adsorption combined with fractal analysis to assess changes in pore-structure heterogeneity. By integrating these results with NMR measurements and contact-angle data, they revealed that clay swelling and carbonate dissolution jointly control pore-structure evolution. Li et al. (Reference Li, Ning, Li and Huang2024) and Xu et al. (Reference Xu, Lun, Wang, Zhao, Zhou, Hu, Zou and Zhang2024) advanced this understanding by incorporating low-temperature N2 and CO2 adsorption, along with high-pressure mercury intrusion porosimetry, to investigate the multiscale effects of slickwater retention. Their results showed that slickwater preferentially accumulates in macropores and mesopores, leading to pore blockage and a decline in pore-network complexity, as evidenced by changes in fractal indicators. These alterations suppress gas diffusion and ultimately reduce production efficiency. Ding et al. (Reference Ding, Yu, Liu, Gan, Liang and Xiong2025) further employed nitrogen adsorption and mercury intrusion porosimetry to derive dynamic pore parameters under hydration-induced damage conditions, providing a quantitative link between imbibition-induced structural evolution and permeability impairment.
4.3. Cross-method comparison and practical applicability
To provide a practical overview of the methods discussed above, table 1 presents a structured comparison of the principal techniques used in shale imbibition studies. The comparison is organised in terms of spatial and temporal resolution, sensitivity, sample preparation requirements, principal measurable outputs, major advantages and limitations, cost and accessibility, representative use cases and common sources of uncertainty. Such a comparison highlights that these techniques are complementary rather than interchangeable, and that method selection should be guided by the specific objective of the study, whether bulk uptake quantification, fluid-state discrimination, front tracking or post-imbibition structural characterisation.
Cross-method comparison of representative techniques used in shale imbibition studies.
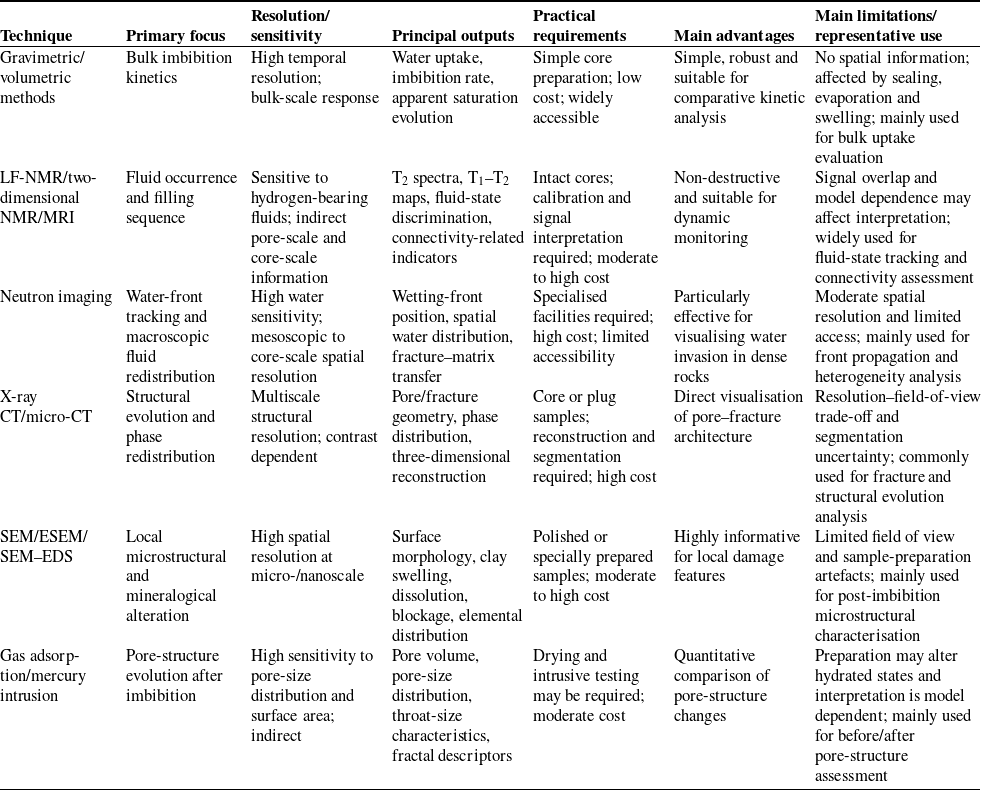
Taken together, these techniques provide complementary rather than redundant information. Gravimetric and volumetric approaches are most suitable for rapid quantification of bulk imbibition kinetics, whereas NMR-based methods are particularly valuable for non-destructive monitoring of fluid occurrence states and filling sequences. Neutron imaging and X-ray-based imaging are advantageous for tracking spatial fluid redistribution and structural heterogeneity, although they differ markedly in water sensitivity and spatial resolution. By contrast, microscopy- and porosimetry-based approaches are more suitable for post-imbibition assessment of microstructural damage and pore-throat evolution. In practical applications, uncertainties commonly arise from evaporation and sealing effects in bulk measurements, signal overlap and model dependence in NMR, contrast and segmentation limitations in imaging and sample-preparation artefacts in microscopic and adsorption-based analyses. Accordingly, a multimethod strategy is often required to achieve a reliable and internally consistent interpretation of shale imbibition dynamics and associated pore-structure evolution.
5. Theoretical models and numerical simulations
5.1. Development of theoretical models for shale imbibition
5.1.1. Classical capillary models
Early descriptions of spontaneous imbibition in porous media were primarily built upon two classical models: the Lucas–Washburn (L–W) model and the Handy model. Lucas (Reference Lucas1918) and Washburn (Reference Washburn1921) derived the relationship between imbibition length and time, establishing the Lucas–Washburn equation. As expressed in (5.1), the square of the imbibition length $l$
exhibits a linear relationship with time
$l$
exhibits a linear relationship with time $t$
:
$t$
:
 \begin{equation}l^{2}=\frac{\left(P_{A}+D g h+({2\gamma }/{r})\cos \theta \right)\left(r^{2}+4\varepsilon r\right)t}{4\eta },\end{equation}
where $r$
is the radius of a circular capillary, h is the liquid height,
$r$
is the radius of a circular capillary, h is the liquid height, $P_{A}$
denotes the external driving pressure,
$P_{A}$
denotes the external driving pressure, $\eta$
is the fluid viscosity,
$\eta$
is the fluid viscosity, $D$
is the fluid density,
$D$
is the fluid density, $\gamma$
is the surface tension,
$\gamma$
is the surface tension, $\theta$
is the contact angle and
$\theta$
is the contact angle and $\varepsilon$
represents the slip coefficient.
$\varepsilon$
represents the slip coefficient.
Handy (Reference Handy1960) further developed imbibition theory for homogeneous porous media and proposed what is now known as the Handy model. In the original formulation, the gas phase is assumed to be discontinuous during imbibition. In regions where gas is immobile, capillary pressure gradients cannot provide a driving force for gas flow. As a result, water advances through piston-like displacement, and the pressure gradient ahead of the advancing wetting front can be neglected. Combining Darcy’s law, the capillary pressure relationship and the continuity equation yields
 \begin{equation}{Q}_{w}^{2}=\left(\frac{2P_{c}k_{w}\phi A^{2}S_{w}}{\mu _{w}}\right)t,\end{equation}
where A is the capillary cross-sectional area, $\phi$
is the effective porosity,
$\phi$
is the effective porosity, $S_{w}$
is the water saturation,
$S_{w}$
is the water saturation, $k_{w}$
is the effective permeability to water,
$k_{w}$
is the effective permeability to water, $\mu _{w}$
is the water viscosity and
$\mu _{w}$
is the water viscosity and $P_{c}$
denotes the capillary pressure. To upscale from a single capillary to porous media, the capillary bundle model was subsequently introduced, idealising the rock as an assembly of parallel capillaries with different radii. A pore-size distribution function is then incorporated to represent macroscopic flow behaviour.
$P_{c}$
denotes the capillary pressure. To upscale from a single capillary to porous media, the capillary bundle model was subsequently introduced, idealising the rock as an assembly of parallel capillaries with different radii. A pore-size distribution function is then incorporated to represent macroscopic flow behaviour.
Despite their foundational role, applying these classical models directly to shale often results in substantial discrepancies between theoretical predictions and experimental observations (Li & Horne Reference Li and Horne2001; Li et al. Reference Li, Zhang, Bian, Meng and Yang2015). These mismatches stem from two inherent oversimplifications. First, geometric idealisations fail to capture shale pore systems, which feature extreme heterogeneity, high tortuosity and non-circular pore-throat morphologies (Lunati & Lee Reference Lunati and Lee2014). Second, these models neglect physicochemical interactions, treating pore walls as rigid and chemically inert. Consequently, key mechanisms relevant to shale – such as clay hydration, dynamically evolving wettability and chemical osmotic pressure – are absent. Accordingly, subsequent model developments have progressed along two distinct trajectories: (i) geometric corrections to better reflect shale pore structures and (ii) the explicit integration of coupled flow and physicochemical processes.
5.1.2. Model optimisation based on pore geometry
The Lucas–Washburn framework idealises the pore space as a straight circular capillary and typically adopts constant wettability (contact angle), interfacial tension and effective radius, resulting in the characteristic scaling $x\propto t^{0.5}$
. In shale, however, pore throats exhibit broad size distributions, non-circular cross-sections, surface roughness and tortuous pathways. Moreover, in multiphase settings and complex fracturing-fluid systems, wettability is often dynamic rather than fixed, and contact-angle evolution can substantially alter both imbibition kinetics and fluid-distribution patterns. These characteristics motivate geometry- and wettability-aware extensions of classical capillary models. Recent pore-scale studies of forced imbibition have further shown that interface curvature and pore topology strongly regulate local displacement patterns and macroscopic imbibition efficiency, highlighting the need to incorporate pore-network geometry into forced-imbibition models (Cai et al. Reference Cai, Jin, Kou, Zou, Xiao and Meng2021, Reference Cai, Qin, Wang, Xia and Zou2025).
$x\propto t^{0.5}$
. In shale, however, pore throats exhibit broad size distributions, non-circular cross-sections, surface roughness and tortuous pathways. Moreover, in multiphase settings and complex fracturing-fluid systems, wettability is often dynamic rather than fixed, and contact-angle evolution can substantially alter both imbibition kinetics and fluid-distribution patterns. These characteristics motivate geometry- and wettability-aware extensions of classical capillary models. Recent pore-scale studies of forced imbibition have further shown that interface curvature and pore topology strongly regulate local displacement patterns and macroscopic imbibition efficiency, highlighting the need to incorporate pore-network geometry into forced-imbibition models (Cai et al. Reference Cai, Jin, Kou, Zou, Xiao and Meng2021, Reference Cai, Qin, Wang, Xia and Zou2025).
Conceptual model of wetting-phase imbibition in a tortuous capillary with variable cross-sectional geometry (adapted from Tan et al. (Reference Tan, Peng, Li and Deng2025)). The capillary is discretised into sections with variable cross-sectional geometry. Pore A and pore B denote enlarged pore bodies, while sections 1 to n represent constricted or variable-width segments. The advancing interface separates the wetting phase from the non-wetting phase.
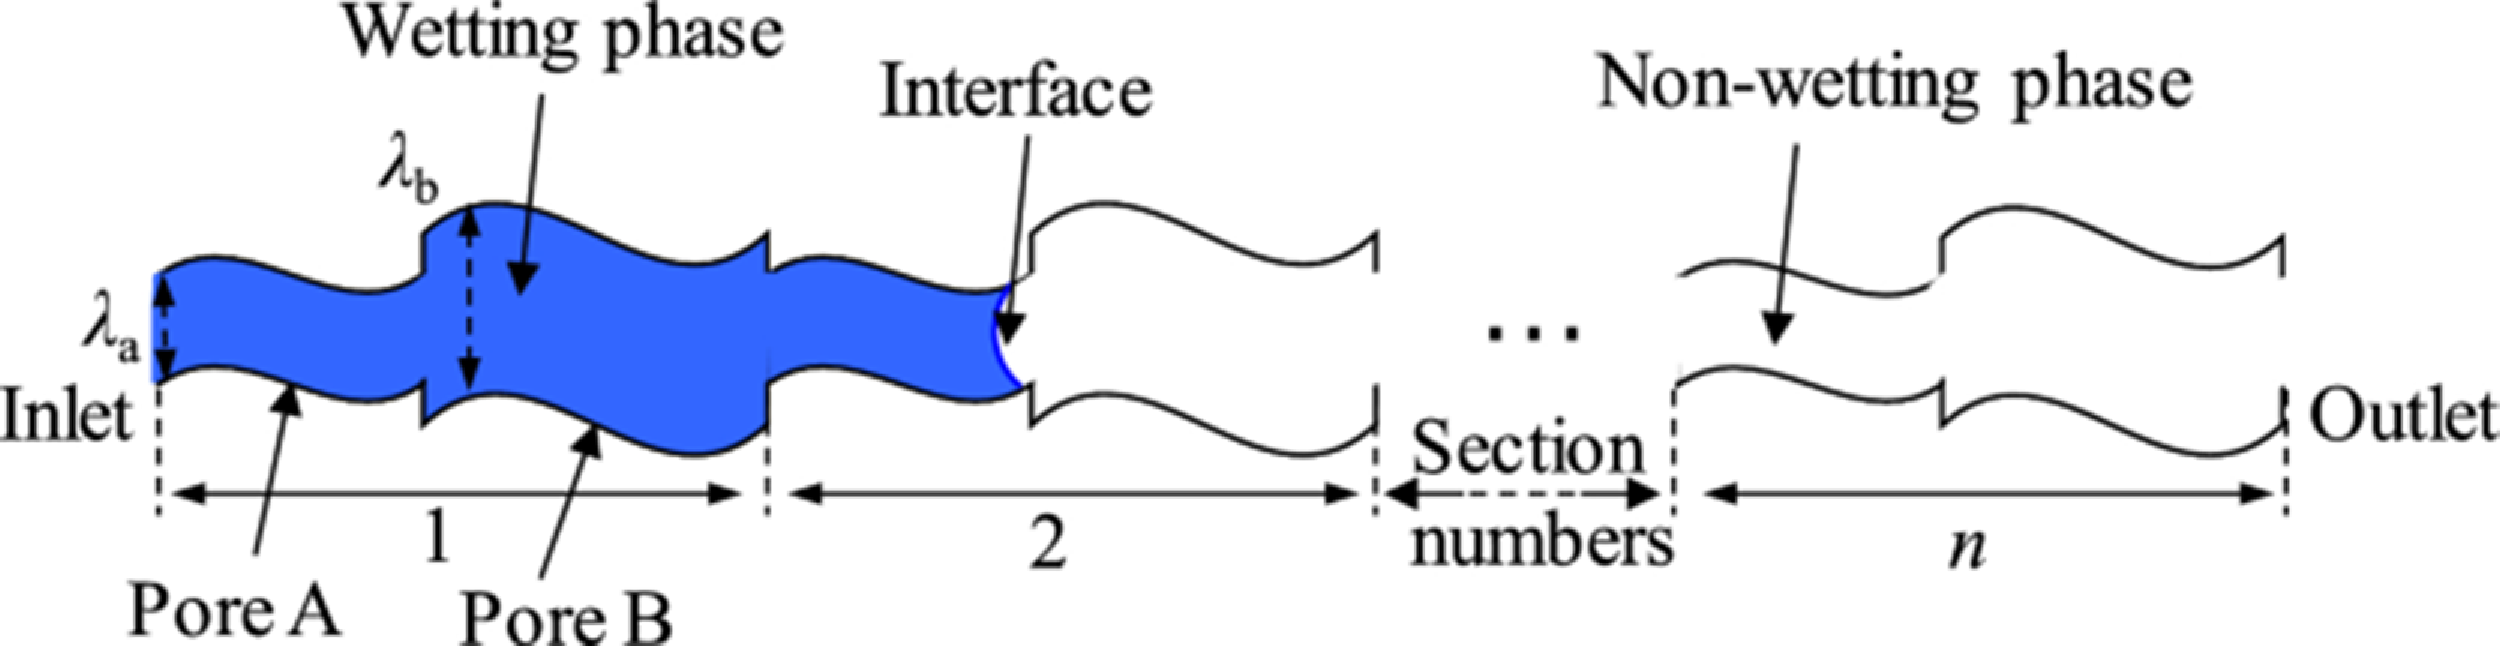
Figure 14 Long description
The diagram illustrates a tortuous capillary divided into sections with varying cross-sectional geometry. Pore A and Pore B are enlarged pore bodies, while sections 1 to n represent constricted or variable-width segments. The wetting phase, depicted in blue, occupies the left side of the capillary, while the non-wetting phase is on the right. The interface between these phases is marked by a wavy line, indicating the advancing front of the wetting phase. The capillary sections are labeled with section numbers, and the flow direction is from the inlet to the outlet.
Recent model optimisations have largely progressed along two complementary directions. The first introduces dynamic contact angles (or dynamic wettability) into the governing equations so that capillary driving forces evolve with interfacial velocity. This modification corrects the bias associated with assuming constant wettability. Within a two-phase capillary-imbibition framework, Zhang et al. (Reference Zhang, Ping, Tang, Kang, Imani, Yang, Sun, Zhong, Yao and Fan2023 a) incorporated velocity-dependent contact angles and showed, through comparison with experiments and numerical results, that dynamic wettability can change the distance–time relation and produce stage-dependent imbibition behaviour. This finding indicates that constant-contact-angle assumptions are generally inadequate for shale systems.
The second direction accounts explicitly for non-ideal geometries by embedding cross-sectional irregularity and tortuosity into viscous-resistance terms or equivalent permeability expressions. This approach captures the influence of pore-throat morphology on local pressure drop and front evolution. Tan et al. (Reference Tan, Peng, Li and Deng2025) extended capillary-imbibition descriptions to tortuous capillaries with variable cross-sectional areas and coupled gravitational and viscous effects as shown in Figure 14. Their results demonstrate that realistic geometry modifies the effective resistance scaling and can yield imbibition dynamics that deviates markedly from classical Lucas–Washburn predictions.
Schematic illustration of the multiphysics driving forces involved in core-scale forced imbibition (adapted from Li et al. (Reference Li, Su, Wang and Sun2022)).
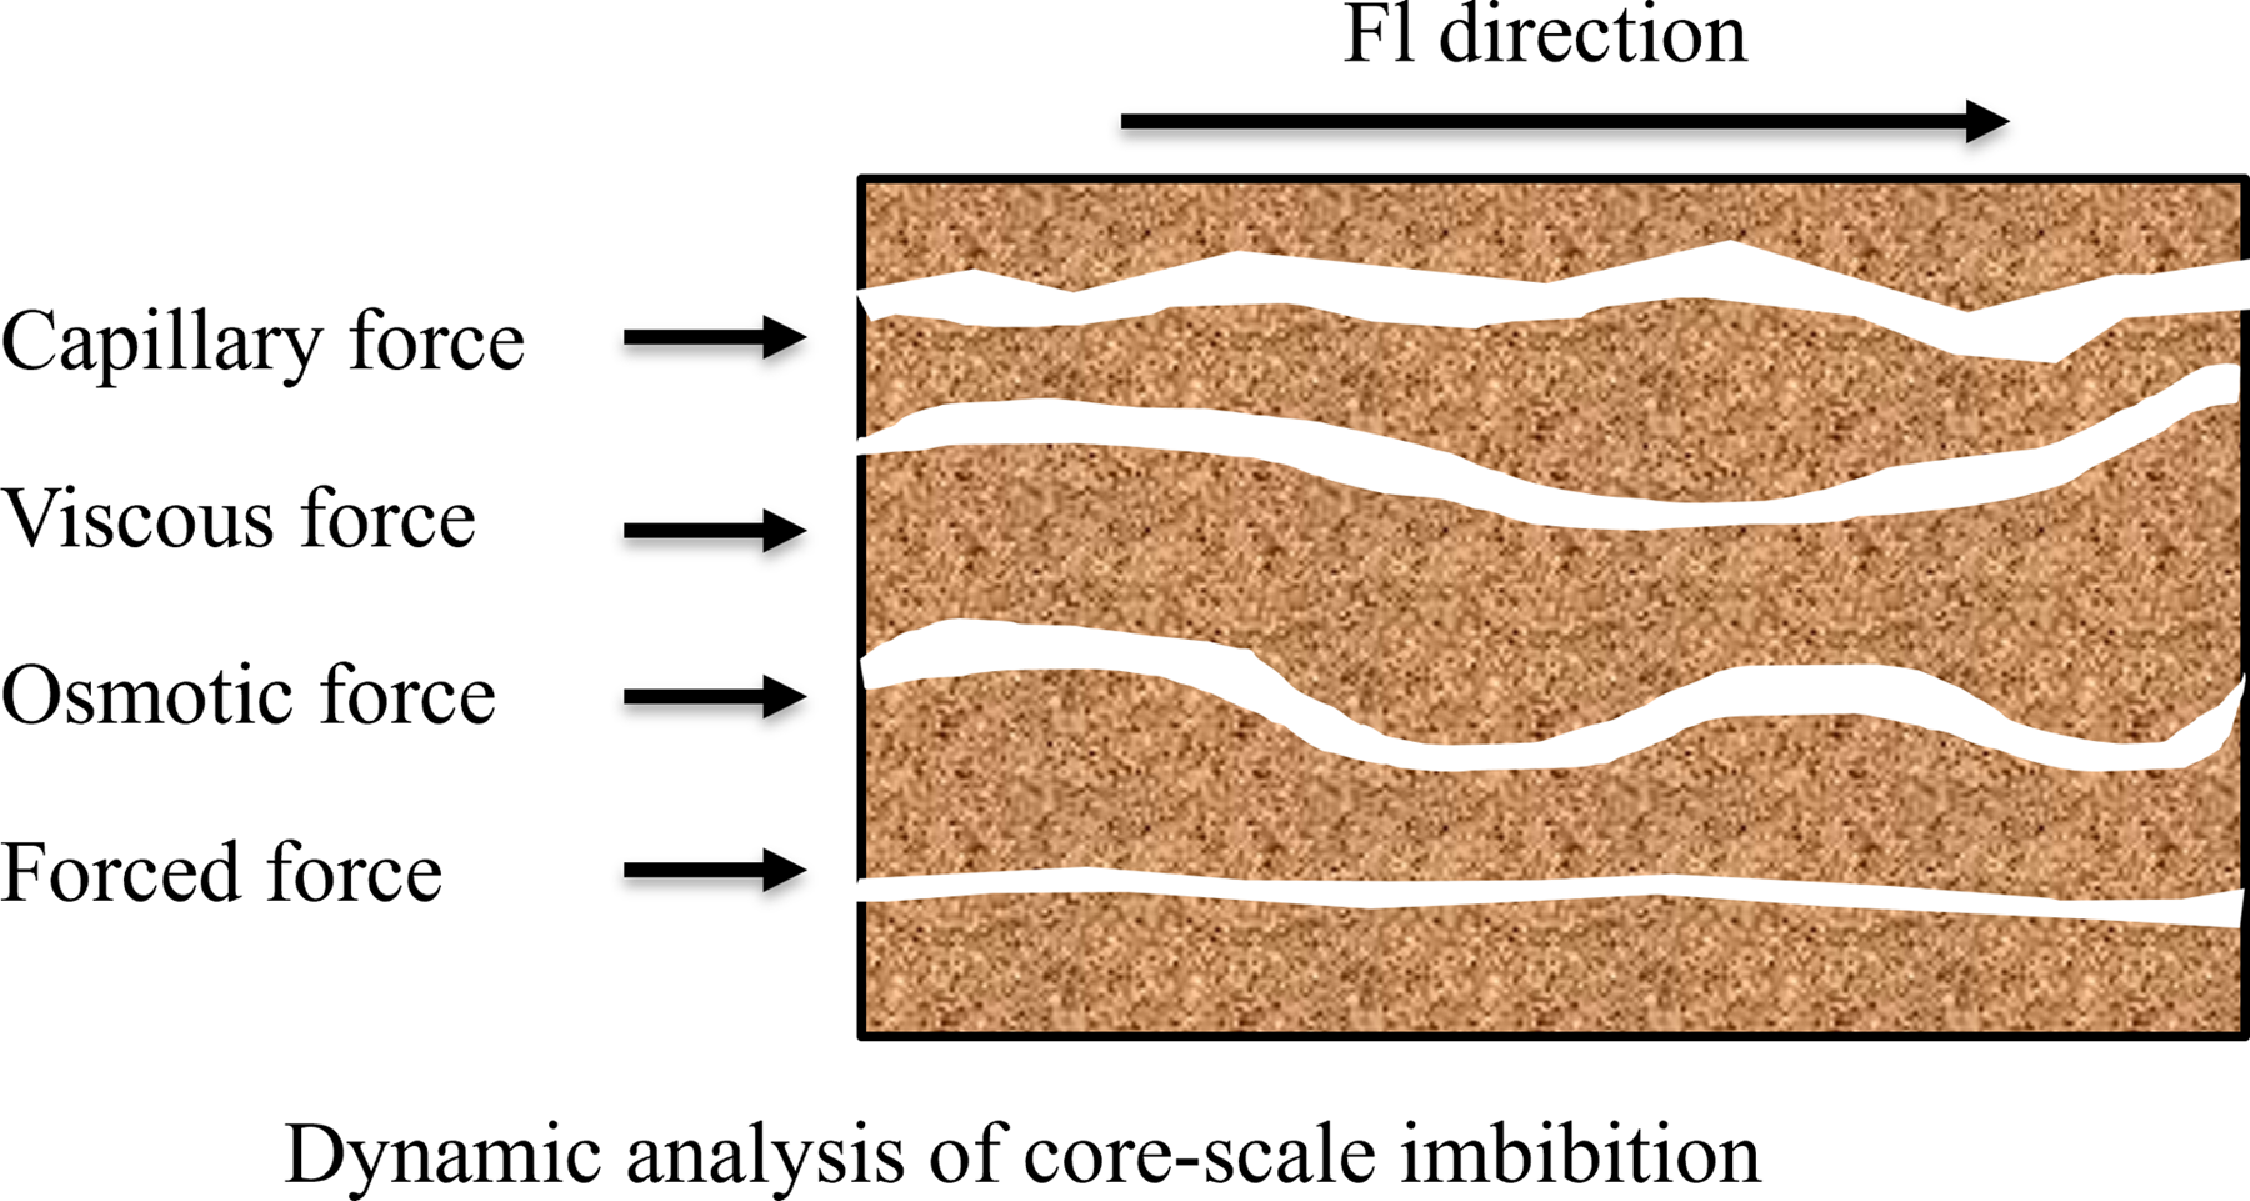
Figure 15 Long description
The diagram illustrates the multiphysics driving forces involved in core-scale forced imbibition. It shows four distinct forces: capillary force, viscous force, osmotic force, and forced force, each represented by arrows pointing in the same direction. The forces are depicted as influencing the movement of water through a porous medium, with the direction of flow indicated by an arrow labeled ‘F1 direction’. The diagram highlights the dynamic analysis of core-scale imbibition, showing how these forces interact within the medium.
Beyond single-capillary formulations, capillary bundle models represent an important upscaling step by incorporating pore-size distributions into predictions of imbibed volume; consequently, they are widely used for rapid estimation of imbibition in porous media. Nevertheless, conventional bundle models assume parallel, non-interacting capillaries and commonly represent pores as ideal circular tubes. Such assumptions are particularly restrictive for shale because they neglect (i) the strong contrasts between organic nanopores and inorganic mineral-associated pores in pore scale, surface properties and flow boundary conditions and (ii) directional transport anisotropy associated with bedding. To address these issues, recent studies have augmented the capillary bundle framework by introducing pore-domain partitioning, shape factors and external-pressure terms relevant to forced imbibition. These additions enable a more realistic geometric representation of shale pore systems.
Zhong et al. (Reference Zhong, Zhang, Kuru, Kuang and She2019) developed an analytical forced-imbibition model for organic-rich shale by combining Hagen–Poiseuille viscous pressure losses with capillary-bundle upscaling. Their formulation emphasised that, under hydraulic-fracturing conditions, externally imposed pressure gradients and viscous dissipation cannot be neglected; they used experimental results to examine the roles of fluid system and bedding orientation. Building on this approach, Wang & Fu (Reference Wang and Fu2023) proposed a forced-imbibition capillary bundle model for a dual-pore shale system comprising organic and inorganic domains. In their framework, slip effects were introduced for organic nanopores, whereas boundary-layer effects were incorporated for inorganic pores. This distinction allows for differentiated imbibition responses across pore domains under a unified pressure-gradient driving force, effectively capturing coupled spontaneous–forced imbibition.
Although these geometric enhancements improve representation of pore-size distributions and pore-domain heterogeneity, the classical non-interacting assumption remains insufficient to describe pressure redistribution, pore-to-pore cross-flow and connectivity control in real pore networks. To bridge the gap between capillary bundles and full pore-network models, recent efforts have advanced weakly networked formulations that allow coupling and fluid exchange among individual channels so that fronts, saturation patterns and rates partially reflect network connectivity. Deng et al. (Reference Deng, Liang, Wang, Liu, Wu and Zhou2024) proposed an interacting capillary bundle model in which capillaries are coupled through pressure equilibration and intercapillary cross-flow. Without prescribing the imbibition-front position a priori, the interacting capillary bundle approach predicts saturation evolution and interface dynamics during imbibition. Consequently, the model captures key aspects of connectivity-controlled transport.
5.1.3. Model optimisation based on physicochemical coupling mechanisms
Recent studies increasingly treat shale water imbibition not as a purely capillarity-driven process but as a multiphysics transport problem governed by chemical-potential gradients, ion transport and hydration reactions as shown in Figure 15. Under hydraulic-fracturing conditions, salinity contrasts between low-salinity fracturing fluids and high-salinity formation brines generate chemical-potential gradients, while selective ion transport associated with shale’s semipermeable nature and hydration-induced clay swelling further modify the effective pore structure. These coupled processes collectively determine both the driving forces and the effective flow pathways.
Classical imbibition models typically include only capillary pressure (P c ) and viscous resistance. When semipermeable behaviour is considered, solute concentration gradients generate chemical-potential differences that introduce an additional osmotic driving component, commonly expressed as an osmotic pressure term (P π). Xu et al. (Reference Xu, Li, Hu, Liu, Duan and Chang2023) proposed a one-dimensional counter-current imbibition model that integrates capillary pressure with chemical–osmotic stress within the governing equations. This framework provides a mechanistic basis for interpreting the effects of salinity and ion type on spontaneous imbibition kinetics in shale matrices. Li et al. (Reference Li, Su, Wang and Sun2022) further advanced this concept by incorporating osmotic pressure and additional driving forces into an imbibition equation derived from fractal theory and a capillary-bundle upscaling framework. Their model applies to both spontaneous and forced imbibition scenarios and successfully explains the observed differences in imbibition behaviour under varying external pressure and salinity conditions. Wang et al. (Reference Wang, Wang, Xia, Zhao, Masoodi and Xia2025) developed a more comprehensive numerical model that couples flow equations with osmotic-pressure relations and solute-transport governing equations. This formulation quantifies ion migration and its impact on imbibition rate and water-distribution patterns. This model establishes a unified theoretical framework that integrates salinity contrast, osmotic effects and shale–fluid interactions. However, models limited to osmotic or chemical permeation often neglect hydration-induced pore-structure evolution. As a result, they fail to fully explain irreversible phenomena such as post-imbibition permeability reduction, pore-throat blockage or fracture development. Future modelling efforts must therefore incorporate the dynamic feedback between hydration reactions and pore-network evolution to simulate imbibition-induced structural changes accurately.
Accordingly, recent efforts have shifted towards closed-loop coupling schemes that integrate hydration reactions, pore-structure evolution and imbibition dynamics. Representative studies by Ding et al. (Reference Ding, Liu, Liang, Xiong and Hou2022, Reference Ding, Yu, Liu, Gan, Liang and Xiong2025) integrated capillary and osmotic driving forces alongside the hydration-induced temporal evolution of geometric parameters (e.g. pore radius, pore volume and tortuosity). These evolving parameters were then used to update resistance terms and effective imbibition capacity in a time-dependent manner. The results indicate that hydration may enhance imbibition by enlarging effective flow pathways and reducing tortuosity; conversely, it can induce structural damage and redistribute flow capacity. These opposing effects underscore the inherently dual and dynamic nature of hydration in shale imbibition.
5.2. Numerical simulations
5.2.1. Computational fluid dynamics approaches based on the Navier–Stokes equations
Computational fluid dynamics (CFD) based on the Navier–Stokes (NS) equations provides a classical framework for pore-scale descriptions of immiscible flow. For two-phase interface treatment, widely used schemes include the volume-of-fluid (VOF) method, the level-set method and the Cahn–Hilliard–NS (CHNS) phase-field formulation. Phase-field approaches introduce an order parameter and a free-energy functional to represent interfaces with finite thickness. This formulation facilitates robust handling of interfacial deformation and topological change in complex pore geometries. In contrast, VOF and level-set methods adopt sharp-interface descriptions. These methods are particularly well suited to finite-volume implementations, enabling accurate representation of interface advancement, wettability boundary conditions and capillary-pressure differences.
By resolving local flow and interfacial events, pore-scale CFD directly outputs pressure and velocity fields, interface curvature and local capillary pressures, thereby enabling quantitative linkage between imbibition dynamics and pore morphology. Raeini et al. (Reference Raeini, Bijeljic and Blunt2014) developed a finite-volume pore-scale two-phase flow framework with interface-capturing methods and systematically examined how pore-scale transport and interfacial dynamics control macroscopic quantities such as relative permeability and residual saturation. This work provided an important methodological basis for applying direct numerical simulation to imbibition problems in heterogeneous and fractured porous structures.
Using a coupled CHNS phase-field–NS formulation solved via the finite-element method, Rokhforouz & Amiri (Reference Rokhforouz and Amiri2017) investigated pore-scale counter-current spontaneous imbibition. Their study emphasised the role of fracture–matrix heterogeneity in governing interfacial evolution and displacement efficiency, demonstrating the distinct advantages of phase-field approaches in complex networks. Malenica et al. (Reference Malenica, Zhang and Angst2024) simulated spontaneous liquid invasion into dry pores using the VOF method. They identified inertia, dynamic pressure redistribution and capillary resistance as the primary controls on front advancement. Their results provide numerical evidence for the transition from classical Washburn-type behaviour to regimes influenced by dynamic effects, a finding particularly relevant for shale pore-throat systems.
5.2.2. Lattice Boltzmann method
The lattice Boltzmann method (LBM) models flow from a mesoscopic perspective by evolving particle distribution functions on discrete velocity sets, from which the macroscopic NS equations can be recovered. As a computationally efficient and highly parallel method, the LBM has been widely used for single-phase and multiphase flow in complex geometries (Chen & Doolen Reference Chen and Doolen1998; Sukop & Thorne Reference Sukop and Thorne2006). Multiphase LBM implementations commonly adopt the Shan–Chen pseudopotential model, free-energy models or colour-gradient models; the Shan–Chen model was originally developed to simulate flows with multiple phases and components and remains one of the most widely used multiphase LBM frameworks (Shan & Chen Reference Shan and Chen1993, Reference Shan and Chen1994). Wettability and contact-angle control are imposed through appropriate solid-boundary formulations. Compared with conventional CFD, the LBM operates on regular lattices and is naturally compatible with voxel-based digital rock representations of complex pore geometries, while offering high parallel efficiency.
For shale digital rocks featuring intricate pore and microfracture structures, the LBM circumvents the meshing burden associated with unstructured CFD grids. Consequently, it is extensively applied to assess the effects of wettability, viscosity ratio, interfacial tension and pore-scale heterogeneity on imbibition curves and residual saturation. Landry et al. (Reference Landry, Karpyn and Ayala2014) used time-resolved X-ray micro-CT to capture fracture–matrix fluid transfer and validated LBM-predicted transfer rates against experimental observations. Their study also showed that insufficient imaging resolution can bias estimates of immobile wetting-phase saturation. This finding highlights a key constraint linking digital-rock resolution to predictive accuracy.
Liu et al. (Reference Liu, Cai, Sahimi and Qin2020 b) applied an optimised colour-gradient LBM to porous-matrix models containing embedded microfractures of different types and systematically quantified how fracture geometry controls interface evolution and recovery during counter-current imbibition. Their results indicate that fracture length and branching angle can substantially alter two-phase interface dynamics and enhance mobilisation of the non-wetting phase, providing mechanistic insight into the role of shale microfracture networks in fracturing-fluid imbibition and subsequent flowback.
5.2.3. Molecular dynamics simulations
Molecular dynamics simulations probe fluid transport and fluid–solid interactions at molecular and submolecular scales. In pore-scale CFD and LBM studies, parameters such as contact angle, wetting-film thickness, slip boundary conditions and the dependence of interfacial tension on salinity or fluid composition are typically prescribed. Molecular dynamics can provide mechanistic constraints on these inputs by explicitly resolving interfacial hydration structures, mineral surface functional groups and the structural flexibility of organic matter, thereby clarifying their contributions to shale water uptake and interfacial behaviour.
Papavasileiou et al. (Reference Papavasileiou, Michalis, Peristeras, Vasileiadis, Striolo and Economou2018) performed molecular dynamics simulations of water-based fracturing fluids with different salt and additive compositions in kaolinite slit nanopores and quantified preferential adsorption on distinct basal surfaces, lateral diffusion coefficients and residence behaviour within clay nanopores. Zhang et al. (Reference Zhang, Mo, Qi, Huang, Yue, Liu, Wan and Fu2024) simulated water imbibition in illite nanopores and proposed a staged mechanism in which initial entry is driven by hydrogen bonding between pore-wall sites and water molecules to form an adsorbed layer, followed by development of a water–water hydrogen-bond network that promotes further penetration and displacement of pore-confined gas until equilibrium. They further analysed the effects of pressure, pore size and water supply on imbibition time scales and displacement efficiency, providing a molecular-scale interpretation for the observation that gas displacement becomes more complete when pore size falls below a critical threshold.
6. Conclusions and perspectives
Spontaneous water imbibition in shale reservoirs represents a core physicochemical mechanism governing the retention and redistribution of hydraulic fracturing fluids and the evolution of hydrocarbon productivity. Through a systematic review of shale imbibition dynamics, controlling factors, experimental characterisation techniques and theoretical and numerical modelling approaches, the following main conclusions can be drawn.
(i) Fluid uptake in shale transcends simple capillary mechanisms. At micro- to nanoscale levels, capillary forces provide the initial driving potential. Simultaneously, chemical potential gradients between low-salinity fracturing fluids and high-salinity formation water generate significant osmotic pressure, driven by the semipermeable nature of clay minerals. This osmotic effect drives deep matrix water uptake. Furthermore, clay hydration increases effective water-storage capacity while actively restructuring pore networks through microfracture initiation. These mechanisms operate through complex competition and coupling across temporal and spatial scales, collectively determining front propagation rates and the ultimate fluid distribution.
(ii) Imbibition is constrained by a hierarchy of geological and engineering factors. Intrinsic geological properties (pore structure, mineral composition, bedding) define the material limits of accessible space and flow pathways. Fluid properties (interfacial tension, wettability) dictate the magnitude of driving forces. Crucially, engineering and environmental conditions – specifically effective stress, temperature and shut-in strategies – modulate the intensity of these physicochemical processes.
(iii) Imbibition drives dynamic rock-fabric evolution. The rock framework is not static; rather, the combined effects of swelling stress, osmotic pressure and capillary forces trigger microfracture initiation, dynamically enhancing connectivity. Conversely, mineral dissolution and fines migration can induce pore-throat blockage. This coupling implies that both driving forces and flow resistance evolve continuously. Consequently, shale imbibition necessitates a modelling approach based on dynamic evolution rather than static parameters.
(iv) Methodologically, the field has transitioned from macroscopic phenomenological observations (gravimetric/volumetric methods) to integrated in situ visualisation techniques, such as LF-NMR, micro-/nano-CT and neutron imaging. These advances allow for the direct observation of fluid migration across multiple scales. Theoretically, models have progressed from the classical Lucas–Washburn framework to sophisticated constitutive descriptions that incorporate dynamic wettability and structural damage. Complementing these efforts, molecular dynamics and the LBM now elucidate fluid–solid interactions from the molecular level upward.
To align mechanistic understanding with engineering reality, future research must bridge the disparity between ambient laboratory observations and in situ reservoir conditions while overcoming cross-scale predictive barriers. Developing real-time experimental platforms that replicate coupled high-temperature, high-pressure and stress-confined environments is essential for accurately constraining multiphysics processes. On the computational front, multiscale modelling frameworks spanning from molecular to core scales must integrate with data-driven machine learning to enhance both efficiency and interpretability. Ultimately, these coordinated advances will establish a quantitative scientific basis for optimising hydraulic fracturing fluid design and flowback strategies.
Acknowledgements
The authors would like to thank the editors and reviewers for their constructive comments and suggestions.
Data availability statement
Data sharing is not applicable to this article as no new data were created or analysed in this study.
Funding Statement
This work was supported by the National Natural Science Foundation of China (No. 12172362), the National Science and Technology Major Project (No. 2025ZD1403006), the China National Petroleum Corporation (CNPC) Innovation Fund (No. 2021DQ02-0204), the International Partnership Program of Chinese Academy of Sciences (025GJHZ2023048FN) and the Youth Innovation Promotion Association of Chinese Academy of Sciences (No. 2023024).
Competing interests
The authors report no conflict of interest.
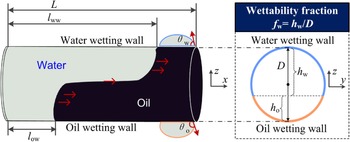
 hw
hw ho
ho θw
θw θo
θo fw
fw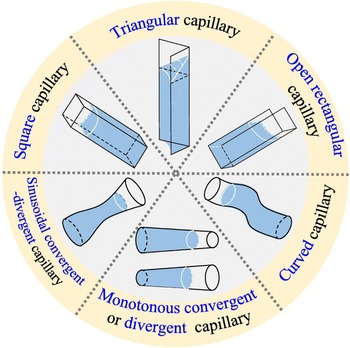
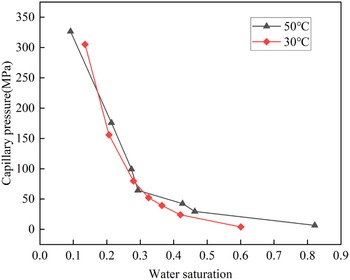
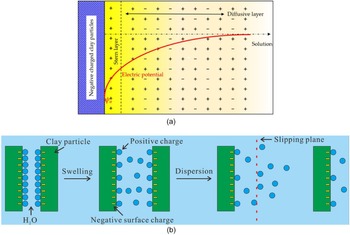
 ψ
ψ ψ0
ψ0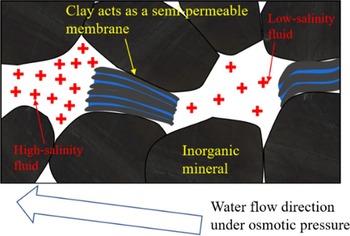
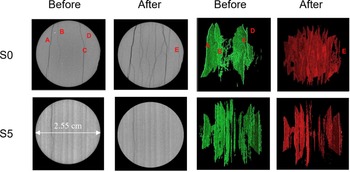
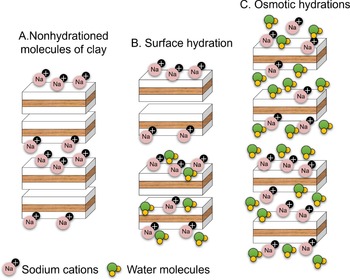
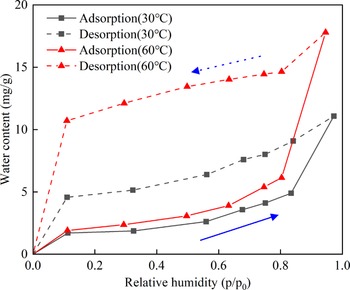
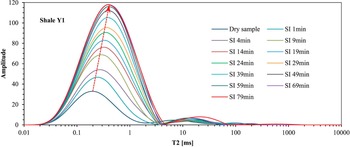
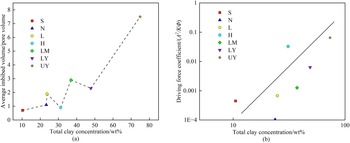
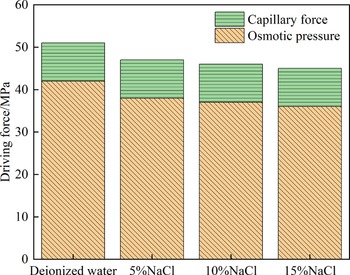
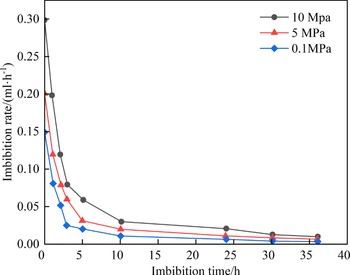
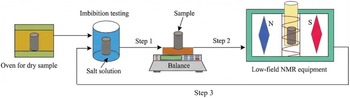
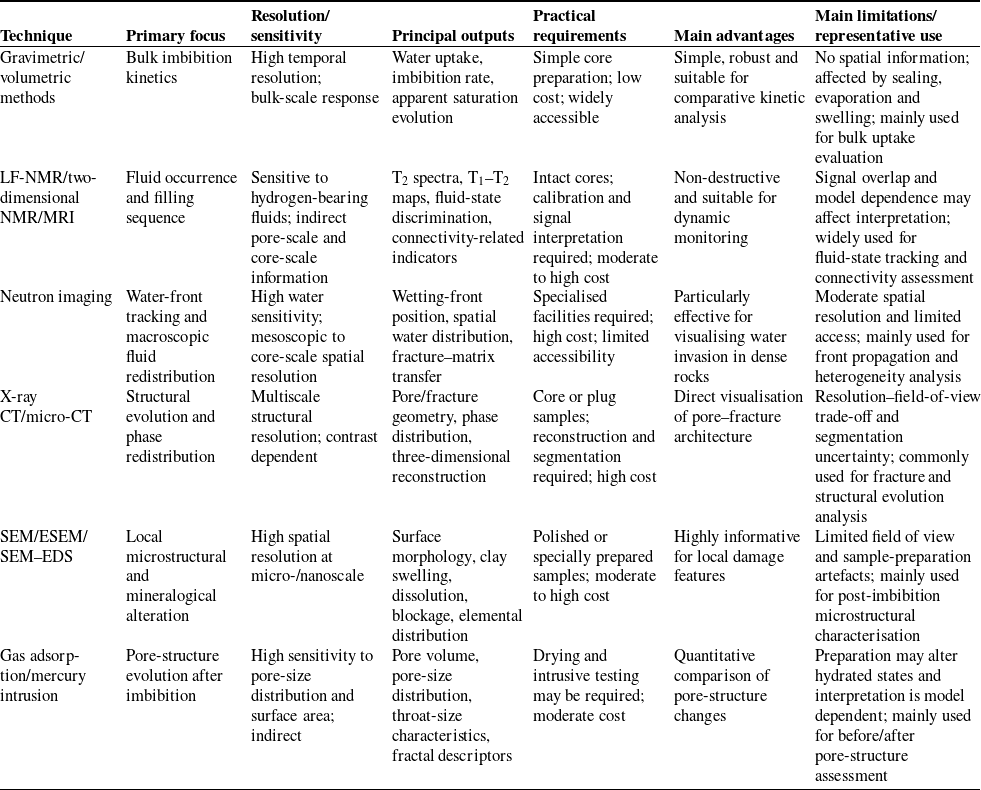
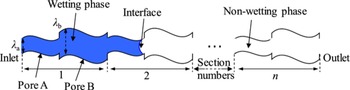
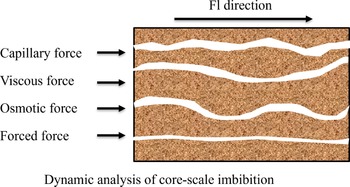

 Open access

