

Introduction
To analyze trends in the Antarctic climate, accurate observations are necessary. These observations cannot be taken only from the current network of meteorological stations, mainly located at coastal sites, due to the sparsity of the stations (Reference TurnerTurner and others, 2005; Reference Steig, Schneider, Rutherford, Mann, Comiso and ShindellSteig and others, 2009). Remote sensing appears the only way to observe spatially resolved variations in the polar climate.
Among the different spaceborne sensors, microwave radiometers can be used to study the temporal and spatial evolution of the temperature over polar regions, because they have measured the thermal radiation emitted by the snowpack several times per day for more than 30 years. The radiometer measurement, expressed as brightness temperature, T B, is (in dry snow) mostly related to the vertical distribution of snow temperature and to the vertical profile of snow microstructure properties, such as grain size and density, which govern snow emissivity (Reference ZwallyZwally, 1977; Reference SurdykSurdyk, 2002).
Efforts to predict snow brightness temperature and emissivity using radiative transfer models driven by snow measurements, such as the dense-medium radiative transfer theory (DMRT) (Reference Tsang, Chen, Chang, Guo and DingTsang and others, 2000), the Microwave Emission Model of Layered Snowpacks (MEMLS; Reference Wiesmann and MätzlerWiesmann and Mätzler, 1999) and the Helsinki University of Technology (HUT) snow microwave emission model (Reference Pulliainen, Grandell and HallikainenPulliainen and others, 1999), are growing both for seasonal snow (e.g. Reference Macelloni, Paloscia, Pampaloni and TedescoMacelloni and others, 2001; Reference Tedesco and KimTedesco and Kim, 2006; Reference TedescoTedesco and others, 2006; Reference Liang, Xu, Tsang, Andreadis and JosbergerLiang and others, 2007; Reference LemmetyinenLemmetyinen and others, 2009) and for perennial snow (Reference Macelloni, Brogioni, Pampaloni and CagnatiMacelloni and others, 2007).
In this study, we model the microwave brightness temperature at Dome C (75°06′ S, 123°21′ E; 3240 m a.s.l.) on the East Antarctic plateau using a model, based on the DMRT, driven by in situ snow temperatures and microstructure profiles. The channels used are 18.7 and 36.5 GHz at vertical and horizontal polarization.
In a previous study, Reference Macelloni, Brogioni, Pampaloni and CagnatiMacelloni and others (2007) computed time series of brightness temperature at Dome C by driving a microwave emission model with snow measurements. The time series of brightness temperature from January to October were modeled with a root-mean-square error (rmse) of 1.18 and 2.7 K at 18.7 and 36.5 GHz, respectively. This relatively high rmse may be explained by the inaccuracy of the snow grain-size profile. Indeed, the snow grain-size profile strongly influences the microwave emissivity (e.g. Reference Wiesmann, Mätzler and WeiseWiesmann and others, 1998; Reference Mounirou Toure, Goïta, Royer, Mätzler and SchneebeliMounirou Toure and others, 2008; Reference Brucker, Picard and FilyBrucker and others, 2010), hence highly resolved and quantitative measurements are crucial to model emissivity accurately. Furthermore, it was shown that an accurate knowledge of the snow grain-size profile is the most important snow property when modeling emissivities in Antarctica at several frequencies (Reference Brucker, Picard and FilyBrucker and others, 2010).
Nevertheless, unlike snow density and temperature, snow grain size is difficult to measure. The definition of grain size is not obvious owing to the wide variety of snow grain shapes found in natural snow (e.g. Reference ColbeckColbeck and others, 1990).
Reference Macelloni, Brogioni, Pampaloni and CagnatiMacelloni and others (2007) took the snow grain size as the maximum dimension of the prevalent grains for each snow layer according to Reference ColbeckColbeck and others (1990). The grain-size profile was measured by visual inspection using a hand lens and traditional macro photographs of grains. However, traditional methods of direct visual inspection in snow pits lack repeatability, as it is necessary to select grains (e.g. Reference Domine, Salvatori, Legagneux, Salzano, Fily and CasacchiaDomine and others, 2006). In addition, these measurements do not provide the effective grain size required in radiative transfer modeling (Reference Painter, Molotch, Cassidy, Flanner and SteffenPainter and others, 2007).
A physically more sensible way to define grain size is by specific surface area (SSA) (Reference Giddings and LaChapelleGiddings and LaChapelle, 1961; Reference Domine, Cabanes, Taillandier and LegagneuxDomine and others, 2001), i.e. the total surface area of the air–ice interface per unit mass (m2 kg−1). The SSA is related to the optical radius, r opt (Reference Grenfell and WarrenGrenfell and Warren, 1999):
where ρ ice is the ice density (917 kg m−3).
The SSA of snow can be measured by different methods: in two dimensions by stereology (Reference Perla, Dozier and DavisPerla and others, 1986; Reference Davis, Dozier, Perla, Jones and Orville-ThomasDavis and others, 1987; Reference Arnaud, Gay, Barnola and DuvalArnaud and others, 1998; Reference Matzl and SchneebeliMatzl and Schneebeli, 2010) and in three dimensions by methane adsorption (Reference Legagneux, Cabanes and DomineLegagneux and others, 2002), X-ray tomography (Reference Flin, Brzoska, Lesaffre, Coléou and PieritzFlin and others, 2003; Reference Barnola, Pierritz, Goujon, Duval and BollerBarnola and others, 2004; Reference Kerbrat, Pinzer, Huthwelker, Gäggeler, Ammann and SchneebeliKerbrat and others, 2008) or snow reflectance in the near and short infrared (Reference Domine, Salvatori, Legagneux, Salzano, Fily and CasacchiaDomine and others, 2006; Reference Matzl and SchneebeliMatzl and Schneebeli, 2006; Reference Painter, Molotch, Cassidy, Flanner and SteffenPainter and others, 2007; Reference Gallet, Domine, Zender and PicardGallet and others, 2009). Whatever the technique used, SSA measurements present the major advantage of being observer-independent. In addition, with the current accuracy of the measurements, the dependence of the reflectance–SSA relationship on the grain shape predicted by several authors (Reference Grenfell and WarrenGrenfell and Warren, 1999; Reference Kokhanovsky and ZegeKokhanovsky and Zege, 2004; Reference Picard, Arnaud, Domine and FilyPicard and others, 2009a) does not seem significant in natural snow (Reference Gallet, Domine, Zender and PicardGallet and others, 2009).
These methods take measurements at one point, except for near-infrared (NIR) photography which allows continuous vertical profiling of SSA with one snapshot. This represents an important advantage over the other techniques in modeling the passive microwave emission, because all the existing models consider snow as a layered medium. Therefore, the NIR photography method is the most convenient for our purpose.
NIR photography (Reference Matzl and SchneebeliMatzl and Schneebeli, 2006; Reference LangloisLanglois and others, 2010) measures the hemispherical directional reflectance over a broad range of wavelengths of ∼850–1100 nm, with high spatial resolution (typically a few millimeters). To calculate the vertical profile of SSA from the reflectance measurements, we considered existing relationships both developed from empirical stereological measurements and based on theoretical calculations with radiative transfer models.
In this paper, we use NIR photography to derive SSA, and we use density and temperature profiles measured at high vertical resolution to drive the multilayer (ML) microwave radiative transfer models, DMRT-ML and MEMLS, in order to compute the brightness temperature.
Methods
Microwave data
Microwave observations were acquired at 18.7 and 36.5 GHz by the Advanced Microwave Scanning Radiometer – Earth Observing System (AMSR-E). The daily-averaged brightness temperatures were extracted from the ‘AMSRE/Aqua Daily L3 12.5 km Brightness Temperature, Sea Ice Concentration, and Snow Depth Polar Grids’ dataset provided by the US National Snow and Ice Data Center (NSIDC), with a spatial resolution of 12.5 km × 12.5 km. According to the AMSR-E webpage (http://nsidc.org/data/docs/daac/AMSR-E_instrument.gd.html), the total sensor bias error is 0.66 K at 100 K and slightly changes with temperature to 0.68 K at 250 K.
The dataset contains, for each day, the average of the daily-averaged ascending orbits and daily-averaged descending orbits. At Dome C, due to the sun-synchronous near-polar orbit, there are typically seven passes per day between 1400 and 0000 h, local time.
Measurements of snow properties
Snow temperature
Snow temperature profiles were recorded every hour (from November 2006), down to 21 m, with 35 probes. The temperature probes were located ∼1 km to the west of the Concordia station and 15 m from the snow pit where the density and NIR reflectance were measured. Initially, in the top 2 m of the snowpack, there were 14 probes (every 0.1 m down to 0.6 m depth then every 0.2 m down to 2 m). All probes were intercalibrated with a relative accuracy of ±0.01 K; the absolute precision is ±0.03 K.
To accurately model the microwave radiation emitted by the snowpack, the absolute depth of the temperature probes and their burying with time need to be known. To estimate the annual amount of snow accumulated above the temperature probes, the daily variations of snow temperatures in January 2007 and January 2008 were compared. These variations are related to the 24 hour cycle of solar radiation and they exponentially decrease with increasing depth (Reference Brandt and WarrenBrandt and Warren, 1997).
In January 2007, temperature probe T0 was set near the surface and T1 was set 0.1 m below the surface. Mean and standard deviation of snow temperatures measured in January 2007 and 2008 by the T0 and T1 probes are reported in Table 1. The standard deviation measured with T1 in 2007 (3.72 K) is similar to that measured with T0 (3.45 K) 1 year later (Table 1).
Mean and standard deviation, σ, of snow temperatures (K) measured in January 2007 and 2008 with T0 and T1 initially near the surface and at 0.1 m depth respectively

From this, we estimated snow accumulation above the sensors to be ∼0.1 m between January 2007 and 2008. Such an accumulation is in agreement with measurements at Dome C (Reference UrbiniUrbini and others, 2008). For the model we therefore assume that the snow temperature probes were buried at a constant rate of 0.1 m a−1 with respect to the initial depths in January 2007.
To compare the modeled brightness temperatures at the time of the satellite observations, we averaged the 2 hourly profile of temperatures between 1400 and 0000 h local time and used this averaged value.
Snow density
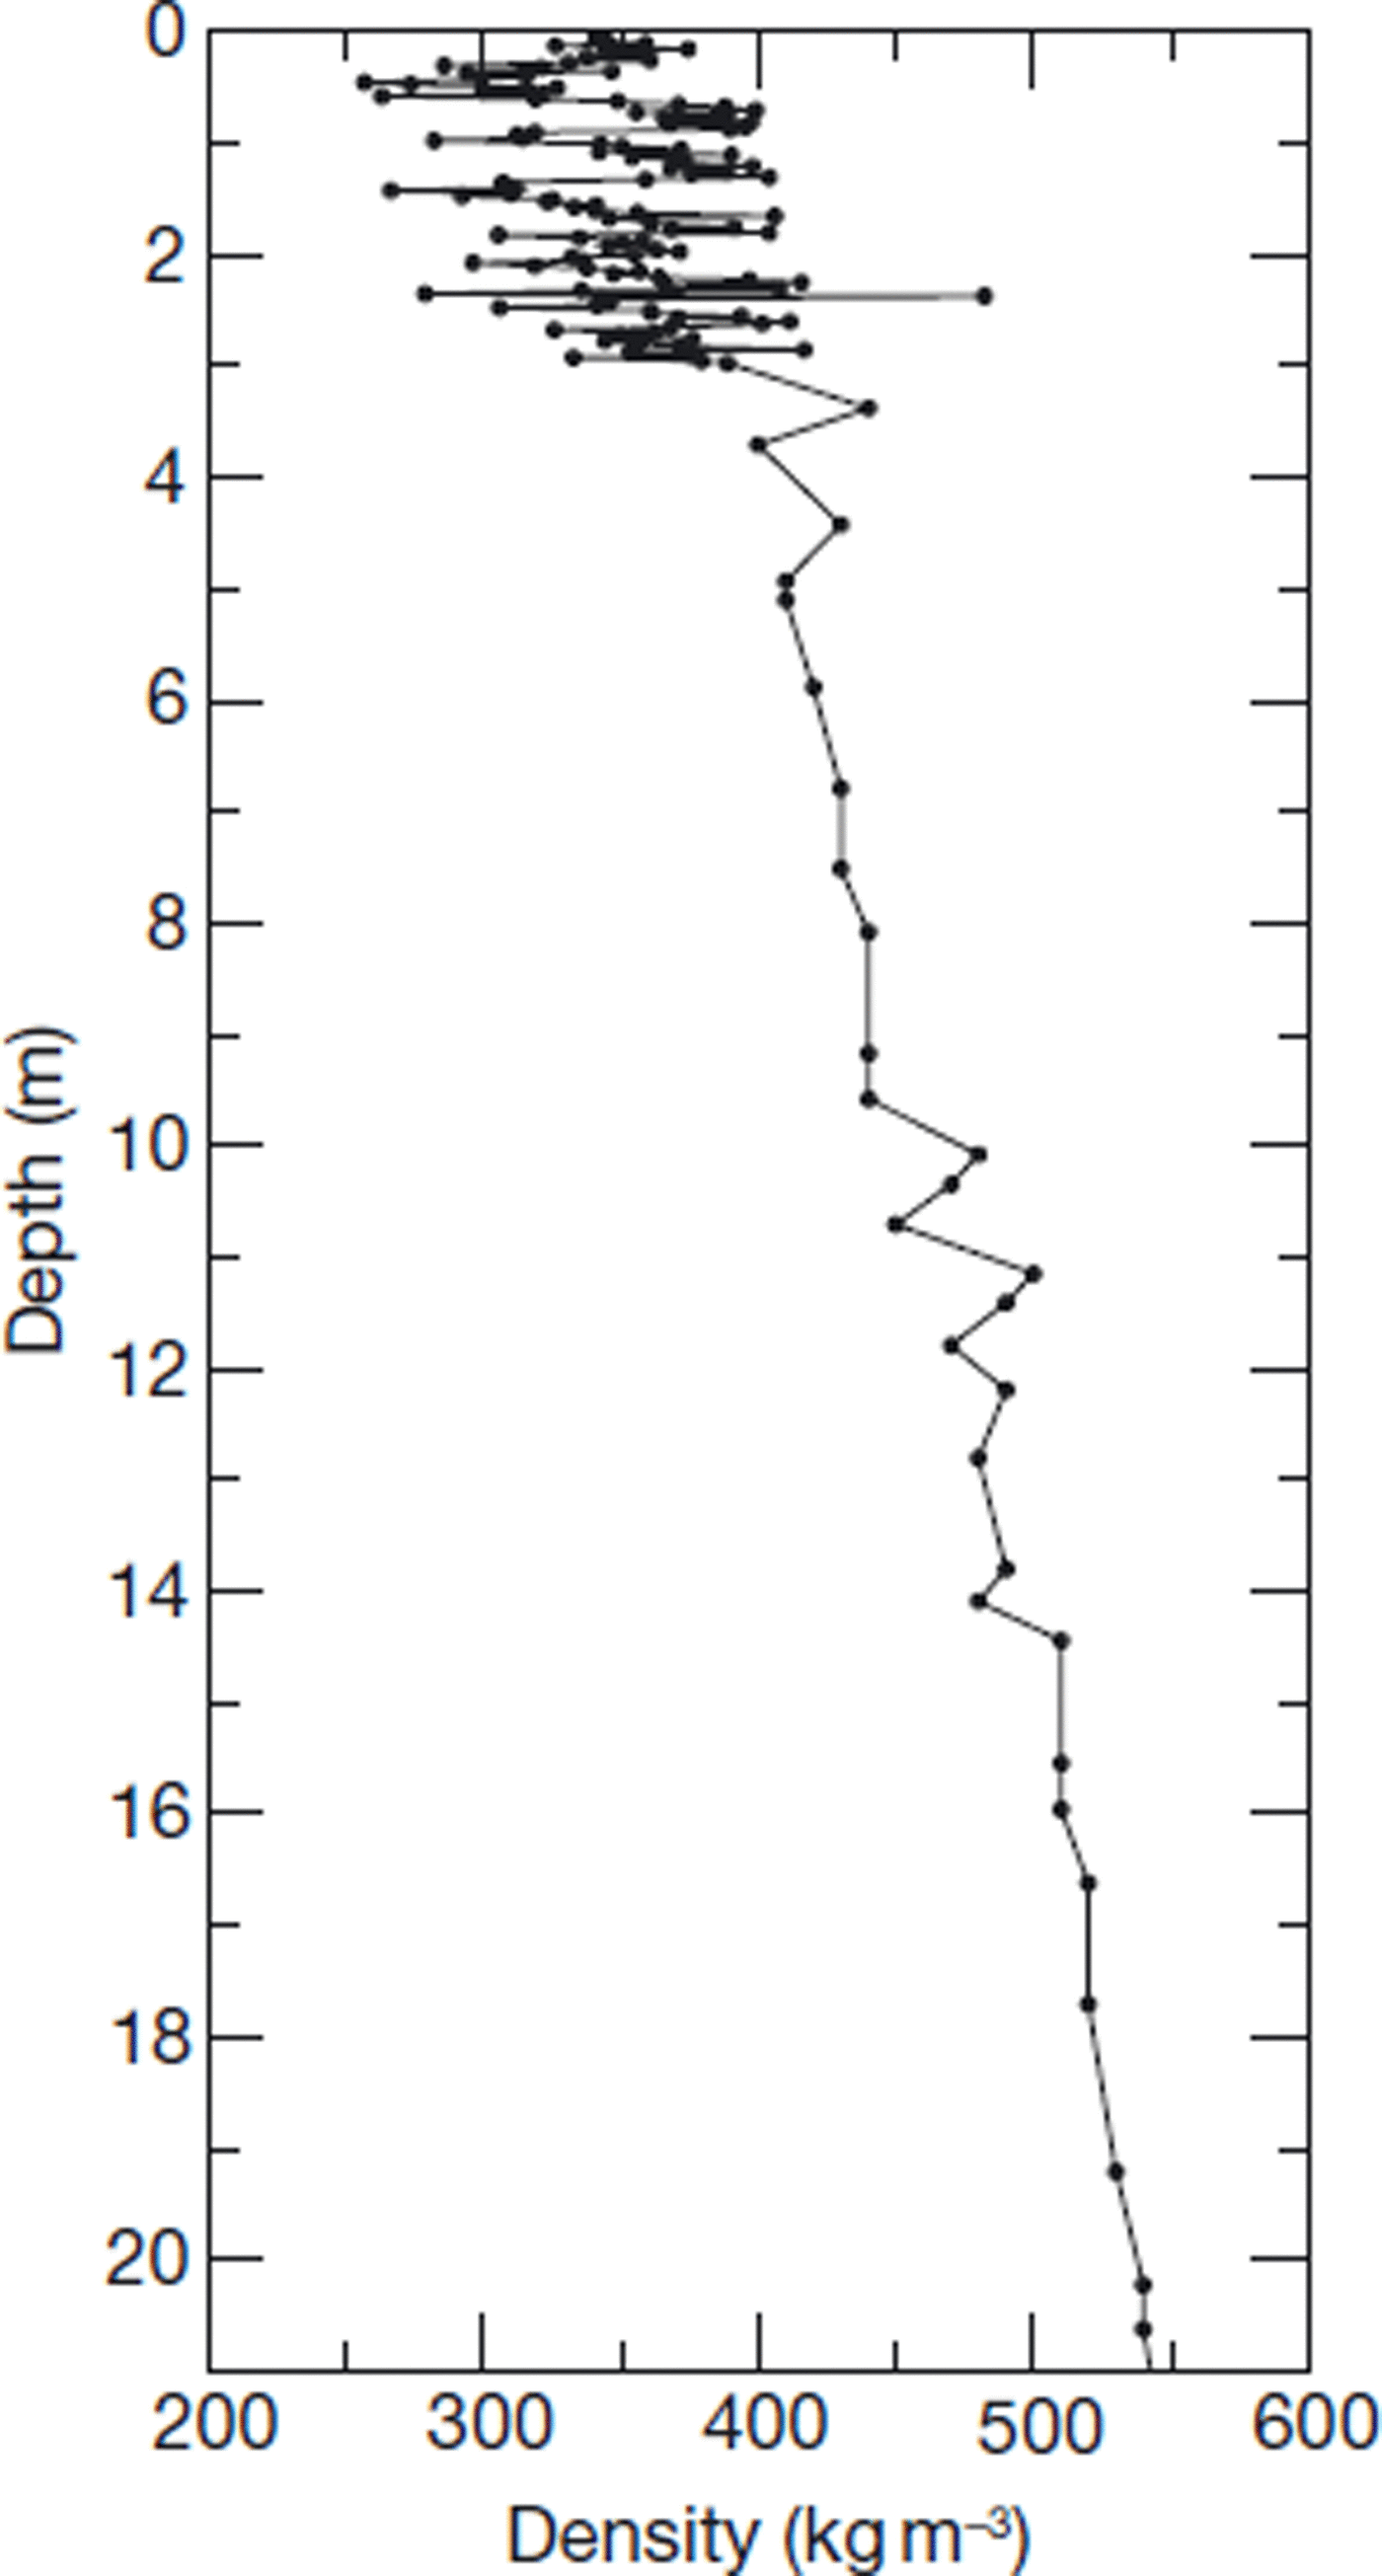
Snow density was measured in December 2006 in a snow pit, from the surface down to 3 m depth, with 2–3 cm vertical resolution. Below 3 m, the density was measured in a snow core down to 21 m depth, every 0.5–1 m (Figs 1 and 2a). Mean snow density of the top 3 m was 350 kg m−3 and increased to 550 kg m−3 at 21 m.
Snow density profile measured at Dome C, used to drive the DMRT-ML model. From 0 to 3 m depth, snow density was measured in a snow pit with a 2–3 cm vertical resolution. Below 3 m, measurements were made on a snow core. See Figure 2 for details of the top 3 m.
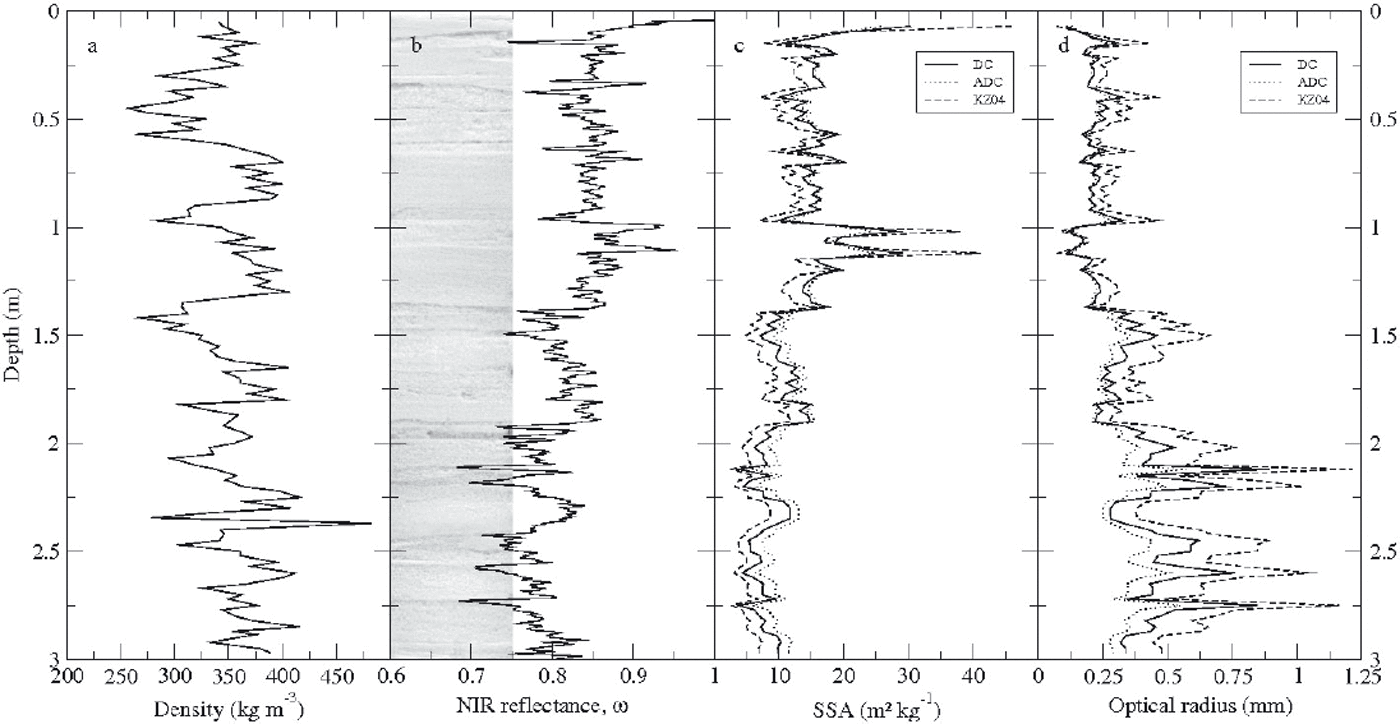
Profiles of measured snow microstructure properties down to 3 m depth. (a) Snow density, (b) NIR photograph of the snow pit wall and NIR reflectance, ω, (c) specific surface area of snow derived from the three relationships (DC, ADC and KZ04) and (d) derived optical radius computed from the three SSA profiles and Equation (1).
Snow grain size
The snow grain-size profile was derived from NIR reflectance measured by photography. The method was adapted from Reference Matzl and SchneebeliMatzl and Schneebeli (2006). Three NIR photographs were taken to cover a 0.6 m wide and 3 m deep snow pit wall (Fig. 2b). To convert pixel intensity to reflectance, ω, eight panels of two target references (Spectralon 50% and 99%) were evenly distributed on the snow wall. All the measurements were made under diffuse light conditions. The camera was a modified Canon 400D for NIR photography in the wavelength range 850–1100 nm, with a fixed zoom lens (EF 24 mm, f= 2.8).
After the photography, snow samples were taken from the wall of the snow pit for stereological measurements of the SSA to establish a relationship between NIR reflectance and SSA (Reference Brunjail, Arnaud, Schneebeli, Barnola and DuvalBrunjail and others, 2009). The following empirical relationship is based on eight stereological measurements collected at Dome C, referred to hereafter as DC:
However, as only a few measurements are available from DC, we also use two other relationships. The first is the combined set from the European Alps (Reference Matzl and SchneebeliMatzl and Schneebeli, 2006) and Dome C (referred to hereafter as ADC):
For the DC and ADC relationships, the unit of SSA was converted from m−1 to m2 kg−1 by dividing by the ice density. The latter relationship is based on a theoretical model (Reference Kokhanovsky and ZegeKokhanovsky and Zege, 2004) adapted by Reference Picard, Arnaud, Domine and FilyPicard and others (2009a) (referred to hereafter as KZ04):
The ice absorption coefficient, γ, is given by:
where k is the wavenumber and n ice is the imaginary part of the ice refraction index taken from Reference Warren and BrandtWarren and Brandt (2008). γ was computed at a wavelength, λ, of 850 nm, assuming this is the dominant wavelength under natural light. KZ04 refers to the factor b that depends solely on snow grain shape (Reference Picard, Arnaud, Domine and FilyPicard and others, 2009a), but it is unknown for natural snow. The possible range of b values estimated by theory is 3.39–4.07, corresponding to perfectly cubic and spherical grains, respectively (Reference Picard, Arnaud, Domine and FilyPicard and others, 2009a).
There is much observational evidence that grain shapes can be various and complex in Antarctica; but most of the grains at Dome C are of two types, either coarse and faceted with few rounded parts, or small rounded grains initially present in hard packed snow which have then evolved toward slightly faceted grains. Cup-like or elongated grains are rare. Since the mixture of plane faces and rounded parts dominates, we used a shape factor b = 3.7, intermediate between that of spheres and cubes.
The three relationships between NIR reflectance and SSA (DC, ADC and KZ04) were used to calculate the SSA profile. DC, ADC and KZ04 all show the same trend in SSA; the difference is ∼30% (Fig. 2c). Averaged SSA values over the profile are 12, 13 and 9.8 m2 kg−1 for DC, ADC and KZ04, respectively. The theoretical KZ04 relationship gives the lowest values of SSA.
These three relationships are used to study the validity of the method to model brightness temperature. We do not attempt to explain the difference between them.
Currently, few SSA measurements are available in Antarctica, even at Dome C. Nevertheless, the variations in SSA derived from the NIR photographs are in agreement with those measured by Gallet and others (2010), ranging from 38 to 14 m2 kg−1 from the surface to 0.7 m depth, with the DUal-Frequency Integrating Sphere for Snow SSA (DUFISSS; Reference Gallet, Domine, Zender and PicardGallet and others, 2009), a dedicated probe.
Figure 2b shows that ω had a decreasing trend with depth, corresponding to a decrease in SSA (Fig. 2c) and a corresponding increase in optical radius (Fig. 2d). Since no NIR photograph was acquired below 3 m depth, a constant SSA of 9.8 m2 kg−1 was assumed below this depth. This value was measured at 4 m depth on a snow core using the stereological method. The limit of this assumption is evaluated in the ‘Results and discussion’ section.
Snow microwave emission modeling
To predict microwave brightness temperature, we used a multilayer electromagnetic model (DMRT-ML) based on the DMRT (Reference Tsang and KongTsang and Kong, 2001). This theory has been extensively applied, in single and multilayered configurations, to study active and passive remote sensing of both seasonal and perennial snow (e.g. Reference Tsang, Chen, Chang, Guo and DingTsang and others, 2000; Reference Macelloni, Brogioni, Pampaloni and CagnatiMacelloni and others, 2007; Reference Tsang, Pan, Liang, Li, Cline and TanTsang and others, 2007; Reference GrodyGrody, 2008; Reference Liang, Xu, Tsang, Andreadis and JosbergerLiang and others, 2008) as well as snow over sea ice (e.g. Reference West, Tsang and WinebrennerWest and others, 1993).
The model assumes that snow is composed of ice spheres. The effective dielectric constant is solved using the first-order quasi-crystalline approximation and the Percus–Yevick pair distribution for non-sticky grains, i.e. grains which do not form aggregates (Reference Tsang and KongTsang and Kong, 2001). The computation is valid in the limit of low frequency and small sphere radius, r (i.e. 2πr/λ < 1).
DMRT is in agreement with numerical solutions of the Maxwell equations in three-dimensional simulations (NMM3D-DMRT) up to a density of ∼275 kg m−3 (Reference Liang, Tse, Tan, Tsang and DingLiang and others, 2006; Reference Tsang, Liang, Xu and XuTsang and others, 2008). However, this is lower than the typical density of snow at Dome C.
The propagation of the radiation through the snowpack is computed using the discrete-ordinate radiative transfer (DISORT) method (Reference JinJin, 1993). DMRT-ML accounts for multiple scattering between layers. The layers are plane parallel and thicker than the wavelength, so interferences due to multiple reflections are negligible. The thickness of the snow layer ranges, in this study, between 0.02 and 1 m. Each layer is fully characterized by thickness, radius of sphere, density and temperature.
To avoid model-dependent results, MEMLS (Reference Wiesmann and MätzlerWiesmann and Mätzler, 1999) was also used. This model is based on a radiative transfer using the six-flux theory to describe multiple volume scattering and absorption. In our study, the parameterization of the scattering coefficient is based on the improved Born approximation (Reference MätzlerMätzler, 1998; Reference Mätzler and WiesmannMätzler and Wiesmann, 1999). The input variables are similar to those used by DMRT-ML, except the grain size. Indeed, MEMLS requires the exponential correlation length, pexp, to quantify the grain size. Correlation length, pc, is theoretically related to optical diameter and density (Reference Debye, Anderson and BrumbergerDebye and others, 1957):
where f is the fractional volume. Reference MätzlerMätzler (2002) explains that while pexp is different from pc, these two variables are related by a multiplicative parameter. In this study, we used Equation (6) as a basis.
Atmospheric microwave emission modeling
The snow microwave emission model computes top-ofsnowpack brightness temperature. To predict satellite observations at the top of the atmosphere, atmospheric attenuation and emission due to water vapor and gas constituents need to be accounted for (Reference RosenkranzRosenkranz, 1992). These were evaluated using the radiative model, RTTOV-9.1 (Reference Saunders, Matricardi and BrunelSaunders and others, 1999) driven by the temperature and water vapor concentration profiles extracted from European Centre for Medium-Range Weather Forecasts (ECMWF) ERA-40 meteorological reanalysis (Reference UppalaUppala and others, 2005).
Results and Discussion
Direct modeling with measured snow grain-size profile
In this section, we assume that the optical radius derived from the SSA measurements (using the DC relationship) is able to represent the radius of spheres in DMRT-ML. We therefore directly use the optical radius profile as input to DMRT-ML. Figure 3a shows the modeled and observed time series of brightness temperature. Modeling results are greatly overestimated at both frequencies by ∼28 K. In addition, the predicted amplitudes of the annual cycle are weaker than in the observations. For instance, at 36.5 GHz the predicted amplitude is 20 K whereas the observed amplitude of the annual cycle is 30.1 K. The results are similar for the two other relationships, ADC and KZ04.
Observed (gray curves) and modeled time series of vertically polarized brightness temperature at Dome C in 2007 at 18.7 and 36.5 GHz using: (a) DC and α = 1, (b) the three relationships (DC, ADC and KZ04) with a calibrated α (Table 3) and (c) the three relationships with a calibrated α and a calibrated snow grain size below 3 m depth (Table 4).

In theory, the amplitude of the time series (i.e. the dynamic range of the brightness temperature) decreases with a decreasing extinction coefficient (Reference SurdykSurdyk, 2002). Since the extinction coefficient is the sum of the scattering coefficient, Ks, and the absorption coefficient, Ka, the underestimation of the amplitude may be explained by an underestimation of either Ks or Ka.
Further, in theory, the emissivity increases with Ka but decreases with Ks. Hence, the overestimation by the model of the mean brightness temperature results from an overestimation of the emissivity, caused by a too low Ks, or a too high Ka.
Therefore, the only explanation for both the underestimation of the amplitude and the overestimation of the mean brightness temperature is that Ks is underestimated. Since Ks is mainly driven by grain size, we conclude that the sphere radius relevant for microwave calculations is larger than the optical radius (which is relevant for optical calculations).
Values of scattering and absorption coefficients (m−1) averaged over 0–3 m directly modeled by DMRT-ML with the measured snow grain-size profile (α = 1) and the calibrated snow grain-size profile (α = 1.9)

In addition, the values of Ks (Table 2), both at 18.7 and 36.5 GHz, are much lower than those obtained by measurements (Reference Wiesmann, Mätzler and WeiseWiesmann and others, 1998) and modeling (e.g. Reference Chen, Tsang, Guo, Chang and DingChen and others, 2003) for dry snow. In contrast, the absorption coefficients of ∼0.057 m−1 at 18.7 GHz, and 0.220 m−1 at 36.5 GHz (Table 2), are reasonable for dry snow for densities close to 350 kg m−3 (Reference Wiesmann, Mätzler and WeiseWiesmann and others, 1998). This further confirms that Ks is underestimated.
It is also worth noting that in the DMRT the absorption coefficient is independent of grain size. Hence, modifying the snow grain-size profile does not change Ka.
Simulations were repeated with MEMLS and the results show that modeling the brightness temperatures with the measured snow grain-size profile results in a large overestimation at both frequencies, as with DMRT-ML. In addition, the scattering and absorption coefficients are of the same order as those obtained with DMRT-ML.
In conclusion, several arguments support the fact that the deficiency of the models comes from an underestimation of the scattering coefficient due to an underestimation of the grain size.
Calibrated snow grain-size profile
The optical radius profile was scaled by a factor α to drive DMRT-ML, according to:
It is worth noting that the use of such a scaling factor does not change the vertical gradient of the grain-size profile.
The value of α was found by minimizing the mean rmse between the observed and modeled time series of brightness temperature, ![]() and
and ![]() , respectively, at frequency v, using the Nelder–Mead simplex method (Reference Lagarias, Reeds, Wright and WrightLagarias and others, 1998). We define rmse
ν
as:
, respectively, at frequency v, using the Nelder–Mead simplex method (Reference Lagarias, Reeds, Wright and WrightLagarias and others, 1998). We define rmse
ν
as:

where N is the number of days when both valid satellite observations and temperature records were available (N = 345 in 2007). The mean rmse was then calculated:
The minimization gives α equal to 2.50, 2.85 and 1.89 for the DC, ADC and KZ04 relationships, respectively. As expected, α ≫ 1 and the α values significantly increase the grain sizes initially derived from NIR photographs. The reasons why α ≫ 1 can be divided into four classes:
DMRT-ML assumes non-sticky grains, which may be incorrect for snow because it is a sintered material. By considering sticky spheres (Reference Tse, Tsang, Chan, Ding and LeungTse and others, 2007), values of α up to 4 can be obtained, depending on the stickiness parameter (Reference Tsang and KongTsang and Kong, 2001). We did not consider stickiness in our study because, as yet, there is no rigorous way to evaluate it. However, the values of α obtained by optimization (1.89–2.85) may be an indirect evaluation of the stickiness parameter.
Another significant assumption is the use of a single radius per snow layer although snow grain size is usually distributed over a large range. Several studies (e.g. Reference JinJin, 1993; Reference West, Tsang and WinebrennerWest and others, 1993) noted the influence of a distribution in grain size, since large grains scatter much more than small grains in the low-frequency limit (Reference JinJin, 1993). In particular, it was shown that the scattering efficiency produced by a snow layer with a Rayleigh distribution of grain sizes can be modeled considering a single grain size ∼1.4 times larger than the mean snow grain size of the distribution (Reference JinJin, 1993).
α also allows us to compensate for potential uncertainties in the reflectance–SSA relationships (e.g. due to the crystal shape dependence) as seen by the large range (1.89–2.85) obtained by optimization.
α may also compensate for the influence of the grain shape in the microwave domain. This effect is difficult to quantify in the framework of the DMRT. In addition, as the grains at Dome C are mainly rounded or slightly faceted, we think this effect is of second order with respect to the above effects. However, the shape of the grain may be of greater importance in the Arctic where cup-like hoar is common.
Thus, several reasons may explain the value of α in the range 1.89–2.85, but it is difficult to take these effects into account and requires dedicated study. All the following analyses are presented considering the optimal value of α.
For the validity of the modeling, it is important to notice that despite the fact that α ∼ 2, the value of r/λ at 36.5 GHz ranges in average between 0.0650 and 0.075 over the first 1.6 m (i.e. about twice the penetration depth), and is lower than 0.05 at 18.7 GHz along the entire profile. The scaled grain-size profiles used to drive the radiative transfer model thus conform with the Rayleigh assumption (i.e. r/λ < 0.159).
Figure 3b shows the modeled brightness temperature with DMRT-ML driven by a scaled radius profile. For the three relationships, the modeled time series of brightness temperatures are significantly improved and have a magnitude similar to the observed time series. However, over the year, the brightness temperatures were slightly overestimated at 18.7 GHz, whereas they were underestimated at 36.5 GHz. These effects are stronger for ADC than for DC and KZ04.
The lowest mean rmse (1.41 K) was calculated for DC (Table 3). The largest difference, ![]() , was −2.9 K at 36.5 GHz in mid-September 2007 when the snowpack was warming. Another large difference, ∼1.5–2.6 K, appeared in February 2007. At 18.7 GHz, the difference was usually close to 0.5 K during the first half of the year (until mid-June) and close to 1.4 K until mid-October; later the difference decreased to 0.5 K. Modeling results with KZ04 are similar, and the mean rmse is 1.54 K.
, was −2.9 K at 36.5 GHz in mid-September 2007 when the snowpack was warming. Another large difference, ∼1.5–2.6 K, appeared in February 2007. At 18.7 GHz, the difference was usually close to 0.5 K during the first half of the year (until mid-June) and close to 1.4 K until mid-October; later the difference decreased to 0.5 K. Modeling results with KZ04 are similar, and the mean rmse is 1.54 K.
Estimated scaling factor, a, and rmse (K) between observed and modeled brightness temperature, in 2007 for the three relationships, DC, ADC and KZ04. The snow grain size below 3 m depth was fixed at SSA = 9.8 m2 kg−1; the equivalent rz >3m is given for all cases

For ADC, brightness temperature at 18.7 GHz was strongly overestimated (rmse18.7 = 3.60 K) and at 36.5 GHz was largely underestimated (rmse36.5 = 2.95 K). For ADC only, errors at 18.7 GHz are larger than at 36.5 GHz (Table 3).
Nevertheless, the low rmse obtained with DC and KZ04 show that the brightness temperatures were improved compared with previous modeled results (Reference Macelloni, Brogioni, Pampaloni and CagnatiMacelloni and others, 2007).
Using MEMLS and the KZ04 relationship, we obtained a scaling factor of 2.08. The time series were predicted with a mean rmse of 2.38 K, and most of this error was due to an overestimation of the modeled brightness temperatures during the summer. The quality of this result appears slightly lower than that obtained with DMRT-ML.
An interesting point to note is that by using an additional model the scaling factor obtained by optimization with MEMLS (2.08) was close to that found with DMRT-ML (1.89–2.85).
Sensitivity of the modeled brightness temperature to the snow grain size below 3 m depth
NIR photographs are available down to 3 m, but the 18.7 GHz channel has a penetration depth deeper than 3 mat Dome C (Reference Sherjal and FilySherjal and Fily, 1994; Reference Macelloni, Brogioni, Pampaloni and CagnatiMacelloni and others, 2007; Reference Picard, Brucker, Fily, Gallée and KrinnerPicard and others, 2009b). It is worth noting that a constant grain size below 3 m depth is unrealistic. Nevertheless, such an assumption requires fewer unknowns than considering a more complex vertical profile of the grain size. To assess the influence of using a constant grain size below 3 m (r z>3 m), the sensitivity of this parameter was evaluated for the 18.7 GHz frequency. Figure 4 illustrates the large sensitivity of the modeled brightness temperature to the assumption of a constant snow grain size below 3 m depth, while α is kept constant. To model brightness temperature at 18.7 GHz with an rmse lower than 0.5 K, rz >3m must be adjusted with an uncertainty lower than 0.03 mm. This analysis shows the lowest rmse accessible with a primary assumption. The value of rz >3m and the apparent sensitivity of the result to this value, are difficult to interpret. They should not be interpreted as the mean radius below 3 m depth. The reason is that the radiative transfer equation is nonlinear and many different profiles of grain size allow prediction of the observed brightness temperatures (Reference BruckerBrucker, 2010).
The rmse at 18.7 GHz as a function of r z>3m.

From this finding, α and rz >3m are jointly estimated by minimizing the mean rmse (Equation (9)). For the three relationships, the scaling factor, α (Table 4), is lower than for the previous estimates shown in Table 3. The lower mean rmse values were predicted with rz >3m equal to 0.93, 1.14 and 0.80 mm for DC, ADC and KZ04, respectively. These effective radii are larger than those considered in the Methods section, where SSA = 9.8 m2 kg−1, i.e. rz >3m is 12–27% larger than the grain size measured at 3 m depth.
As Table 3, but using a joint estimate of α and r z>3m

As a result, whatever the relationships used to convert reflectance to SSA, the time series of modeled brightness temperature show good agreement with the observations (Fig. 3c). The lowest mean rmse, 0.92 K (Table 4), is predicted for ADC, and the highest is 1.15 K for KZ04.
The amplitudes of the annual cycle, as well as the variations at shorter timescales, caused by rapid air-temperature changes, were accurately modeled at both frequencies. For instance, over July and August, the mean rmse for ADC is 0.46 and 0.53 K at 18.7 and 36.5 GHz, respectively. These errors are lower than the uncertainty of the AMSRE sensor. In Figure 3c, the main disagreement appeared in summer (January to mid-February) and corresponds to an overestimated brightness temperature. This overestimation is present whatever the relationship used to derive the radius. A detailed analysis is presented below in ‘Detailed analysis of the seasonal bias and the summer overestimation’.
It is worth noting that to achieve such a low rmse, the model needs to correctly predict the emissivity and the penetration depth at the two frequencies, i.e. four variables. Hence, even if two coefficients, α and rz >3m, were optimized to obtain these results, the model and the profiles, in particular the value of the SSA measurements, significantly contribute to the quality of the results.
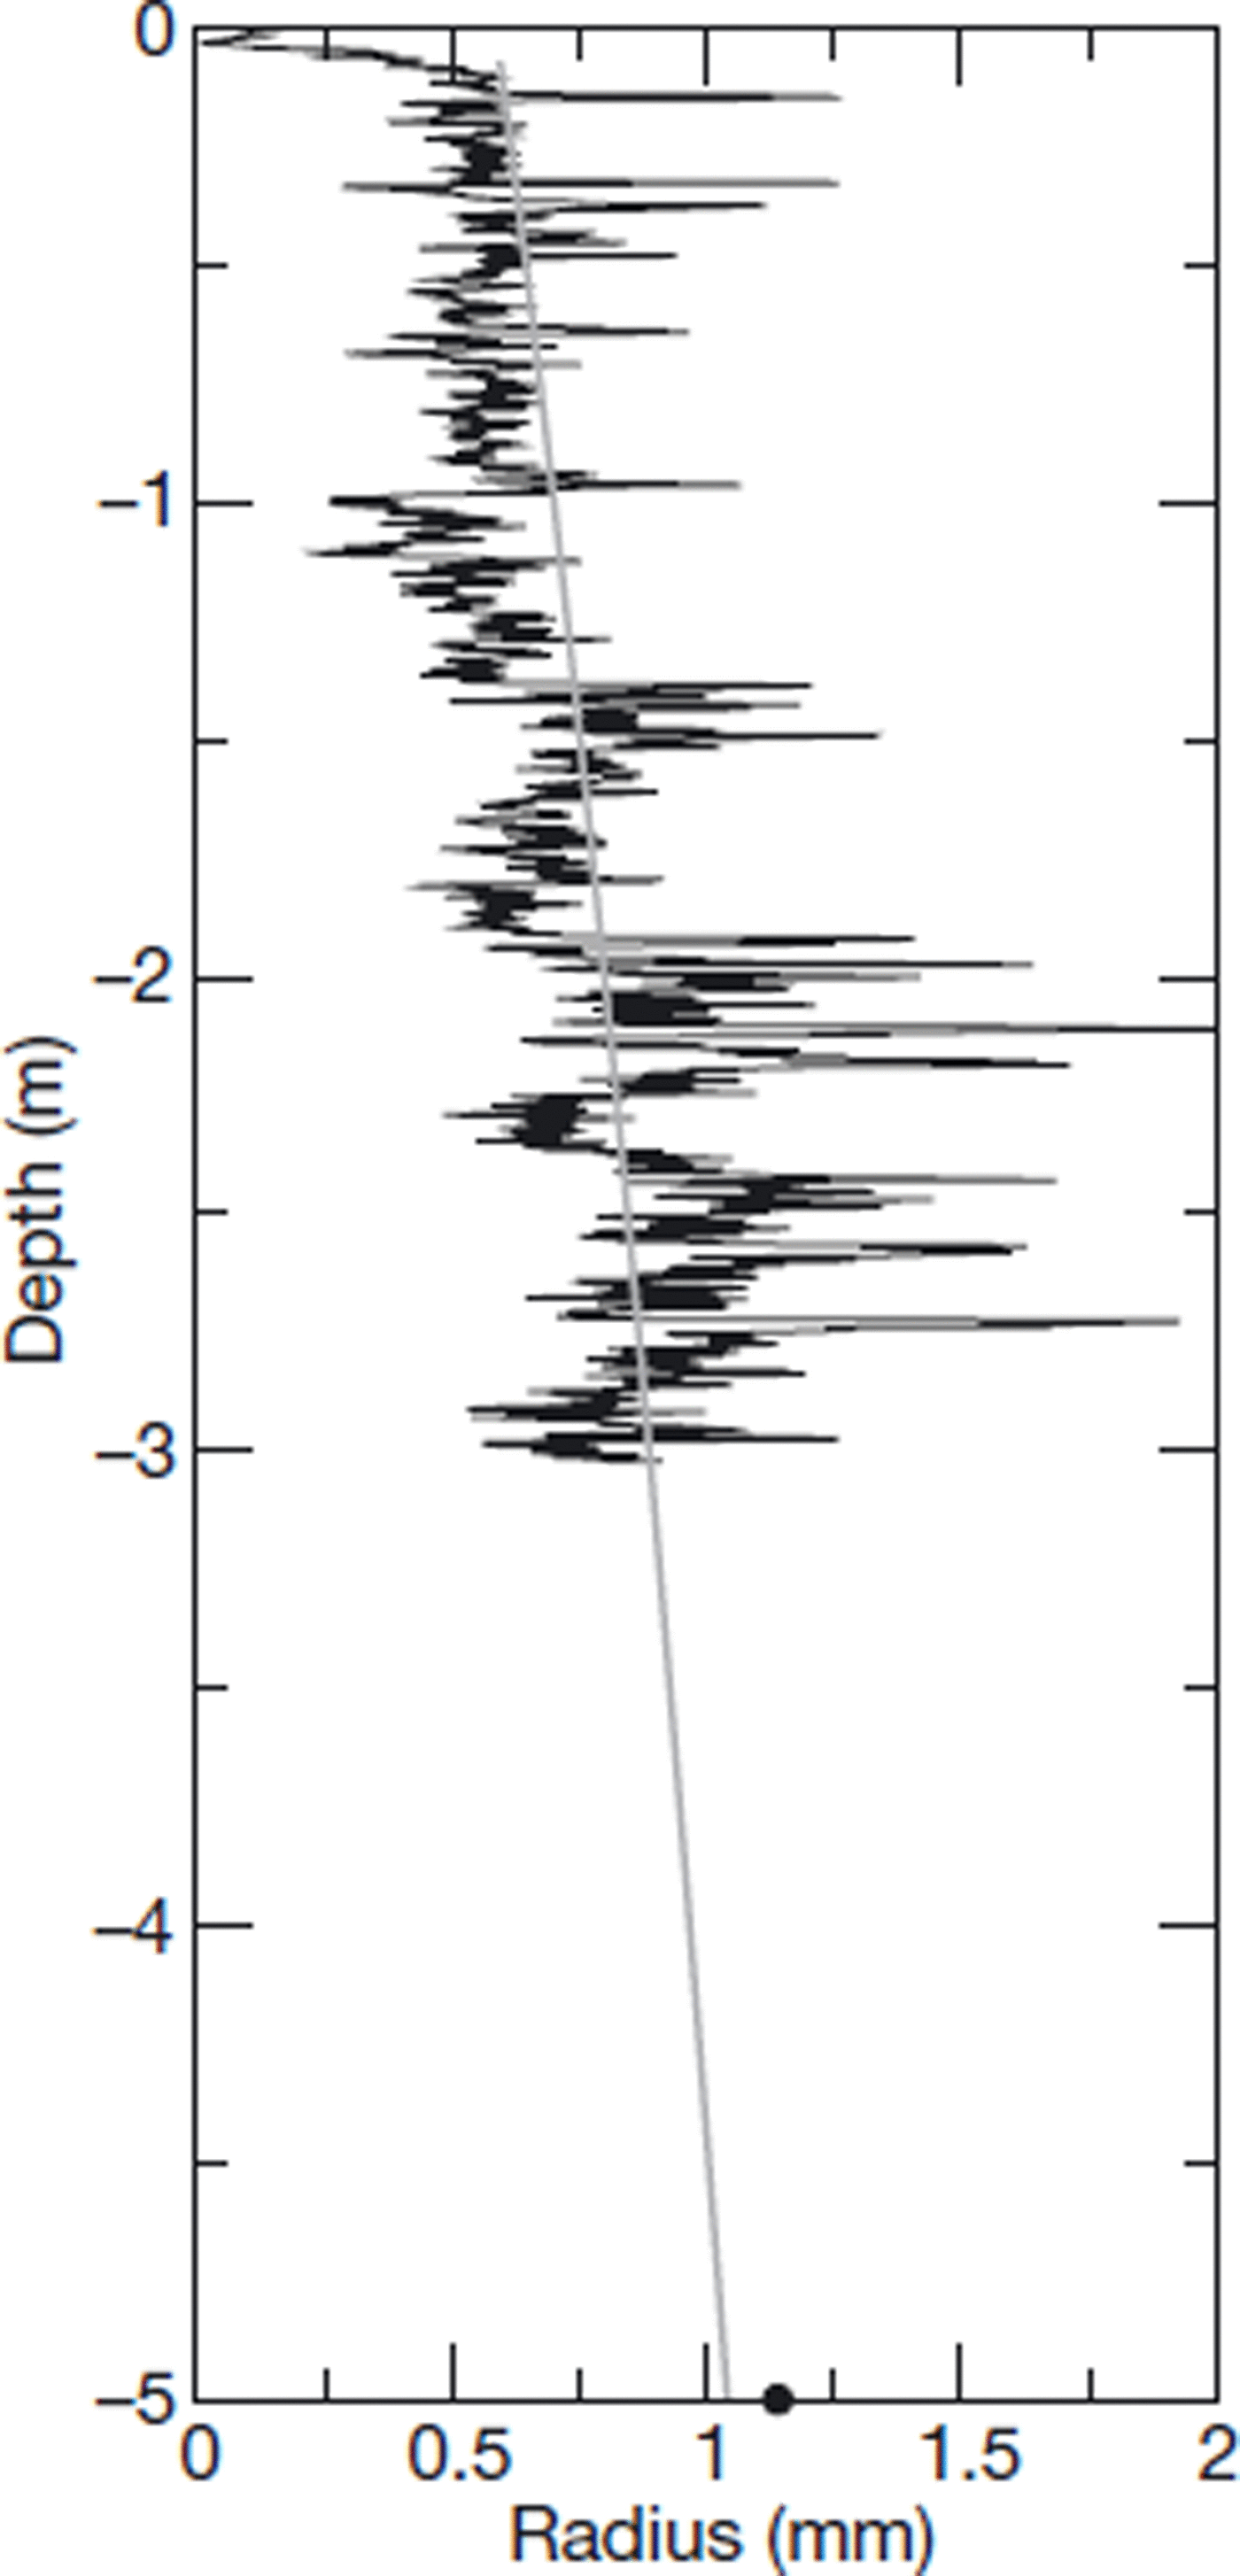
In the following, a validation of the grain-size gradient measured by NIR photography is presented. In order to evaluate the gradient of the SSA measurements using the NIR photography method, the grain-radius profile obtained using the ADC relationship is compared in Figure 5 with an idealized snow grain-size profile deduced using the method presented by Reference Brucker, Picard and FilyBrucker and others (2010) for the pixel containing our snow pit measurements. First, the measured grain-size gradient over the top 3 m is in agreement with the gradient of the idealized profile (Reference Brucker, Picard and FilyBrucker and others, 2010). This validation is independent of the α value. Second, the estimated rz >3m appears close to the idealized profile. Therefore, the estimated rz >3m does not dramatically change the entire grain-size gradient observed using NIR photography.
Snow grain-size profiles obtained using the ADC relationship (black) and derived from Reference Brucker, Picard and FilyBrucker and others (2010) (gray). The dot at 5 m depth corresponds to r z>3m.
Validations in 2008 and 2009
The modeling with parameters optimized in 2007 was validated by predicting brightness temperatures for the period between January 2008 and March 2009. The validations were performed for the three relationships.
During the validation period, the amplitudes of the annual cycle were accurately predicted at both frequencies (Fig. 6) as well as the temperature variations in winter, in particular at 36.5 GHz. But, as shown in Figure 3c for 2007, the largest disagreement occurred in summer at 36.5 GHz with a maximum overestimation of 2.3 K.
Observed (gray curves) and modeled time series of vertically polarized brightness temperature at Dome C between January 2008 and March 2009 at 18.7 and 36.5 GHz using an optimized snow grain-size profile (i.e. α and r z>3m calibrated) for each relationship (DC, ADC and KZ04).

A weak bias, corresponding to a temporal shift of 2 days, appeared during spring 2008. This may be explained by the assumption of a constant snow accumulation during the year. The seasonal bias between observed and modeled brightness temperatures is analyzed in detail in the next subsection.
The mean rmse calculated for 2008 was lower with ADC than with DC or KZ04, and equaled 0.77 K (rmse18.7 = 0.39 K and rmse36.5 = 1.01 K). Surprisingly, these results were slightly better in 2008 than in 2007 (mean rmse = 0.92 K).
Over the whole period, 2007–09 (27 months), the time series of brightness temperature at 18.7 and 36.5 GHz at vertical polarization were predicted with a mean rmse lower than 0.92 K. Owing to the accuracy of the AMSR-E radiometer, lower errors are in the range of uncertainties of the measurement, which are close to 0.7 K. The low values of rmse calculated here in 2008 are good, considering the assumption of constant profile of grain size. Indeed, density and NIR reflectance were measured in December 2006 and used throughout the period January 2007 to March 2009.
In order to better assess the quality of our results, and also to evaluate whether their comparison with only one AMSR-E pixel is adequate, we now analyze the spatial and temporal variability of the measured brightness temperature. The AMSR-E measurements for the pixel containing Dome C are compared with those surrounding the station. Indeed, it is worth noting that the satellite field-of-view dimensions of AMSR-E are (across- × along-track) 15 km × 25 km and 8 km × 14 km at 18.7 and 36.5 GHz, respectively, whereas the product used in this study has a 12.5 km × 12.5 km resolution.
Over the year 2008, the absolute mean annual difference between the pixel containing Dome C and the 3 × 4 pixels surrounding Dome C is 1.3 K at 18.7 GHz, and 1.0 K at 36.5 GHz. Reference Macelloni, Brogioni, Pampaloni and CagnatiMacelloni and others (2007) provide a detailed analysis of the spatial variations in brightness temperature considering a larger area, 25 × 25 pixels, surrounding Dome C. The mean standard deviation of the difference between the observed time series over our field experiment and around it is <0.6 K at both 18.7 and 36.5 GHz. In addition, these standard deviation values remain the same in summer and in winter. Thus, the spatial variations in brightness temperature around Dome C, and the differences in the temporal evolutions, are weak. Using only the AMSR-E pixel containing the area of the in situ measurements is thus appropriate to compare with our modeling results.
Nevertheless, as mentioned earlier, daily-averaged brightness temperatures were used in this study. They result from several observations acquired (1) at different times and thus different near-surface temperatures and (2) from different positions of the satellite and thus with different viewing azimuth angles which make the measurements dependent on the surface roughness (Reference Long and DrinkwaterLong and Drinkwater, 2000).
In order to consider these aspects, we analyzed the swath datasets (i.e. the′AMSR-E/Aqua L2A Global Swath SpatiallyResampled Brightness Temperatures’). We quantified the inter-multipass variability with the averaged difference between the lowest and highest brightness temperature measured during the same day. The inter-multipass variability at 36.5 GHz (18.7 GHz) is 1.99 K (1.91 K) in summer, and 2.04 K (1.98 K) in winter. It is thus independent of the season (and thus of the near-surface temperature) and also of the frequency. We therefore conclude that the disagreement between the observed and modeled brightness temperatures present only in summer and only at 36.5 GHz result neither from an effect of the surrounding pixels nor from variations in the viewing azimuth angle.
Detailed analysis of the seasonal bias and the summer overestimation
Most of the error between observations and modeling results in Figures 3c and 7 is due to seasonal variations. In order to emphasize the weak seasonal bias, the modeled brightness temperatures were plotted as a function of observation for every day in 2007 and 2008 (Fig. 7).
Modeled vs observed brightness temperature during 2007 (a, b) and 2008 (c, d), at 18.7 GHz (a, c) and 36.5 GHz (b, d), using the ADC relationship.

At 36.5 GHz the biases in fall and spring were small and slightly different in 2007 and 2008 (Fig. 7b and d). In contrast, at 18.7 GHz, the bias was very small for both years (Fig. 7a and c).
In the range of depth from which the 36.5 GHz radiation emanates (typically 0.74–2 m in the East Antarctic plateau; Reference Sherjal and FilySherjal and Fily, 1994; Reference SurdykSurdyk, 2002; Reference Macelloni, Brogioni, Pampaloni and CagnatiMacelloni and others, 2007; Reference Picard, Brucker, Fily, Gallée and KrinnerPicard and others, 2009b), the vertical variation of the snow temperature is relatively significant with respect to the bias observed in Figure 7. For instance, the difference in snow temperature is ∼2 K between 0.6 and 0.8 m depth. Hence, if the snow accumulation departs from the constant rate assumed, our calculation of the absolute depth of the probes may be shifted by a few centimeters. This assumption may produce the modeled seasonal bias.
Now, we focus on evaluating whether the summer overestimation in Figures 6 and 7b and d can be attributed to the atmospheric contribution to the top-of-atmosphere measured brightness temperatures. We ran simulations with the atmospheric radiative transfer model RTTOV driven by ECMWF ERA-40 reanalysis data. The objective of the following investigation is only to compare the atmospheric contributions to the brightness temperatures in summer vs winter.
At Dome C, top-of-atmosphere brightness temperatures were, all year round, higher than top-of-snowpack brightness temperatures by 2 K at 18.7 GHz and 1–5 K at 36.5 GHz. The most important point is that, at 36.5 GHz, the offset in winter (June–August) is ∼4.5 K, whereas in summer (December– February) it is ∼3.5 K. Thus, the offset between top-ofsnowpack and top-of-atmosphere brightness temperature is higher in winter than in summer, which rules out using variations in atmospheric properties to explain the summer overestimation of modeled brightness temperatures. The main cause seems to be related to the constant snow grain size and density profiles assumed in our study.
Horizontally polarized brightness temperature
The model was run in 2007 using the three relationships (DC, ADC and KZ04) and parameters from Table 4. The modeled time series of horizontally polarized brightness temperature, at 36.5 GHz, are shown in Figure 8.
Observed (gray curves) and modeled time series of horizontally polarized brightness temperature at Dome C in 2007 at 36.5 GHz using parameters in Table 4 and relationships DC, ADC and KZ04. The arrows indicate locations where a change in surface properties of the snowpack occurred.

For the DC and KZ04 relationships, the magnitude of the modeled time series of brightness temperature was correctly predicted (rmse36.5 is 2.01 K for DC and 2.07 K for KZ04). For ADC, the modeled brightness temperatures are systematically underestimated (rmse36.5 is 2.97 K).
Most of the error comes from incorrect prediction of the rapid variations of brightness temperature (gray arrows in Fig. 8). This can be explained by our assumption of constant surface snow properties (e.g. the impact of surface hoar formation on brightness temperature was not considered; Reference Shuman and AlleyShuman and Alley, 1993).
Brightness temperatures at 18.7 GHz (not shown) were predicted with a rmse18.7 between 7.9 and 10.2 K, depending on the reflectance–SSA relationship used. These large errors are explained by the fact that the penetration depth at 18.7 GHz is 4.27–5.5 m (Reference Sherjal and FilySherjal and Fily, 1994; Reference Macelloni, Brogioni, Pampaloni and CagnatiMacelloni and others, 2007), whereas the snow density profile was measured with a high vertical resolution only down to 3 m. Indeed, microwave observations are acquired at an incident angle where the surface reflection is weak at vertical polarization. However, this is not the case at horizontal polarization, which is thus more influenced by the vertical variations of snow density.
These modeling results indicate that density measurements below 3 m depth were too coarse to predict the horizontally polarized brightness temperature at 18.7 GHz.
Conclusions
A 2 year long time series of vertically polarized brightness temperatures, at 18.7 and 36.5 GHz at Dome C, was predicted using a multilayer electromagnetic model (DMRTML) driven by new snow measurements of temperature, density and grain size. The main novelty was to derive the snow grain-size profile from vertical NIR photographs of a snow pit wall. The optical radius profile was measured down to 3 m depth with a millimeter-scale vertical resolution. Three relationships were tested to convert the vertical NIR reflectance profile into SSA and then into radius profile. The empirical relationship, ADC, based on the largest number of measurements, was slightly better and allowed more accurate modeling results.
As a first step, the snow grain size below 3 m depth was kept constant at the only available measurements (at 4 m depth). Considering the radius profile without any adjustment, results show a large overestimation of brightness temperatures (rmse ≃ 28 K).
For the second step, the radius profile was multiplied by a constant factor of 1.89–2.85. Results were significantly improved (rmse ≃ 1.5 K), which demonstrates that SSA derived from NIR photography is able to provide profiles adequate for microwave modeling if a scaling factor is applied. We gave a qualitative explanation for this scaling factor, but further work is needed to precisely specify the link between SSA and radius in the DMRT.
At the third step, the sensitivity of the snow grain size below 3 m depth was evaluated. With a calibrated scaling factor and a snow grain size below 3 m depth, brightness temperatures were further slightly improved (rmse ≃ 1 K) for all the relationships relating NIR reflectance to SSA. Modeled brightness temperatures at 18.7 GHz present a large sensitivity to grain size below 3 m depth, which emphasizes the need for deep SSA measurements.
We conclude from these simulations that highly resolved vertical profiles of grain size are necessary to model brightness temperatures. To extend this study to the lower frequencies available on AMSR-E (6.9 and 10.7 GHz) much deeper profiles (>10 m) are needed, which cannot be obtained by NIR photography in snow pits.
Furthermore, despite the fact that the spatial variation of brightness temperature measured at Dome C by satellite is weak, a single snow pit may not be representative of the Dome C area at the microwave pixel scale.
In future work, more complex models can be used to consider (1) the various shapes of snow grains, through the stickiness factor; (2) a parameterization of scattering based on the Mie theory, rather than the Rayleigh assumption in the DMRT; and (3) a distribution of grain size in each snow layer. However, these parameterizations require additional variables that are not easy to measure.
Acknowledgements
This work was supported by the French remote-sensing program (Programme National de Télédétection Spatiale), the programs INSU-CNRS (LEFE NIEVE and Méso équipement Glacio Concordia) and the project of the Agence Nationale de la Recherche (ANR-07-VULN-013 VANISH). We thank Centre National d’Etudes Spatiales (CNES) for funding for the program API-THORPEX-CONCORDIASI and the French polar institute, IPEV, for logistical support. M.S. was supported by a grant from SATW ‘Germaine de Staël’.


