





Impact statement
The rising operating temperature in solar modules presents a dual threat of reduced power output and long-term hardware degradation. This review provides a critical assessment of water-cooling strategies for non-concentrating PV modules to help researchers navigate these challenges. By distinguishing between intentional cooling techniques and multi-functional unintentional cooling techniques, this work highlights pathways for increasing PV efficiency while addressing resource constraints. The work provides a detailed review of intentional cooling techniques, such as water spray, water veil and immersion cooling, which use more water. Conversely, using secondary effluent for water veil cooling presents an environmentally friendly solution, as it simultaneously cools the modules and treats the water. The review also emphasizes that while intentional techniques generally provide better temperature control and efficiency improvements, unintentional methods offer unique, sustainable benefits. Furthermore, the enhanced PV temperature drop and efficiency gains from these techniques, compared to unintentional cooling techniques, are discussed in detail. The work also rigorously focuses on multi-functional unintentional cooling techniques, such as floating photovoltaics, photovoltaic/thermal collectors and hybrid PV-solar systems, which offer additional benefits like water evaporation prevention, hot water generation and desalinated water production, respectively. The potential threats of using water to cool PV modules are also discussed. This critical compilation of PV water-cooling techniques will enable researchers to identify and select efficient cooling techniques to effectively enhance PV module performance and durability.
Introduction
Solar energy adoption plays a significant role in fulfilling the United Nations (UN) sustainable development goals (Nastasi et al., Reference Nastasi, Markovska, Puksec, Duic and Foley2022). It has the highest power density (global mean of 170 W/m2) of all the renewable energy sources (Jordehi, Reference Jordehi2016). It can be harvested and utilized in a variety of ways using solar thermal collectors and solar photovoltaic (PV) modules. Historical data indicate that about 3.6% of the global energy production was from solar energy in the year 2022, while solar PV and concentrated solar power (CSP) plants accounted for approximately, 31.0% of the global renewable energy installations (Pourasl et al., Reference Pourasl, Barenji and Khojastehnezhad2023). The global PV installation capacity will rise to 9000 GW by 2050 (Obeidat, Reference Obeidat2018), with levelized electricity cost and installation cost of about 0.014–0.050 USD/kWh and 165–481 USD/kW, respectively (Pourasl et al., Reference Pourasl, Barenji and Khojastehnezhad2023). PV modules convert solar energy to electricity without generating carbon emissions. Moreover, they are easy to install and require only minimal maintenance (Chapin et al., Reference Chapin, Fuller and Pearson1954; Garud et al., Reference Garud, Jayaraj and Lee2021).
PV cells are the major building blocks of PV modules, and more research is being conducted around the world to improve their efficiency (NREL, 2025). There are four generations of PV cells: (a) first-generation – monocrystalline and polycrystalline silicon cells which are fully commercialized and based on silicon technology; (b) second-generation – thin film technologies that use materials such as cadmium telluride, indium copper selenide, amorphous silicon and indium gallium di-selenide; (c) third-generation – multi-junction PV cells, organic PV cells, quantum dot based PV cells; and (d) fourth-generation – metal oxides, metal nanoparticles, carbon nanotubes, graphene and its derivate-based PV cells (Sampaio et al., Reference Sampaio, González, De Vasconcelos, Santos, de Toledo and Pereira2018; Pastuszak and Węgierek, Reference Pastuszak and Węgierek2022). First-, second-, third- and fourth-generation PV cells have conversion efficiencies ranging from 21.2% to 27.6%, 13.0% to 23.6%, 32.9% to 47.6% and 15.07% to 30.1%, respectively (NREL, 2025).
Solar PV modules find wider application in the agriculture, aquaculture, building, rural electrification (Kamalapur and Udaykumar, Reference Kamalapur and Udaykumar2011; Valer et al., Reference Valer, Manito, Ribeiro, Zilles and Pinho2017), defense, food, mining, transportation, water desalination/treatment and many more sectors (Tiwari et al., Reference Tiwari, Mishra and Solanki2011; Pandey et al., Reference Pandey, Tyagi, JAL, Rahim and Tyagi2016; Vivar et al., Reference Vivar, Sharon and Fuentes2024). Hence, it could be foreseen that PV systems will continue to play a significant role in building sustainable communities around the globe. Solar PV modules are widely installed in regions with abundant solar radiation potential and will often operate under harsh environmental conditions. PV module operating temperatures may exceed 70 °C, resulting in significant conversion loss, thermal stress and rapid module degradation (Hasanuzzaman et al., Reference Hasanuzzaman, Malek, Islam, Pandey and Rahim2016; Garud et al., Reference Garud, Jayaraj and Lee2021). The negative effects associated with high operating temperature on PV modules can be rectified by proper cooling (Hasanuzzaman et al., Reference Hasanuzzaman, Malek, Islam, Pandey and Rahim2016; Garud et al., Reference Garud, Jayaraj and Lee2021). Moreover, effective cooling methods are essential not only for dissipating the accumulated heat energy but also for enhancing conversion efficiency and longevity of PV modules (Garud et al., Reference Garud, Jayaraj and Lee2021).
PV module can be cooled passively, actively or in combination (passive + active) (Abd-Elhady et al., Reference Abd-Elhady, Elhendawy, Abd-Elmajeed and Rizk2025). Passive methods use the movement of coolant fluid, owing to density differences caused by temperature rise to cool the PV modules. In active methods, PV modules are cooled by pumping or blowing coolant fluid over the PV modules with the aid fans or blowers (Majumder et al., Reference Majumder, Kumar, Innamorati, Mastino, Cappellini, Baccoli and Gatto2013). Active systems require an external power source for operation, whereas passive systems operate without any additional energy input (Pathak et al., Reference Pathak, Sharma, Goel, Bhattacharyya, Aybar and Meyer2022; Sharaf et al., Reference Sharaf, Yousef and Huzayyin2022). Passive methods include the addition of fins (extended surfaces) (Cabo et al., Reference Cabo, Nizetic, Giama and Papadopoulos2020), radiative cooling (selective coating facilitating emission at a wavelength transparent to the earth’s atmosphere) (Zhu et al., Reference Zhu, Raman, Wang, Anoma and Fan2014), phase change materials (conduction cooling) (Kandeal et al., Reference Kandeal, Algazzar, Elkadeem, Thakur, Abdelaziz, El-Said, Elsaid, Kandel, Fawzy and Sharshir2021), heat pipes (evaporation of liquids under sealed conditions) (Gad et al., Reference Gad, Mahmoud, Ookawara and Hassan2023) and evaporative cooling (phase change of water to vapor at temperature lower than boiling point). Active methods include thermoelectric cooling (Peltier effect) (Mariam et al., Reference Mariam, Ramasubramanian, Reddy, Dalapati, Ghosh, Sherin, Chakrabortty, Motapothula, Kumar, Ramakrishna and Krishnamurthy2024), liquid-based, heat pump-based, and air-based photovoltaic-thermal (PV/T) systems (Sultan and Efzan, Reference Sultan and Efzan2018).
Emerging passive cooling techniques involve the use of high-thermal-conductivity materials – graphene foils, carbon-nanotube (CNT) pads, metal foams and vapor chambers – to spread heat laterally before dissipating it into the environment. These materials reduce local hotspots, enhance temperature uniformity and can lower peak temperatures by 5–12 °C. They require no pumps or external power, making them ideal passive enhancements for conventional modules. However, challenges include material cost, integration with back sheets and long-term stability of nanomaterial layers (Saadah et al., Reference Saadah, Hernandez and Balandin2017). Two-phase cooling actively induces nucleate boiling of a coolant at the PV’s rear surface. The phase change process provides extremely high heat flux removal, allowing rapid thermal stabilization even under transient irradiation. Systems may employ spray boiling, pool boiling, or thin-film evaporation mechanisms. Typical temperature reductions range from 25 to 40 °C, significantly enhancing efficiency in concentrated photovoltaic applications. However, stability of the boiling regime, material compatibility, vapor handling and system safety remain key concerns (Skoplaki and Palyvos, Reference Skoplaki and Palyvos2009). Non-contact spectral splitting devices selectively redirect near-infrared (NIR) wavelength which are responsible for most heat, to a thermal absorber or entirely reject them, while allowing visible wavelengths to reach the PV cell. This reduces thermal load without physical contact or coolant circulation. The technologies include luminescent down-shifting layers, photonic reflective coatings and NIR-reflective filters. These can reduce module temperature by 5–10 °C while improving electrical output (Zhang et al., Reference Zhang, Shen, Zhang and Pu2022).
It is interesting to note that water has been used for both passive and active cooling of PV modules (Raad et al., Reference Raad, Ali, Faraj, Castelain, Chahine and Khaled2025). Water can be used for passive cooling by immersing the modules or positioning them on a water surface (Smith et al., Reference Smith, Selbak, Wamser, Day, Krieske, Sailor and Rosenstiel2014). In active cooling systems, water can be applied to either the top or bottom surface of the module (Janowicz et al., Reference Janowicz, Pomorski and Kolasiński2025). To cool the top surface, a thin layer of water may be allowed to flow or sprayed over the module. Water can be sprayed directly on its bottom surface or circulated through a heat exchanger that is placed in contact with the module’s rear surface (Sargunanathan et al., Reference Sargunanathan, Elango and Mohideen2016). Additionally, water flow/spray helps to maintain the PV module clean by removing dust. This is particularly advantageous in PV modules installed in desert, agricultural and industrial environments (Janowicz et al., Reference Janowicz, Pomorski and Kolasiński2025).
The limitations associated with the non-water-based PV module cooling techniques are listed below:
-
• Fins – increase PV module bulkiness, dust and debris built up deteriorate effectiveness and also make cleaning and maintenance difficult.
-
• Radiative cooling – difficulty in identifying suitable coating materials, coatings are costly and pose condensation hazards (Alao et al., Reference Alao, SIUH, Sopian, Alao and Aslam2025).
-
• Phase change materials – add weight to the PV module, high cost, contain chemical components and require proper selection.
-
• Heat pipes/use of refrigerants – safety-related issues due to the risk of chemical fluid/gas leakage, especially when applied to the PV systems installed in remote and rural regions with unskilled communities.
-
• Thermo-electric coolers – lower efficiency, high cost and consume additional power for operation (Siecker et al., Reference Siecker, Kusakana and Numbi2017; Mariam et al., Reference Mariam, Ramasubramanian, Reddy, Dalapati, Ghosh, Sherin, Chakrabortty, Motapothula, Kumar, Ramakrishna and Krishnamurthy2024).
-
• Air – widely available but has a lower specific heat capacity, thereby requiring a higher flow rate to remove heat from PV modules. Moreover, forced air circulation is less efficient than forced water circulation (Chandel and Agarwal, Reference Chandel and Agarwal2017; Siecker et al., Reference Siecker, Kusakana and Numbi2017).
The advantages of water include the following:
-
• Availability – widely available in several forms, including fresh water, salt water, wastewater and rainwater.
-
• Optical benefits – The presence of the water layer reduces light reflection and improves refraction.
-
• Co-generation aspects – hot water, desalinated water and treated water can be produced by utilizing the PV module’s waste heat energy.
-
• Disposal – handling water is well known to humans. In general, no potential environmental impacts are associated with its disposal.
The observations from earlier literature indicate that water-based PV module cooling techniques are advantageous and attractive in comparison to the other techniques. Hence, in this review work, an effort has been made to explore and expose various water-based cooling techniques with particular focus on non-concentrating PV modules. The novelty of this review lies in classification of the techniques and highlights their operation, performance, advantages and limits to aid further research for improvement. This review work has been organized into 13 sections with introduction to the topic presented in section “Introduction.” Section “Impact of cooling on PV module electrical characteristics” provides information on PV module’s operating temperature impact on its electrical characteristics. Section “Classification of water-based PV module cooling techniques” discusses the classification of intentional and unintentional water-based PV module cooling techniques. Sections “Literature review on intentional PV module water-cooling techniques” and “Literature review on unintentional PV module water-cooling techniques” elaborate various research works on intentional and unintentional water-cooling techniques along with their advantages and limitations. Potential hazards of water on PV module and impact of water circulation pump on module cooling are discussed in Sections “Potential hazards of water seepage in PV modules” and “Impact of water circulation pump power consumption,” respectively. In Section “Electrical and power electronics implication in PV module water cooling,” electrical and power electronics implications in PV module water cooling have been discussed. Section “Comparison of PV module water-cooling techniques” provides a detailed comparison of various water-cooling techniques. Economics and CO2 emission mitigation evaluation procedure have been briefly introduced in Sections “Economics evaluation of PV module water-cooling techniques” and “CO2 emission mitigation potential of PV module water-cooling techniques,” respectively. Scope for further research works and major takeaway from this review work have been presented in Sections “Scope for future research works” and “Conclusion,” respectively. Concentrated PV, end use of recovered waste heat energy and theoretical models for cooling techniques have not been discussed in this review work. The authors believe that this review will be an effective, accessible and informative short guide for both early career and experienced researchers interested in solar energy, energy efficiency, PV module cooling and water-energy nexus-based research.
Impact of cooling on PV module electrical characteristics
Solar cells are simple P-N junction semiconductor diodes that are sensitive to the solar spectrum (Jordehi, Reference Jordehi2016). When sunlight falls on the solar cell, electron–hole pairs are generated. If the incident photon energy exceeds the solar cell’s band gap energy, electricity is produced; else the generated electron–hole pairs recombine producing heat energy and increased solar cell’s operating temperature (Huen and Daoud, Reference Huen and Daoud2017). Due to limited ability of PV cell in converting the entire solar spectrum to electricity, a larger portion of the incident solar radiation will be converted into heat. This phenomenon also increases operating temperature. Additionally, non-uniform solar irradiation distribution across the PV surface causes uneven temperature distribution (Li et al., Reference Li, Sun, Li, Zhuang, Liang and Pang2021).
The operating temperature of PV cell or module (TPV in °C) can be predicted using NOCT (Nominal Operating Cell Temperature), ambient temperature (Ta in °C) and incident solar irradiation (G in W/m2) (Chandel et al., Reference Chandel, Chandel and Khosla2024). The NOCT is the temperature attained by the PV cell/module temperature under open-circuit circumstances when operating at 800 W/m2 solar irradiation, 20 °C ambient temperature and 1 m/s wind speed.

The impact of PV module’s operating temperature on its open-circuit voltage (VOC), short-circuit current (ISC), module electrical conversion efficiency (
$ {\eta}_{PV} $
 ) and maximum power output (Pmax) can be evaluated through the following equations (Kaplani and Kaplanis, Reference Kaplani and Kaplanis2014; Gu et al., Reference Gu, Ma, Shen, Li, Zhang and Zhang2019; Mallal et al., Reference Mallal, Sharma, Bahir and Hassboun2021; Sharon and Vivar, Reference Sharon and Vivar2025).


$ {V}_{OC, STC,} $ $ {I}_{SC, STC,} $ $ {P}_{\mathit{\max}, STC} $
 and
$ {\eta}_{PV, STC} $
and
$ {\eta}_{PV, STC} $
 are the open-circuit voltage, short-circuit current, maximum power output and electrical efficiency of the PV module, respectively, at standard testing conditions (1000 W/m2, cell temperature of 25 °C and air-mass ratio of 1.5).
$ {\alpha}_{T, PV} $
are the open-circuit voltage, short-circuit current, maximum power output and electrical efficiency of the PV module, respectively, at standard testing conditions (1000 W/m2, cell temperature of 25 °C and air-mass ratio of 1.5).
$ {\alpha}_{T, PV} $
 ,
$ {\beta}_{T, PV} $
,
$ {\beta}_{T, PV} $
 and
$ {\gamma}_{T, PV} $
and
$ {\gamma}_{T, PV} $
 are the temperature coefficients of module short-circuit current, open-circuit voltage and maximum power output, respectively. The value of
$ {\gamma}_{T, PV} $
are the temperature coefficients of module short-circuit current, open-circuit voltage and maximum power output, respectively. The value of
$ {\gamma}_{T, PV} $
 ranges between −0.4 and −0.5%/K (Kaplani and Kaplanis, Reference Kaplani and Kaplanis2014; Gu et al., Reference Gu, Ma, Shen, Li, Zhang and Zhang2019).
$ \delta $
ranges between −0.4 and −0.5%/K (Kaplani and Kaplanis, Reference Kaplani and Kaplanis2014; Gu et al., Reference Gu, Ma, Shen, Li, Zhang and Zhang2019).
$ \delta $
 is the solar irradiation coefficient and is about 0.085 for monocrystalline and 0.11 for polycrystalline modules (Kaplani and Kaplanis, Reference Kaplani and Kaplanis2014). The value of
$ {\alpha}_{T, PV} $
is the solar irradiation coefficient and is about 0.085 for monocrystalline and 0.11 for polycrystalline modules (Kaplani and Kaplanis, Reference Kaplani and Kaplanis2014). The value of
$ {\alpha}_{T, PV} $
 has been reported as +0.05%/K (Sharon and Vivar, Reference Sharon and Vivar2025), +0.36%/K (Yildirim et al., Reference Yildirim, Cebula and Sulowicz2022) and +0.43%/K (Bevilacqua et al., Reference Bevilacqua, Bruno, Rollo and Ferraro2022) in literature. The value of
$ {\beta}_{T, PV} $
has been reported as +0.05%/K (Sharon and Vivar, Reference Sharon and Vivar2025), +0.36%/K (Yildirim et al., Reference Yildirim, Cebula and Sulowicz2022) and +0.43%/K (Bevilacqua et al., Reference Bevilacqua, Bruno, Rollo and Ferraro2022) in literature. The value of
$ {\beta}_{T, PV} $
 was about −0.34%/K for polycrystalline module (Sharon and Vivar, Reference Sharon and Vivar2025).
$ {V}_{OC, STC} $
was about −0.34%/K for polycrystalline module (Sharon and Vivar, Reference Sharon and Vivar2025).
$ {V}_{OC, STC} $
 ,
$ {I}_{SC, STC} $
,
$ {I}_{SC, STC} $
 ,
$ {P}_{\mathit{\max}, STC} $
,
$ {P}_{\mathit{\max}, STC} $
 ,
$ {\eta}_{PV, STC} $
,
$ {\eta}_{PV, STC} $
 , NOCT,
$ {\alpha}_{T, PV} $
, NOCT,
$ {\alpha}_{T, PV} $
 ,
$ {\beta}_{T, PV} $
,
$ {\beta}_{T, PV} $
 and
$ {\gamma}_{T, PV} $
and
$ {\gamma}_{T, PV} $
 values are usually provided by the manufacturer in the PV module data sheet. Modules that are more sensitive to temperature are suitable for use in the winter season than in summer, as temperature rise has a negative impact on module power output (Ebhota and Tabakov, Reference Ebhota and Tabakov2023).
Impact of operating temperature on PV cell’s open-circuit voltage, short-circuit current and electrical efficiency is shown in Figure 1a (Singh et al., Reference Singh, Singh, Lal and Husain2008). Short-circuit current is the maximum current produced by a solar cell when the voltage is zero, which is achieved by short circuiting the external circuit. Increasing operating temperature reduces the band gap energy and helps generation of more electron–hole pairs. However, this effect is very small, leading to only a slight increment in short-circuit current (PV education, 2026). Open-circuit voltage (
$ {V}_{OC} $
 ) is the maximum voltage produced by a solar cell when the current flow is zero. The equation relating open-circuit voltage, diode ideality factor (n), temperature (T in Kelvin) and photo-current (
$ {I}_{ph} $
) is the maximum voltage produced by a solar cell when the current flow is zero. The equation relating open-circuit voltage, diode ideality factor (n), temperature (T in Kelvin) and photo-current (
$ {I}_{ph} $
 ) are given as follows (PV education, 2026):

(a) Influence of operating temperature on PV cell short-circuit current, open-circuit voltage and efficiency (Singh et al., Reference Singh, Singh, Lal and Husain2008). (b) Influence of operating temperature on PV cell power output (Radziemska, Reference Radziemska2003).

Figure 1. Long description
Panel a at the top plots temperature in kelvin on the x-axis from 295 to 320. The left y-axis shows I sub s c in amperes and V sub o c in volts, ranging from 0.56 to 0.64. The right y-axis shows efficiency in percent from 8.7 to 9.9. Three data series are plotted: I sub s c as filled circles, V sub o c as filled triangles, and efficiency as open diamonds. I sub s c shows a slight increase with temperature, V sub o c and efficiency both decrease linearly as temperature rises. Panel b below plots U sub L in volts on the x-axis from 0 to 0.6 and P sub L in watts on the y-axis from 0 to 0.4. Four curves are shown for temperatures 28 degrees Celsius (triangles), 40 degrees Celsius (squares), 60 degrees Celsius (diamonds), and 80 degrees Celsius (circles). Each curve rises to a peak then falls, with the peak power output decreasing and shifting left as temperature increases. The legend on the right of panel b labels each curve by temperature.
The open-circuit voltage of a PV cell/module drops with increasing operating temperature. This is because as temperature increases, the leakage current (
$ {I}_o $
 ) rises rapidly due to changes in intrinsic carrier concentration (Dhass et al., Reference Dhass, Prakash and Ramya2020). However, the temperature changes have little effect on photocurrent (
$ {I}_{ph} $
) rises rapidly due to changes in intrinsic carrier concentration (Dhass et al., Reference Dhass, Prakash and Ramya2020). However, the temperature changes have little effect on photocurrent (
$ {I}_{ph} $
 ). The ratio of the electrical power output (
$ {P}_{max} $
). The ratio of the electrical power output (
$ {P}_{max} $
 ) per m2 to the input solar power (Pin) per m2 represents the electrical efficiency (
$ \eta \Big) $
) per m2 to the input solar power (Pin) per m2 represents the electrical efficiency (
$ \eta \Big) $
 . The electrical efficiency of a PV module of area “A m2” exposed to the solar irradiation “G W/m2” is calculated as follows:

The PV module’s power output and electrical efficiency can be predicted using fill factor (FF), which is affected by module temperature. Fill factor represents the ratio of actual maximum power output (Pmax) to ideal maximum power output, which is calculated by multiplying the short-circuit current (ISC) and the open-circuit voltage (VOC) (Kalogirou, Reference Kalogirou2009).


Electrical efficiency of PV cell is highest at low cell temperatures and drops with rising temperatures. Electrical efficiency of a solar cell drops by about 1.0% to 6.0% for every 10 °C rise in operating temperature (Dubey et al., Reference Dubey, Sarvaiya and Seshadri2013). The variation in solar cell’s power output with operating temperature is shown in Figure 1b (Radziemska, Reference Radziemska2003). As the operating temperature increases, power output drops significantly by about 0.65% for every one-degree Celsius rise in operating temperature (Radziemska, Reference Radziemska2003). Power output is heavily influenced by open-circuit voltage, which is highly affected by the operating temperature in a negative way. The negative impact of operating temperature on module electrical characteristics highlights the need for efficient module cooling arrangements for improved long-term performance (Hudișteanu et al., Reference Hudișteanu, Cherecheș, Țurcanu, Hudișteanu and Romila2024). The relationship between the power output, open-circuit voltage and short-circuit current was provided by (Anderson, Reference Anderson1996)

Classification of water-based PV module cooling techniques
Water-based PV module cooling techniques has been classified as intentional and non-intentional cooling techniques in this work and are displayed in Figure 2. The main motive of intentional cooling techniques is to reduce the module operating temperature. The main motive of unintentional cooling techniques is not module cooling, but it may lead to reduced module temperature as an additional benefit. Intentional PV module water-cooling techniques include evaporative cooling, spray cooling, veil cooling and immersion cooling. Unintentional PV module water-cooling techniques include floating PV, PV/T systems and hybrid-PV-solar stills.
Classification of water-based PV module cooling methods.
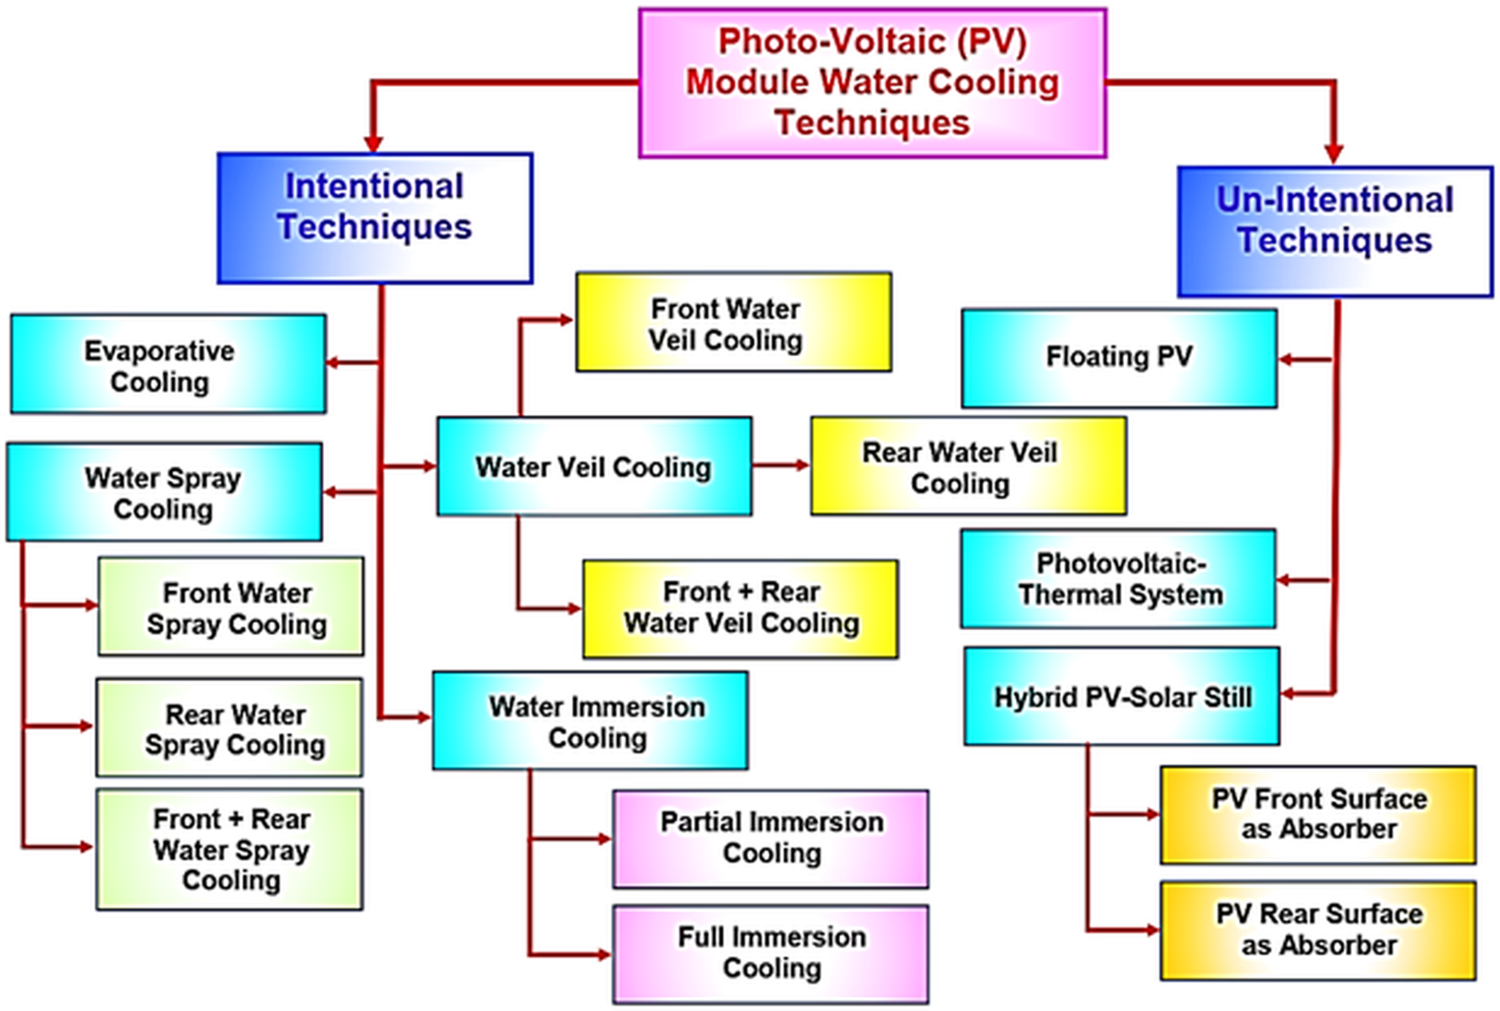
Figure 2. Long description
At the top center is the main label Photo-Voltaic P V Module Water Cooling Techniques. Two arrows branch horizontally to Intentional Techniques on the left and Un-Intentional Techniques on the right. Under Intentional Techniques, vertical branches list Evaporative Cooling and Water Spray Cooling, which further divides into Front Water Spray Cooling, Rear Water Spray Cooling, and Front plus Rear Water Spray Cooling. Another branch leads to Water Veil Cooling, which splits into Front Water Veil Cooling, Rear Water Veil Cooling, and Front plus Rear Water Veil Cooling. Water Immersion Cooling branches into Partial Immersion Cooling and Full Immersion Cooling. Under Un-Intentional Techniques, branches list Floating P V, Photovoltaic-Thermal System, and Hybrid P V-Solar Still, with the latter splitting into P V Front Surface as Absorber and P V Rear Surface as Absorber. All text is color-coded by category and subcategory.
Cooling of the module enhances power output. The actual enhancement in power output and the percentage enhancement in power output due to cooling can be evaluated by Eqn. (11) and (12), respectively.


The percentage enhancement in energy, fill factor and electrical efficiency of the cooled module in comparison to the uncooled module can be evaluated by


The cooling rate (Cr) of PV module can be represented as the rate of the temperature difference (dT) between the PV module with and without water cooling over a time period (tm), and it can be estimated as follows:

Literature review on intentional PV module water-cooling techniques
Evaporative cooling
Evaporative cooling (i.e., reduction in temperature) occurs when water is evaporating into the surrounding air (Yang et al., Reference Yang, Cui and Lan2019). It was facilitated in PV modules by attaching wetted capillary wicks over its rear surface with the support of metal mesh and/or thermal paste (Dida et al., Reference Dida, Boughali, Bechki and Bouguettaia2021; Chea et al., Reference Chea, Deethayat, Kiatsirriroat and Asanakham2023). Common wick materials that have been employed for PV module evaporative cooling were cotton, jute (burlap), hydrophilic (cellulose) pads, coir, cloth and clay. The schematic highlighting module evaporative cooling concept with wetted wick and module wick support structures is shown in Figure 3. Continuous wetting of the wick can be facilitated by an overhead water container/tank utilizing gravity or pumping (Mahmood and Aljubury, Reference Mahmood and Aljubury2022; Zizak et al., Reference Zizak, Domjan, Medved and Arkar2022). The lowest temperature that could be achieved by evaporative cooling is the wet bulb temperature. The magnitude of evaporative cooling achieved will depend on ambient temperature, relative humidity, module temperature, wind speed, evaporative cooling pad thickness and water mass flow rate.
(a) Concept of PV module evaporative cooling with wetted wicks. (b) Metal mesh support arrangement for the installed wick.
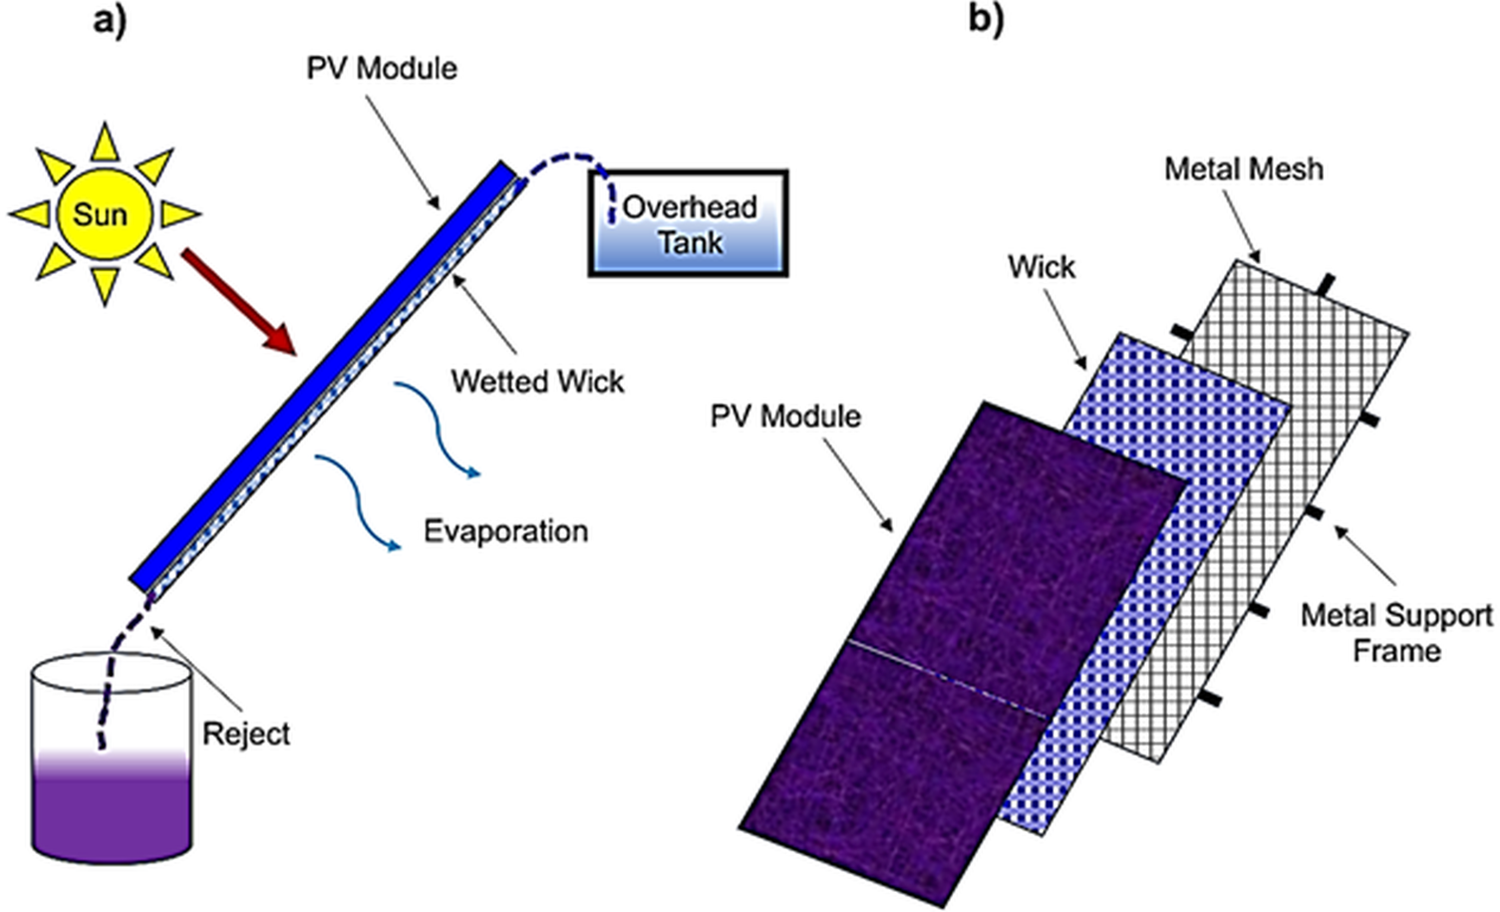
Figure 3. Long description
Panel a illustrates the process of PV module evaporative cooling. At the top left, a sun icon emits a red arrow toward a slanted PV module labeled ‘PV Module.’ Below the module, a layer labeled ‘Wetted Wick’ is shown, with blue arrows labeled ‘Evaporation’ pointing away from it. A dashed line from an ‘Overhead Tank’ at the top right leads to the wick, indicating water supply. Another dashed line runs from the lower end of the module to a cylindrical container labeled ‘Reject,’ representing water runoff. Panel b shows an exploded view of the physical arrangement. At the back is a rectangular grid labeled ‘Metal Support Frame,’ overlaid by a finer grid labeled ‘Metal Mesh.’ On top of the mesh is a layer labeled ‘Wick,’ and the uppermost layer is the ‘PV Module.’ Each layer is offset to reveal the structure beneath.
A clay layer of 2 mm thickness wetted with water seems to reduce module operating temperature by 40 °C while improving its power output by 19% (Alami, Reference Alami2014). Chandrasekar et al. (Reference Chandrasekar, Suresh, Senthilkumar and Karthikeyan2013) observed module temperature reduction by 20 °C and 6–9 °C using cotton wick wetted by water and nanofluid, respectively. Water-wetted cotton wick has also improved the electrical output of the module by 14% (Chandrasekar and Senthilkumar, Reference Chandrasekar and Senthilkumar2015). Nanoparticles were found to block wick pores indicating nanofluids to be inefficient for long-term evaporative cooling (Chandrasekar et al., Reference Chandrasekar, Suresh, Senthilkumar and Karthikeyan2013). Module evaporative cooling with water-wetted cotton wicks resulted in an operating temperature of about 4 °C lower than that observed with the metal fin-cooled PV module (Alktranee and Peter, Reference Alktranee and Peter2023). Haidar et al. (Reference Haidar, Orfi and Kaneesamkandi2018) observed a 20 °C drop in module operating temperature and a 14% increment in electric power output by using the cotton cloth wick that was wetted continuously by water at a rate of 1 L/h. Dida et al. (Reference Dida, Boughali, Bechki and Bouguettaia2021) observed 20 °C temperature reduction and 14.75% power output increment in a module with burlap cloth wetted continuously by water at a rate of 0.39 L/h.
Haidar et al. (Reference Haidar, Orfi and Kaneesamkandi2021) lowered the module’s operating temperature by 10 °C, by blowing air over water flowing in a channel that was installed beneath the PV module, resulting in 5.0% power output increment. Improving wick wetting rate (180 L/h) and forcing air (3 m/s) over the wetted 150-mm thick cellulose pad wick reduced module operating temperature and improved electrical efficiency by 20 °C and 11.2%, respectively (Mahmood and Aljubury, Reference Mahmood and Aljubury2022). Chea et al. (Reference Chea, Deethayat, Kiatsirriroat and Asanakham2023) observed a 15–23 °C module temperature drop and 15% power output increment by utilizing 5-mm thick hybrid cellulose-polypropylene wick wetted with water continuously at a rate of 18 L/h. Wetted cotton-porous cellulose fiber wick of 1 mm thickness glued to the rear surface of PV module reduced operating temperature and improved electrical power output by 20.1 °C and 9.6%, respectively. The water consumption of this technique was noticed to be about 8.2 L/m2d and 11.5 L/m2d in continental and desert climates, respectively (Zizak et al., Reference Zizak, Domjan, Medved and Arkar2022). In general, evaporative cooling of 1 m2 PV module requires 1–3 m2 roof area and 50–150 L/d of water (Zizak et al., Reference Zizak, Domjan, Medved and Arkar2022).
Comments on evaporative cooling of PV module
-
a. Simple concept and does not require complex arrangements.
-
b. Cheap wicks and natural fibers can be utilized for this process.
-
c. Water of any quality can be used.
-
d. Wetting of wick can be achieved by natural capillary effect aided by an overhead tank.
-
e. Algae growth and salt/slit deposits on the wetted wick may hinder effectiveness of evaporative cooling, indicating the importance of regular maintenance.
-
f. Requirement of water for this process may limit its application in water scarce regions.
-
g. High relative humidity might significantly impact evaporative cooling performance, making it not suited for humid environments.
Water veil cooling
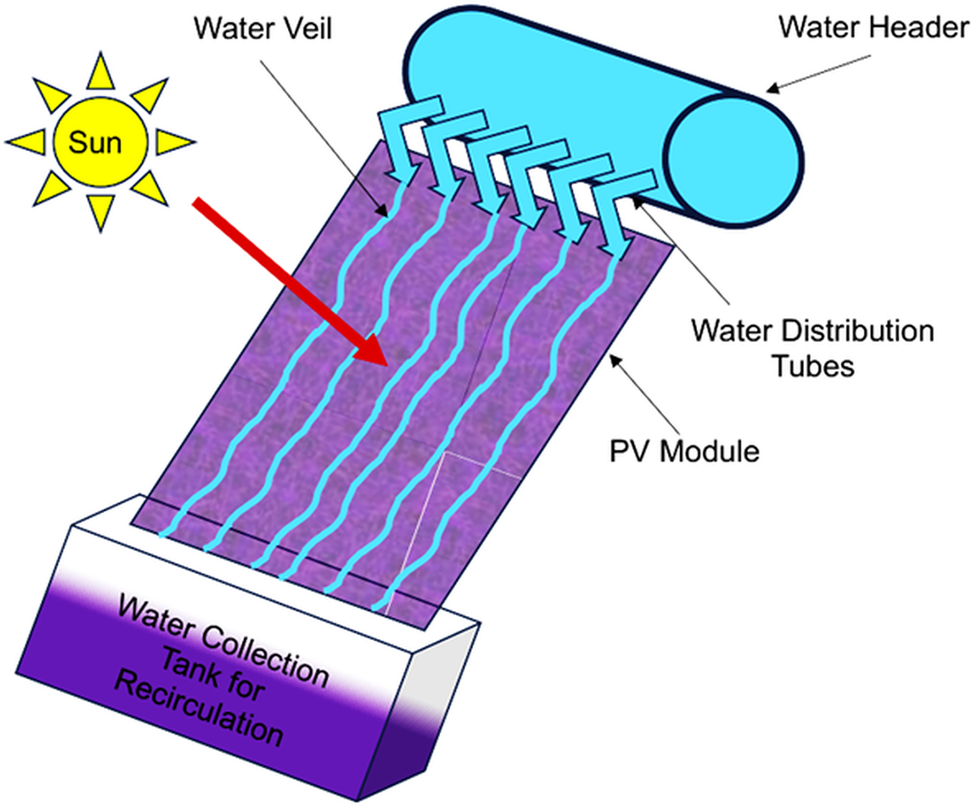
Water veil cooling in PV modules can be achieved by flowing thin water film above, below or on both sides of it with the aid of a number of syringes or nozzles that are arranged in line and connected to a common water header as shown in Figure 4. The water flow can be facilitated with the aid of gravity or by pumps (Nizetic et al., Reference Nizetic, Giama and Papadopoulos2018). The flowing water layer removes the waste heat energy from the PV module through convection by undergoing sensible heating. Magnitude of cooling that can be achieved using a water veil will depend on flowing water temperature, PV module temperature, water velocity and heat transfer coefficient between the PV surface and the flowing water. Front surface water veil cooling has helped to maintain the module temperature at least 15 °C lower than the reference uncooled module. This technique of cooling has been recommended for modules installed in hot regions and on metal roofs. Peak water loss due to evaporation in a PV module water veil cooling arrangement at Portland University in the United States was noticed to be about 1.1 L/m2h (Smith et al., Reference Smith, Selbak, Wamser, Day, Krieske, Sailor and Rosenstiel2014). In Laos, a front surface water veil flow rate of about 360 L/h reduced the module operating temperature by about 29.2 °C (Chanphavong et al., Reference Chanphavong, Chanthaboune, Phommachanh, Vilaida and Bounyanite2022). Six months of operation with front surface water veil PV module cooling indicated a stronger cooling effect in summer than in winter. Moreover, module temperature was reduced by 15 °C, and energy generation improved by 2.3% to 6.0%. However, module degradation due to deposition caused by evaporation of the flowing water has also been reported, emphasizing the importance of water quality analysis before employing the same for long-term front surface water veil cooling (Silva et al., Reference Silva, Martinez, Heideier, Bernal, Gimenes, Udaeta and Saidel2021).
Water veil cooling of PV module with the aid of nozzle and header arrangement.
Moharram et al. (Reference Moharram, Abd-Elhady, Kandil and El-Sherif2013) found that commencing water veil cooling at 45 °C increased net energy output from PV module by 5.0% compared to commencement at 40 °C. Saxena et al. (Reference Saxena, Deshmukh, Nirali and Wani2018) conducted a comparison of continuous (36 L/h) and intermittent (36, 318 and 372 L/h) front surface water veil cooling. In intermittent cooling, water flow was initiated when the module temperature reached 40 °C and halted when the temperature decreased to 32 °C. Continuous module cooling has helped to maintain low operating temperature low, resulting in a 29.0% increase in module energy output over intermittent cooling (Saxena et al., Reference Saxena, Deshmukh, Nirali and Wani2018). Moreover, the continuous presence of a water layer above the module reduced light reflection losses by 2.0% to 3.6% due to the higher refractive index of 1.5 compared to air. Even after accounting for pumping energy requirements, the net electrical energy gain via continuous water veil cooling was observed to be about 8.0% to 9.0% (Krauter, Reference Krauter2004). Luboń et al. (Reference Luboń, Pełka, Janowski, Pająk, Stefaniuk, Kotyza and Reczek2020) suggested continuous water veil cooling as a superior choice for module cooling than water spray cooling due to the increased energy output and lack of water splashes.
The lowest module temperature achievable with water veil cooling will be the same as the flowing water temperature. Because of evaporative cooling, the water temperature in earthen pots will be about 5 to 8 °C lower than that of water contained in an ordinary/regular container. Hence, the use of the earthen pot water for veil cooling may result in lower module operating temperature (Ramkumar et al., Reference Ramkumar, Kesavan, Raguraman and Ragupathy2016). Wilson (Reference Wilson2009) suggested using flowing water from upstream to downstream (from a dam or river) to cool rear surface of the PV module to avoid. Water veil flow rate higher than 30 L/h at a temperature of 28 °C lowered the module’s operating temperature by about 30 °C within a minute. By adopting this method, the module’s operating temperature was only elevated to a maximum of 5.0 °C from 25 °C, resulting in an operating temperature drop of 32 °C when compared to the uncooled module. Wilson (Reference Wilson2009) determined that the optimum water flow rate for module rear water veil cooling is approximately 432 L/h/m2. Ahmad et al. (Reference Ahmad, Khandakar, El-Tayeb, Benhmed, Iqbal and Touati2018) observed a 10.4% increase in PV module electrical efficiency when both the front and rear surfaces were water veil cooled simultaneously. During peak solar hours, the module’s rear and front surface temperatures dropped by 32.3 °C and 32.0 °C, respectively. However, continuous recirculation of water for veil cooling from a common tank with a capacity of 250 L resulted in a 10 °C increase in supply water temperature.
Comments on water veil cooling of PV module
-
a. Presence of continuous water veil over the module reduces reflection losses.
-
b. Module surfaces are cleaned in addition to cooling.
-
c. Requires proper arrangement of water supply system to facilitate uniform distribution of water over the module surface.
-
d. Requires proper water channeling for the flown water else water spillage and wastage occurs.
-
e. Requires significant quantity of water limiting its application in water scarce regions.
-
f. Recirculation of water consumes additional power.
-
g. Poor/low quality water cannot be used as it affects module performance negatively.
PV-water veil disinfection system
SolWat, a PV-water veil disinfection system, was proposed and developed by Spanish researchers at the University of Jaen (Fuentes et al., Reference Fuentes, Vivar, Scott, Srithar and Skryabin2012). The SolWat system is an extended version of water veil cooling system with extra benefit of water disinfection in addition to PV module cooling. The SolWat system is classified into open and closed types (Pichel et al., Reference Pichel, Vivar and Fuentes2021; Lopez et al., Reference Lopez, Garcia, Conde and Villa2023). The open type lacks glazing, and the water to be treated is flown over the PV module’s front surface (Lopez et al., Reference Lopez, Garcia, Conde and Villa2023). In the closed type, the water to be treated was permitted to flow through the channel formed between the PV module’s front surface and a glass cover (Pichel et al., Reference Pichel, Vivar and Fuentes2021). The conceptual representation of Open SolWat and Closed SolWat systems is represented in Figure 5. The ability of these systems to disinfect drinking water and treating secondary effluent from wastewater plants has been evaluated and reported (Pichel et al., Reference Pichel, Vivar and Fuentes2021; Vivar et al., Reference Vivar, Fuentes, Torres and Rodrigo2021; Lopez et al., Reference Lopez, Garcia, Conde and Villa2023).
Concept of a) closed SolWat and b) Open Solwat system proposed for combined water disinfection and electricity generation (Torres et al., Reference Torres, Vivar, Fuentes, Palacios and Rodrigo2022; Torres et al., Reference Torres, Vivar, Fuentes and Palacios2024).
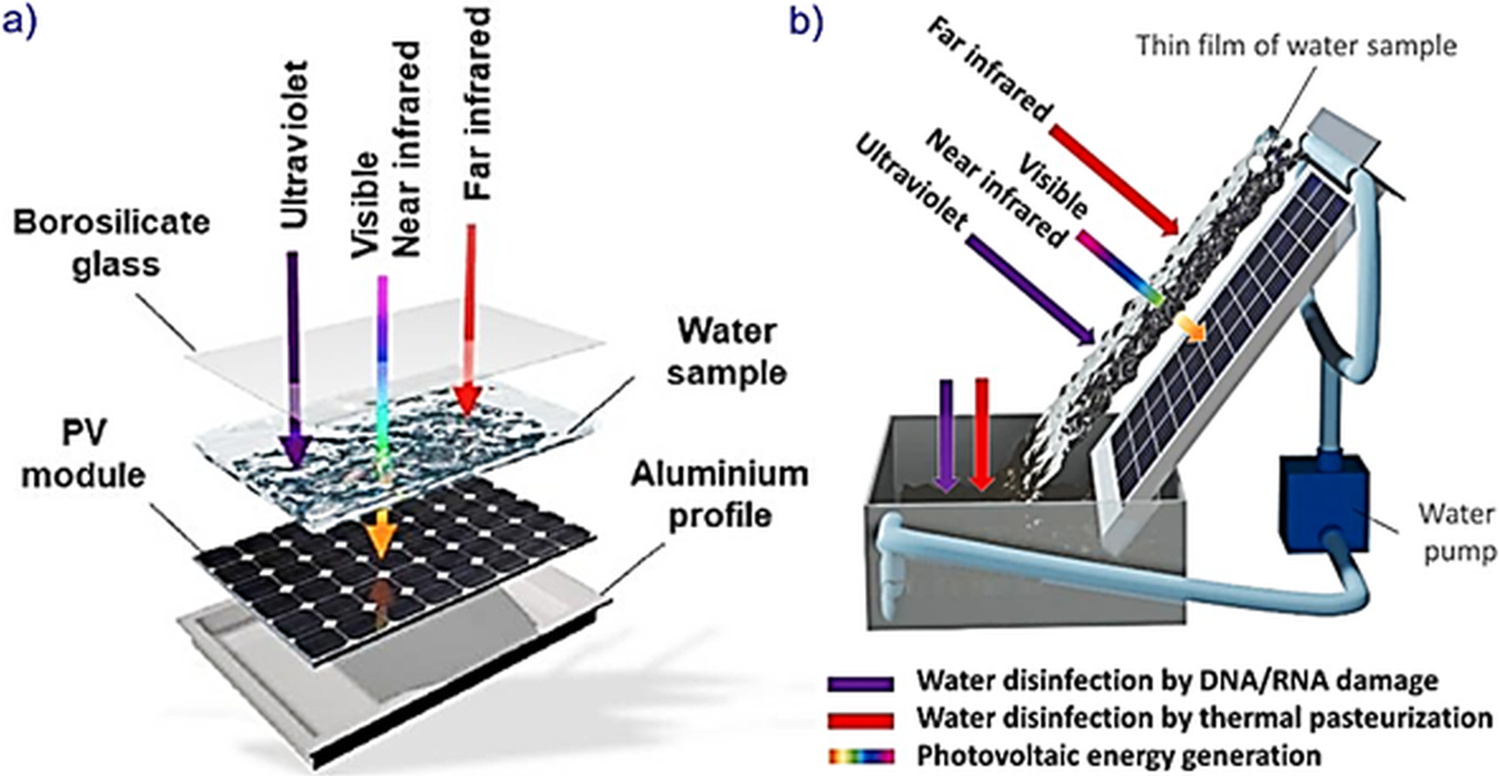
Figure 5. Long description
Panel a shows an exploded view of the closed SolWat system. From top to bottom, the layers are labeled as borosilicate glass, a water sample, a P V module, and an aluminum profile. Three arrows labeled ultraviolet, visible and near infrared, and far infrared point downward through the glass and water sample. The ultraviolet arrow is purple, visible and near infrared is a gradient from blue to red, and far infrared is red. The arrows indicate that ultraviolet, visible, and near infrared light pass through the water sample, while far infrared is absorbed. The P V module below the water sample receives the transmitted light for photovoltaic energy generation. Panel b shows the open SolWat system with a thin film of water sample flowing over a tilted P V module. A water pump circulates water from a reservoir at the bottom left, up to the top of the module, where it flows downward as a thin film. Arrows labeled ultraviolet, visible and near infrared, and far infrared point toward the water film, matching the color scheme in panel a. The legend at the bottom right indicates purple for water disinfection by D N A or R N A damage, red for water disinfection by thermal pasteurization, and orange for photovoltaic energy generation. The schematic illustrates how different parts of the solar spectrum are used for water disinfection and electricity generation in each system.
The ultra violet rays (0.1–4.0 μm) and far infrared rays (3.0–1000 μm) of the incident sun rays will be absorbed by the flowing water veil, thereby allowing only visible and near infrared rays to reach the PV module to generate electricity. The absorbed UV rays will be utilized to damage the DNA/RNA of the microbes in water, and the absorbed far infrared rays will be utilized for thermal pasteurization. Vivar et al. (Reference Vivar, Fuentes, Torres and Rodrigo2021) observed similar daily energy production in closed SolWat system relative to the reference PV module despite reduced solar radiation intensity reaching its PV surface. This observation was attributed to the module cooling effect induced by the flowing water. The module temperature dropped by 16.2 to 30.6 °C and energy efficiency improved by 15% to 21% in Open SolWat system when compared to the non-cooled PV module (Lopez et al., Reference Lopez, Garcia, Conde and Villa2023). Dynamic mode (circulation of water) operation of closed SolWat system produced a better module cooling effect (6.8 °C drop) than static mode operation, which resulted in a temperature decrease of about 2.5 °C. Moreover, dynamic mode operation minimized bubble formation in flowing water (Torres et al., Reference Torres, Vivar, Fuentes, Palacios and Rodrigo2022).
The temperature required for water pasteurization/disinfection must be greater than 45 °C, highlighting the importance of water retention over the module to achieve this temperature. Hence, the performance of the PV module in SolWat arrangement will be determined by water retention time and quality (Torres et al., Reference Torres, Vivar, Fuentes and Palacios2024). The temperatures of mono-, polycrystalline- and amorphous-silicon-module-based closed SolWat systems with a 6-h water residence time were about 7.5, 6.9 and 4.7 °C lower than their corresponding reference modules. Mono- and polycrystalline-module-based SolWat systems showed no evident improvements in terms of energy output and water disinfection with increase or decrease in water retention time. However, a thin-film (amorphous silicon) module-based SolWat system benefited greatly from its black color and better utilization of the altered solar spectrum, resulting in improved water disinfection and increased power output even at short residence times (Pichel et al., Reference Pichel, Vivar and Fuentes2021). The Open SolWat system with an amorphous silicon module generated 15% to 21% higher energy and had an operating temperature of 16.2 to 30.6 °C lower than the reference module (Torres et al., Reference Torres, Vivar, Fuentes and Palacios2024). Hence, amorphous silicon PV module was identified as the best candidate for use in large-scale open and closed SolWat systems (Pichel et al., Reference Pichel, Vivar and Fuentes2021; Torres et al., Reference Torres, Vivar, Fuentes and Palacios2024).
Comments on PV-water veil disinfection system
-
a. Solar spectrum is effectively utilized to disinfect water and cool modules.
-
b. Compatible with wastewater treatment plants and capable of treating secondary effluent.
-
c. Open Solwat system looks simple, while closed Solwat system involves significant modification in module arrangement to facilitate water passage in a confined path.
-
d. More suited for amorphous module rather than mono- and polycrystalline modules.
-
e. Poor-/low-quality water or highly turbid water cannot used or treated.
-
f. Water circulation/pumping seems necessary, indicating additional power consumption.
Water spray cooling
Water spray cooling reduces PV module temperature by rapidly dispersing tiny water droplets over the modules at high velocity using spray nozzles and high-pressure pumps (Abdolzadeh et al., Reference Abdolzadeh, Ameri and Mehrabian2011). Tiny water droplets were created by forcing water through nozzles/orifices at a pressure of about 1.5–5.0 bar higher than ambient pressure (Benato et al., Reference Benato, Stoppato, DeVanna and Schiro2021). Spray cooling is highly efficient in heat dissipation due to its high heat transfer coefficient, which ranges from a few hundred to few thousand W/m2K (Yin et al., Reference Yin, Wang, Sang, Zhou, Chen, Thrassos, Romeos and Giannadakis2022). Spray cooling effectiveness depends on spray angle (spray nozzle type), spray duration, spray rate, duty cycle and spray nozzle orientation (Yin et al., Reference Yin, Wang, Sang, Zhou, Chen, Thrassos, Romeos and Giannadakis2022). The spraying water temperature will be the lowest PV module temperature that may be achieved with water spray cooling. Water spray cooling can be applied to the front or back or on both the surfaces of the PV module, simultaneously. The photograph of PV front surface water spray cooling system along with nozzles of various spray angles used is shown in Figure 6.
(a) Photograph of PV module front surface water spray cooling. (b) Spray nozzle with spray angle of 30°, 90° and 180° (Benato et al., Reference Benato, Stoppato, DeVanna and Schiro2021).

Continuous water spray over the PV module increased optical performance and electrical efficiency by 3.0% and 3.26%, respectively (Abdolzadeh and Ameri, Reference Abdolzadeh and Ameri2009). Increasing the water spray rate reduced module temperature significantly, highlighting higher water and energy consumption (Abdolzadeh et al., Reference Abdolzadeh, Ameri and Mehrabian2011). To reduce water consumption, Hadipour et al. (Reference Hadipour, Zargarabadi and Rashidi2021) proposed a pulsed spray cooling arrangement with on/off cycles. The ratio of on time to off time is called the duty cycle. The temperature reduction and electrical power enhancement observed with continuous water spray and water spray with duty cycle of 1.0 and 0.2 were about 32.3 °C and 33.3%, 31.4 °C and 27.7% and 30.6 °C and 25.9%, respectively. The water consumption for a duty cycle of 0.2 was about 4.68 L/h, which was about 10 times less than the water consumption under continuous spray conditions (Hadipour et al., Reference Hadipour, Zargarabadi and Rashidi2021). Three nozzles each of spray angle 90°, operating at a pressure of 1.5 bar in on mode for 30 seconds and off mode for 180 seconds, were found to be the optimum case for front surface water spray PV module cooling. This arrangement reduced module temperature by 24 °C and improved module efficiency by 18.7% as compared to the reference module (Benato et al., Reference Benato, Stoppato, DeVanna and Schiro2021).
The optimum configuration for PV module rear surface water spray cooling system was proposed by Altegoer et al. (Reference Altegoer, Hussong and Lindken2022) and is shown in Figure 7a. The optimum number of hollow cone nozzles and pin-jet nozzles was three at the channel inlet and two facing each other as shown in Figure 7b and c, respectively. The temperature reduction, efficiency enhancement and water consumption of hollow cone nozzle and pin-jet nozzle-based rear water spray cooling systems were about 17.5 °C, 8.7% and 24.8 L/h and 16.5 °C, 8.2% and 9.2 L/h, respectively. The optimum operating pressure for a hollow cone nozzle and a pin-jet nozzle-based rear water spray cooling system was about five and three bar, respectively. The schematic and photograph indicating water spray cooling arrangement for a PV module is shown in Figures 8 and 9, respectively. The PV module temperature reduction and effective percentage increase in power output were about 31.9 °C and 7.7%, respectively, for simultaneous water spray cooling of both sides at a spray pressure of 4.8 bar and spray rate of 225 L/h. The effective power output is the power output of the cooled module minus the power consumed by the spraying system. Temperature drop observed with sole front and back surface water spray cooling was about 9.6 °C and 5.5 °C lower than when both sides were simultaneously cooled. The maximum power output enhancement with sole front and back surface water spray cooling was about 6.0% and 5.4%, respectively, which was lower than simultaneous both side spray cooling. Hence, simultaneous both side spray cooling can be considered effective (Nizetic et al., Reference Nizetic, Coko, Yadav and Grubisic-Cabo2016).
(a) Water spray arrangement for cooling PV module’s rear surface. (b) Two pin-jet nozzle arrangement facing each other. (c) Three hollow cone nozzles oriented at the channel inlet.
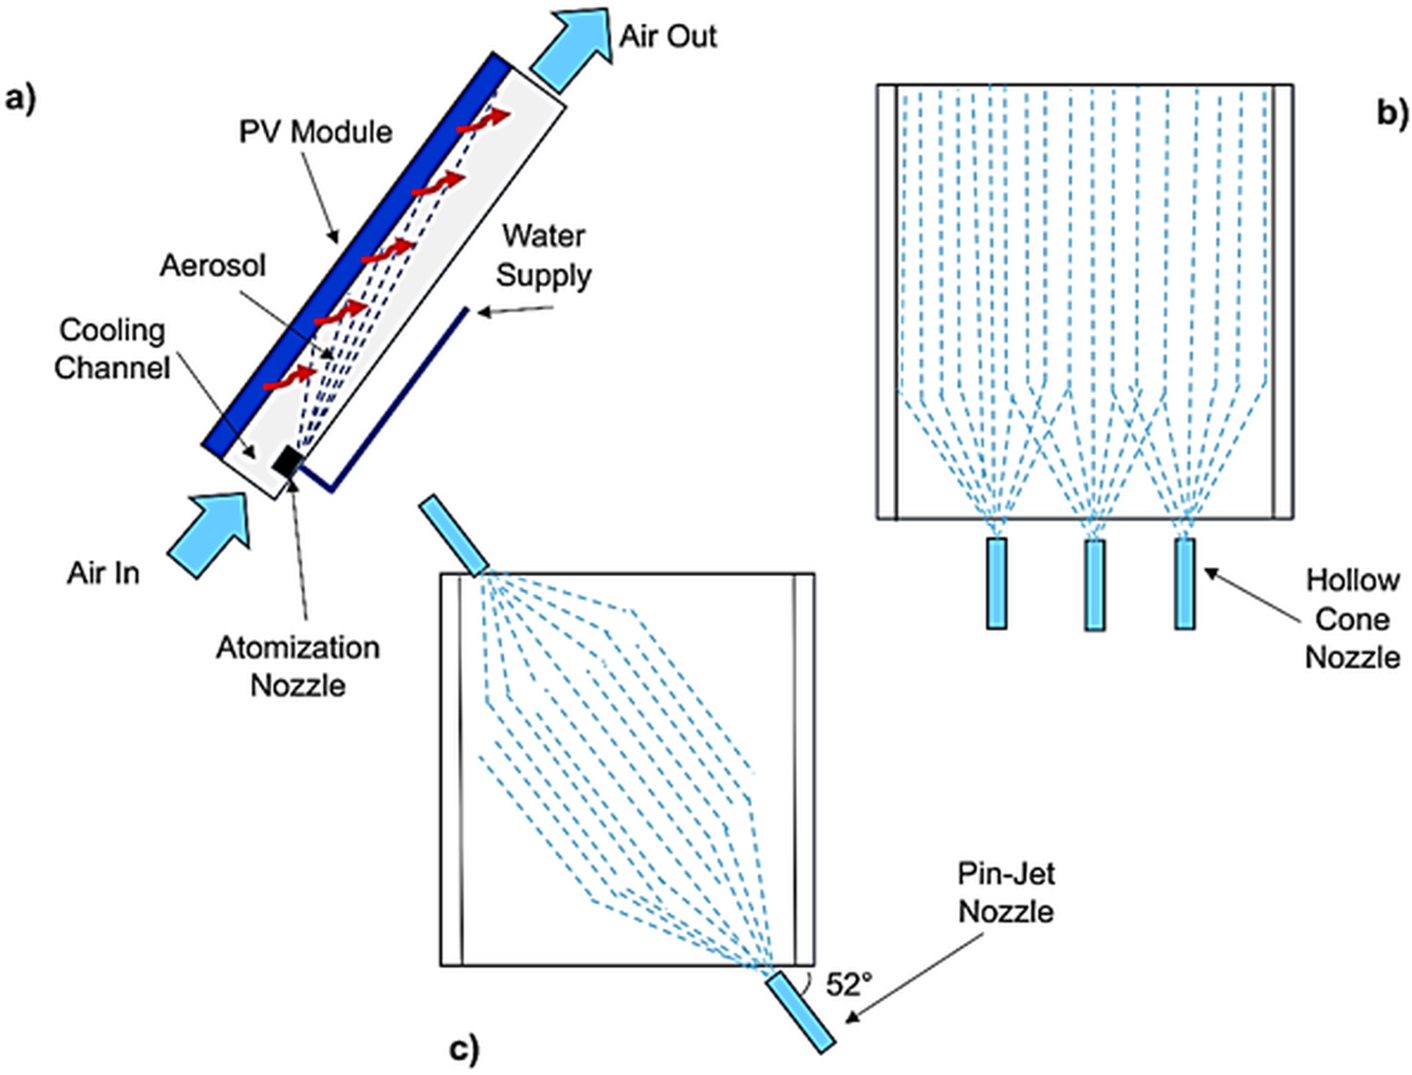
Figure 7. Long description
Panel a at top-left shows a cross-sectional schematic of a P V module with a cooling channel beneath. Air enters from the lower left, passes through an atomization nozzle, and exits as air out at the upper right. Water supply enters from the right side, forming an aerosol spray directed upward and diagonally across the cooling channel, indicated by dashed lines and red arrows. Panel b at top-right displays a frontal view of two pin-jet nozzles facing each other, each emitting a fan-shaped spray pattern toward the center. Panel c at bottom shows three hollow cone nozzles aligned at the channel inlet, each producing a conical spray pattern, with the leftmost nozzle angled at 52 degrees. All nozzle types are labeled, and spray directions are indicated by dashed blue lines.
Schematic showing water spray cooling of PV module.
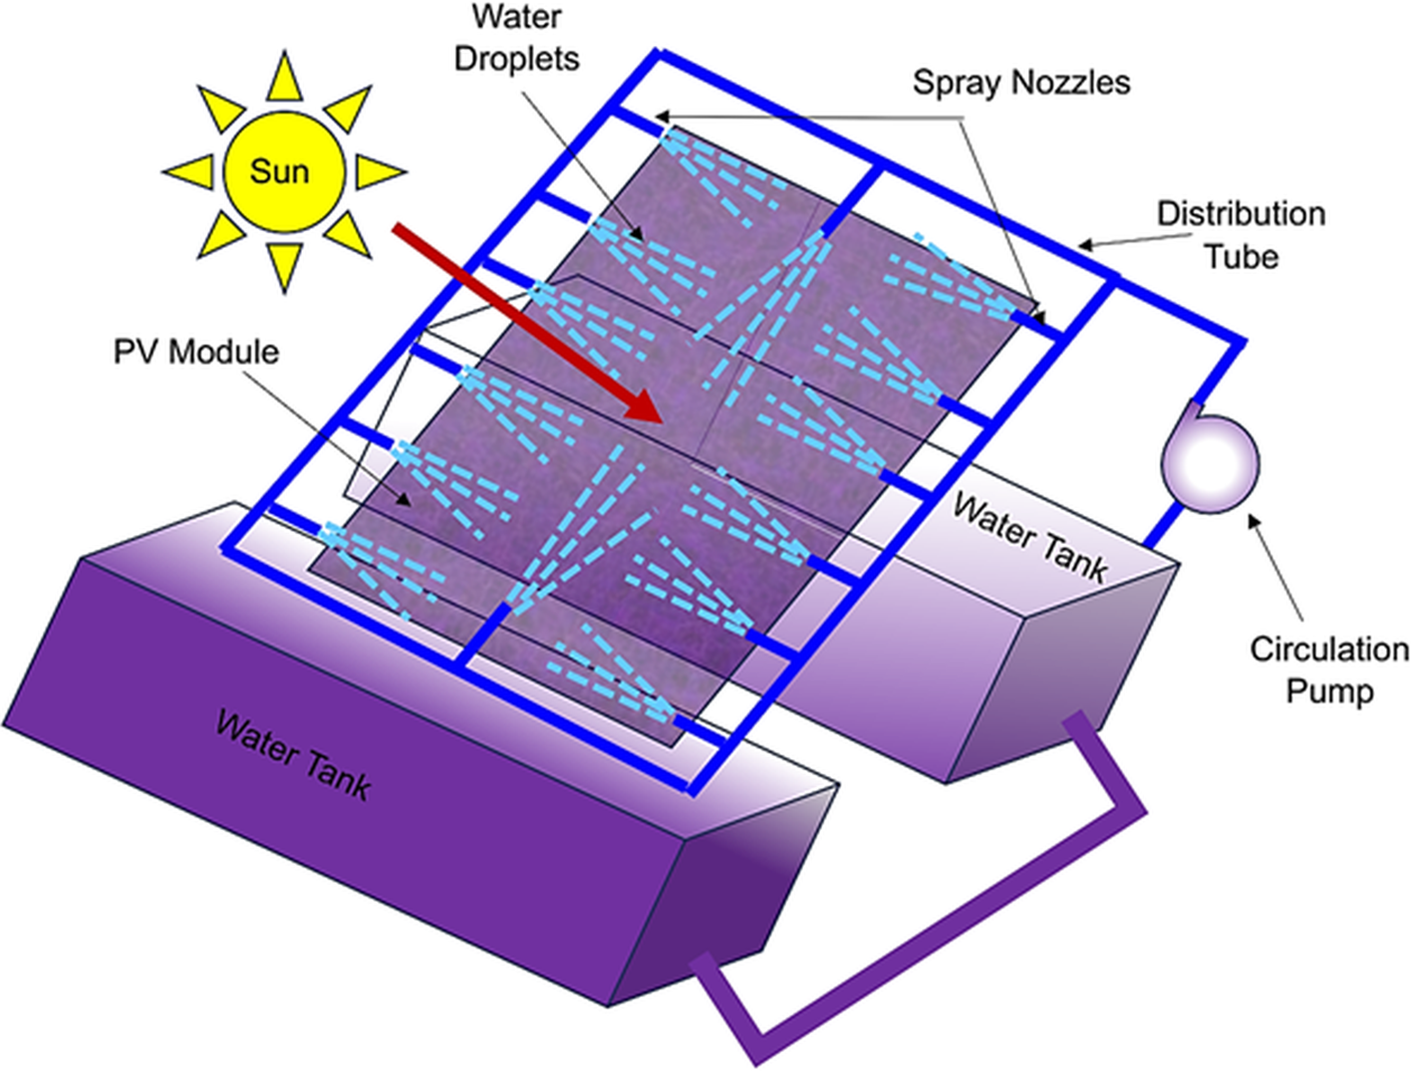
Figure 8. Long description
At the center is a rectangular PV module. Above the module, spray nozzles connected to a distribution tube release water droplets downward onto the module surface. Blue dashed lines indicate the spray pattern. The distribution tube is connected to a circulation pump on the right, which draws water from a water tank below the module. The water tank is shown as a large purple box labeled Water Tank. The circulation pump returns water to the spray nozzles, forming a closed loop. A yellow sun symbol at the upper left emits a red arrow pointing toward the PV module, representing solar irradiation. All components are labeled: Sun, PV Module, Water Droplets, Spray Nozzles, Distribution Tube, Water Tank, Circulation Pump.
Photograph of PV module with nozzle arrangment (a) above and (b) below the module for spray cooling (Nizetic et al., Reference Nizetic, Coko, Yadav and Grubisic-Cabo2016).

Comments on water spray cooling of PV module
-
a. Effective heat dissipation from the modules due to impingent of tiny water droplets at high velocity.
-
b. Module is cleaned in addition to cooling.
-
c. Can be scaled for both small- and large-scale real-time PV installations.
-
d. Suffers water loss due to splashing and evaporation.
-
e. May enhance vegetation growth around the module area and may cause corrosion of module support structures, requiring periodic maintenance.
-
f. Can be operated only in an active mode due to the need for water pressurizing systems.
-
g. Water pretreatment (filtration) is crucial to prevent nozzle clogging.
Water immersion cooling
The operating temperature of a PV module can be reduced by immersing it fully or partially in stagnant or moving water as shown in Figures 10 and 11, respectively. High heat capacity of water was utilized for dissipating the module’s heat energy to maintain lower operating temperature. Using this technique, the lowest module operating temperature possible is the surrounding water temperature. The performance of immersion cooling and the immersed module is determined by water temperature, water type/quality, water mass and the depth of immersion. The schematic indicating the reflection and refraction process of incident light rays occurring at the various interferences of immersed PV module is shown in Figure 12a. Refraction is improved when the light rays travel from a medium having a lower refractive index to a medium with a higher refractive index (Tina et al., Reference Tina, Rosa-Clot, Rosa-Clot and Scandura2012). The impact of water layer in reducing reflection losses from the PV module for various incidence angle is shown in Figure 12b. The presence of water layer over the PV module improved light ray transmission by 2% to 8%. However, the solar spectrum changes when it passes through the water layer due to the water layer’s strong absorption of long-wave and very short-wave radiation (Tina et al., Reference Tina, Rosa-Clot, Rosa-Clot and Scandura2012). Water layer is highly transparent to the wavelength of 350 nm to 800 nm, which is shown in Figure 12c.
PV module fully immersed in water.

(a) Schematic of 20% immersed PV module in water. (b) Refraction of sunlight caused due to the presence of water and reaching the partially immersed PV module.

Figure 11. Long description
Left panel shows a yellow sun at the top left with a red arrow pointing downward to a tilted rectangular P V module partially submerged in a blue-outlined water body. The module is labeled ‘Partially Immersed P V Module.’ The water body is outlined with dashed blue lines. Right panel shows a cross-section with the sun at the top left, three arrows labeled ‘Visible Light,’ ‘I R,’ and ‘U V’ entering from air into water at different angles. The water surface is horizontal, and the partially immersed P V module is shown at an angle on the right. The water body is labeled at the bottom, and the air is labeled above the water. The visible light arrow bends as it enters the water, illustrating refraction.
(a) Ray behavior while passing through air–water–glass interface. (b) Variation of reflection losses with glass layer and water-glass layer. (c) Solar spectrum alteration caused due to the water layer presence of different depths (Tina et al., Reference Tina, Rosa-Clot, Rosa-Clot and Scandura2012).

Figure 12. Long description
Panel a, top left, is a schematic cross-section showing layers from top to bottom: air with refractive index n equals 1, water with n equals 1.33, glass with n equals 1.53, and a base labeled P V cells plus E V A. Incident ray I sub w enters from air at angle theta sub i, partially reflects as R sub w and transmits as T sub w into water. In water, ray splits into reflected R sub G and transmitted T sub G into glass, with I sub G as the incident ray. In glass, ray further splits into reflected R sub P V and transmitted T sub P V into the P V cells. All ray paths are marked with arrows. Panel b, top right, is a line graph with x-axis labeled Incidence Angle (degrees) from 0 to 90 and y-axis labeled percent Reflected from 0 to 10. Three curves are shown: R sub water-glass (red), R sub glass (green), and gain percent (black dots). Both R sub water-glass and R sub glass increase nonlinearly with angle, with R sub water-glass always higher. Panel c, bottom, is a spectral irradiance plot with x-axis labeled Wavelength (nanometers) from 0 to 2500 and y-axis labeled Spectral Irradiance (Watt per meter squared per nanometer) from 0 to 1.6. Four curves represent water depths d sub w equals 0, 5, 10, and 50 centimeters (black, blue, red, green). As water depth increases, the spectral irradiance decreases, especially at shorter wavelengths, showing attenuation with depth.
In full immersion cooling, the module is immersed completely in water, whereas in partial immersion cooling, only a particular length percentage of the module is immersed in water. The maximum module temperature drop observed was 40 to 50 °C, 7.9 °C and 10.5 °C for full immersion (Rosa-Clot et al., Reference Rosa-Clot, Rosa-Clot, Tina and Scandura2010), 5% immersion and 10% immersion (Elminshawy et al., Reference Elminshawy, Osama, Saif and Tina2022), respectively. The maximum module efficiency improvement of 10% to 11% was observed at a full immersion depth of 4 cm (Lanzafame et al., Reference Lanzafame, Nachtmann, Rosa-Clot, Rosa-Clot, Scandura, Taddei and Tina2010). On contrary, the module efficiency dropped by 16% to 23% at a full immersion depth of 40 cm (Lanzafame et al., Reference Lanzafame, Nachtmann, Rosa-Clot, Rosa-Clot, Scandura, Taddei and Tina2010; Rosa-Clot et al., Reference Rosa-Clot, Rosa-Clot, Tina and Scandura2010). The module efficiency improved by 15.6%, 28.4% and 10.9% at 5%, 10% and 20% module immersion percentages in water, respectively, indicating that a 10% immersion ratio is optimal (Elminshawy et al., Reference Elminshawy, Osama, Saif and Tina2022). Simulation studies reported in Rosa-Clot et al. (Reference Rosa-Clot, Rosa-Clot, Tina and Scandura2010) indicated that the optimum water immersion depth for full immersion cooling was less than 10 cm. With increase in immersion depth, solar radiation reaching the module surface decreases due to transmission losses, leading to lower electrical efficiency when compared to the emerged module as seen in Figure 13.
Variation of submerged modules efficiency relative to the emerged modules (Rosa-Clot et al., Reference Rosa-Clot, Rosa-Clot, Tina and Scandura2010).

Figure 13. Long description
The x axis is labeled Water Depth in centimeters, ranging from 0 to 50. The y axis is labeled Relative Efficiency in percent, ranging from 75 to 120. Three lines are shown: red for single S i, green for poly S i, and blue for amorphous S i, as indicated by the legend in the upper right. All lines start at their highest efficiency at zero depth and decrease as depth increases. The red single S i line starts near 117 percent and drops steeply to about 83 percent at 50 centimeters. The green poly S i line starts near 113 percent and decreases to about 87 percent at 50 centimeters. The blue amorphous S i line starts near 110 percent and decreases more gradually, ending near 95 percent at 50 centimeters. Amorphous S i maintains the highest relative efficiency across all depths, followed by poly S i, then single S i.
For immersion depths beyond 10 cm, polycrystalline and amorphous modules outperform monocrystalline modules due to their lower temperature drift coefficient of 0.45%/°C and 0.25%/°C, respectively, compared to 0.55%/°C for monocrystalline modules (Rosa-Clot et al., Reference Rosa-Clot, Rosa-Clot, Tina and Scandura2010). The better performance of 10-cm immersed module than the emerged module in spite of reduced number of photons reaching them could be attributed to the cooling effect of the water (Rosa-Clot et al., Reference Rosa-Clot, Rosa-Clot, Tina and Scandura2010). Hence, the optimum immersion depth for better PV performance must be selected based on module type and compensation for the effect of lower number of photons due to transmission losses versus the improved module cooling effect produced by immersion (Rosa-Clot et al., Reference Rosa-Clot, Rosa-Clot, Tina and Scandura2010). The daily energy output of module with 1.0 cm desalinated water, tap water and seawater layer over it was about 28.3, 16.6 and 14.9% higher than the emerged module, respectively (Sharon et al., Reference Sharon, Gopal, Prasad, Darbha, Vivar, Kumawat, Jangir and Singh2025). Use of very shallow, non-optimal water depths above the module may result in salt deposition and a decrease in power output (Sharon et al., Reference Sharon, Jangir, Kumawat, Singh, Vivar and Prasad2026). Monthly cleaning was suggested for submerged modules, while daily cleaning was recommended for emerged modules, else a 10% drop in efficiency would be observed (Rosa-Clot et al., Reference Rosa-Clot, Rosa-Clot, Tina and Scandura2010).
Comments on water immersion cooling of PV module
-
a. Module operating temperature can be maintained closer to the ambient temperature.
-
b. Uniform module cooling will be achieved; thereby, thermal stresses can be eliminated.
-
c. No moving parts.
-
d. Requires huge water mass to dissipate the module heat.
-
e. Requires supports for the submersion/immersion arrangement and protection/isolation for the module junction box from water.
-
f. Poor/low quality and more turbid water cannot be used.
-
g. Corrosion of module metal parts and degradation of water body quality seem to question sustainability of this concept in long-term run.
-
h. Electrical shorting, corrosion, or delamination of PV module are possible with water immersion. However, dielectric fluids do not cause these issues making them suitable for long-term operation. Moreover, these fluids provide both convective and conductive heat dissipation and can maintain module temperatures 10–20 °C lower than air-cooled systems. Limitations include cost of dielectric fluids, environmental considerations and the need for sealed containment (Taqwa and Carlos, Reference Taqwa and Carlos2024).
Literature review on unintentional PV module water-cooling techniques
Floating PV module
Floating PV (FPV) refers to PV modules deployed over water bodies using floating structures (Ranjbaran et al., Reference Ranjbaran, Yousefi, Gharehpetian and Astaraei2019). The conceptual representation of an FPV system is shown in Figure 14. FPV system installations are rapidly expanding, with a global installed capacity of 7.7 GW by 2023 (Selji et al., Reference Selj, Wieland, Tsanakas, Selj, Jahn and Maugeri2025) and an estimated 2.0% of global energy production by 2030 (Micheli, Reference Micheli2022). The fundamental idea behind FPV systems was to use water bodies as PV module installation sites rather than expensive and precious land resources that are often used for agricultural or other essential activities (Gorjian et al., Reference Gorjian, Sharon, Ebadi, Kant, Scavo and Tina2021; Claus and Lopez, Reference Claus and Lopez2022). FPV modules can reduce water evaporation by 70%, saving huge quantity of water that could be used for other essential purposes (Sahu et al., Reference Sahu, Yadav and Sudhakar2016; Ranjbaran et al., Reference Ranjbaran, Yousefi, Gharehpetian and Astaraei2019). Moreover, FPV modules can be installed over hydropower plant dams and aquaculture ponds to generate additional power and revenue (Garrod et al., Reference Garrod, Hussain, Ghosh, Nahata, Wynne and Paver2024). The optimum coverage ratio for hydropower dams and aquaculture ponds with PV modules was around 40% to 60% (Haas et al., Reference Haas, Khalighi, Adela, Gerbersdorf, Nowak and Po-Jung2020) and 60% (Chateau et al., Reference Chateau, Wunderlich, Teng-Wei, Hong-Thih, Che-Chun and Fi-John2019), respectively.
Conceptual representation of floating PV system.

The temperature of the FPV module dropped by 1 °C, when the water temperature was 5 °C lower than the ambient temperature. Lower tilt angle, optimum installation height and low water temperature are essential for cooling FPV module (Ramanan et al., Reference Ramanan, Lim, Kurnia, Roy, Bora and Medhi2024). Tilt angles greater than 55° seem to increase FPV module temperature. Low operating temperatures were observed at 0° tilt and 1500 mm above water level installations (Ramanan et al., Reference Ramanan, Lim, Kurnia, Roy, Bora and Medhi2024). The operating temperature of FPV modules was about 2.0–10.0 °C lower than that of land-mounted PV modules (Ramanan et al., Reference Ramanan, Lim and Kurnia2025). The operating temperature of tilted FPV module installed 250 mm above water surface had an operating temperature 2 °C lower than the of land-mounted tilted PV module installed 800 mm above the ground. However, when FPV module was installed 800 mm above the water level, the temperature difference reduced, indicating that closeness to the water seems essential for module cooling (Ramanan et al., Reference Ramanan, Lim and Kurnia2025). FPV modules in direct contact with water have a high overall heat loss coefficient of about 71 W/m2K and generate about 5% to 7% higher energy than air-cooled FPV modules (Selji et al., Reference Selj, Wieland, Tsanakas, Selj, Jahn and Maugeri2025). This observation can be attributed to the better cooling effect induced by water (Koondhar et al., Reference Koondhar, Albasha, Mahariq, Graba and Touti2024).
In an FPV module system, the module can be cooled by direct contact with water and vapors from the evaporated water in addition to the wind effects. FPV systems are about 5% to 15% efficient than land-mounted PV systems (Claus and Lopez, Reference Claus and Lopez2022). Chowdhury et al. (Reference Chowdhury, Haggag and Poortmans2023) claimed that the efficiency enhancement of FPV modules was only 0.5% to 3.0%, and FPV module cooling was mainly attributable to wind convection. However, real-time FPV module systems installed in the Netherlands and Singapore reduced operating temperatures by 3.2 °C and 14.5 °C, respectively, and improved power output by 3.0% and 6.0%, respectively, compared to ground-mounted PV module systems (Dorenkamper et al., Reference Dorenkamper, Wahed, Kumar, Mde, Kroon and Reindl2021). In Indian conditions, FPV systems have a 4 to 6 °C lower operating temperature and 6% to 7% higher power output than land-mounted PV modules (Anusuya and Vijayakumar, Reference Anusuya and Vijayakumar2024). Tina et al. (Reference Tina, Scavo, Merlo and Bizzarri2021) observed 9.7% and 9.5% energy gain with bifacial and mono-facial FPV modules, respectively, under active cooling (flowing water veil over the front surface). Passive cooling resulted in energy gains of about 3.0% and 2.6% for bifacial and mono-facial FPV modules, respectively. Most of the FPV systems were installed over fresh water bodies, as installations in the marine environment are quite challenging due to unpredictable environmental loads, corrosion effects from salty water and associated high installation costs (Claus and Lopez, Reference Claus and Lopez2022; Essak and Ghosh, Reference Essak and Ghosh2022; Huang et al., Reference Huang, Elzaabalawy, Sarhaan, Sherif, Ding, Ou, Yang and Cerik2025).
Comments on floating PV module
-
a. Use of water bodies as PV module installation sites eliminated expensive land usage.
-
b. Integration with hydropower plants can improve load management effectively.
-
c. Incorporation with aquaculture ponds generates additional income for farmers.
-
d. Module cooling in addition to water evaporation prevention will be achieved.
-
e. Requires complex, stable floating and support structures.
-
f. Flooding, storms and huge waves have significant impact in its structural endurance and reliability.
-
g. FPV maintenance seems to prevent bird nesting and salt deposits from water splashing during waves.
-
h. Negative environmental and ecological impacts have been documented in some cases (Benjamins et al., Reference Benjamins, Williamson, Billing, Yuan, Collu, Fox, Hobbs, Masden, Cottier-Cook and Wilson2024).
Photovoltaic-thermal (PV/T) system
PV/T systems are co-generation systems that can be classified into three categories: air-based PV/T, liquid-based PV/T and heat pump-based PV/T systems. These systems have a wide range of applications and a large commercial potential in many locations (Chow, Reference Chow2010). In a water-based PV/T system, apart from electricity generation, the waste heat energy of the PV module was recovered by circulating water and was used for other essential activities. The co-generation efficiency of PV/T systems can range up to 60% to 70% (Charalambous et al., Reference Charalambous, Maidment, Kalogirou and Yiakoumetti2007). In this system, the PV module was cooled by water that was circulating in the heat exchanger attached beneath the module. The different ways to circulate water in PV/T collector is shown in Figure 15. PV/T systems are further classified into unglazed, glazed (Charalambous et al., Reference Charalambous, Maidment, Kalogirou and Yiakoumetti2007), natural circulation (He et al., Reference Tin-Tai, Ji, Lu, Pei and Lok-Shun2006) and forced circulation systems (Dubey and Tiwari, Reference Dubey and Tiwari2008). The operating temperature of the PV module will vary depending on the PV/T system type. Under similar operating conditions, the peak operating temperatures of a single PV module, an unglazed PV/T and a glazed PV/T collector were about 46.6 °C, 49.8 °C and 59.6 °C, respectively (Sandnes and Rekstad, Reference Sandnes and Rekstad2002). Glazed system had higher thermal efficiency but lower electrical efficiency. The lower electrical efficiency of the glazed system was mainly due to the transmittance and reflectance loss of incident sun rays caused by the glass cover presence over the PV/T collector (Tian et al., Reference Tian, Wang, Wang and Ji2023).
Different ways of circulating water in PV/T system to recover the waste heat energy a) Water circulation via tubes attached to rear surface of PV module and airflow between the channel formed between the module’s front surface and glass cover b) Module front surface cooled by flowing water over its front surface guided by glass channel, which in turn followed by cooling with airflow in a separate channel above it c) Module front surface cooled by flowing water over its front surface guided by glass channel d) Module front surface cooling with combination of primary and secondary water and air flow via channels.

Figure 15. Long description
Panel A, top left, shows from top to bottom: a glass layer, an air gap, a PV unit, adhesive, absorber, and insulation. A water tube is embedded within the insulation. Panel B, top right, shows from top to bottom: a glass layer, an air gap, a second glass layer, a PV unit, and insulation. Water flows horizontally between the two glass layers above the PV unit. Panel C, bottom left, shows from top to bottom: a glass layer, an air-vapor mixture, a water layer, a PV unit, adhesive, absorber, and insulation. Panel D, bottom right, shows from top to bottom: a glass layer, an air gap, a second glass layer, a primary water channel, a PV unit, an air gap, an absorber, a secondary water channel, and insulation. Arrows in each panel indicate the direction of air or water flow within the respective channels or layers.
The electrical yield increase of an unglazed PV/T collector over a sole PV module was only 0.32% for a water circulation rate of 75.6 L/h (Sakellariou and Axapoulos, Reference Sakellariou and Axapoulos2017). Menon et al. (Reference Menon, Murali, Elias, Delfiya, Alfiya and Samuel2022) observed 12.32% higher electrical efficiency for PV/T collector with a water circulation rate of 241.2 L/h in comparison to sole PV module. Moreover, the peak module temperature drop observed in the PV/T collector was about 15 °C. The temperature rise of water was about 10 °C in an unglazed PV/T system, but the addition of a 10-mm thick glass cover over the PV/T module improved the water temperature rise by 15 to 30 °C (Vittorini et al., Reference Vittorini, Castellucci and Cipollone2017). Li et al. (Reference Li, Ji, Yuan, Song, Ren, Uddin, Luo and Zhao2020) compared the performance of two different PV/T systems formed by laminating PV cells to a metal absorber plate (A-PV/T) and PV cells to glass (G-PV/T) as shown in Figure 16. The A-PV/T system demonstrated better thermal, overall efficiency but lower electrical efficiency due to the high temperature achieved by the attached metal absorber plate. In contrary, the G-PV/T system demonstrated lower overall and thermal efficiency but better electrical efficiency due to the lower temperature of the attached glass. The electrical efficiency of G-PV/T and A-PV/T systems was about 11.6% and 9.74%, respectively. Moreover, the lower operating temperature of G-PV/T systems was expected to reduce thermal stresses on the PV module. Majeed et al. (Reference Majeed, Abdul-Zahra, Mutasher, Dhahd, Fayad, Al-Waeli, Kazem, Chaichan, Al-Amiery and Isahak2023) connected PV/T heat exchanger with an underground heat exchanger that was buried at a depth of 4 m under the earth, resulting in 20 °C lower operating temperature and 127.3% improved electrical efficiency in comparison to that of the sole PV module. High temperature water output is mostly desired in PV/T collectors since they are intended for hot water generation to meet space heating requirements (Emmanuel et al., Reference Emmanuel, Yuan, Maxime, Gaudence and Zhou2021). However, high temperature operation of a PV/T system reduces its electrical efficiency. Hence, booster mirrors have been suggested to be used with glazed PV/T systems to achieve reasonable electrical efficiency (Tripanagnostopoulos et al., Reference Tripanagnostopoulos, Nousia, Souliotis and Yianoulis2002). Hence, it could be understood that there is always a tradeoff between thermal and electrical efficiency in PV/T systems. A detailed review on various other cooling techniques adopted in PV/T systems to improve its electrical efficiency has been reviewed in Togun et al. (Reference Togun, Basem, Kadhum, Abed, Biswas, Rashid, Lawag, Ali, Mohammed and Mandal2025).
Schematic of PV/T system with (a) PV cells laminated to metal absorber plate (A-PV/T) and (b) PV cells laminated to glass (G-PV/T).

The most recent PV/T configuration includes direct liquid microchannel cooling, which combines narrow channels or cold-plates directly behind the PV cells to extract heat via forced convection. Water or dielectric fluids circulate in channels with hydraulic diameters, typically below 1 mm, enabling very high heat-transfer coefficients (1000–5000 W/m2K). This method is particularly relevant in high-irradiance environments, concentrated PV and large-scale PV modules where thermal gradients remain an issue. Microchannel cold plates can reduce module temperature by 20–30 °C, depending on flow rates and channel geometry. Long-term sealing, electrical isolation, leakage risk and pump energy consumption have significant issues, though dielectric fluids help to mitigate electrical hazards. Their high cooling efficiency makes them a key component of planned, active cooling techniques (Bahaidarah et al., Reference Bahaidarah, Subhan, Gandhidasan and Rehman2013).
Comments on PV/T system
-
a. Both electricity and hot water are produced in the same area and have high overall efficiency.
-
b. Suitable for large-scale solar energy-based co-generation systems.
-
c. Successfully implemented in various developed countries of Europe to meet the space heating demands.
-
d. Tradeoff exists between the electrical efficiency and hot water outlet temperature.
-
e. Active mode operation seems effective indicating need for continuous water circulation systems.
-
f. Heat exchanger is essential, making the system slightly more expensive than a sole flat plate collector and a sole PV module.
Hybrid PV-solar still
In this arrangement, PV module’s front and rear surfaces have been used as solar still absorbers (Manokar et al., Reference Manokar, Winston, Kabeel and Sathyamurthy2018; Srithar et al., Reference Srithar, Akash, Nambi, Vivar and Saravanan2023; Sharon and Vivar, Reference Sharon and Vivar2025). The waste heat energy from the PV module is used to desalinate the feed saline water directly. The dual benefit of this arrangement includes generation of electricity and desalinated water in addition to module cooling. However, utilizing the front surface of a PV module as an absorber as shown in Figure 17 may result in salt/slit deposit. In addition, reduced power output may result from passage of sunlight through solar still’s glass cover, air, saline water layer and then reaching the PV module. Moreover, this arrangement may not initiate PV module cooling due to the occurrence of greenhouse effect between the water layer above the PV module’s front surface and solar still’s glass cover. However, if PV module’s rear surface was used as solar still’s absorber, cooling benefiting PV module could be achieved.
Schematic of inclined solar still with PV module’s rear surface as absorber.

Figure 17. Long description
At the top right is an overhead tank connected to a water transportation tube leading leftward to a water distribution header. Below, an inclined glass cover overlays a P V module. Water flows from the header, forming a water veil over the P V module. Sunlight enters from the upper left, passing through the glass cover and heating the water layer. At the base, a condensate collection trough gathers the condensed water, which exits as condensate through a tube at the bottom left. All components are labeled: Sun, Glass Cover, P V Module, Water Veil Over the P V Module, Condensate Collection Trough, Condensate, Overhead Tank, Water Transportation Tube, Water Distribution Header.
The rear surface of the PV module was lined with wetted wick/cloth to make it behave as solar still’s absorber, and a closed chamber was formed with the condensing surface that was kept adjacent to the PV module as represented in Figures 18 and 19. The PV module’s front surface will be facing the sun directly; thereby, the sun rays reaching the PV module will not be modified/affected resulting in no threats of reduced power output. The water from the lined wetted wick layer gets evaporated due to the waste heat energy generated in the PV module (Srithar et al., Reference Srithar, Akash, Nambi, Vivar and Saravanan2023). The evaporated water condensing over the condensing surface will be collected as desalinated water. The PV module temperature drop was about 8 °C, and electrical efficiency enhancement was about 5.6% to 14.5% due to cooling caused with this arrangement (Srithar et al., Reference Srithar, Akash, Nambi, Vivar and Saravanan2023). The daily desalinated water production rate was 0.55 L/m2 and 0.21–1.35 L/m2 in basin (Srithar et al., Reference Srithar, Akash, Nambi, Vivar and Saravanan2023) and vertical solar still (Sharon and Vivar, Reference Sharon and Vivar2025) using PV module rear surface as absorber, respectively.
Schematic of basin solar still with PV module’s rear surface as absorber.

Figure 18. Long description
At the top left, a sun icon directs a red arrow toward the slanted PV module forming the upper boundary. Below the PV module is a glass cover, sloping downward to the left. The rear surface of the PV module is lined with a wetted wick, labeled as hanging with its ends immersed in basin water at the bottom. Blue arrows indicate vapor rising from the basin water toward the glass cover. The glass cover directs condensed water droplets downward into a condensate collection basin at the lower left, where liquid is shown being collected as condensate. All major components are labeled: PV module, glass cover, wetted wick lined on the rear surface of PV module, hanging wetted wick with ends immersed in basin water, vapor, basin water, condensate collection basin, and condensate.
Schematic of vertical solar still with PV module’s rear surface as absorber.

Figure 19. Long description
From left, a sun icon points to a vertical P V module. At the top right, an overhead tank connects to a water distribution trough above the module. The rear surface of the P V module is lined with a wetted wick. A condensing cover encloses the wick. Below, a condensate collection trough leads to a labeled condensate container, while a separate outlet directs reject water to a reject tank. All components are labeled with arrows indicating water and energy flow.
Comments on hybrid PV-solar still
-
a. Passive PV module cooling occurs alongside desalination.
-
b. Brackish and saline water can be used.
-
c. Suitable for application in potable water scarce regions with good solar radiation potential.
-
d. Arrangement of wetting wicks looks complex in basin type system as gravity will be acting against the wick orientation.
-
e. Salt deposition and clogging of wick over the time may be an issue highlighting the need for proper maintenance.
Potential hazards of water seepage in PV modules
Water, when used in close proximity to electrically active photovoltaic components, can cause safety and reliability concerns, like leakage currents, short circuits and insulation degradation. These concerns are particularly relevant in systems that use recirculated saline, wastewater, or mineral-rich water, as moisture can exacerbate electrochemical reactions and promote corrosion (Li et al., Reference Li, Shen, Hacke and Kempe2018; Badran and Dhimish, Reference Badran and Dhimish2023). PV module’s surface wetness due to water cleaning, cooling and atmospheric water condensation can cause the water to reach different layers of the module by seepage through the edges. The seeped water increases the electrical conductivity of PV module layers leading to increased leakage currents (Anagha et al., Reference Anagha, Kulkarni and Shiradkar2026). Leakage current flows due to the voltage difference between the module’s conductive components and the grounding system (Atia et al., Reference Atia, Hassan, El-Madany, Eliwa and Zahran2023) and can also lead to electric fires (Rahman et al., Reference Rahman, Mansur, Hossain Lipu, Rahman, Ashique, Houran, Elavarasan and Hossain2023). Leakage current enhances corrosion and potential induced degradation of PV layers (Li et al., Reference Li, Shen, Hacke and Kempe2018), which can be prevented by the use of low ionic conductive material as PV module encapsulant (Mekhilef et al., Reference Mekhilef, Saidur and Kamalisarvestani2012). The mechanism for leakage current formation and its pathway in PV module systems is explained in Kempe et al. (Reference Kempe, Hacke, Morse, Li, Shem and Han2023). The seeped water within the module acts like magnifier lens concentrating sunlight over the cell, and it also acts as a barrier preventing the light from escaping out leading to enhanced electron–hole pair generation, thereby surging open-circuit voltage (Mekhilef et al., Reference Mekhilef, Saidur and Kamalisarvestani2012). Moreover, the seeped water undergoes reduction reaction resulting in hydrogen gas production and accumulation, causing high pressure and eventual delamination of module layers (Li et al., Reference Li, Shen, Hacke and Kempe2018). Hence, edge sealant is essential to prevent moisture seepage in PV modules (Mekhilef et al., Reference Mekhilef, Saidur and Kamalisarvestani2012).
Solar PV modules are mostly installed in arid and semi-arid regions which may result in thermal stresses leading to crack formation on PV module layers (Mussard and Amara, Reference Mussard and Amara2018). These cracks allow water seepage into the PV module layers during condensation of atmospheric humidity or water cooling or water cleaning leading to module degradation. In addition, material properties of ethyl vinyl acetate (EVA) and back sheet layers of PV module also have a role in moisture absorption (Park et al., Reference Park, Oh and Kim2013). Hence, the use of hydrophobic PV back sheets is essential to prevent/reduce moisture absorption and improve insulation effect for leakage current (Farou et al., Reference Farou, Djellad, Chiheb, Lalaymia, Rekik and Logerais2025). Exposure to water also causes corrosion of metal components like frames and electrical connections increasing resistance and reduced efficiency (Rahman et al., Reference Rahman, Mansur, Hossain Lipu, Rahman, Ashique, Houran, Elavarasan and Hossain2023). Failure of electrical insulation in submerged cables of floating PV module is highly possible, resulting in energy production loss and water pollution by microplastics (Rebelo et al., Reference Rebelo, Fialho and Novais2024). In addition, water contact with electric cables, junction box may result in electrical faults and pose threats for human safety. Hence, IP-rated water-resistant electrical cables, junction boxes and electrical fittings are needed for PV modules that are frequently in contact with water. Electrical isolation and regular inspection are highly essential to prevent module corrosion, module degradation and potential electrical hazards (Oeishee and Rahman, Reference Oeishee and Rahman2026). The various mechanisms involved in water/moisture seeping in electronic components, its consequences, material degradation/failure mechanisms, component failure modes and a number water/moisture test methods have been reviewed in Baylakoglu et al. (Reference Baylakoglu, Fortier, Kyeong, Ambat, Conseil-Gudla, Azarian and Pecht2021).
Impact of water circulation pump power consumption
Some of the module cooling techniques consume power for their operation, that is, pumping power. Energy consumed for pumping (Ep) can be evaluated by multiplying the rated power of the pump power and its operation time. The net/effective daily energy gain due to module cooling
$ (\Delta {E}_{PV, cool}) $
 can be represented as the difference between the daily energy output of the cooled module (EPV, cool), uncooled module (EPV, uncooled) and the daily pumping energy requirement (EP) (Tawfiq et al., Reference Tawfiq, Abdeltwab and Maghrabie2026), which can be written as follows:

Pumping power requirement and water consumption rate can be reduced by using intermittent water cooling instead of steady continuous cooling (Moharram et al., Reference Moharram, Abd-Elhady, Kandil and El-Sherif2013; Tashtoush and Al-Oqool, Reference Tashtoush and Al-Oqool2019; Hadipour et al., Reference Hadipour, Zargarabadi and Rashidi2021; Sornek, Reference Sornek2024; Necib et al., Reference Necib, Kadi, Belatrache and Hammou2025). In most of the literature, energy consumed by the water pumps is not disclosed. In general, the pumping power (
$ {P}_{pump} $
 in Watt) required is evaluated by (Raju et al., Reference Raju, Sarma, Suryan, Nair and Nizetic2022)

where
$ \rho $
 is the density of water (in kg/m3),
$ g $
is the density of water (in kg/m3),
$ g $
 is the acceleration due to gravity (m/s2),
$ Q $
is the acceleration due to gravity (m/s2),
$ Q $
 is the volumetric flow rate (m3/s),
$ H $
is the volumetric flow rate (m3/s),
$ H $
 is the head (in m) and
$ {\eta}_{pump} $
is the head (in m) and
$ {\eta}_{pump} $
 is the pump efficiency.
Raju et al. (Reference Raju, Sarma, Suryan, Nair and Nizetic2022) observed PV module efficiency improvement from 9.0% to 14.6% with increase in water spray rate from 70 to 500 L/h. However, the improvement in efficiency was nearly negligible after a flow rate of 170 L/h. In addition to flow rate, pump efficiency also plays a major role in effective power output of the PV module. The variation of effective power output with water flow rate and pump efficiency is shown in Figure 20. It could be seen that the power output of module increases with increase in the flow rate when power consumption of pump is not considered. However, if power input to the pump is considered, the net power output drops after 170 L/h flow rate, even for a 100% efficient pump. Impact of water circulation rate on electrical efficiency improvement of unglazed PV/T systems in comparison to sole PV module has been reported in Vittorini et al. (Reference Vittorini, Castellucci and Cipollone2017) and was presented in Figure 21. At high flow rates, the percentage improvement in electrical efficiency of PV/T system in comparison to a sole PV module becomes more pronounced. The electrical energy gain and circulation pump energy consumption increased by about 129% and 326%, respectively, with increase in water circulation rate from 30 to 120 L/h. However, the pump’s energy consumption was only about 2.5% to 4.5% of the energy gain achieved from module cooling.
Effective power output of module with flow rate (a) without considering pump power requirement, (b) 100% efficient pump and (c) 60% efficient pump (Raju et al., Reference Raju, Sarma, Suryan, Nair and Nizetic2022).

Figure 20. Long description
The graph has flow rate in liters per hour on the x-axis, ranging from 0 to 500, and power output in watts on the y-axis, ranging from 35 to 42. Three lines are plotted: (a) black diamonds for no pump power considered, (b) blue triangles for 100 percent efficient pump, and (c) red squares for 60 percent efficient pump. All lines start near 35.5 watts at zero flow rate and rise steeply to about 39 to 40 watts at 100 liters per hour. Beyond this, line (a) continues to increase, reaching about 41.5 watts at 500 liters per hour. Line (b) plateaus near 40 watts and remains nearly flat. Line (c) peaks near 39.5 watts at 100 liters per hour, then gradually declines to about 38.5 watts at 500 liters per hour. The legend at the lower right links symbols to scenarios.
Impact of water circulation rate on electrical efficiency of PV/T system relative to sole PV module (Vittorini et al., Reference Vittorini, Castellucci and Cipollone2017).

Figure 21. Long description
The x-axis is labeled Solar irradiance in watts, with values 250, 470, 690, and 915. The y-axis is labeled delta eta sub el percent, cooling versus no cooling, ranging from 0 to 120. The legend at the upper left identifies four curves: open triangle for 0.5 liters per minute, filled triangle for 1.0 liters per minute, open square for 1.5 liters per minute, and filled square for 2.0 liters per minute. All curves are U-shaped, with minimum values near 690 watts and higher values at both ends. The 2.0 liters per minute curve (filled square) is consistently highest, peaking near 80 percent at low and high irradiance. The 1.5 liters per minute curve (open square) is next, followed by 1.0 liters per minute (filled triangle), and 0.5 liters per minute (open triangle) is lowest, peaking near 40 percent. The curves show that increasing water circulation rate enhances electrical efficiency improvement, especially at the lowest and highest irradiance values.
Electrical and power electronics implication in PV module water cooling
PV module cooling systems rely on temperature sensors, such as thermocouples, which measure the real-time temperature of the PV modules (Kazem et al., Reference Kazem, Al-Waeli, Chaichan, Sopia, Ahmed and Roslam2023). These sensors transmit data to control systems that activate cooling mechanisms, such as water circulation or spraying, when temperatures exceed predefined limits (Kazem et al., Reference Kazem, Al-Waeli, Chaichan, Sopia, Ahmed and Roslam2023). Proportional-Integral-Derivative (PID) controllers are commonly used in cooling systems to adjust cooling intensity in real time, thereby ensuring optimal temperatures for PV modules (Duan et al., Reference Duan, Wang, Dong, Liu and Zhao2022). Predictive control strategies considering factors like solar irradiance and ambient temperature further improve the cooling process, allowing for proactive cooling adjustments (Duan et al., Reference Duan, Wang, Dong, Liu and Zhao2022). Attia et al. (Reference Attia, Hossin and Hazza2023) used timers as shown in Figure 22 to control water spray duration and minimize energy consumption of the water pump that was utilized for spray cooling of PV modules. The pump was operated only 2 minutes every 30 minutes with the aid of the timer. Hadipour et al. (Reference Hadipour, Zargarabadi and Rashidi2021) used solenoid valve to control flow duration of water used for module cooling. This intermittent cooling reduced water consumption from 48.6 to 4.68 L/h.
Electric circuit for timer arrangement to control water pump used for spraying (Attia et al., Reference Attia, Hossin and Hazza2023).

Figure 22. Long description
Starting at the top left, the circuit is powered by 230 V A C with L and N lines entering a circuit breaker. Below the breaker is a green lamp. The wiring splits downward to Timer 1, labeled as a regular timer set for 15 minutes. The circuit continues right to Timer 2, labeled as a variable timer adjustable from 0 to 10 minutes. Next in sequence is K 1, an A C contactor. To the far right, the wiring leads to a red lamp and then to the A C water pump, highlighted in yellow. All components are connected in series, with the timers and contactor controlling the activation of the water pump and indicator lamps showing operational status.
Necib et al. (Reference Necib, Kadi, Belatrache and Hammou2025) utilized intermittent water veil cooling under set-point temperatures of 35 and 45 °C. Set-point temperature is the module temperature at which the water-based cooling system stops to operate (Tashtoush and Al-Oqool, Reference Tashtoush and Al-Oqool2019). Tashtoush and Al-Oqool (Reference Tashtoush and Al-Oqool2019) suggested start of PV module water cooling when the module temperature reached the maximum allowable temperature difference (MATD). MATD is the temperature difference between the maximum allowable module temperature and the set-point temperature. The optimum set-point temperature, MATD and water flow rate were found to be 37 °C, +3 °C and 0.9 m3/h, respectively. Moharram et al. (Reference Moharram, Abd-Elhady, Kandil and El-Sherif2013) observed 45 °C to be the optimum maximum allowable temperature of PV module and suggested cooling down to 35 °C with water flow rate of 1740 L/h. This approach caused faster cooling of the module within 5 minutes with minimum water loss. Sornek (Reference Sornek2024) suggested that module front surface veil cooling for 1 minute followed by 4–5 minutes of no flow condition to achieve low water and energy consumption. However, no details were provided on the type of control components used for water flow adjustment and duration in many of the literature (Tashtoush and Al-Oqool, Reference Tashtoush and Al-Oqool2019; Necib et al., Reference Necib, Kadi, Belatrache and Hammou2025). In general, high flow rate and set temperature of 37 °C were found to be effective in improving electrical output of the PV module and lowering water loss (Tashtoush and Al-Oqool, Reference Tashtoush and Al-Oqool2019).
Cooling of modules directly improves the fill factor by reducing the internal series resistance and increasing the shunt resistance of the cells. This results in a “sharper” knee in the I-V curve, which is electrically more efficient for the power converter to process (Skoplaki and Palyvos, Reference Skoplaki and Palyvos2009). Furthermore, water cooling can affect the performance of power electronics like Maximum Power Point Tracking (MPPT) systems and inverters (Martins da Rocha et al., Reference Martins da Rocha, Brighenti and César Passos2019). When module is cooled, the open-circuit voltage increases significantly, thereby shifting the maximum power point. At the same time, cooling reduces the “thermal noise” in tracking. Hence, a more stable, cooler panel allows the MPPT algorithm to lock onto the Maximum Power Point with less oscillation (Subudhi and Pradhan, Reference Subudhi and Pradhan2012). In some cases, with water spray or veil, the cooling might not be uniform across the entire string. This may result in string mismatch; that is, if one module in a string is cooled more than others, it creates voltage mismatch within the string, which confuses standard MPPT algorithms due to multiple peaks and leads to significant power electronic losses (Hu et al., Reference Hu, Cao, Ma, Finney and Li2014). Inverters have a specific input voltage range. If intentional cooling is very effective, the increase in open-circuit voltage, especially on cold mornings, might exceed the inverter’s maximum input voltage rating. Conversely, cooling keeps the operating voltage within the “sweet spot” of the inverter’s efficiency curve. Hence, the PV module cooling has a considerable impact on power electronic device sizing also (Jordehi, Reference Jordehi2016). Optimizing water usage and integrating predictive cooling strategies will be the key in achieving sustainable and efficient PV energy generation (Duan et al., Reference Duan, Wang, Dong, Liu and Zhao2022).
Comparison of PV module water-cooling techniques
Both intentional and unintentional PV module water-cooling techniques reduced the operating temperature of the modules significantly. However, each of these techniques has their own benefits, power, water requirements and limitations. Moreover, techniques like evaporative cooling, immersion cooling, floating PV, PV/T system and hybrid PV + solar still offer continuous cooling to the modules. However, techniques like water veil and water spray cooling can provide both continuous and intermittent cooling depending on requirement with the aid of control strategies to minimize water and power consumption. The comparison of necessary infrastructure requirement, maximum observed temperature drop, electrical efficiency enhancement, water requirement, energy requirement, associated additional benefits apart from cooling and potential threats for the reviewed module cooling techniques are tabulated in Table 1.
Comparison of various intentional and unintentional PV module water-cooling techniques
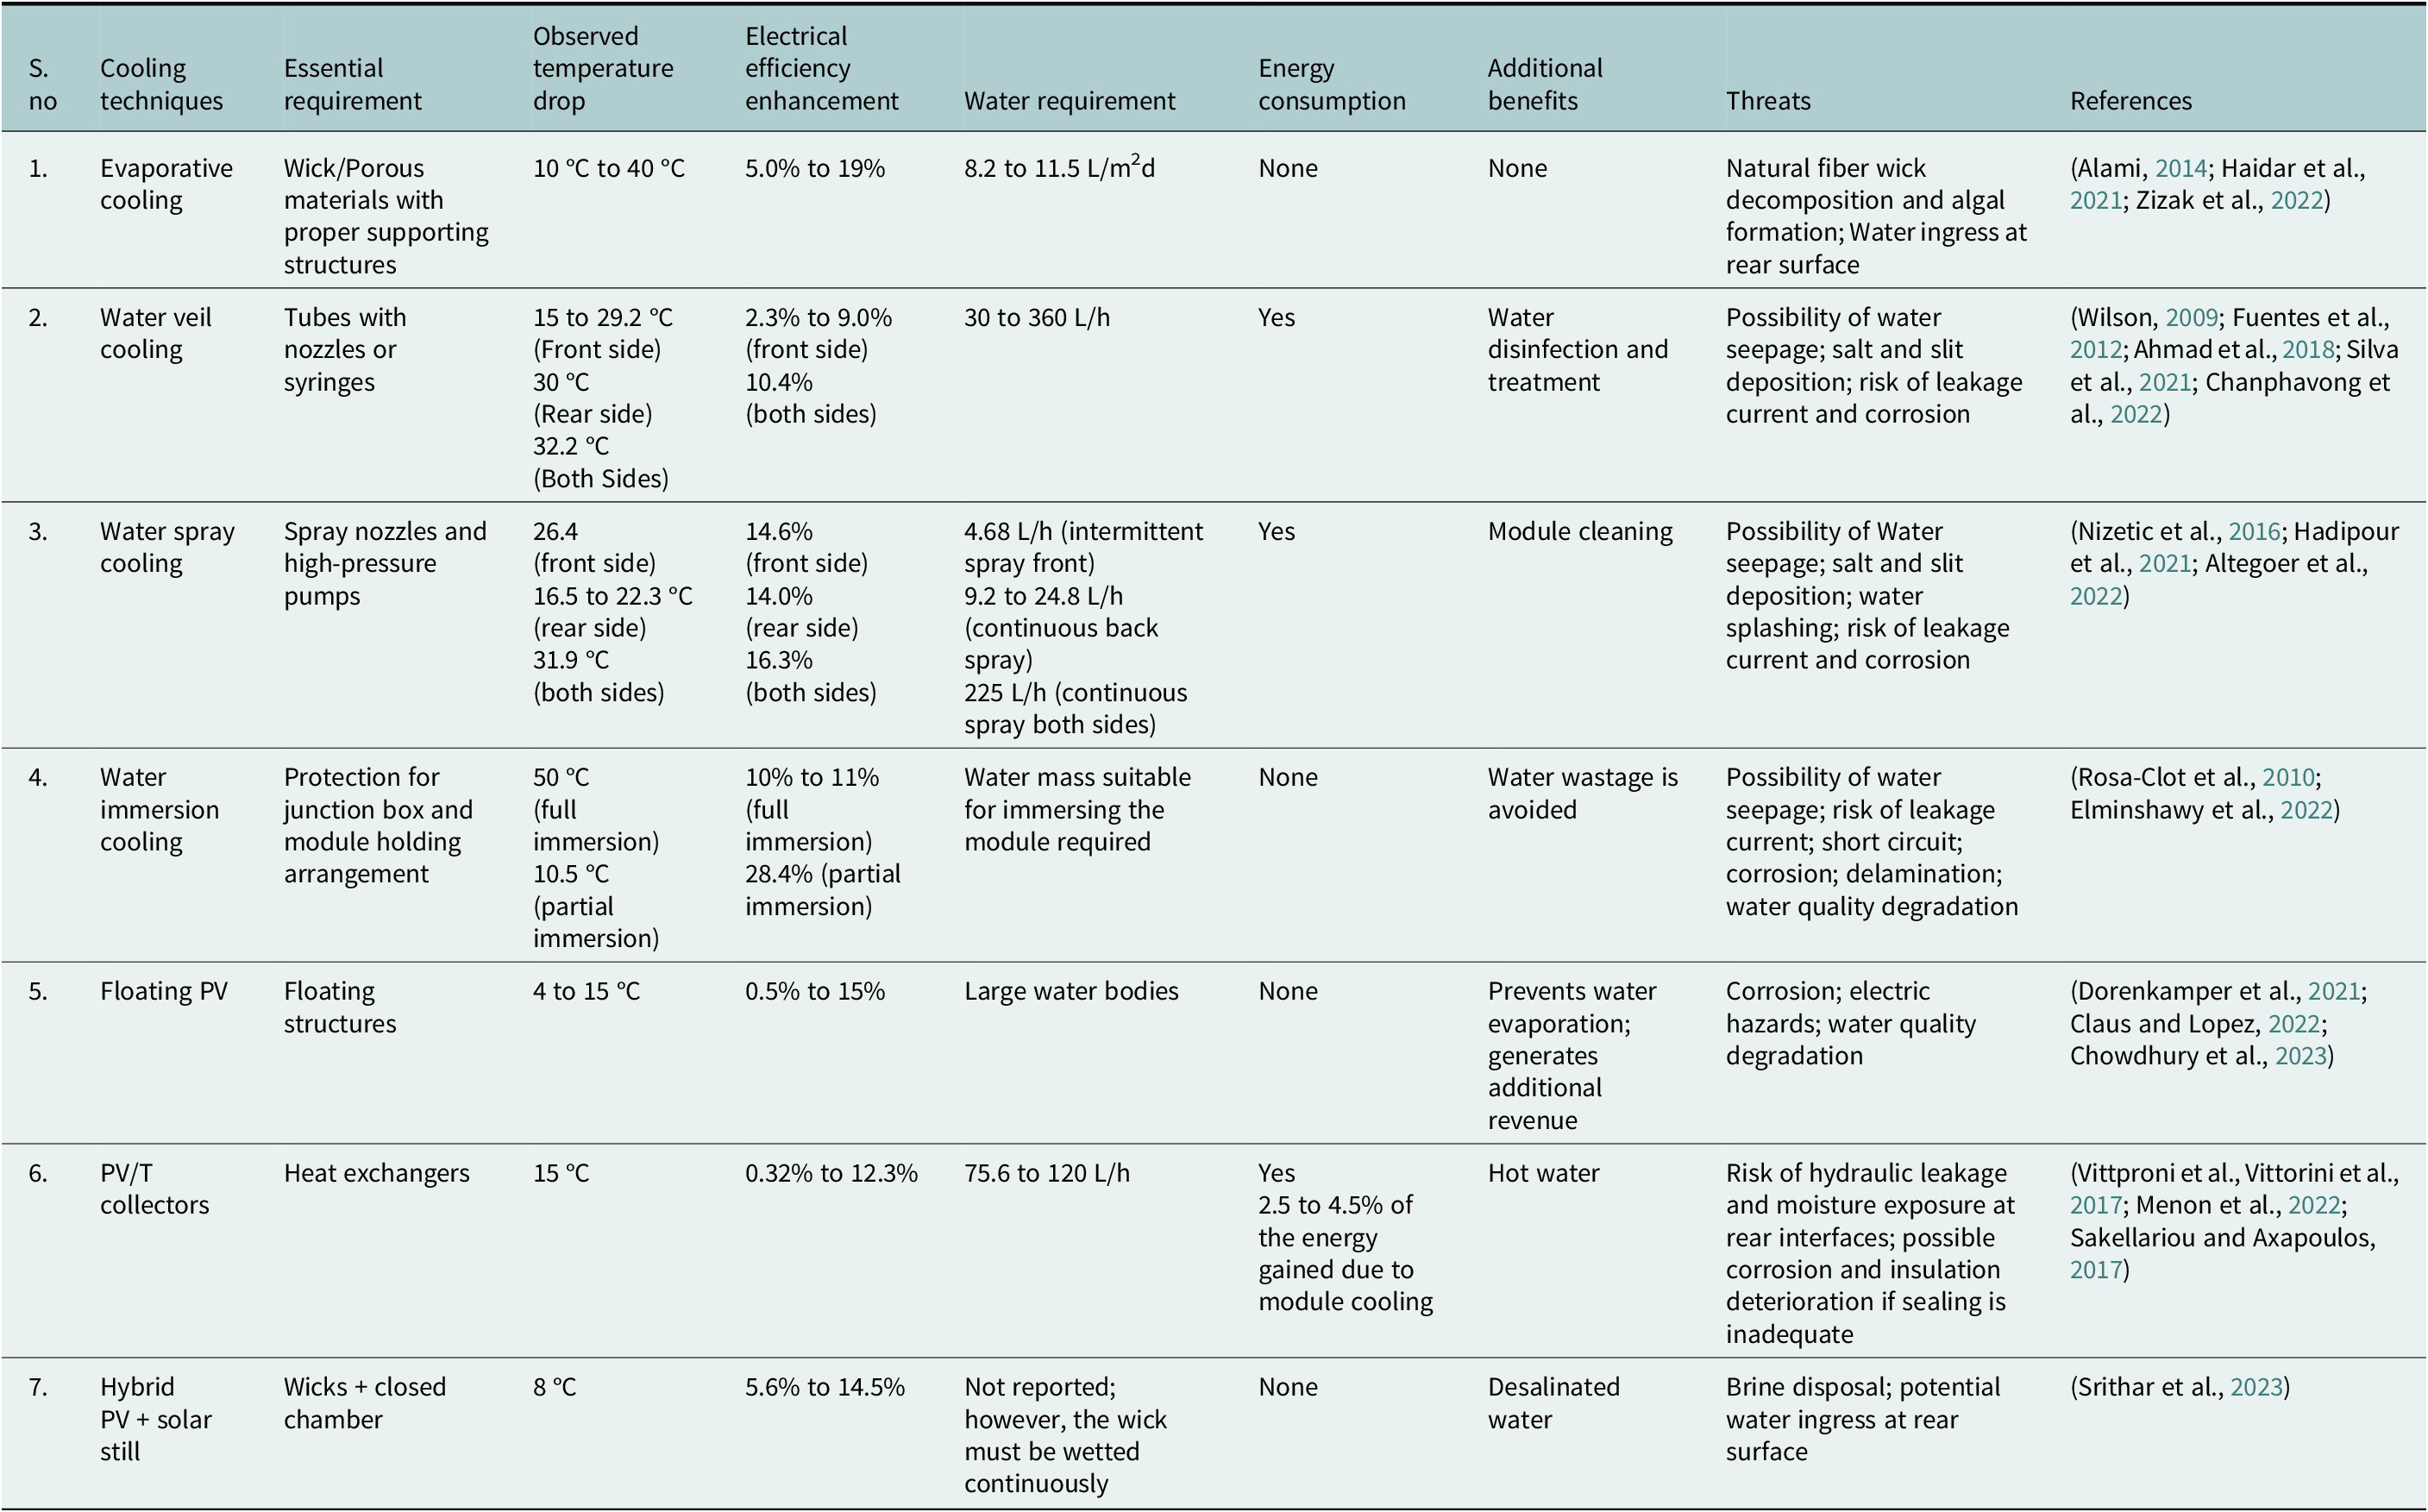
Table 1. Long description
The table contains seven rows, each representing a distinct PV module water-cooling technique. From top to bottom, the columns are: S.no, Cooling techniques, Essential requirement, Observed temperature drop, Electrical efficiency enhancement, Water requirement, Energy consumption, Additional benefits, Threats, and References. Row 1, Evaporative cooling, requires wick or porous materials, achieves 10 to 40 degrees Celsius drop, 5.0 to 19 percent efficiency enhancement, uses 8.2 to 11.5 liters per square meter per day, no energy consumption or additional benefits, threats include fiber decomposition, algal formation, and water ingress. Row 2, Water veil cooling, uses tubes with nozzles, achieves 15 to 29.2 degrees Celsius drop on the front, 30 degrees rear, 32.2 both sides, 2.3 to 9.0 percent efficiency front, 10.4 percent both sides, uses 30 to 360 liters per hour, consumes energy, benefits include water disinfection, threats are water seepage, salt and slit deposition, leakage current, and corrosion. Row 3, Water spray cooling, uses spray nozzles and pumps, achieves 26.4 degrees front, 16.5 to 22.3 rear, 31.9 both sides, 14.6 percent efficiency front, 14.0 rear, 16.3 both sides, uses 4.68 liters per hour intermittent front, 9.2 to 24.8 continuous back, 225 continuous both sides, consumes energy, benefits include module cleaning, threats are water seepage, salt and slit deposition, splashing, leakage current, and corrosion. Row 4, Water immersion cooling, requires protection for junction box, achieves 50 degrees full immersion, 10.5 partial, 10 to 11 percent efficiency full, 28.4 partial, water mass needed for immersion, no energy consumption, avoids water wastage, threats are water seepage, leakage current, short circuit, corrosion, delamination, and water quality degradation. Row 5, Floating PV, uses floating structures, achieves 4 to 15 degrees drop, 0.5 to 15 percent efficiency, requires large water bodies, no energy consumption, benefits are preventing evaporation and revenue generation, threats are corrosion, electric hazards, and water quality degradation. Row 6, PV/T collectors, require heat exchangers, achieve 15 degrees drop, 0.32 to 12.3 percent efficiency, use 75.6 to 120 liters per hour, consume energy (2.5 to 4.5 percent of energy gained), benefit is hot water, threats are hydraulic leakage, moisture exposure, corrosion, and insulation deterioration. Row 7, Hybrid PV plus solar still, requires wicks and closed chamber, achieves 8 degrees drop, 5.6 to 14.5 percent efficiency, water requirement not reported but wick must be wetted, no energy consumption, benefit is desalinated water, threats are brine disposal and water ingress. References are listed for each technique.
Water veil, water spray and PV/T-based cooling techniques require power for circulating and spraying water to cause module cooling. However, the power consumption per unit Watt enhancement in module power output has not been reported in literature. Water requirement was observed to be higher for water veil, water spray and PV/T-based module cooling techniques. Least water consumption was noticed for evaporative cooling. Huge water bodies are necessary for both immersion cooling and floating PV modules. However, in immersion cooling, floating PV and PV/T systems water wastage is avoided, while in other techniques like evaporative cooling, water veil cooling, water spray cooling and hybrid PV + solar still, water loss is possible due to water evaporation, water splashing and brine disposal.
Highest module temperature drop was observed in immersion cooling followed by water veil (both sides), water spray (both sides), evaporative cooling, PV/T system, floating PV and hybrid PV + solar still systems. Highest electrical efficiency enhancement was observed for partial immersion cooling technique followed by evaporative cooling, water spray cooling, hybrid PV + solar still, water veil cooling, floating PV, PV/T system and full immersion cooling. Despite huge temperature drop, the relatively low enhancement in electrical efficiency of full immersion cooling can be attributed to the transmission/optical losses associated with the passage of solar rays through the water layer before reaching the PV module surface. Additional benefits like module cleaning, water treatment, desalination, water evaporation loss prevention and hot water generation are possible with most of the reviewed module cooling techniques except evaporative cooling. Intermittent water spray cooling is more suitable for large-scale PV plants as it can facilitate both module cooling and cleaning. Among all the cooling techniques reviewed, evaporative cooling and hybrid PV + solar still look very simple and are suitable for application in household-based PV systems in water-scarce regions, as even saline water can be used to facilitate the cooling process without any impact on PV modules.
Economics evaluation of PV module water-cooling techniques
In evaluating any of the cooling techniques, from an economic standpoint, several key aspects must be considered. Evaporative cooling arrangement includes the cost of wick, wick support structures and water. The sprinkler water-cooling technology requires sprinklers and pump. The sprinkler and veil cooling system consume significantly less electricity. However, both these systems require considerable water. To mitigate this issue, water leakage, water splashing must be reduced and ensure that water loss is primarily limited to evaporation. To further reduce water costs, the following alternatives sources of water can be explored:
-
(i) Rainwater harvesting : Rainwater could provide a cost-effective water source. However, during the summer months, the risk of algae growth in stored rainwater could present a challenge to its use in cooling systems.
-
(ii) Water from drilled wells : Another potential source is water from drilled wells. Economically, this would involve upfront costs for drilling, along with depreciation of the pump and electricity costs for water extraction. Additionally, technical issues such as siltation and clogging could lead to increased maintenance costs and further expenses over time.
-
(iii) Wastewater utilization : A promising alternative is the use of wastewater, which, although unsuitable for drinking, typically contains low levels of dissolved organic and inorganic materials. A suitable example is wastewater treated through anaerobic processes, where organic matter is removed and inorganic matter is eliminated with the aid of algae. This type of treated wastewater is well-suited for cooling photovoltaic modules. Moreover, such wastewater is often available in large quantities at treatment plants, and the electricity generated by photovoltaic systems can be fully utilized by these plants. At present, there are only a few industrial-scale algae plants globally (Bai et al., Reference Bai, Stündl, Bársony, Fehér, Jobbágy, Herpergel and Vaszkó2012). However, based on the ongoing research, it is anticipated that in the future, these plants will play a significant role in the supply of water to large-scale PV plants for module cooling and cleaning.
The economics of the cooling module is based on the investment costs on the cooling system and the resulting additional energy generation. The Simple Payback Time (SPBT) of the installation is calculated as a function of the initial investment, maintenance costs and the cost of additional energy generated according to the following equation (Souayfane et al., Reference Souayfane, Biwole, Fardoun and Achard2019).

A cooling system not only extends the lifespan of PV modules by reducing their operating temperature over time but also increases their energy output. This enhanced performance contributes to environmental sustainability by generating more green energy and proves to be a financially sound decision, particularly for larger systems. The net yearly profit due to adoption of module cooling system can be evaluated by subtracting the annual maintenance, operation and water cost from the annual cost of the generated additional energy (Pounraj et al., Reference Pounraj, Winston, Kabeel, Kumar, Manokar, Sathyamurthy and Christabel2018).
Net present value (NPV) is calculated with the use of discount rate (
$ \propto $
 ). If the NPV is negative, the cooling arrangement is not worthy, but if positive, it is worthy. This economic parameter can be calculated on the basis of the following equation (Abdelhady, Reference Abdelhady2021; Kijo-Kleczkowska et al., Reference Kijo-Kleczkowska, Bruś and Więciorkowski2022):

where
$ {I}_C $
 is the initial costs, USD;
$ {CF}_t $
is the initial costs, USD;
$ {CF}_t $
 is the net cash flow during a single period, USD/ year; and t is the number of time periods, years.
Levelized cost of electricity (LCOE) is the ratio of costs associated with the module over its life time to the energy produced by it over its life time. LCOE increased by 3% with increase in the module degradation rate from 0.4% to 0.9% per year (Rajput et al., Rajout et al., Reference Rajout, Tiwari and Sastry2017). Proper cooling can slow down degradation. LCOE of pulsed spray-cooled PV module was about 0.38 USD/kWh, which was nearly 76% lower than the LCOE of steady continuously cooled module (Hadipour et al., Reference Hadipour, Zargarabadi and Rashidi2021).
CO2 emission mitigation potential of PV module water-cooling techniques
The increased use of fossil fuels led to high CO2 emissions, which contribute primarily to global warming. Hence, the use of PV modules can reduce CO2 emissions (Ibrahim et al., Reference Ibrahim, Abou Akrouch, Hachem, Ramadan, Ramadan and Khaled2024). The additional energy generated by water-cooled module can mitigate more CO2 emission due to enhanced power generation.
The additional CO2 emission mitigated (kg) due to module cooling is quantified by (Ibrahim et al., Reference Ibrahim, Abou Akrouch, Hachem, Ramadan, Ramadan and Khaled2024)

where ∆E is the excess net/effective energy produced by the water-cooled PV module in kWh over its life time and EI is the CO2 produced per kWh of electricity conventional grid
$ \frac{kg}{kWh} $
 .
.
The emission intensity from coal-based power plants is about 2 kg/kWh by including the transmission and distribution losses (Rajout et al., Reference Rajout, Tiwari and Sastry2017). Module degradation reduces the environmental benefits of the PV module due to reduction PV performance (Rajout et al., Reference Rajout, Tiwari and Sastry2017). Hence, cooling of the module seems essential to have better environmental benefits.
Scope for future research works
From this work, the various research gaps available in water-based PV module cooling techniques have been identified and listed below:
-
a. Natural fibers have been used as wicks for module evaporative cooling in most of the reported literature. These fibers suffer decomposition and algal growth, which again initiate/trigger the need for frequent active maintenance and replacement leading to potential improper waste disposal. Hence, research on the development and demonstration of reusable and cleanable synthetic wicks must be carried out to facilitate effective and sustainable evaporative cooling of the modules.
-
b. Comparative study on the impact of water layer thickness, flow velocity, water temperature and water quality on module water veil cooling and performance needs to be assessed and reported.
-
c. Evaporative, water veil and water spray cooling techniques have potential water loss due to water evaporation and splashing. Hence, techniques for recovering the evaporated water and concepts for integration of these module cooling concepts alongside agrivoltaics and green roofs must be framed, developed and tested to assess the benefits and limitations of their co-existence.
-
d. Mapping of highly suitable module water-cooling technique with module type must be evaluated and reported. Suitability must be assessed based on water availability, water quality, long-term weather conditions of the geographical location and economics in addition to the temperature sensitivity of the modules.
-
e. Utilization of PV module as a part of solar still desalination system seems new, simple and promising. Only limited studies have been carried out in this area. and incorporation of the same in multi-stage/effect solar still will be promising to rectify both electricity and drinking water scarcity.
-
f. Development of suitable combined thermal, electrical and optical models for module subjected to various water-cooling techniques is necessary to compare them and evaluate their effectiveness in various virtual climatic and operating conditions.
-
g. Development of effective strategies to mitigate/prevent water/moisture seepage within PV module and improve electrical isolation to avoid module degradation and electrical hazards.
-
h. Water-energy-environment-economics nexus aspects for each of these water-based module cooling techniques must be evaluated and compared by developing suitable models.
-
i. Significance of module water-cooling techniques in contributing to the United Nations (UN) sustainable development goals must also be evaluated and reported.
Conclusion
Water-based solar PV module cooling techniques are essential to reduce module temperature and improve electrical efficiency, significantly. Adequate sealing of PV components to prevent water seepage, proper hydraulic-electrical isolation, improved grounding and protection systems, water-quality control and periodic maintenance are essential for successful and safe utilization of PV water-cooling techniques. Seawater, desalinated water, tap water and wastewater have been used as a cooling medium. However, water consumption per kWh energy output enhancement or per °C temperature drop has not been reported in most of the literature. In addition, long-term results on the performance of the cooling techniques are also missing. Identification of suitable cooling techniques based on location considering the water availability and weather conditions seem necessary. Unintentional cooling techniques seem to have more benefits and can be a potential area to explore further. Economics, associated environmental impact assessment methodology and route map for circular economy achievement in module water-cooling techniques need to be formulated to evaluate the true sustainability of each technique.
Supplementary material
The supplementary material for this article can be found at http://doi.org/10.1017/etr.2026.10015.
Data availability statement
No data have been generated and used in this study.
Acknowledgments
The author Sharon Hilarydoss acknowledges the funding support of the Science and Engineering Research Board (SERB), Department of Science and Technology, Government of India through the Start-Up Research Grant (SRG) (Grant Number: SRG/2023/000017).
The authors thank and acknowledge the Elsevier publication for permitting to use Figures 1a, 1b, 5, 9a, 9b, 12a, 12b, 12c, 13, 20, 21 and 22 through Rightslink copyright services. Thanks are also extended to MDPI publication for allowing to use Figure 6 through CC-BY open-access license.
Author contribution
S.H.: funding acquisition, conceptualization, methodology, formal analysis, visualization, manuscript preparation, review and editing. E.B.: visualization, manuscript preparation, review and editing. P.V.: manuscript preparation, review and editing. P.D.: manuscript preparation.
Financial support
This work received funding support from the Science and Engineering Research Board (SERB), Department of Science and Technology, Government of India, through the Start-Up Research Grant (SRG) (grant number: SRG/2023/000017) awarded to S.H.
Competing interests
The authors declare that there is no conflict of interest. The authors declare that they have no known competing financial interests or personal relationships that could have appeared to influence the work reported in this paper.
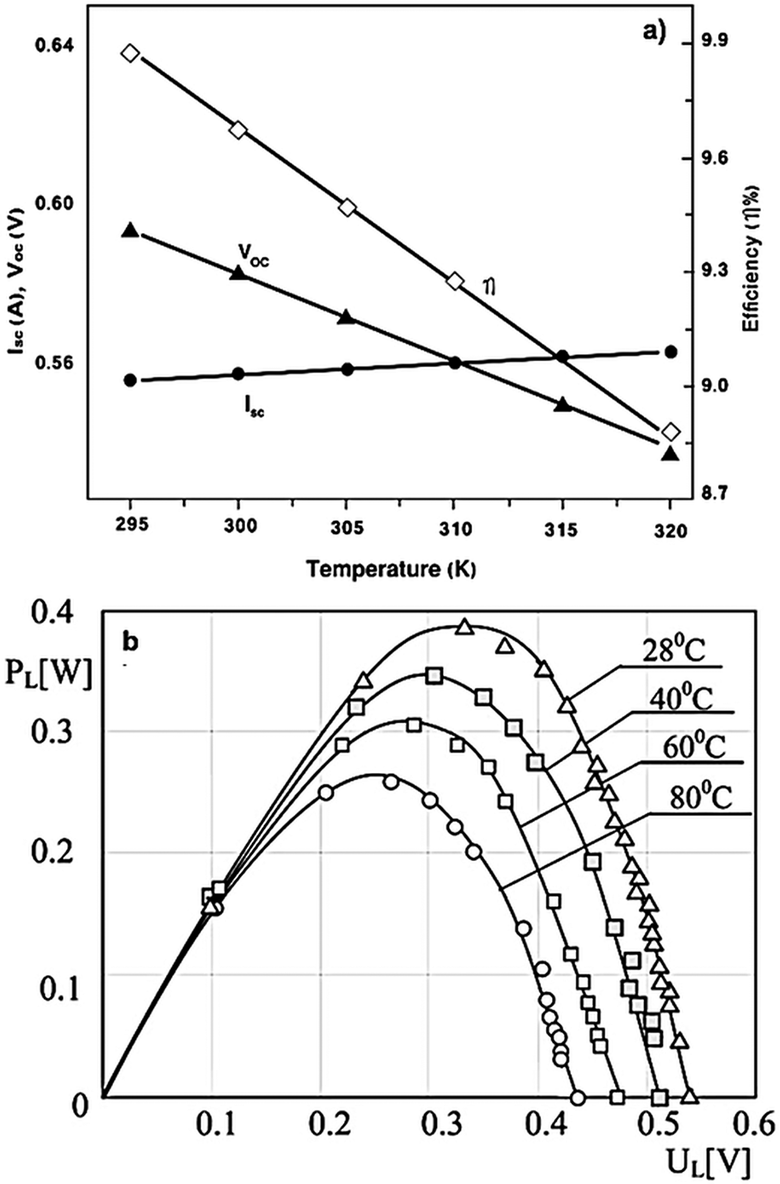
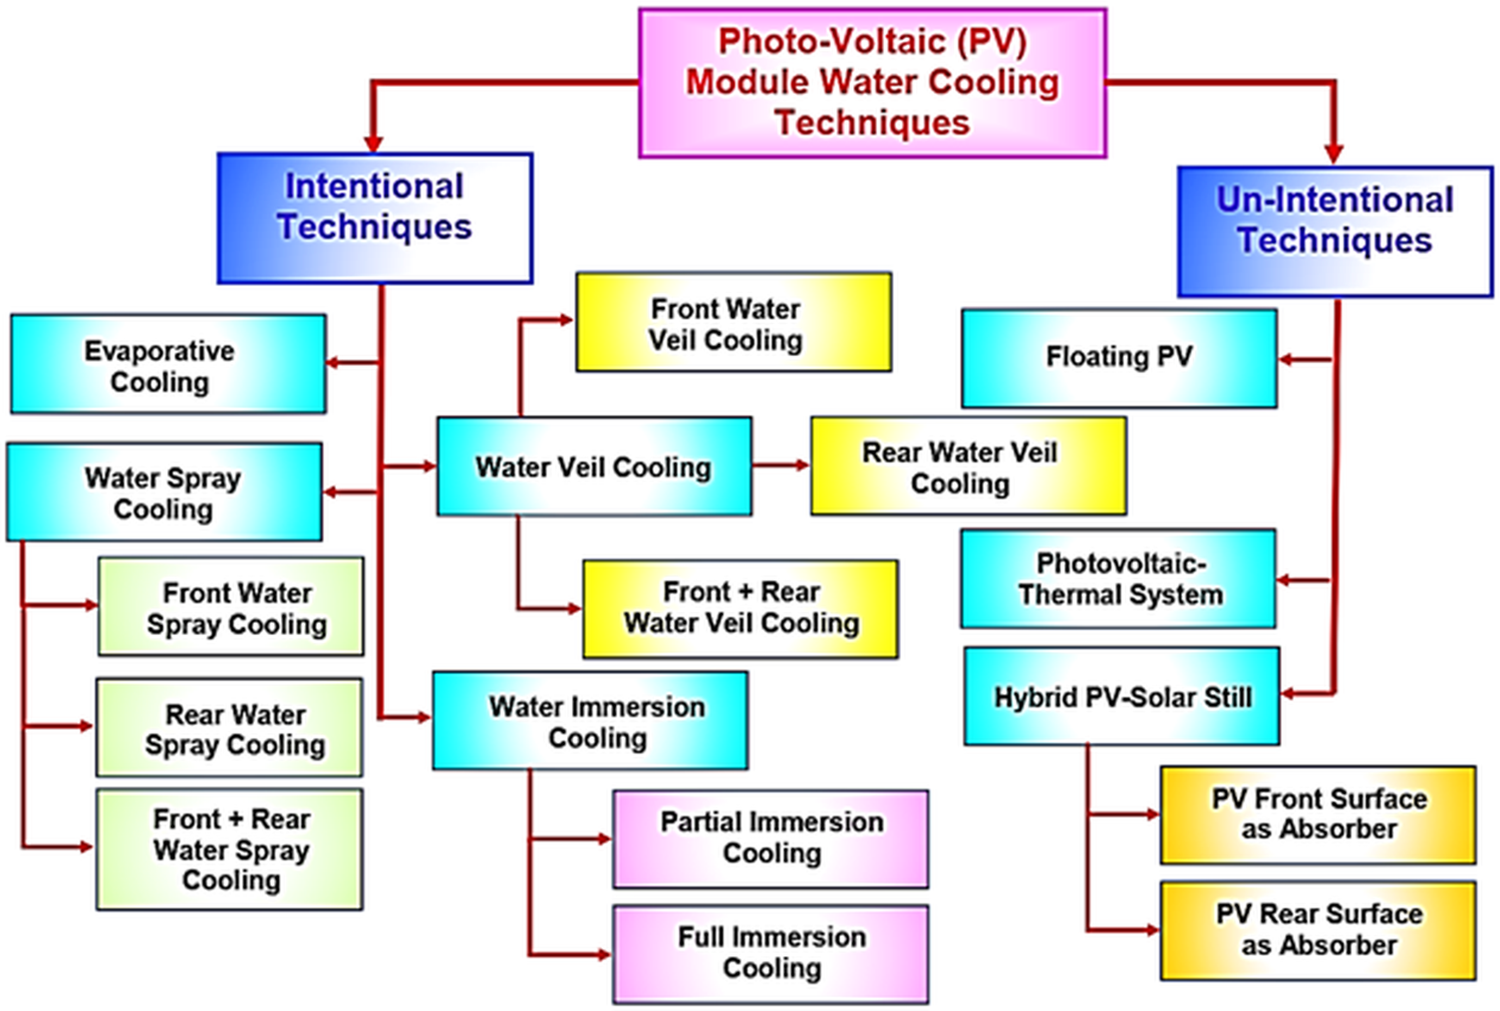
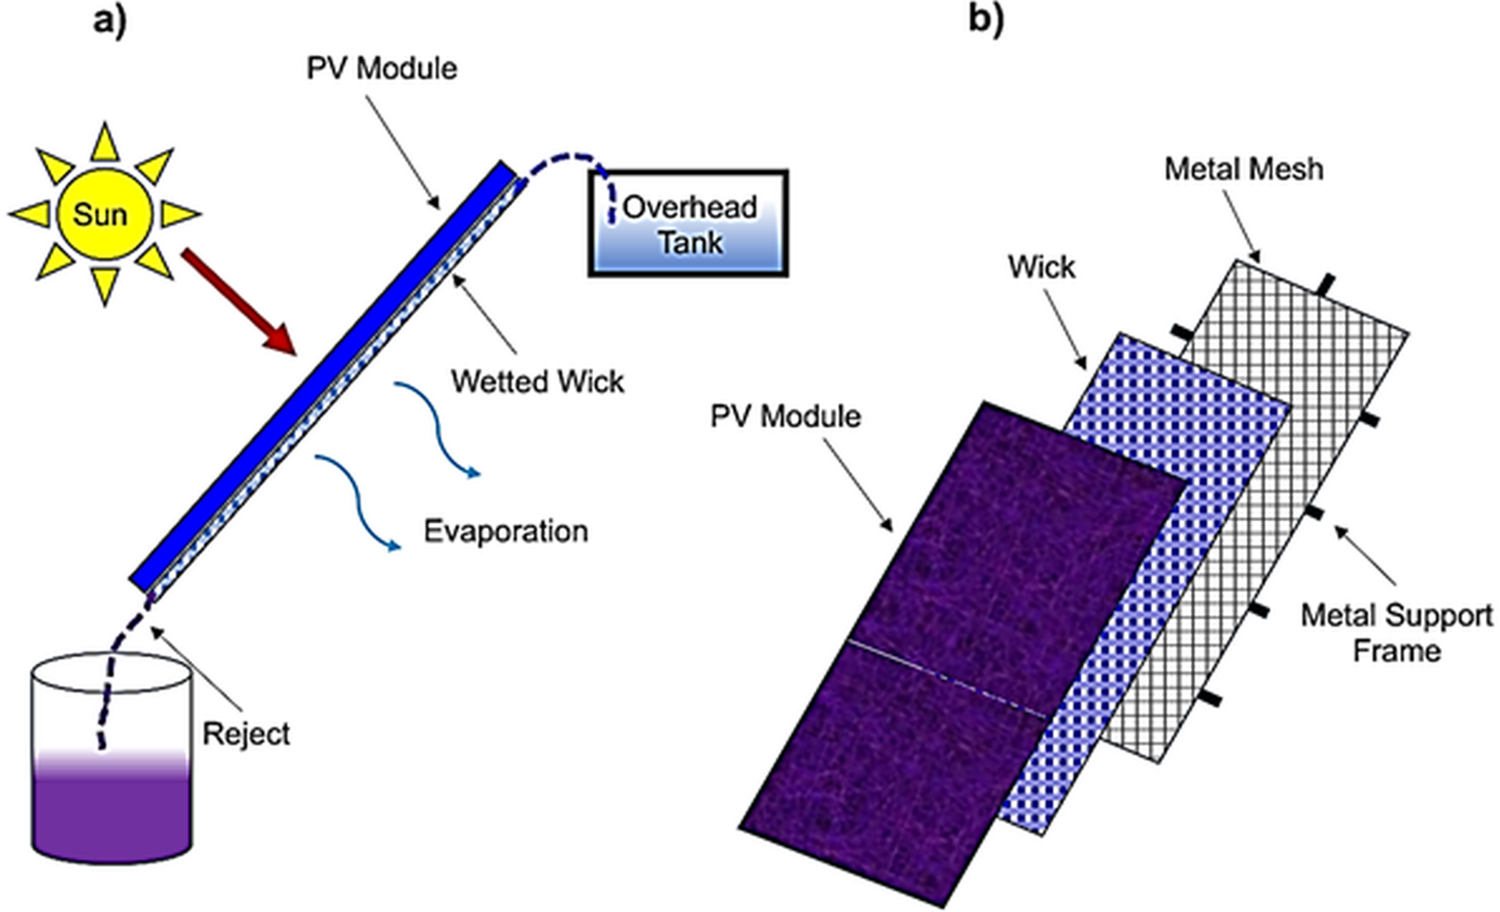
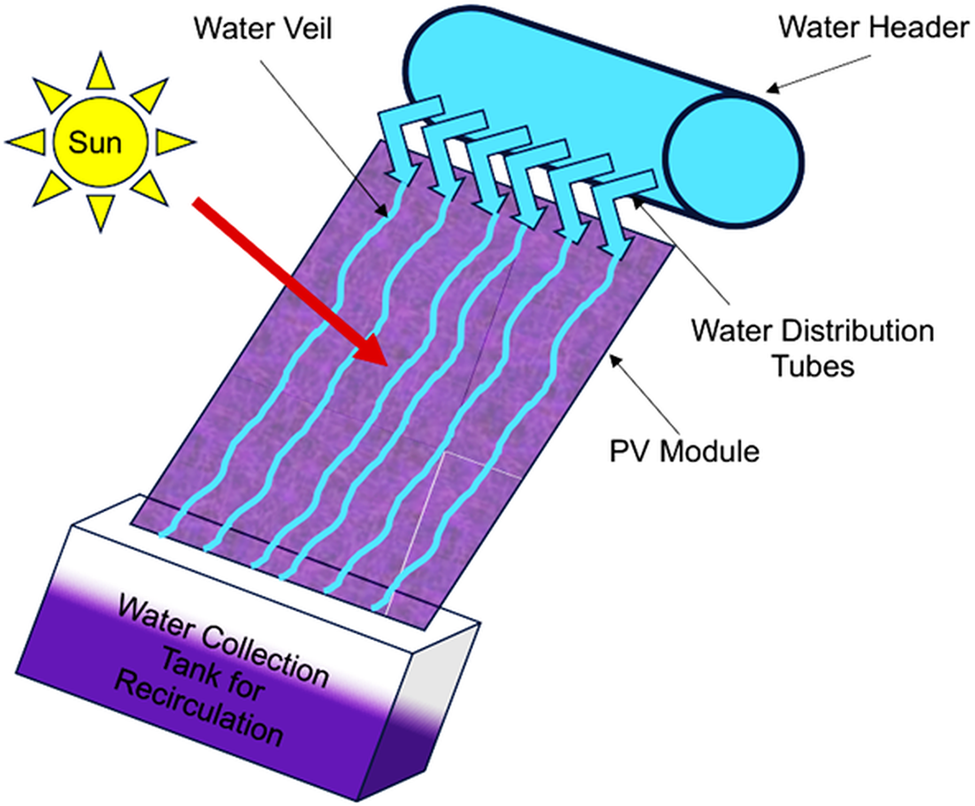
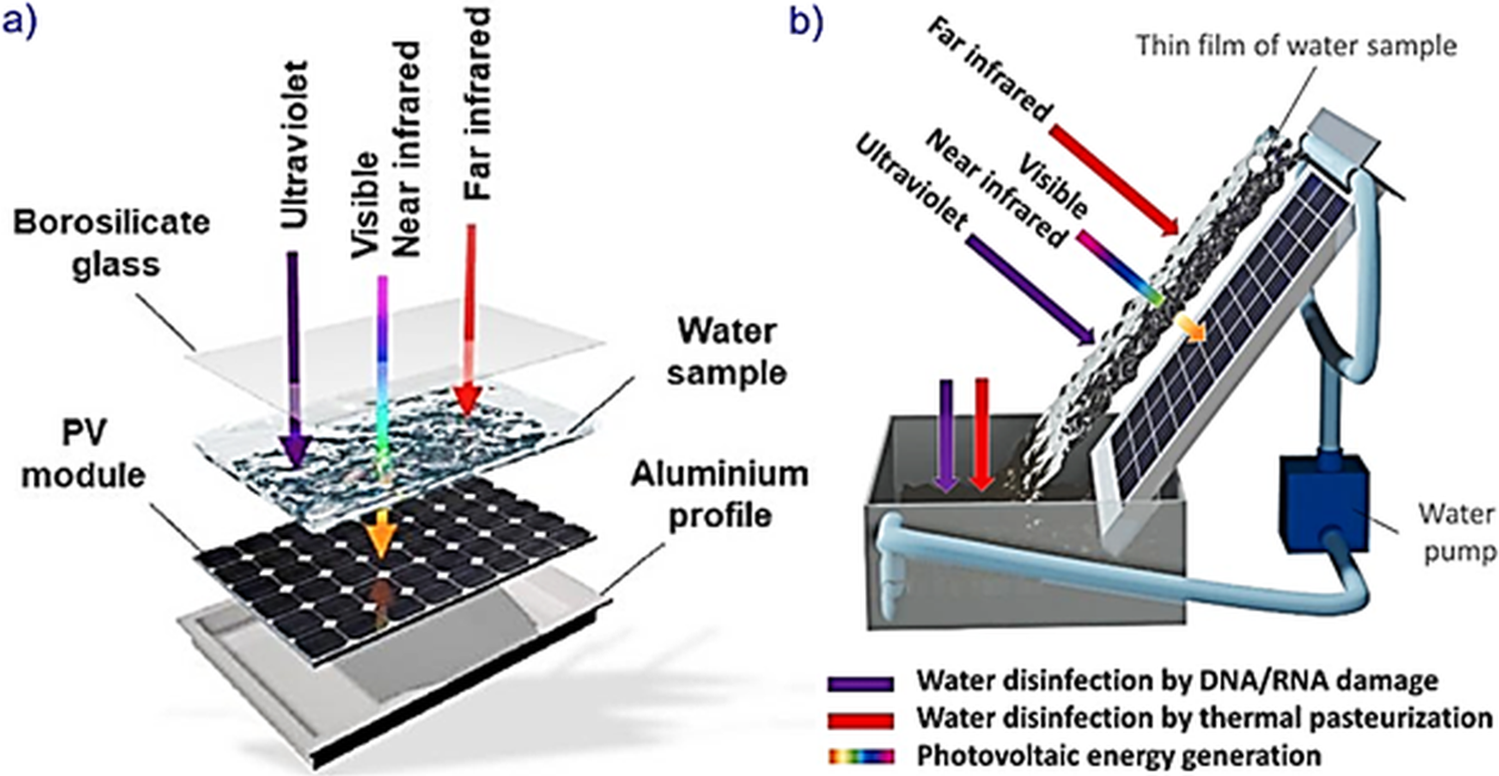
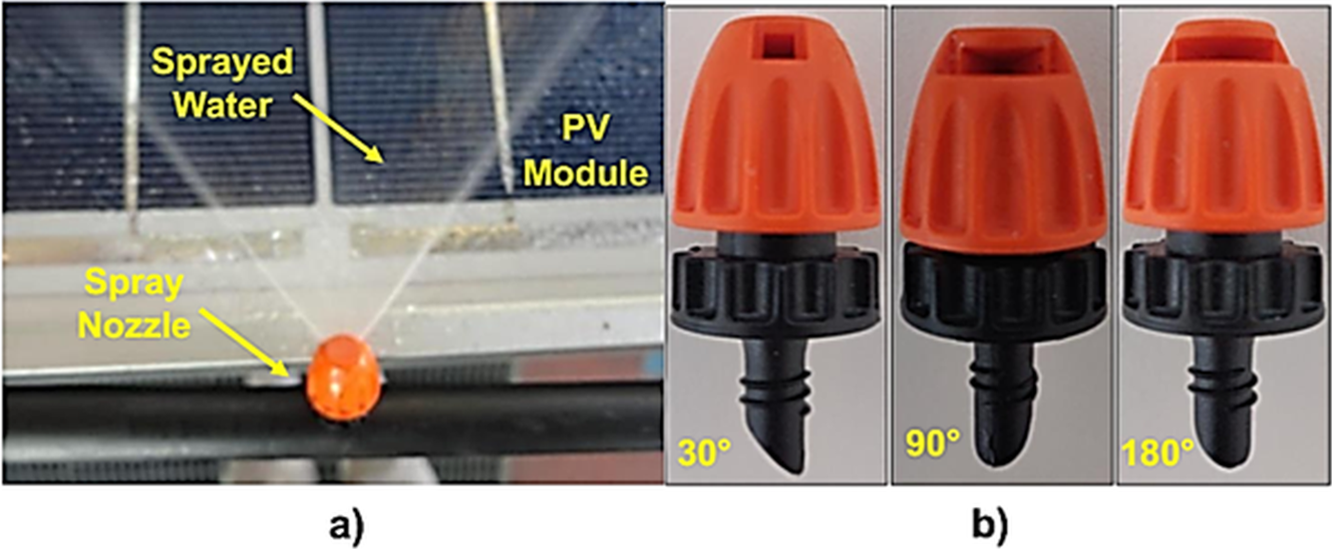
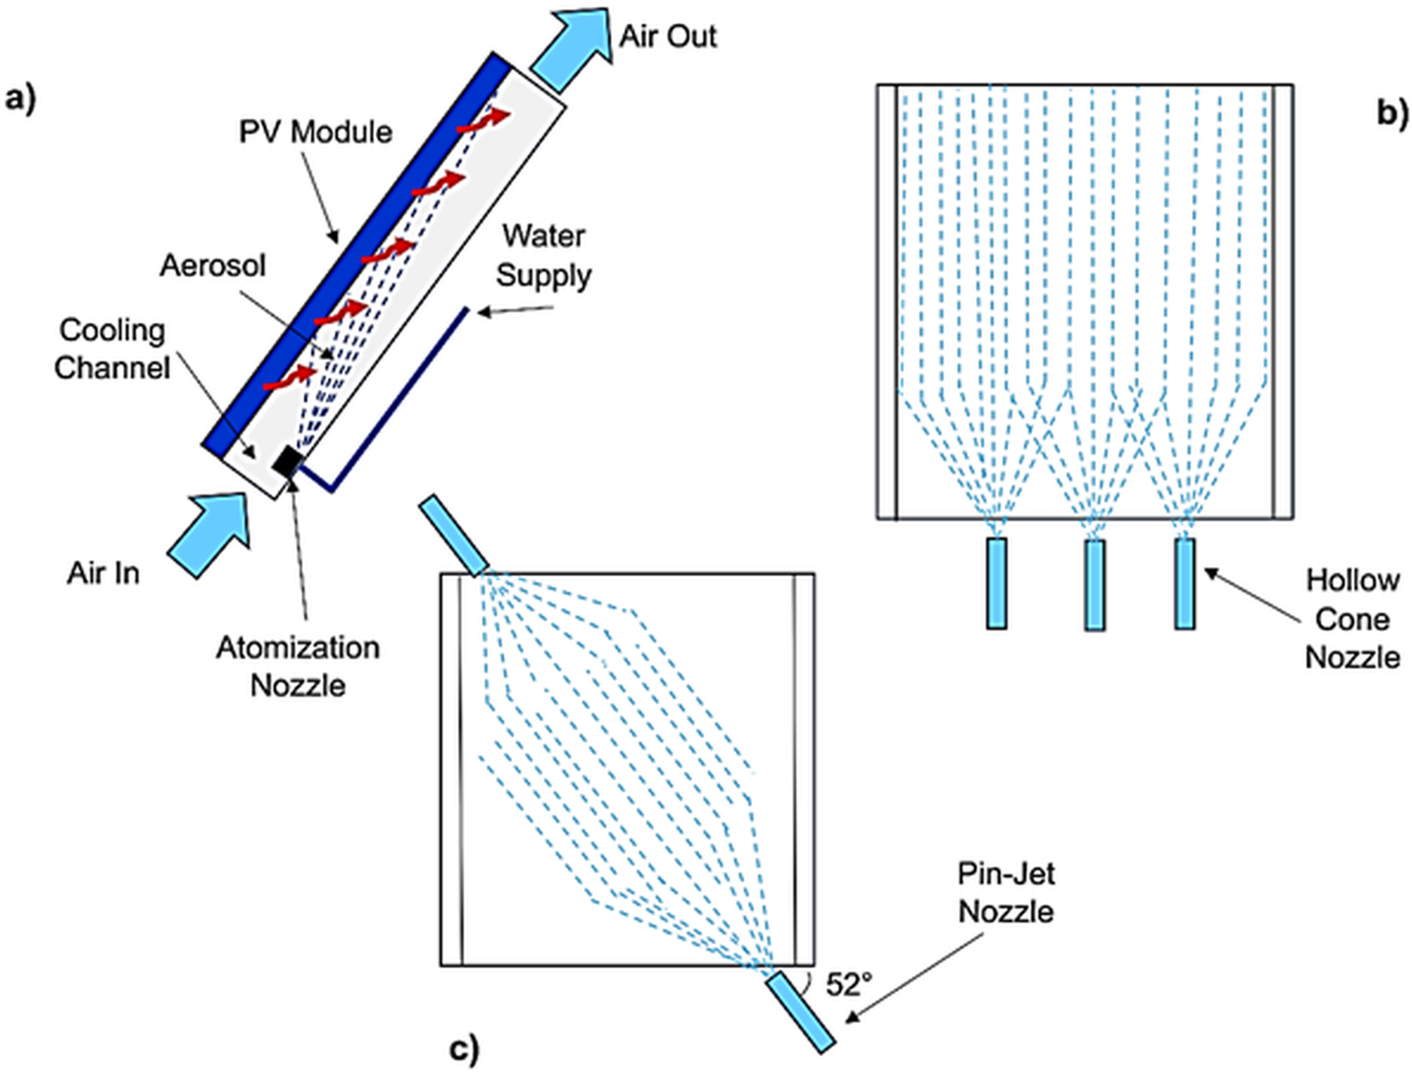
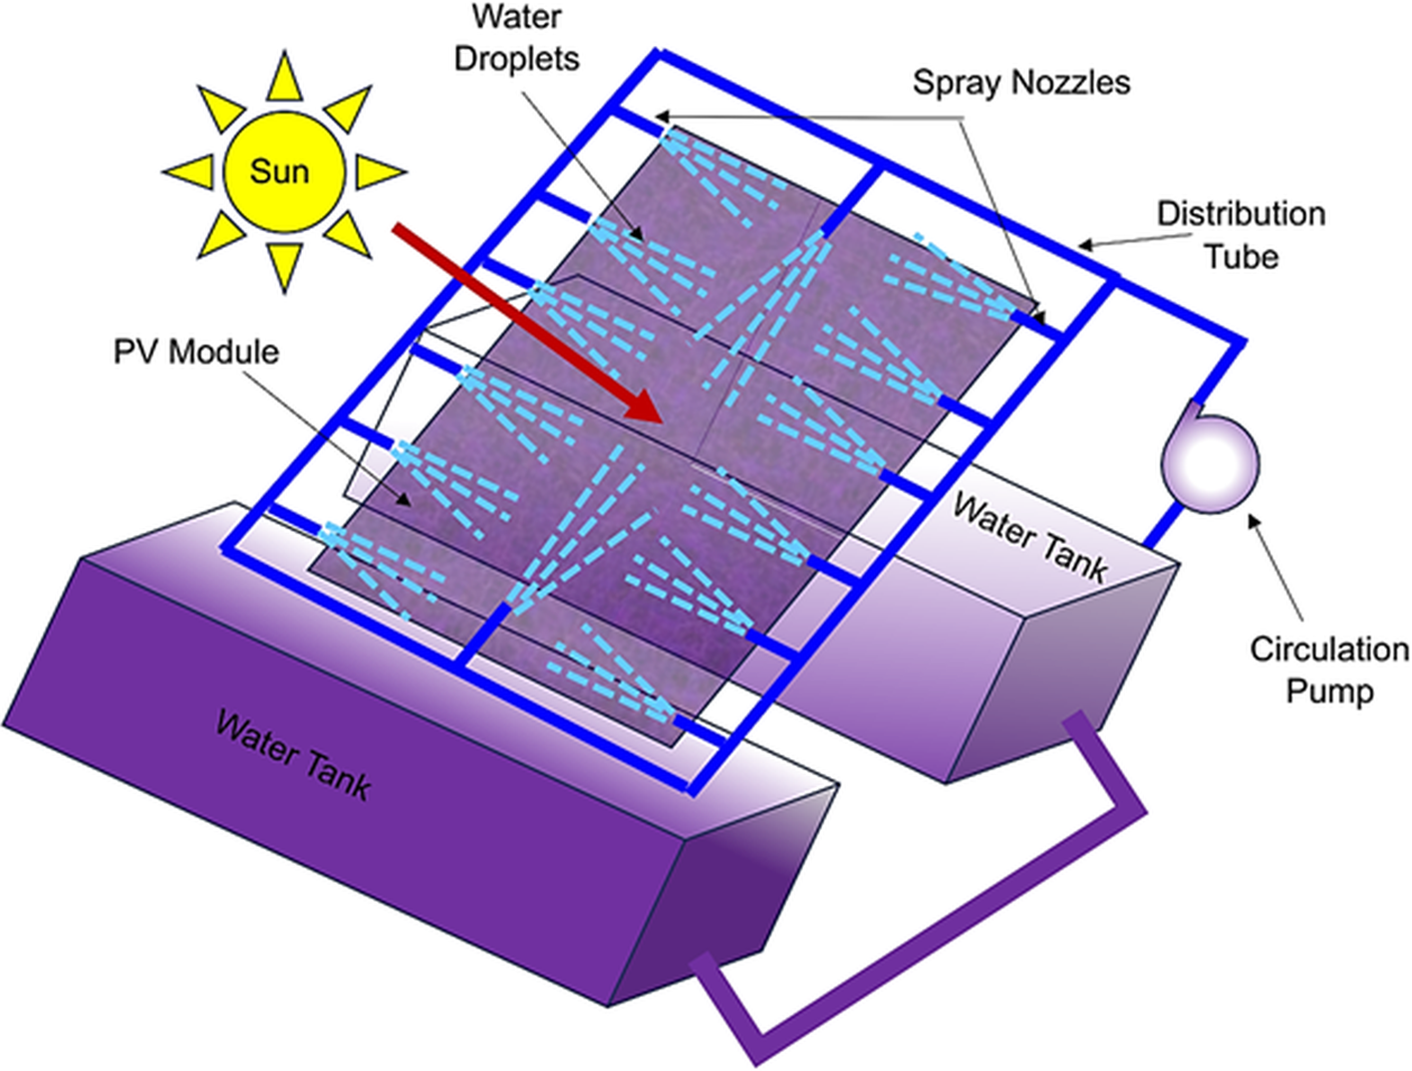
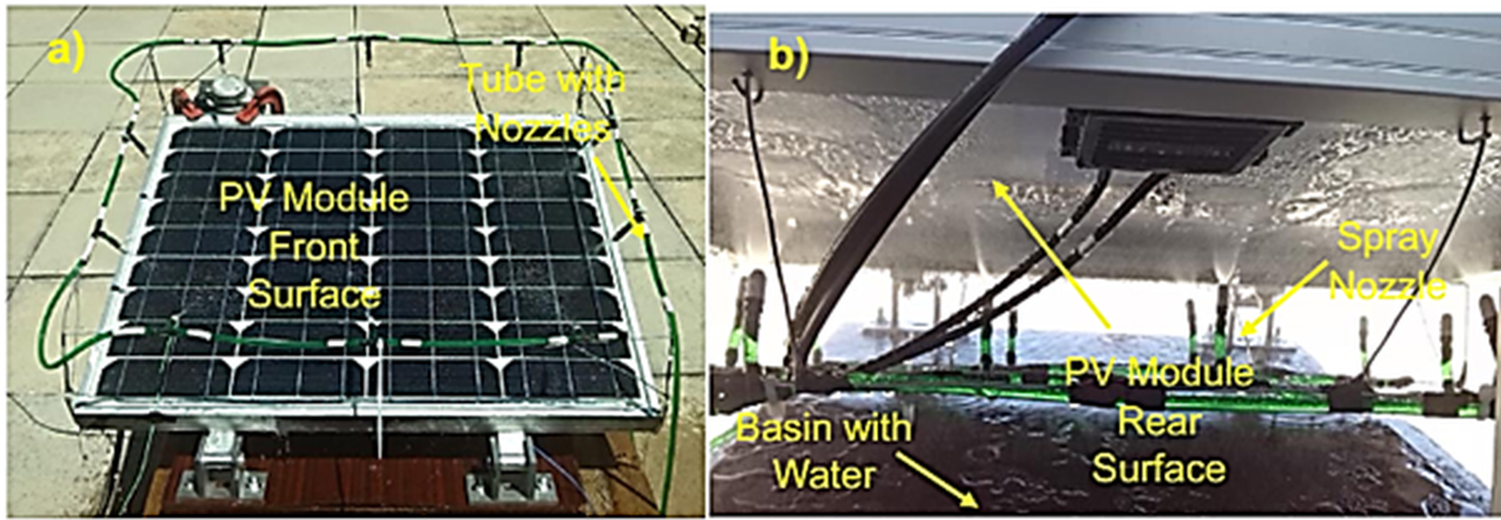
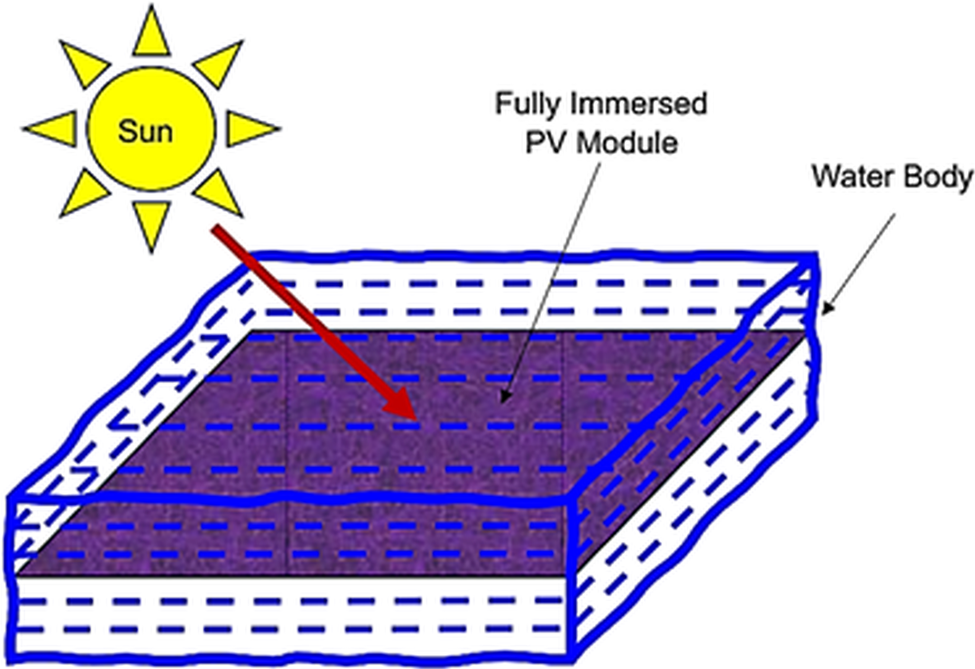
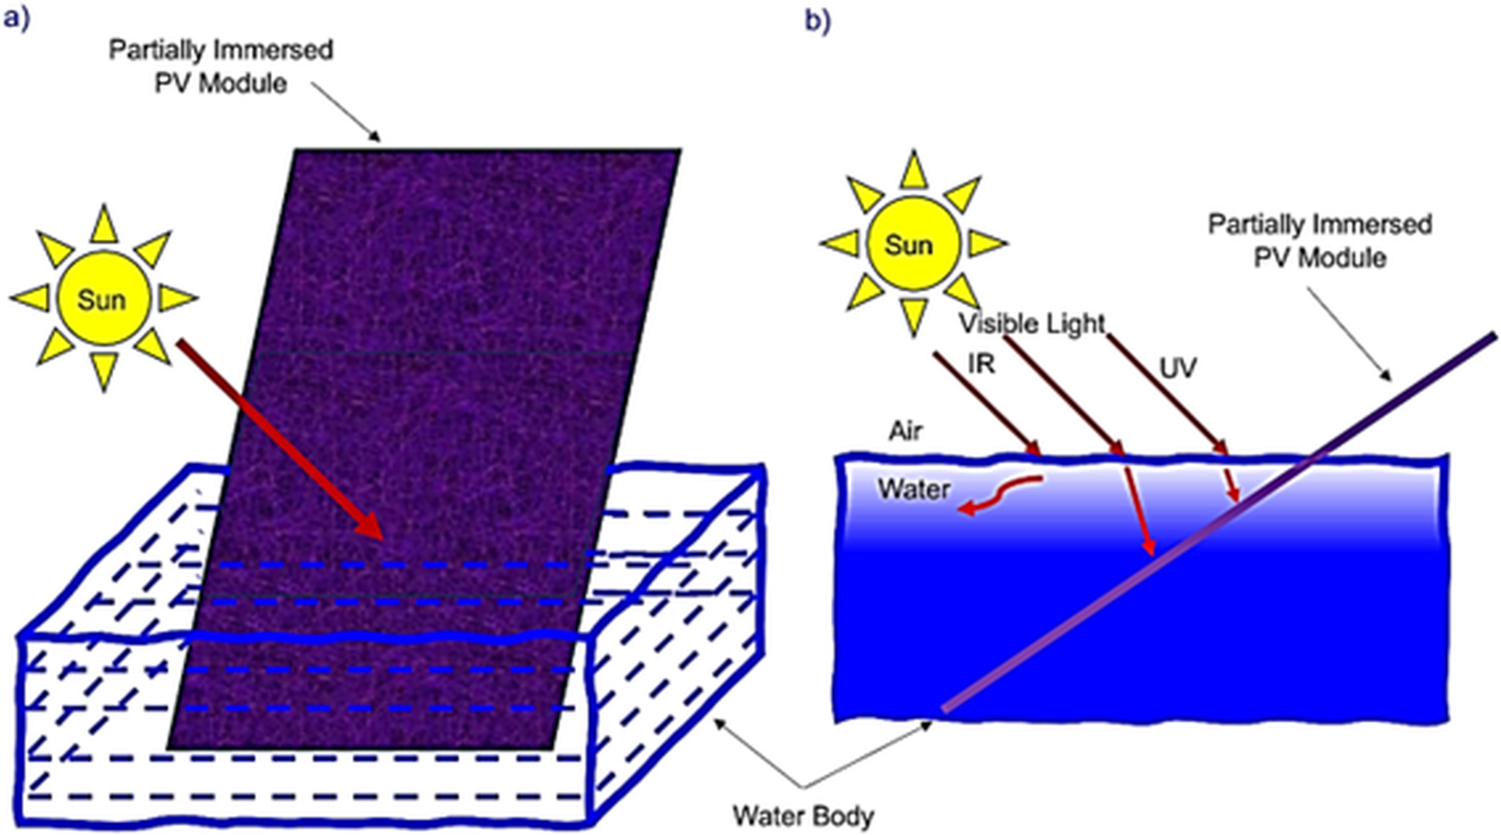
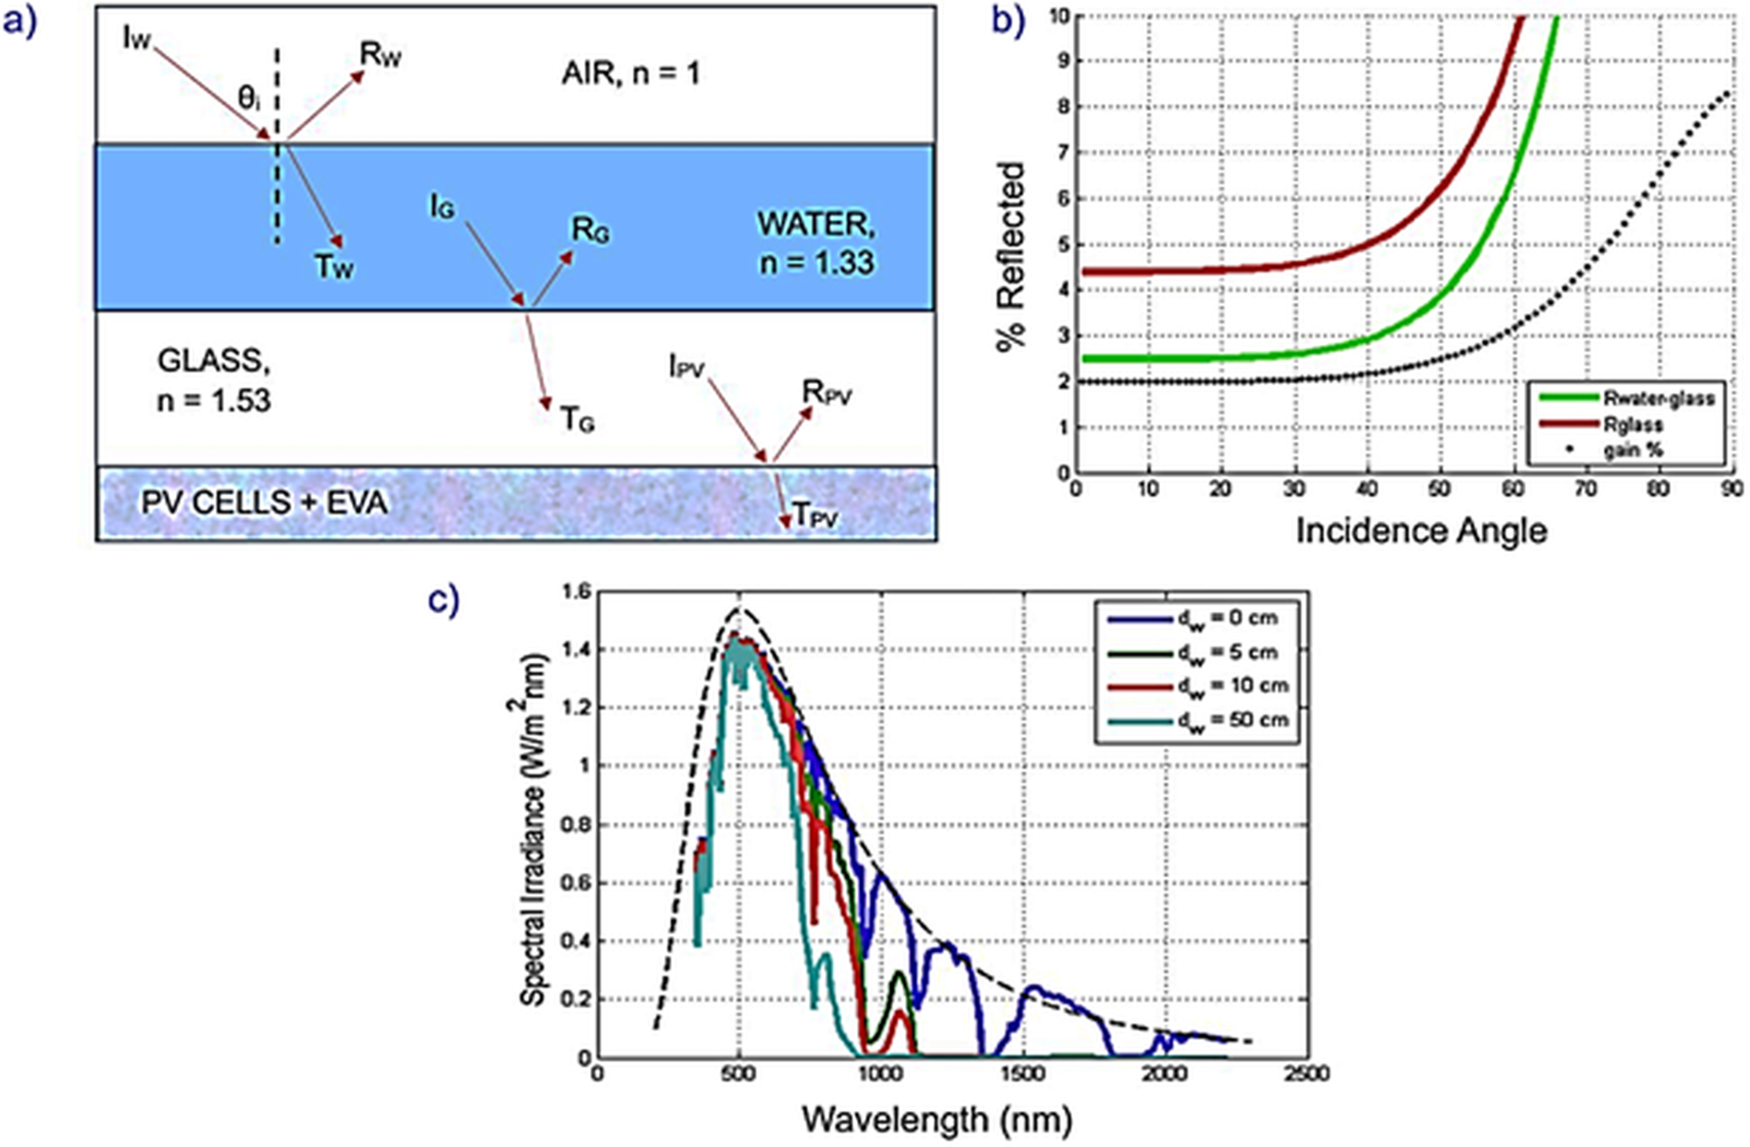
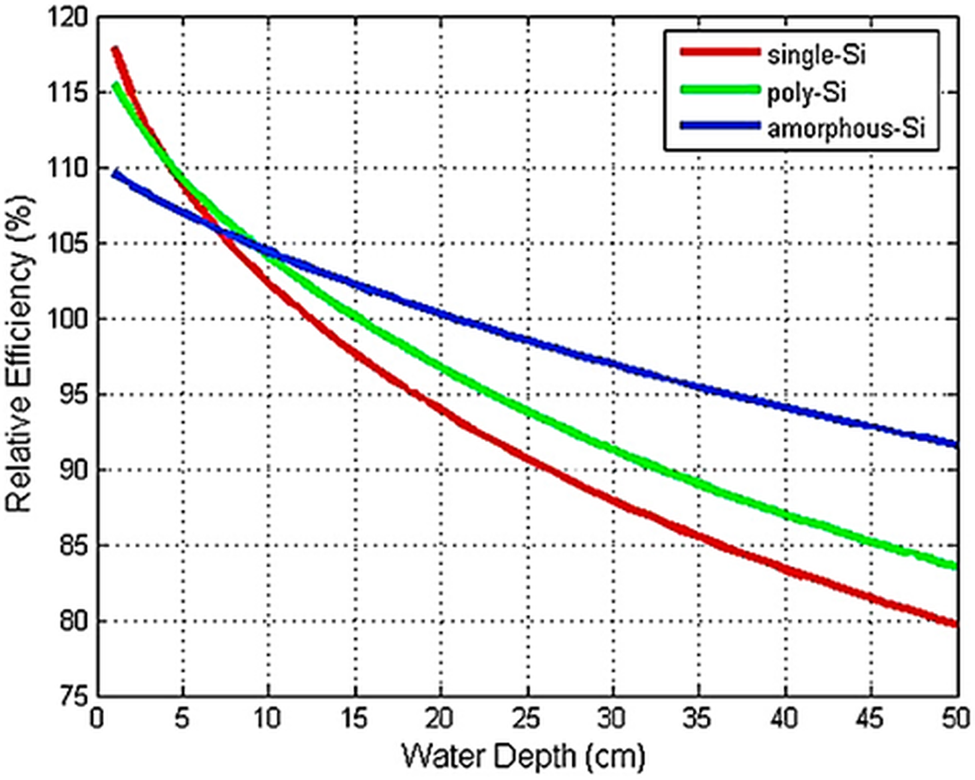
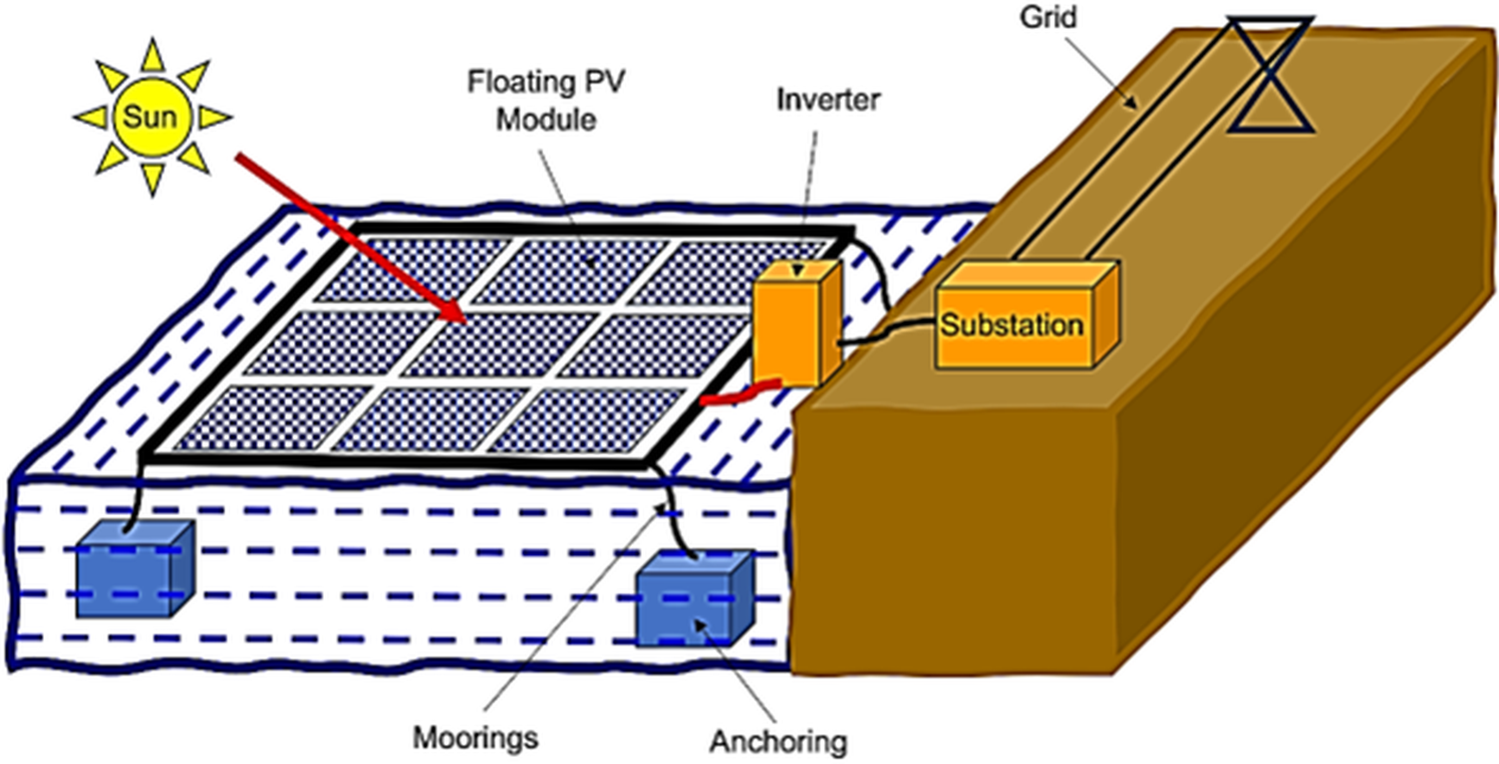
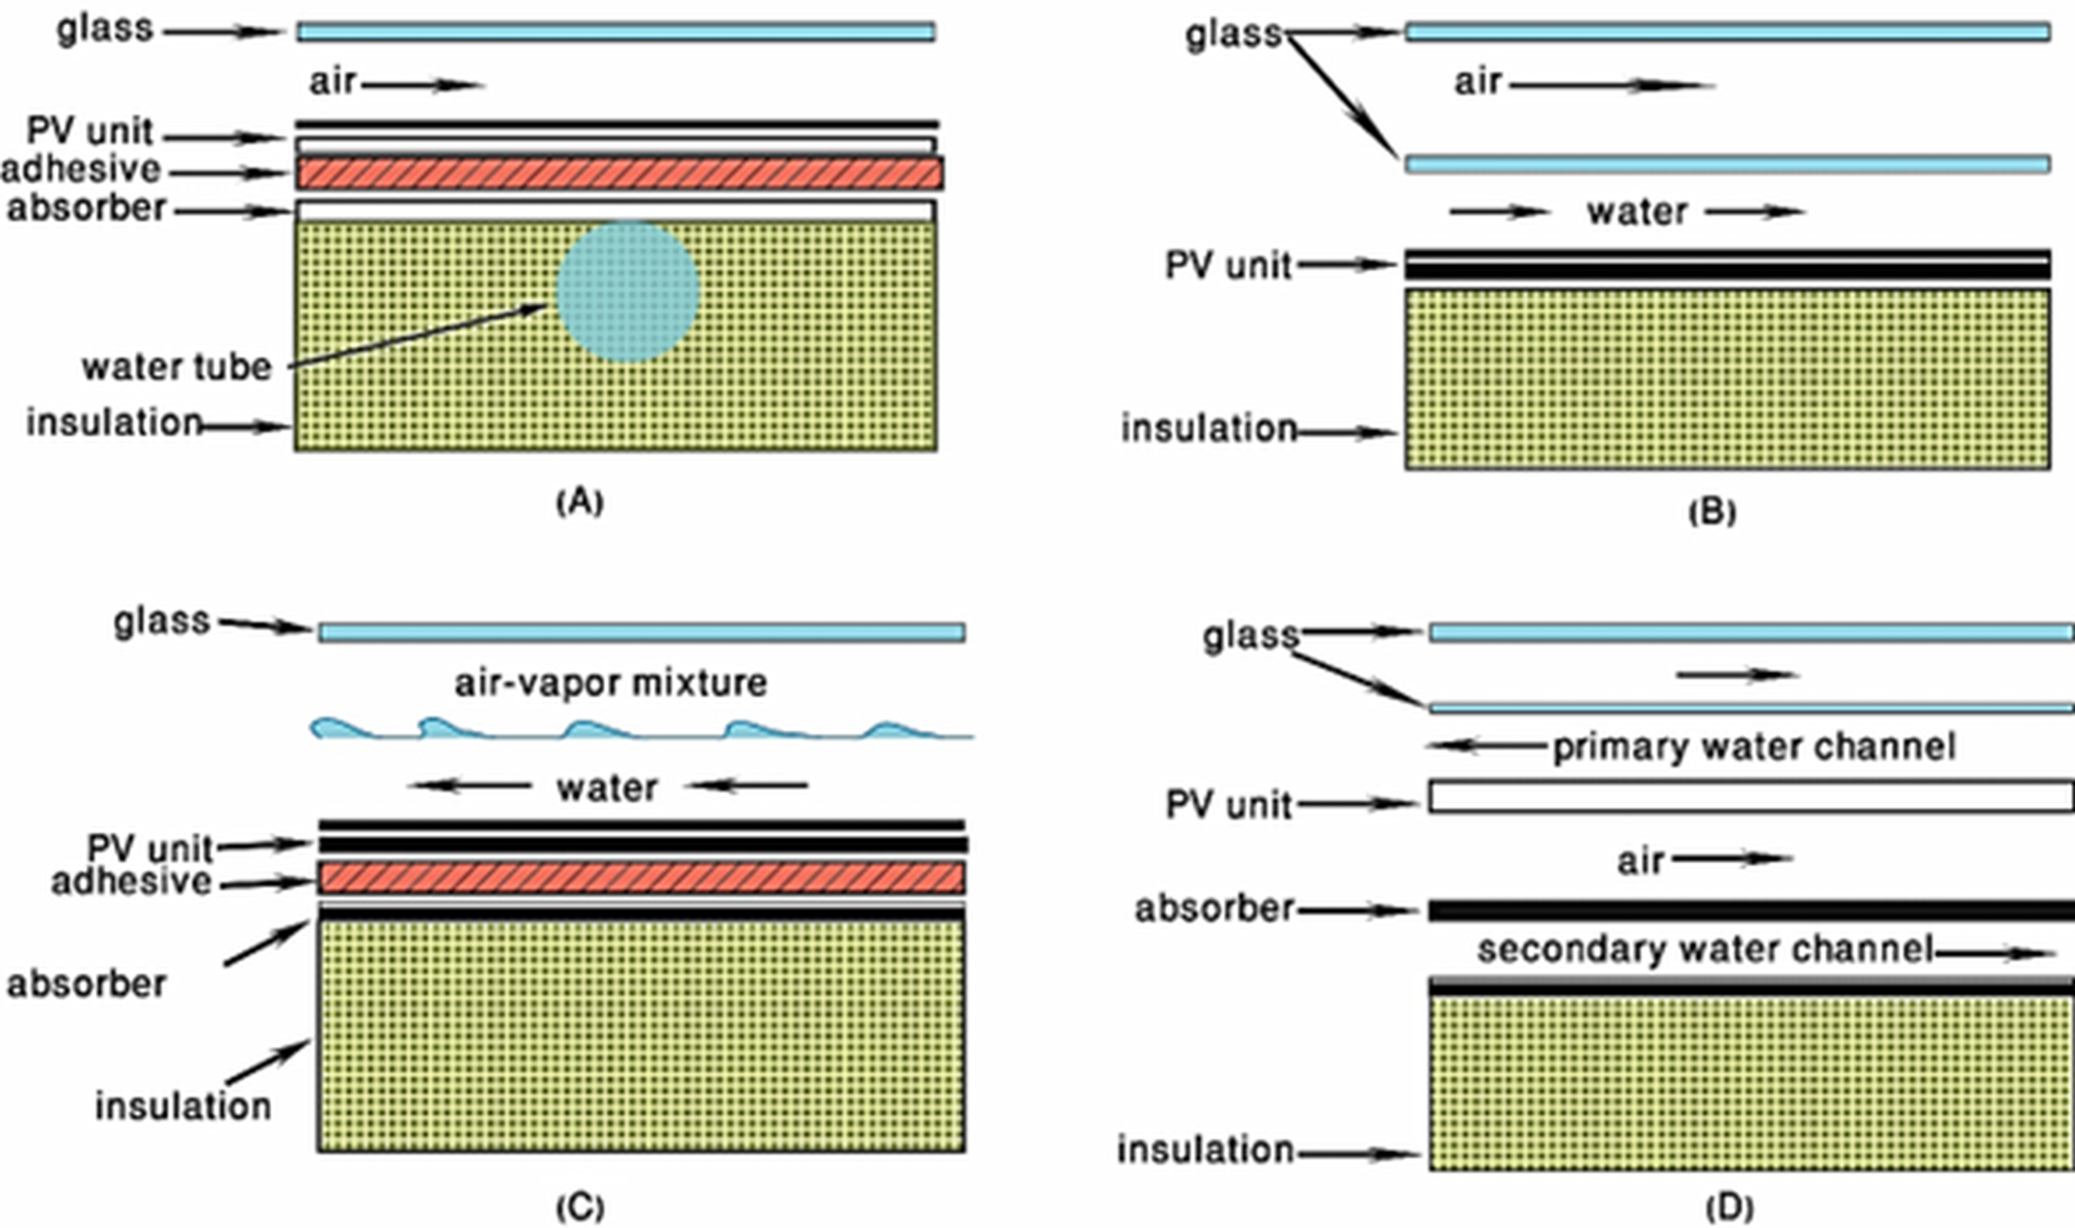
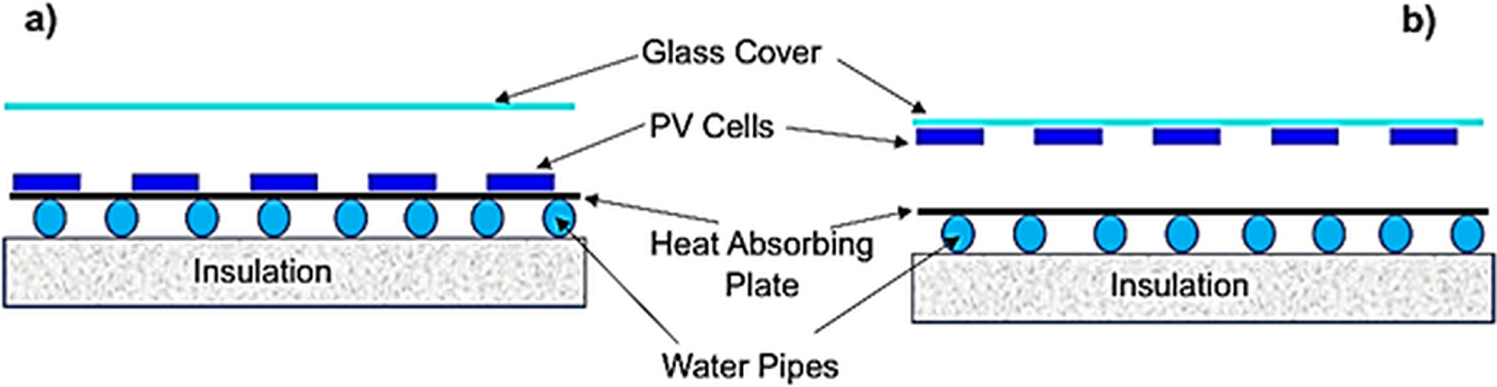
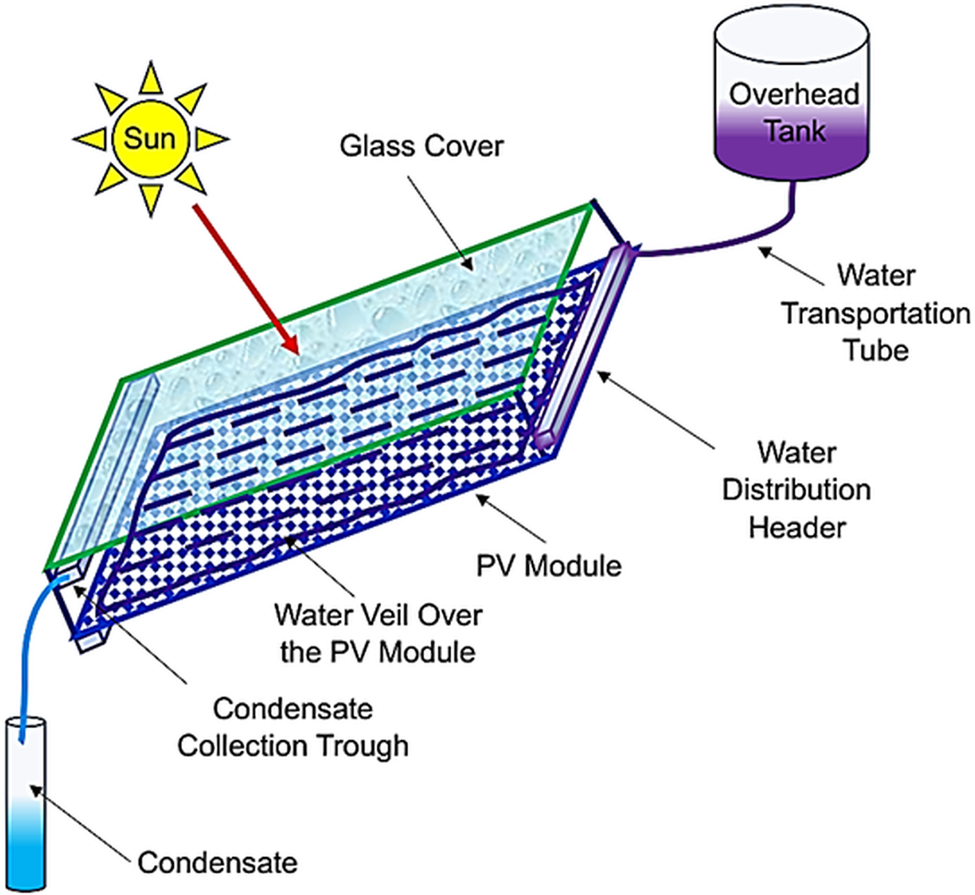
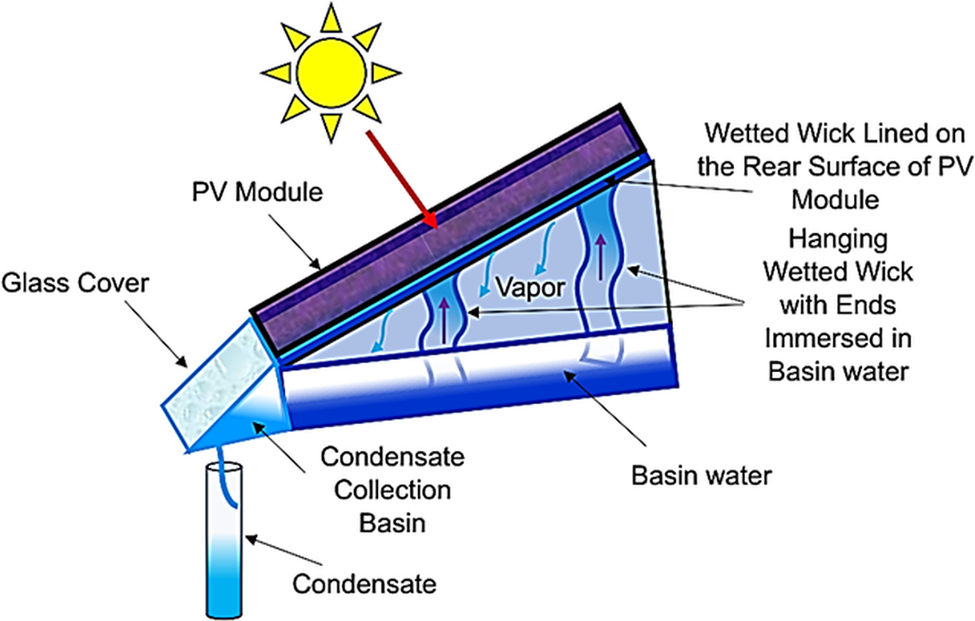
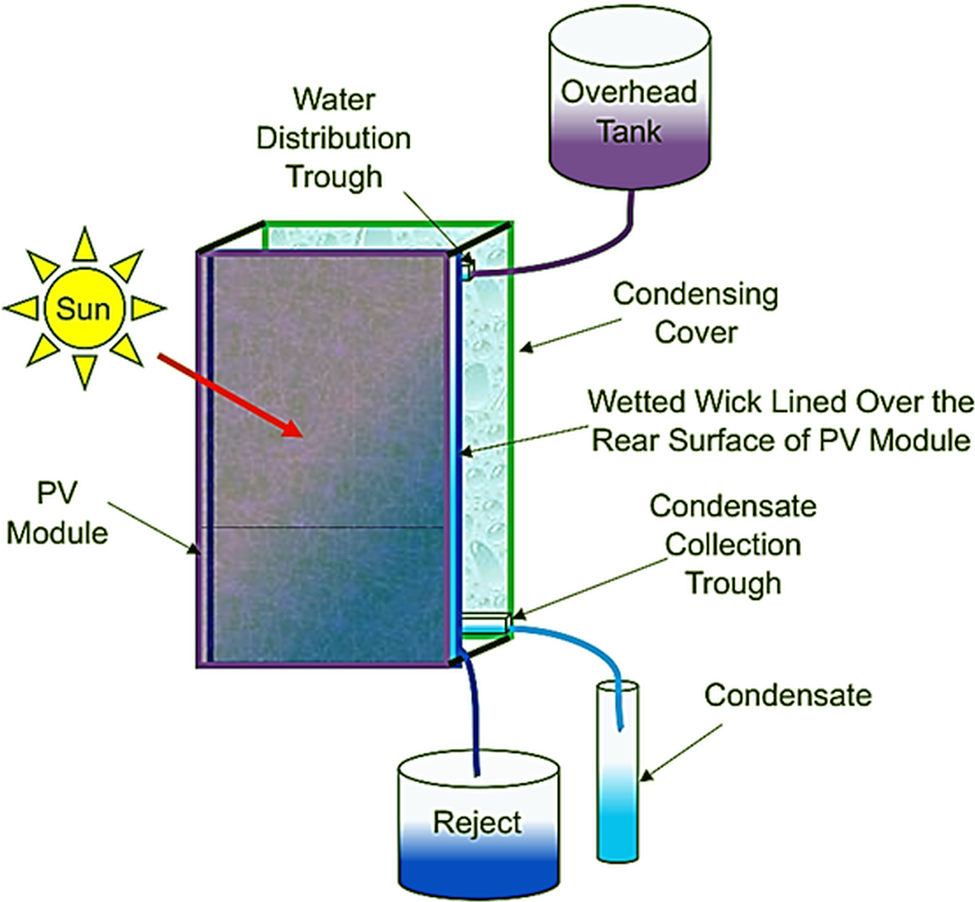
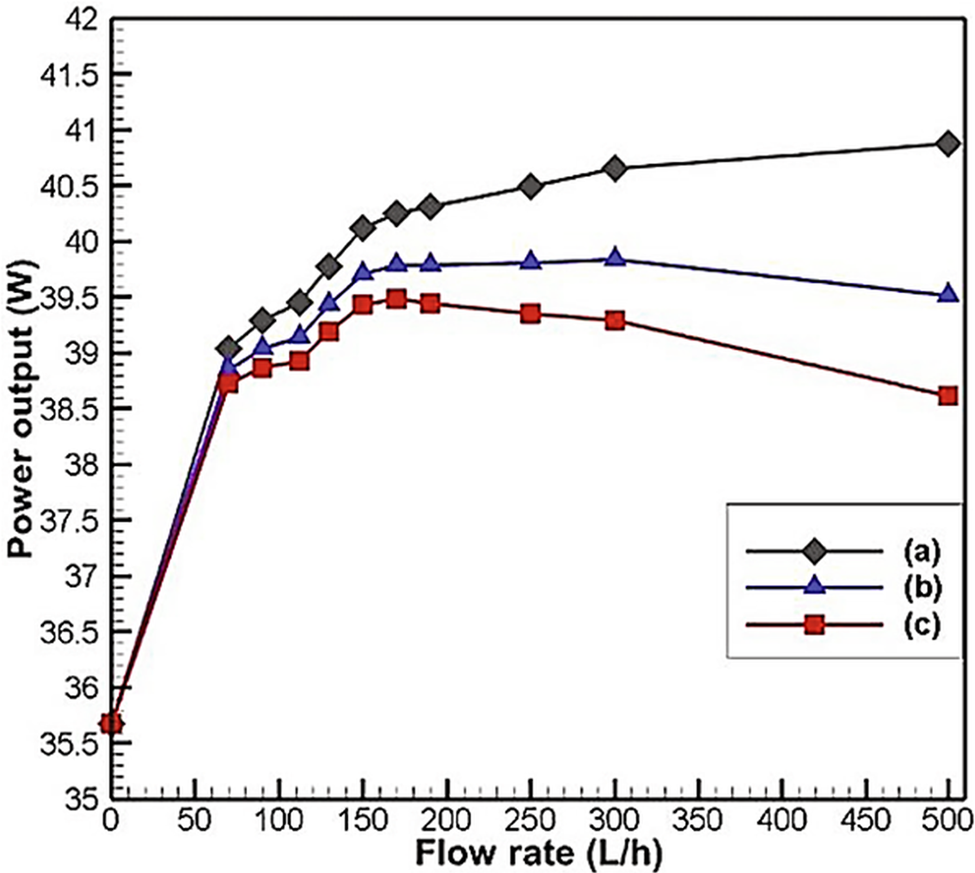
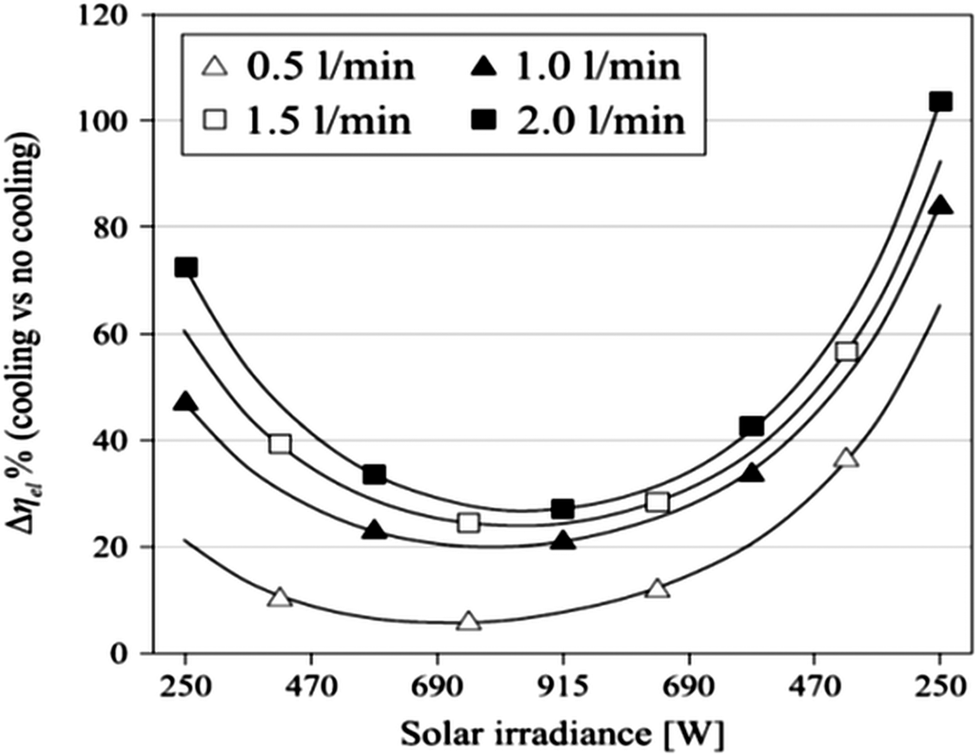
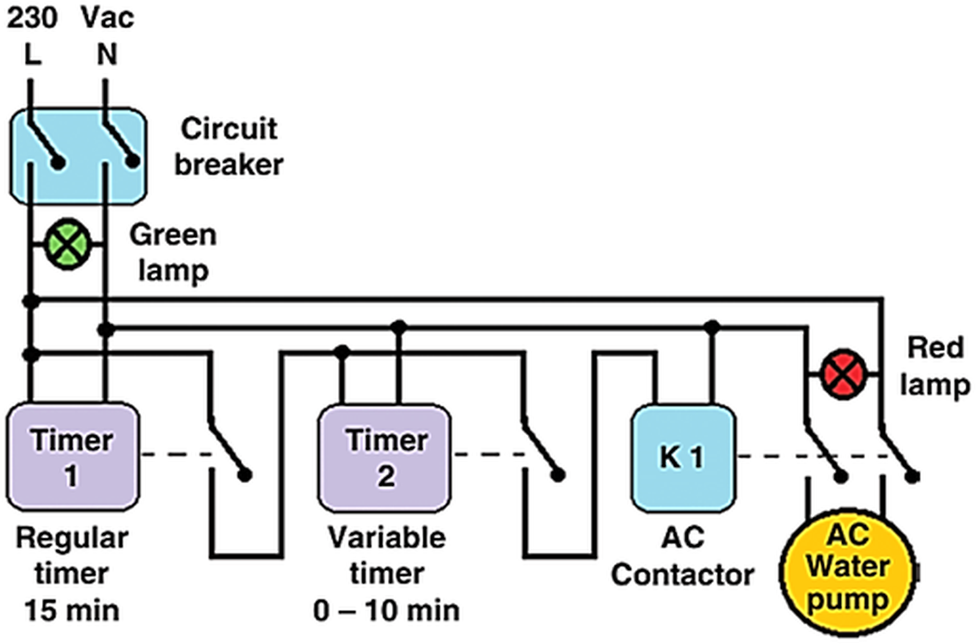
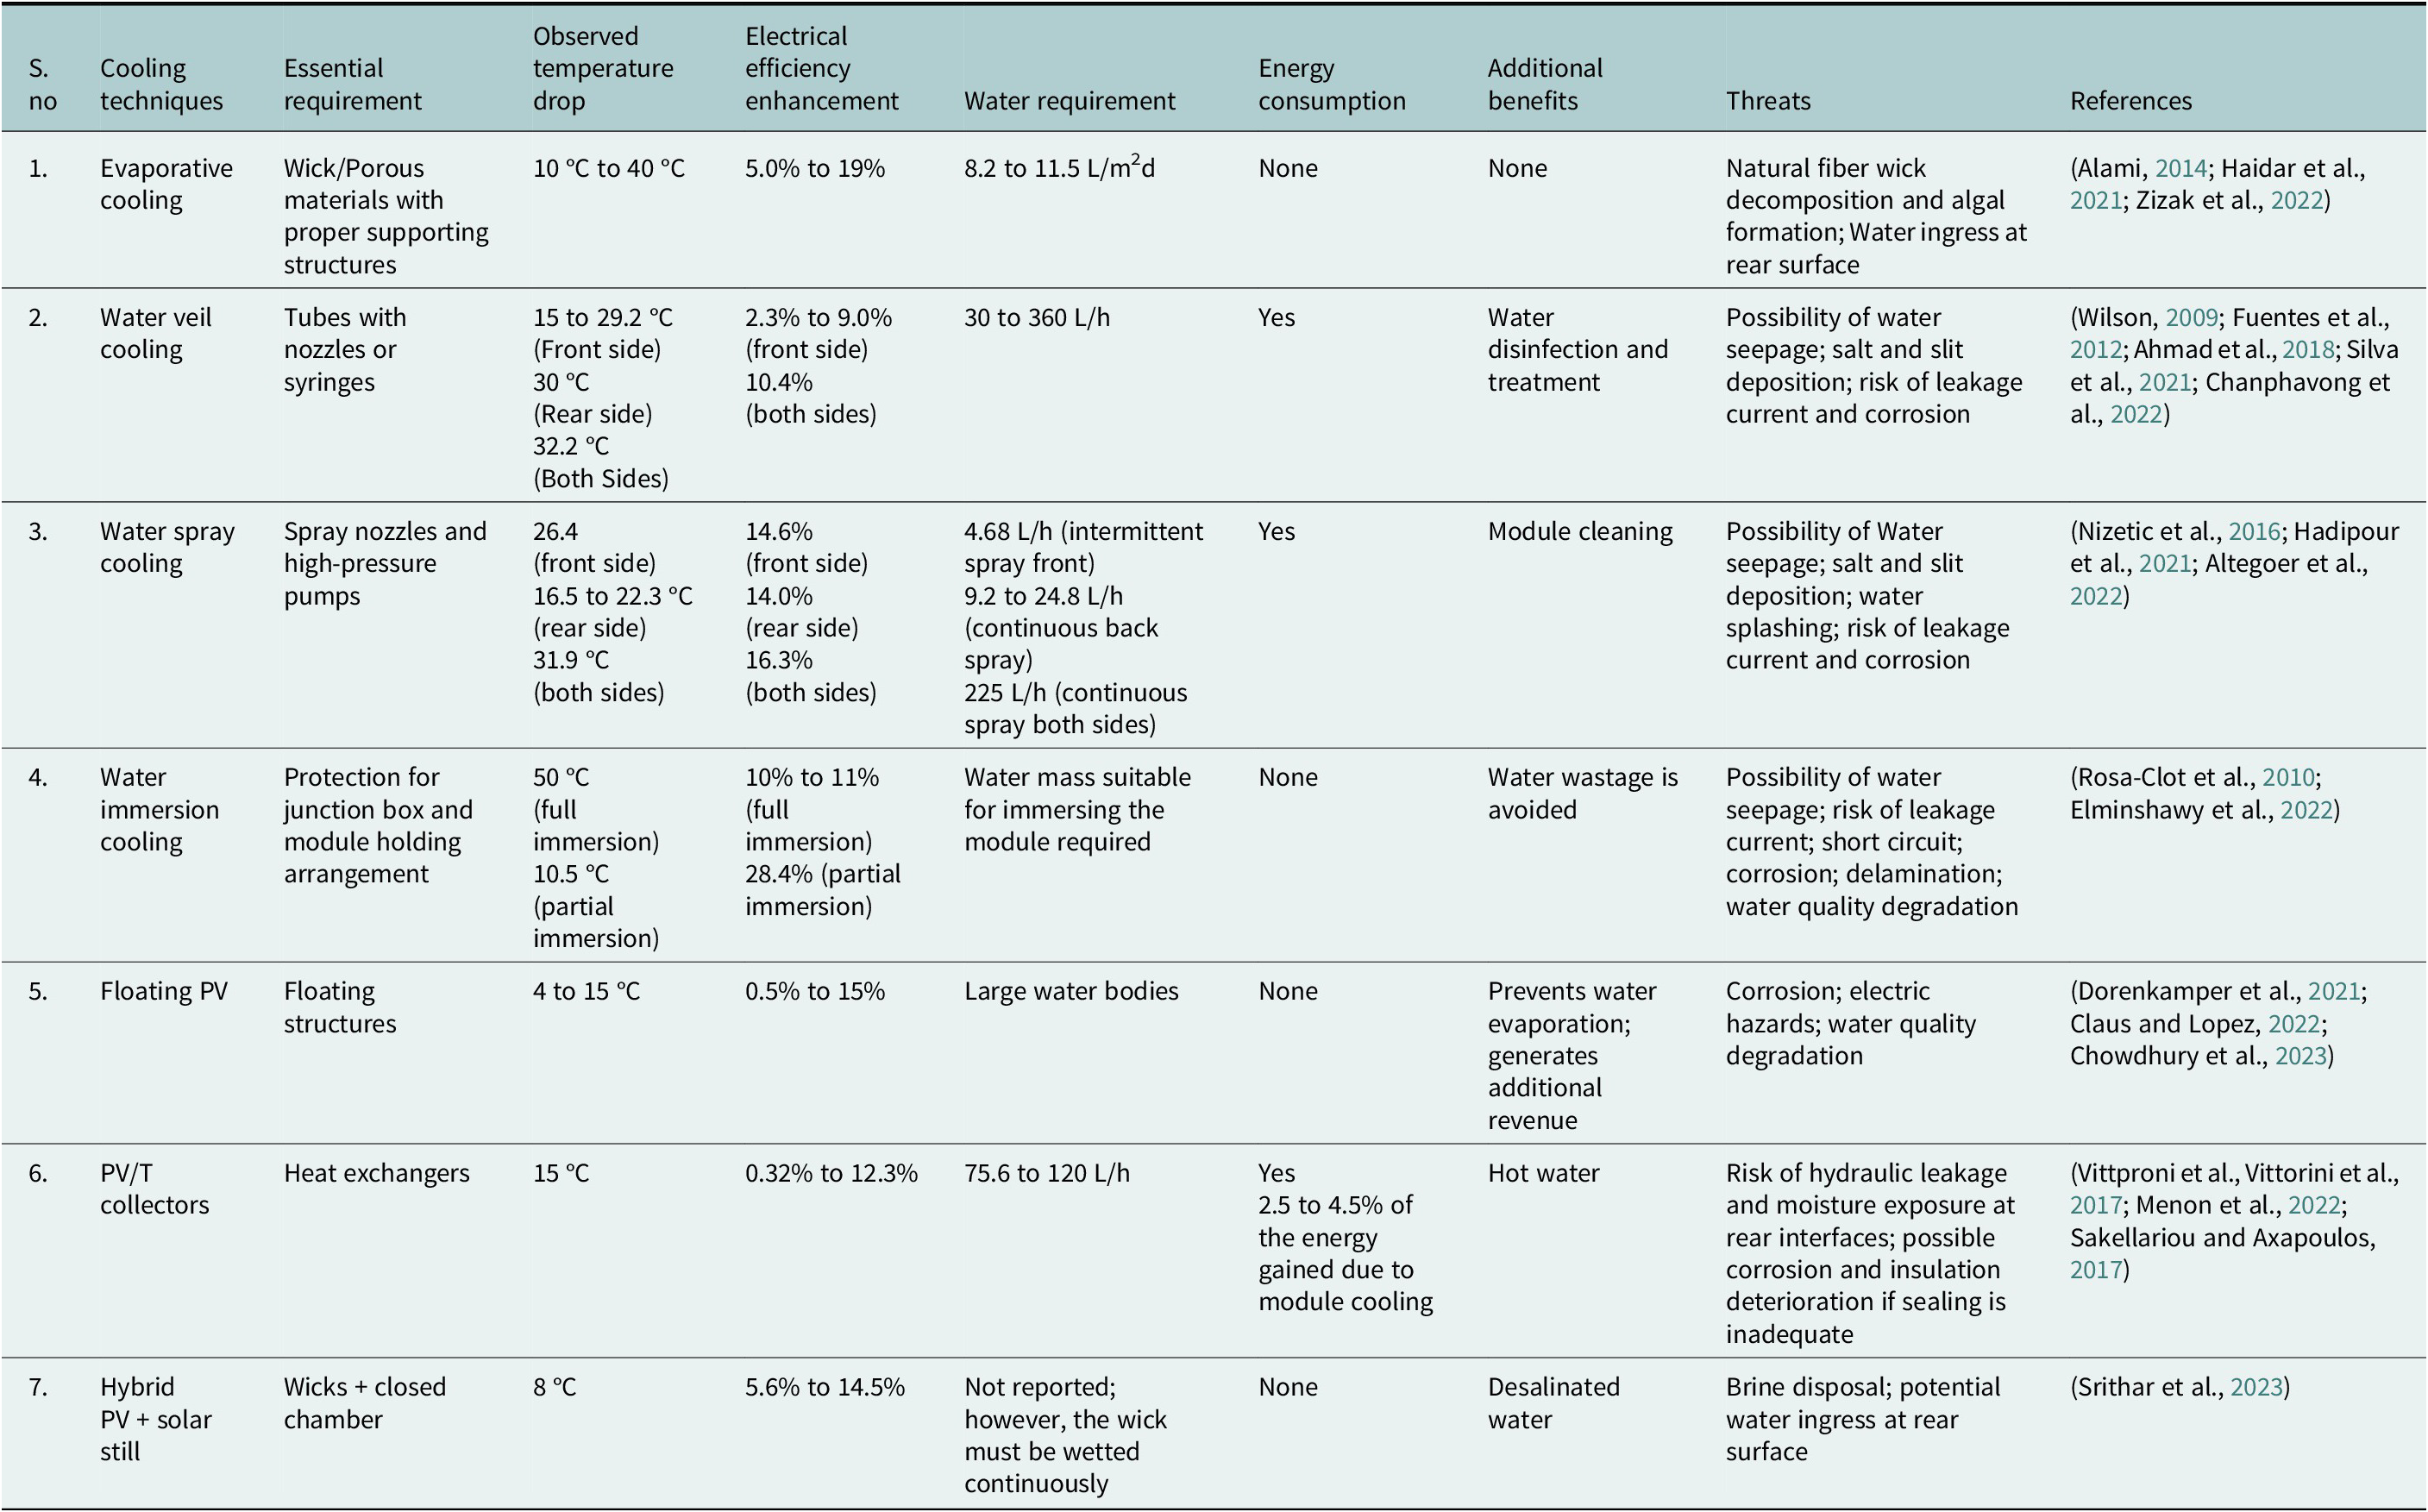


 Open access


Comments
To
The Editorial Board
Cambridge Prisms: Energy Transitions Journal
Dear Editorial Board Members,
Please find enclosed the review work titled: “A Review on Intentional and Unintentional Water-Cooling Techniques Applied to Non-Concentrating Solar Photovoltaic Modules” to be submitted as an original Overview review article to your esteemed “Cambridge Prisms: Energy Transitions Journal” for consideration of publication. The review work has been approved by all the authors and has never been published, or under consideration for publication elsewhere. The authors declare that there is no conflict of interest and no ethics have been violated in this work.
Solar photovoltaic is continuously contributing significantly for the ongoing process of smooth transition from fossil energy to clean energy. However, it suffers significant performance drop due to its rising operating temperature when exposed to solar irradiation thereby highlighting the need for suitable thermal management strategies. In this review work, the different water-based cooling strategies that have been adopted in non-concentrating photovoltaic modules have been identified, classified, reviewed, compared and the scope for further research expansion have been presented in detail. The authors believe that this review work will be an effective, easily understandable and informative short guide for both the early career and experienced researchers interested and engaged in solar energy, energy efficiency, PV module cooling and water-energy nexus-based research works.
The corresponding author acknowledges “Start-Up Research Grant” funding from the Science and Engineering Research Board (SERB), Department of Science and Technology (DST), Government of India (Grant No: SRG/2023/000017). The authors thank and acknowledge the Elsevier publication for permitting to use Figure 1, Figure 5, Figure 9, Figure 12b, 12c, Figure 13 and Figure 17 through Rightslink copyright services. Thanks, are also extended to MDPI publication for allowing to use Figure 6 through CC-BY open access license. The permissions have been included as a supplementary file. All other figures have been drawn by the authors.
We hope that the editorial board will agree with the interest of the study. We are looking forward for your positive response.
Yours Sincerely,
Sharon Hilarydoss
Assistant Professor
Indian Institute of Petroleum and Energy Visakhapatnam
Andhra Pradesh, India
Email: sharon.mec@iipe.ac.in; hsharon1987@gmail.com
Ph: +91-9994847986