

1. Introduction
The occurrence of mafic blueschists is considered one of the main points of evidence for oceanic subduction accompanied by the formation of an accretionary prism between the upper and the subducting plate (e.g. Ernst, Reference Ernst1973). Blueschist-facies rocks are mainly found to occur as large coherent terranes or as isolated blocks within a serpentinitic or pelitic matrix in tectonic mélange complexes (Hsu, Reference Hsu1968).
The P–T conditions at metamorphic peak and the subduction–exhumation paths followed by blueschist-facies rocks strongly depend on the thermal regime during subduction, which in turn depends on the age and structure of the subducting plate (e.g. Cloos & Shreve, Reference Cloos and Shreve1988a ,b), and on the time at which the rocks are subducted with respect to subduction initiation (i.e. initial versus late-subducted blueschists). Depressed thermal regimes usually develop only after a few million years following subduction initiation (Gerya & Stockhert, Reference Gerya and Stockhert2006), and rock units that are subducted later may escape a first heating stage that is commonly experienced by units that are underplated in the nascent accretionary wedge at subduction initiation (Ukar, Reference Ukar2012).
The common occurrence within a single accretionary complex of blueschists that have reached different depths and followed different subduction–exhumation paths (e.g. Agard et al. Reference Agard, Searle, Alsop and Dubacq2010) testifies to the complexity of the tectonic and thermal structure of an evolving accretionary wedge.
In Central Iran, the Anarak Metamorphic Complex (AMC) is interpreted as a fossil accretionary prism (Sharkovski, Susov & Krivyakin, Reference Sharkovski, Susov and Krivyakin1984; Bagheri & Stampfli, Reference Bagheri and Stampfli2008) developed in the framework of the northward subduction of the Palaeo-Tethys beneath the southern Eurasian margin (e.g. Şengör, Reference Şengör1979). The AMC consists of several units, some of which were metamorphosed at blueschist-facies conditions (Zanchi et al. Reference Zanchi, Zanchetta, Garzanti, Balini, Berra, Mattei, Muttoni, Brunet, Wilmsen and Granath2009, Reference Zanchi, Malaspina, Zanchetta, Berra, Benciolini, Bergomi, Cavallo, Javadi and Kouhpeyma2015). The difference in lithological composition, metamorphic peak conditions and age of metamorphism led some authors to consider the AMC as a composite complex, formed during tectonic events that were separated in time and space.
In this paper, we address the petrographic and textural features of mafic blueschists of the AMC, in order to reveal the recrystallization stages and the deformation–metamorphism relationships in the Chah Gorbeh, Morghab and Ophiolitic complexes. We also performed thermodynamic modelling in order to estimate the P and T conditions of each metamorphic stage recognized in the analysed samples.
The whole dataset of petrographic, microstructural and thermodynamic data is then used to define the P–T trajectories of mafic blueschists from the three units. The results are then discussed in the context of accretionary wedge dynamics and AMC tectonic significance.
2. Geological setting
The AMC crops out in Central Iran, to the east of Nain (Fig. 1). It consists of several subunits exposed for c. 150 km in an E–W-trending belt, stacked together during polyphase metamorphic and deformation events (Sharkovski, Susov & Krivyakin, Reference Sharkovski, Susov and Krivyakin1984; Bagheri & Stampfli, Reference Bagheri and Stampfli2008; Zanchi et al. Reference Zanchi, Zanchetta, Garzanti, Balini, Berra, Mattei, Muttoni, Brunet, Wilmsen and Granath2009; Buchs et al. Reference Buchs, Bagheri, Martin, Hermann and Arculus2013; Zanchi et al. Reference Zanchi, Malaspina, Zanchetta, Berra, Benciolini, Bergomi, Cavallo, Javadi and Kouhpeyma2015). The AMC is in tectonic contact with other metamorphic complexes and sedimentary successions of various ages and palaeogeographic affinities (Fig. 1). To the west, the Great Kavir – Doruneh fault system represents the contact between the AMC and the Cretaceous ophiolites that border the entire Central–East Iranian Microcontinent (Ghasemi & Talbot, Reference Ghasemi and Talbot2006). The southern limit of the AMC coincides with the NW border of the Yadz block whereas to the east the Jandaq complex, a magmatic–metamorphic unit with a poorly defined age (likely Carboniferous or pre-Carboniferous, Bagheri & Stampfli, Reference Bagheri and Stampfli2008; Berra et al. Reference Berra, Zanchi, Angiolini, Vachard, Vezzoli, Zanchetta, Bergomi, Javadi and Kouhpeyma2017), is exposed. Finally, to the north of the AMC, the non-metamorphic Nakhlak ophiolite–sedimentary complex occurs (Balini et al. Reference Balini, Nicora, Berra, Garzanti, Levera, Mattei, Muttoni, Zanchi, Bollati, Larghi, Zanchetta, Salamati, Mossavvari, Brunet, Wilmsen and Granath2009). The contact between the AMC and the Nakhlak complex is not exposed, so the relationships existing between the complexes are not clear (Balini et al. Reference Balini, Nicora, Berra, Garzanti, Levera, Mattei, Muttoni, Zanchi, Bollati, Larghi, Zanchetta, Salamati, Mossavvari, Brunet, Wilmsen and Granath2009; Zanchi et al. Reference Zanchi, Zanchetta, Garzanti, Balini, Berra, Mattei, Muttoni, Brunet, Wilmsen and Granath2009).
Geological map of the Anarak Metamorphic Complex with location of analysed samples. The trace of the geological cross-section in Figure 2 is here indicated. Modified after Zanchi et al. (Reference Zanchi, Malaspina, Zanchetta, Berra, Benciolini, Bergomi, Cavallo, Javadi and Kouhpeyma2015).

The AMC is composed of several subunits which display heterogeneous structural and metamorphic evolutions (Sharkovski, Susov & Krivyakin, Reference Sharkovski, Susov and Krivyakin1984; Bagheri & Stampfli, Reference Bagheri and Stampfli2008; Zanchi et al. Reference Zanchi, Zanchetta, Garzanti, Balini, Berra, Mattei, Muttoni, Brunet, Wilmsen and Granath2009, Reference Zanchi, Malaspina, Zanchetta, Berra, Benciolini, Bergomi, Cavallo, Javadi and Kouhpeyma2015). The Morghab Complex largely consists of metapelitic schists with abundant interleaved quartzite and metabasite layers (Zanchi et al. Reference Zanchi, Malaspina, Zanchetta, Berra, Benciolini, Bergomi, Cavallo, Javadi and Kouhpeyma2015). Minor meta-volcanic rocks and amphibole-bearing gneisses occur in the Kuh-e Pol-e Khavand area (Fig. 1).
We will focus in this paper on the three main units that compose the AMC: the Chah Gorbeh (CGC), Morghab (MC) and Ophiolitic (OC) complexes (Zanchi et al. Reference Zanchi, Malaspina, Zanchetta, Berra, Benciolini, Bergomi, Cavallo, Javadi and Kouhpeyma2015).
Quartzite-rich phyllites, micaschists and metabasites interlayered with thick metacarbonate layers (Figs 1, 2) form the CGC. Serpentinite lenses and layers occur in the southern part of the CGC.
Schematic cross-section showing the main structural features of the AMC and the tectonic relationships between the CGC, MC and OC complexes and the overlying Lakh Marble. Modified after Zanchi et al. (Reference Zanchi, Malaspina, Zanchetta, Berra, Benciolini, Bergomi, Cavallo, Javadi and Kouhpeyma2015).

The MC occurs to the north and east of the CGC. The MC has a more monotonous lithological composition, chiefly consisting of metapelites (phyllites and micaschists) with minor intercalations of quartzites, metabasites and thin marble layers. Regional folds with steep fold axes affected both the MC and CGC; this feature is particularly evident at the eastern end of the CGC (Fig. 1). To the south and southeast of the CGC an ‘ophiolitic’ complex (OC) occurs (Bagheri & Stampfli, Reference Bagheri and Stampfli2008; Zanchi et al. Reference Zanchi, Malaspina, Zanchetta, Berra, Benciolini, Bergomi, Cavallo, Javadi and Kouhpeyma2015). This complex largely consists of serpentinites and partly serpentinized harzburgites, where relics of the primary mineral assemblages and textures are scarcely preserved. In the central area of the OC some metabasite lenses have been observed (Fig. 1). Such lenses consist of metamorphosed basalts with well-preserved pillow structures. The OC is intensively folded with minor shear zones localized both along lithological contacts as well as within serpentinites.
The CGC, MC and OC units of the AMC are overthrust by a large thrust sheet of metacarbonates, the Lakh Marble (Bagheri & Stampfli, Reference Bagheri and Stampfli2008; Zanchi et al. Reference Zanchi, Malaspina, Zanchetta, Berra, Benciolini, Bergomi, Cavallo, Javadi and Kouhpeyma2015). These strongly recrystallized carbonates display an uneven distribution of deformation, with isoclinally folded areas coexisting with more preserved parts with sedimentary structures such as bedding, intraformational paraconglomerates (i.e. rich in matrix) and fossils. The age of the Lakh Marble is substantially unknown, although a late Palaeozoic age has been proposed based on indirect evidence (Bagheri & Stampfli, Reference Bagheri and Stampfli2008). Recent re-examination of the presumed Lower Cambrian Archeocyatid faunas described by Russian authors in the past (Mel'nikov et al. 1986) resulted in the identification of the demosponge genus Rankenella (Kruse & Zhuralev, Reference Kruse and Zhuralev2008) in the Kabudan Marble, which is a correlative of the Lakh Formation. These latter authors thus suggested a possible correlation with the Upper Cambrian Mila Formation of the Alborz Mountains, which implies a Gondwanan affinity for this unit.
Time constraints on the age of the high-pressure–low-temperature (HP–LT) metamorphism of the AMC are still lacking. A minimum age is provided by undeformed and non-metamorphosed trondhjemitic dykes and stocks that intruded the AMC (Torabi, Reference Torabi2012). Late Permian (Bagheri & Stampfli, Reference Bagheri and Stampfli2008) to Sakmarian ages (Zanchi et al. Reference Zanchi, Malaspina, Zanchetta, Berra, Benciolini, Bergomi, Cavallo, Javadi and Kouhpeyma2015) have been provided for these intrusive rocks, suggesting that deformation and metamorphism of the AMC is Early Permian or older.
The AMC is currently interpreted as an allochthonous crustal fragment that was part of an accretionary wedge developed along the southern Eurasian margin, in the hangingwall of the Palaeo-Tethys subduction zone (Zanchi et al. Reference Zanchi, Malaspina, Zanchetta, Berra, Benciolini, Bergomi, Cavallo, Javadi and Kouhpeyma2015). In this interpretation, the formation of the AMC is considered to have preceded the collision of the Iran plate with Eurasia that led to the Cimmerian orogenic event.
3. Meso-structural aspects of the AMC
We summarize here the main structural features of the metabasite-bearing units of the AMC as observed in the field. For a more exhaustive description of the structural setting and evolution of the AMC see Zanchi et al. (Reference Zanchi, Malaspina, Zanchetta, Berra, Benciolini, Bergomi, Cavallo, Javadi and Kouhpeyma2015).
3.a. Morghab Complex
The MC displays a complex structural pattern formed in response to superposed deformation events, the first two out of three associated with syn-metamorphic isoclinal folding. D1 structures are now preserved at the mesoscale only as relicts within the S2 regional foliation. Rootless fold hinges are somewhat visible in quartzites and quartz-rich schists, whereas D1-related structures are visible only at the microscale in metabasites. Mineral phase assemblages in textural equilibrium with D1 structures point to HP–LT conditions during D1 (Zanchi et al. Reference Zanchi, Malaspina, Zanchetta, Berra, Benciolini, Bergomi, Cavallo, Javadi and Kouhpeyma2015).
The D2 deformation event is characterized by isoclinal folding developed both at the meso- and regional scale. The axial plane foliation, S2, of this fold system is the most pervasive fabric element within all the rock types that form the MC. Besides the S2 foliation a well-developed stretching lineation defined by elongated quartz and chlorite has been frequently observed. The S2 foliation is concordant with lithological contacts within the MC and between the MC and adjoining units. Fold axes related to D2 folds range from sub-horizontal to nearly vertical, suggesting that a successive deformation event affected the complex. This event, D3, is responsible for the development of medium-tight to closed folds observable both at the meso- and regional scale. D3 folds deflecting the S2 foliation and affecting the contact between the CGC and MC complexes are clearly reported in the geological-structural map of Figure 1 and characterize the present-day structural setting.
3.b. Chah Gorbeh Complex
As in the MC the oldest recognized structures are poorly visible at the mesoscale. They are recognizable as relict S1 foliation intrafolial in the dominant S2 one (Fig. 3c, d). Rootless fold hinges seldom occur in metacarbonates and metapelites/metapsammites. The S1 foliation is poorly visible at the mesoscale but clearly evident at the microscale where it is defined by a greenschist-facies mineral assemblage (Fig. 5).
(a) Marble layers interleaved with metapelites and mafic schists of the CGC. (b) A fold hinge with a nearly vertical fold axis in the metacarbonates of the CGC. (c) S1 relict foliation preserved within the regional S2 foliation in paragneiss. Hammer for scale is 33 cm long. (d) S1 relics within schists of the MC. Pen for scale is 14 cm long. (e) Superposed D1–D2 folds in the MC rocks. Pen for scale is 15 cm long. (f) Open to medium-closed D3 folds with an axial fracture cleavage. Pen for scale is 15 cm long.

The D2 deformation event formed isoclinal folding associated with a pervasive axial plane foliation, S2, defined by Na-amphibole (Zanchi et al. Reference Zanchi, Malaspina, Zanchetta, Berra, Benciolini, Bergomi, Cavallo, Javadi and Kouhpeyma2015) that points to HP–LT metamorphism during the D2 event. The different P–T conditions at which the regional foliation formed in the MC (greenschist facies) and CGC (blueschist facies) suggests that, even if the main foliations of both units are almost parallel to their contacts, they could not be related to a single deformation event that affected the MC and CGC together.
The contact between the CGC and serpentinites of the OC is marked by ductile shear zones (Fig. 2), sometimes with lenses of ophicalcites and impure marbles, where Na-amphibole is stable along the mylonitic foliation. This suggests that the MC and serpentinites were tectonically coupled at HP–LT conditions. In a few localities, in the southern part of the CGC, serpentinites are deformed by D2 isoclinal folds together with rocks of the CGC. This observation suggests that the OC and serpentinites share a common tectonometamorphic evolution from the D2 event onwards.
3.c. Ophiolitic Complex
We refer here to the whole complex of ultramafic rocks and blueschist-facies meta-basalts, the same that were distinguished by Zanchi et al. (Reference Zanchi, Malaspina, Zanchetta, Berra, Benciolini, Bergomi, Cavallo, Javadi and Kouhpeyma2015) into two units: ‘ultramafic rocks’ and ‘blueschist pillow meta-basalts’. The contacts between the ultramafic rocks and meta-basalts are always tectonic (Fig. 4c), so a direct correlation among structures observed in the two units is not feasible, justifying the distinction proposed by Zanchi et al. (Reference Zanchi, Malaspina, Zanchetta, Berra, Benciolini, Bergomi, Cavallo, Javadi and Kouhpeyma2015).
(a) Field aspect of pillow structure within meta-basalts of the OC; person for scale is c. 1.55–1.6 m tall. (b) Sheared domains developed at the rims of pillow. (c) Mylonitic foliation defined by blueschist-facies minerals at the contact between meta-basalts and serpentinites. (d) Calcite and quartz veins cross-cutting sheared serpentinites. Hammer for scale is 40 cm long.

Ultramafic rocks occur in two distinct structural settings: (1) as tectonic slices within the southern part of the CGC, as previously described; (2) as a continuous unit, forming complex imbricated thrust sheets, in a lower structural position with respect to the CGC (Fig. 2). Peridotites of type (1) are almost completely serpentinized and intensively sheared with foliations subparallel to the S2 of the CGC and to tectonic contacts. Peridotites of type (2) show a patchy distribution of deformation with isolated lenses conserving a massive texture with preserved olivine, orthopyroxene and spinel crystals. This mineral assemblage indicates a harzburgitic composition for the ultramafic rocks of the AMC. Such massive domains are wrapped by sheared domains where a pervasive schistosity is associated with an almost complete serpentinization of harzburgites.
Meta-basalts with well-preserved pillow structures (Fig. 4a, b) occur ESE of Chah Derakhtak (Fig. 1). Such slices form part of a complex S-verging thrust stack also involving serpentinites and ophicalcites (Sharkovski, Susov & Krivyakin, Reference Sharkovski, Susov and Krivyakin1984; Zanchi et al. Reference Zanchi, Zanchetta, Garzanti, Balini, Berra, Mattei, Muttoni, Brunet, Wilmsen and Granath2009, Reference Zanchi, Malaspina, Zanchetta, Berra, Benciolini, Bergomi, Cavallo, Javadi and Kouhpeyma2015). Except within shear zones, where pillows are partially to almost completely transposed (Fig. 4c), the meta-basalts are substantially undeformed. A poorly defined foliation is distinguishable only at the microscale, defined by greenschist-facies mineral assemblage (see next section).
4. Microstructural and metamorphic evolution
Microstructural analyses on selected samples of mafic rocks from the three tectonic units were performed to decipher the deformation–metamorphism relationships in each unit. The multi-stage structural evolution reconstructed at the mesoscale has also been recognized at the microscale. A brief overview of the chemical composition of key minerals occurring at distinct microstructural positions is provided here, whereas the reader is referred to the next section for a complete description of the AMC rocks’ mineral chemistry. Mineral abbreviations used in the text are reported in Table 1.
Sample descriptions and locations

Notes: Mineral abbreviations. Amp – amphibole; Ap – apatite; Cc – calcite; Chl – chlorite; Ep – epidote; Mt – magnetite; Ol – olivine; ox – Fe–Ti oxides; Pl – plagioclase; Pyr – pyrite; Qtz – quartz; Rt – rutile; Ttn – titanite; Wm – white mica; Zr – zircon. X* – secondary minerals.
4.a. Morghab Complex
The mineralogy of mafic schists of the MC is made of (Table 1): amphibole, plagioclase, epidote, chlorite, white mica, titanite, quartz, magnetite and apatite. Secondary calcite occurring in veins and microcracks post-dating the main foliation has been observed in some samples.
Metabasites of the MC are fine grained with the main fabric element at the microscale represented by a well-developed foliation. Cores of epidote (Ep2) and albitic plagioclase (Pl1) porphyroblasts partially pre-date the main foliation. Aligned inclusion trails have been observed both within Pl2 and Ep2. They consist of blue Na-rich amphibole (Amp1), white mica (Wm1), titanite (Ttn1), quartz, albite (Pl1) and epidote (Ep1). Pl1 and Ep1 inclusions occur within Ep2 and Pl2, respectively. The main foliation, which corresponds to the regional S2 foliation as recognized by field structural analysis, wraps around plagioclase and epidote porphyroblast cores. The outer rims of both Ep2 and Pl2 seem to overgrow the foliation, so we consider the porphyroblast rims to be syn- to post-kinematic with respect to S2. The S2 foliation is defined by the shape preferred orientation (SPO) of Amp2+Chl+Wm2+Ttn2. Amp2 occurs in the form of tiny to fine-grained crystals with a subidiomorphic to idiomorphic (prismatic) habit. They frequently contain inclusions of quartz, chlorite and plagioclase. Ttn2 forms trails of (sub)millimetric (max. 1.5 mm) crystals aligned parallel to S2. Ttn2 crystals always have the typical lozenge-shaped prismatic habit of titanite with the major axis elongated parallel to the S2 foliation. Both Ttn2 and Amp2 have been observed as inclusions in Ep2 porphyroblasts rims, suggesting that epidote crystal growth outlasted the D2 deformation event. A colour zoning is frequently observed in Amp2: minerochemical analyses (see next section) highlighted a Na-increase from the core to the rim of Amp2 crystals. A similar compositional zoning also occurs in Ep2 porphyroblasts, with rims enriched in Fe3+ with respect to the cores. This suggests a pressure increase during the late stages of the D2 deformation event. Amp2 crystals also occur as inclusions within Ep2 rims.
Summarizing the metamorphic evolution individuated for the mafic schists of the MC we can define three successive parageneses: (i)Blueschist facies (pre-S2): Amp1+Wm1+Ttn1+Ep1+Pl1+Qtz; (ii) Greenschist facies (syn-S2): Amp2 (core)+Chl+Wm2+Ep2 (core)+Pl2+Ttn2+Qtz; (iii) Greenschist with P increase (late-, post-S2): Amp2(rim)+Ep2(rim).
4.b. Chah Gorbeh Complex
The mineralogy of metabasites of the CGC consists of: amphibole, plagioclase, chlorite, white mica, epidote, quartz, titanite, rutile, calcite, apatite, zircon and pyrite (Table 1).
The textural features of the mafic schists from the CGC closely resemble the ones described for the rocks of the MC. The development of a primary foliation is preceded by plagioclase (Pl1) and epidote (Ep1) porphyroblast growth, with a peculiar mineral phase assemblage of oriented inclusions. However, the metamorphic evolution is discordant, as we will describe below.
An internal foliation (S1) made by the preferred orientation of Ttn1+Pl1+Qtz+Amp1 inclusions is highlighted within Pl1 and Ep1 porphyroblasts. Amp1 is actinolitic hornblende (Fig. 6; Table 3), suggesting equilibration at relatively low P under greenschist-facies conditions. The main foliation (S2) is defined by the SPO of Chl+Ab+Wm1+Ep2+Rt+Amp2. Blue-coloured Amp2 is ferroglaucophane (Table 3) in composition and displays clear cores without inclusions, coupled with inclusion-rich rims, where Wm1, Chl and Ep2 aligned parallel to S2 occur. Ep2 is Fe-enriched (Fig. 6) with respect to Ep1, pointing to a P increase from the D1 to D2 deformation/metamorphic event. Tiny magnetite crystals occur as trails aligned parallel to S2. Rutile, usually overgrown by rims of titanite (Ttn2), has also been observed only outside Pl1 and Ep1 porphyroblasts. Therefore, its growth and incomplete substitution by Ttn2 could be assigned to the syn- to post-S2 metamorphic stage.
Two main metamorphic stages can be defined for the CGC: (i) Greenschist facies (pre-S2): Ep1+Pl1+Ttn1+Amp1+Wm1+Qtz; (ii) Blueschist facies (syn- to post-S2): Amp2+Chl+Ep2+Pl2+Mt+Wm1+Rt (Ttn2)
4.c. Ophiolitic Complex (meta-basalts)
As described in Section 3.c, meta-basalts crop out in the southern area of the AMC in tectonic contact with serpentinized ultramafic rocks (Figs 1, 2). As observed in outcrops, where the primary pillow structures are completely preserved, the meta-basalts also show little deformation at the microscale. The complete mineralogy is defined by: amphibole, plagioclase, chlorite, epidote, white mica, magnetite, apatite and Fe–Ti oxides.
Meta-basalts are fine grained with a very poorly defined foliation (S1) made by the SPO of Pl1+Chl+Amp1+Ep1+Ttn1, with Amp1 displaying an actinolitic composition. This weak foliation is overprinted by the static growth of prismatic Na-rich blue amphibole (Amp2) and aggregates of titanite crystals (Ttn2) that show no evidence of deformation. Besides their occurrence as relatively large (up to 2 mm) prismatic crystals (Fig. 5), Amp2 has also been observed to grow as thin coronae around Chl+Amp1 sites (Fig. 5). Based on microstructural analysis, the meta-pillow basalts show a prograde metamorphic evolution, with a greenschist-facies foliation overprinted by the static growth of a HP–LT blueschist-facies phase assemblage as summarized below:
Microstructural features of mafic schists. (a, b) Static growth of blue amphibole (Amp2), magnetite and titanite (Ttn2) on existing greenschist-facies assemblage in meta-basalts. (c, d) Syn-kinematic Na-amphibole (Amp2) and epidote (Ep2) aligned parallel to S2 within mafic schists of the CGC. Relics of a greenschist-facies S1 foliation are best preserved within plagioclase porphyroblasts. (e, f) Blueschist-facies phase assemblage aligned defining the internal foliation of plagioclase porphyroblasts (Pl2) in retrogressed blueschists of the MC.

(i) Greenschist (syn-S1): Amp1+Pl1+Chl+Wm1+Ep1+Ttn1+Qtz; (ii) Blueschist (post-S1): Amp2+Ttn2+Wm2.
5. Mineral chemistry and P–T–d–t paths
5.a. Methods
Textural and mineralogical features were inspected on polished thin-sections using back-scattered electron (BSE) and secondary electron images and characterized by electron microprobe analyses. Analyses were performed at the Earth Science Department of the University of Milano on a Jeol JXA 8200 Superprobe equipped with five wavelength-dispersive spectrometers (WDS). Analyses were conducted with a c. 1 µm beam diameter at conditions of 15 kV and 5 nA of probe current. Natural silicates and oxides were used as standards. All standards were calibrated within 0.5% at one standard deviation. Raw data were corrected using a Phi-Rho-Z quantitative analysis program. Major elements and recalculated structural formulae are reported in Tables 2, 3 and 4.
Average composition of major elements (ox. wt%) and of recalculated structural formulae of minerals composing mafic rocks from the Morghab Complex (numbers in brackets are standard deviations)

Average composition of major elements (ox. wt%) and of recalculated structural formulae of minerals composing mafic rocks from the Chah Gorbeh Complex (numbers in brackets are standard deviations)

Average composition of major elements (ox. wt%) and of recalculated structural formulae of minerals composing mafic rocks from the Ophiolitic Complex (numbers in brackets are standard deviations)

Whole-rock analysis for major elements, used for the isochemical P–T pseudosection (see below), was determined at the ACME Analytical Laboratories Ltd in Vancouver (Canada). Total abundances of the major oxides were obtained by ICP-ES (inductively coupled plasma emission spectroscopy) following a LiBO2 fusion and dilute nitric digestion for major oxides. Analytical errors are within 2%.
The FeO weight % on total FeO* has been determined for the AK14 sample by titration following the Wilson method (Wilson, Reference Wilson1955; Yokoyama & Nakamura, Reference Yokoyama and Nakamura2002 and references therein) at the Department of Earth and Environmental Sciences, University of Milano Bicocca.
5.b. Results
5.b.1. Morghab Complex
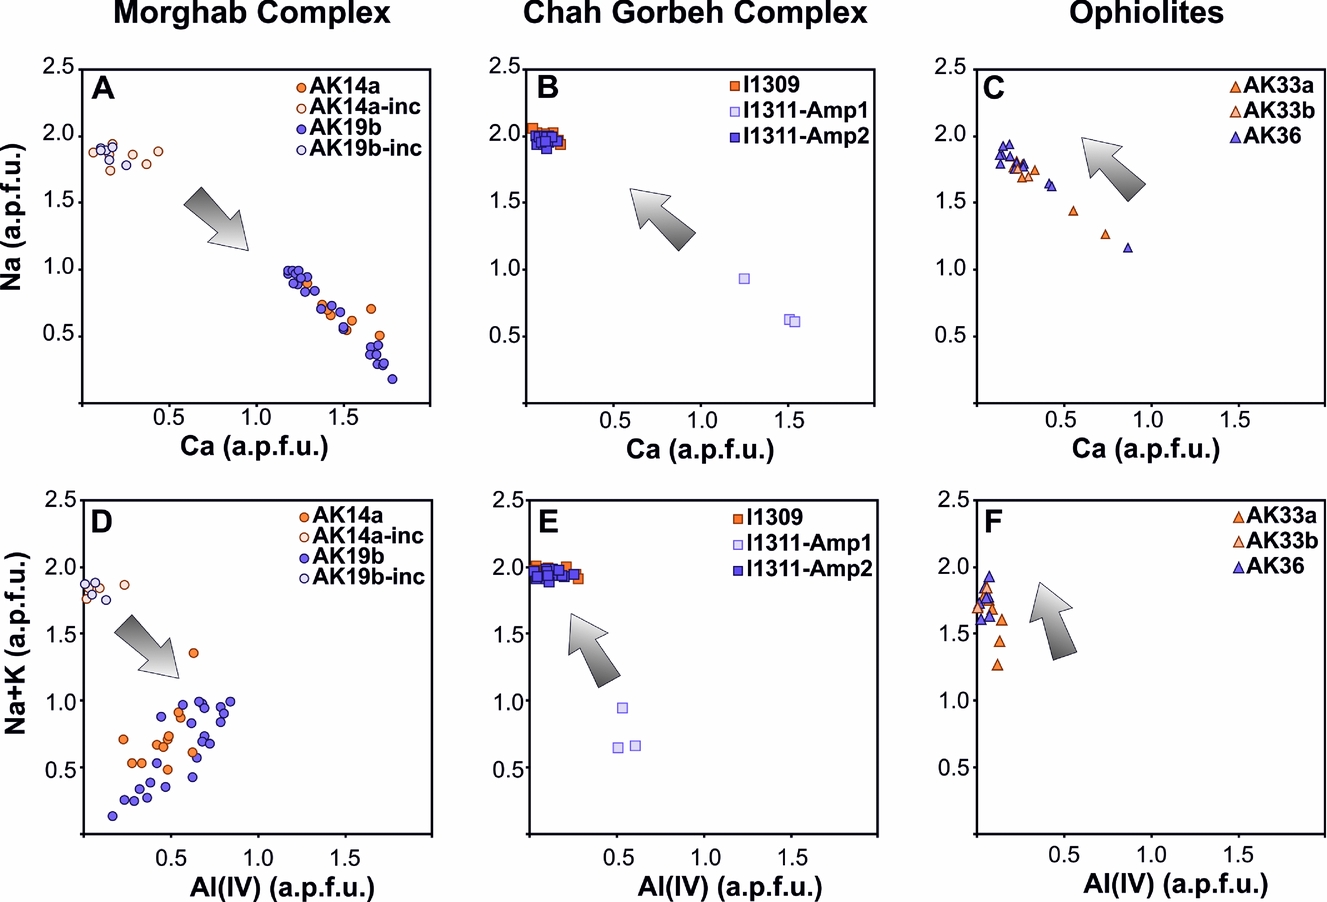
Porphyroblastic epidote and plagioclase preserve a relict paragenesis composed by Amp1+Wm1+Ttn1+Ep1+Pl1+Qtz (fig. 12b in Zanchi et al. Reference Zanchi, Malaspina, Zanchetta, Berra, Benciolini, Bergomi, Cavallo, Javadi and Kouhpeyma2015). Micron-sized Amp1 is an alkali-amphibole (NaB > 1.50) and corresponds to a glaucophane (Table 2), while Amp2 along the main foliation is calcic to sodic-calcic (Ca+Na) B > 1, 0.5 < NaB < 1.5 and variable CaB. This mainly corresponds to actinolite and magnesiokatophorite and shows a slight zoning from core to rim, with a decrease in CaO, complementary to a slight increase in Na2O (Table 2; Fig. 6d). In addition epidote shows a strong compositional variation. Ep1 included in albite porphyroblasts show higher FeO* contents with respect to the cores of Ep2, which in turn is characterized by a compositional zoning with the rim enriched in FeO* with respect to the core (Table 2). This prograde zoning is likely related to the core-to-rim increase in Na2O recorded by Amp2. Both white micas, Wm1 included in porphyroblastic albite and Wm2 along the S2 foliation, show a moderate celadonitic content, in the range of 3.35–3.50 atoms per formula unit (apfu) (Table 2). Finally, plagioclase is mainly albite and does not show any anorthite substitution in both generations.
Representative amphibole compositions of mafic schists for the CGC, MC and OC. Arrows indicate the evolution direction (old to young) as recognized by microstructural analyses.
5.b.2. Chah Gorbeh Complex
Different from the Morghab mafic rocks, these samples show a prograde evolution from greenschist-facies to a blueschist-facies overprint, as recorded also by a different mineral composition. The main foliation is in fact characterized by rare actinolitic amphibole and abundant alkali-amphiboles (NaB > 1.50) showing homogeneous composition with the highest Na contents (up to 2.03 apfu, Table 3). They are classified as ferroglaucophane. In a Na v. Ca (Fig. 6a, b) and (Na+K) v. Al(IV) diagram (Fig. 6d, e) they show a trend similar to that of amphiboles from the MC with the difference that this is prograde. Na and Na+K become enriched with respect to Ca and Al(IV), respectively, from Amp1 to Amp2 as indicated by the grey arrow. Glaucophane is characterized by inclusion-rich rims. Such inclusions consist of the same mineral phases as those crystallized along the main foliation (Chl, Ab, Wm, Ep and rutile with Ttn coronae). In some samples, epidote along the S2 foliation also shows a poikiloblastic texture and includes quartz, albite and titanite. Such epidotes are enriched in FeO*, in agreement with equilibration with glaucophane (Table 3) and do not show the strong iron variability as recorded by epidotes of the mafic rocks from the MC. Both white micas, Wm1 included in glaucophane rims and porphyroblastic albite, and Wm2 along the S2 foliation, show a moderate celadonitic content, in the range of 3.30–3.40 apfu (Table 3). Again, plagioclase is mainly albite and does not show any anorthite substitution.
5.b.3 Ophiolitic Complex (meta-basalts)
Meta-basalts from the OC show a very weak foliation made of Pl1+Chl+Amp1+Ep1+Ttn1, with Amp1 displaying an actinolitic composition, overprinted by the static growth of Amp2 and aggregates of Ttn2. Amp2 occur both as fine-grained aggregates and as millimetre-sized prismatic crystals. As shown in Table 4, fine-grained Amp2 has a variable composition, locally between alkali to sodic-calcic amphiboles (NaB from 1.29 to 1.69 apfu). Coarse Amp2 is instead homogeneous in composition and corresponds to a magnesioriebeckite. It shows slightly lower Na content with respect to alkali-amphibole occurring in the Chah Gorbeh mafic rocks (Table 4; Fig. 6c, f). Some coarse white micas appear in microstructural equilibrium with Amp2 and are characterized by a higher celadonitic substitution, up to 3.55 (Table 4), with respect to white micas of mafic rocks from the CGC and MC. As already discussed by Zanchi et al. (Reference Zanchi, Malaspina, Zanchetta, Berra, Benciolini, Bergomi, Cavallo, Javadi and Kouhpeyma2015), this comparison suggests that phengitic micas of meta-pillow basalts likely re-equilibrated with riebeckite under blueschist-facies conditions during a prograde, relatively HP, metamorphism.
5.b.4. Thermodynamic modelling
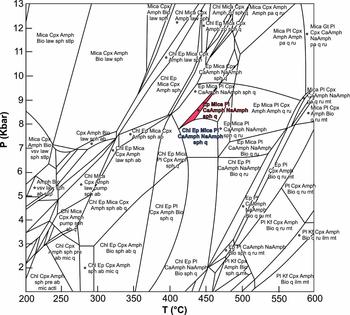
A P–T isochemical section was calculated with PERPLE_X software (Connolly, Reference Connolly2005), considering the bulk composition of sample AK14b and H2O-saturated conditions, using the thermodynamic database and equation of state for H2O of Holland & Powell (Reference Holland and Powell1998, upgraded 2002). No phase has been excluded from the calculation. Solution models of Holland & Powell (Reference Holland and Powell1998, Reference Holland and Powell2003) were used for olivine, orthopyroxene, clinopyroxene, garnet, phengite, feldspar, epidote, chlorite and biotite. Two different solution models have been used to model Ca-amphibole and Na-amphibole from Dale et al. (Reference Dale, Powell, White, Elmer and Holland2005), which require Fe2O3 and FeO concentrations. Fe+3-rich minerals such as epidote also occurs in both HP–LT and syn-S2 metamorphic event, and the use of a solid solution model for epidote is crucial to model their possible stability fields. For this reason, we measured the FeO and Fe2O3 concentration of the whole rock by chemical titration and considered FeO and Fe2O3 as distinct chemical components in the thermodynamic forward modelling. The phase diagram section reported in Figure 7 shows that the (pre-S2) Cpx-free mineral association Na-Amp1+Wm1+Ttn1+Ep1+Pl1 is stable in a narrow P–T range between 0.8 and 0.95 GPa and 410–460°C, respectively. The appearance of chlorite in the S2 Cpx-free and Bio-free mineral assemblage (blue text in Fig. 7) Amp2 (core)+Chl+Wm2+Ep2 (core)+Pl2 occurs at similar temperature conditions and lower pressures, down to 0.65 GPa.
Isochemical P–T section for Morghab meta-basalt calculated in the system SiO2 (50.27) – Al2O3 (14.42) – MgO (5.61) – CaO (7.27) – Na2O (4.53) – K2O (0.82) – TiO2 (1.41) – FeO (8.57) – Fe2O3 (3.43). Values in brackets are oxide wt.%. The red area shows the hypothetical stability field of the relict HP paragenesis preserved in porphyroblastic epidote, as evidenced by microstructural and mineral chemistry analyses. Abbreviations for solid solution models: Amph – Ca-amphiboles and Na-amphiboles; Bio – biotite; Chl – chlorite; Ep – epidote; Cpx – clinopyroxene; Gt – garnet; Kfs – alkali feldspar; Mica – phengite; Pl – ternary feldspar. Abbreviations for phases: ab – albite; acti – actinolite; fctd – Fe-chloritoid; ilm – ilmenite; law – lawsonite; mic – microcline; mt – magnetite; q – quartz; pa – paragonite; pre – prehnite; pump – pumpellyite; ru – rutile; sph – titanite (sphene); stlp – stilpnomelane; vsv – vesuvianite; zo – zoisite. The paragenesis at pressure peak observed in thin-section is highlighted in red. The same equilibrium phase assemblage with chlorite in addition (blue text in figure) occurs at the same T, but a lower pressure with respect to the chlorite-free one.

Comparing the Morghab metamorphic peak conditions with those of the Chah Gorbeh and Ophiolite units (0.75–0.85 GPa and 350–400°C) reported by Zanchi et al. (Reference Zanchi, Malaspina, Zanchetta, Berra, Benciolini, Bergomi, Cavallo, Javadi and Kouhpeyma2015), the MC mafic schists experienced HP metamorphism before the development of the S2 foliation as will be discussed later. It is worth noting that the thermodynamic modelling results are strongly supported by the microstructural evidence (Fig. 5).
Thermodynamic modelling of the stability of solid solutions with Fe3+-bearing end-member minerals (i.e. epidote and Na-amphibole) requires the assumption that the bulk Fe2+/Fe3+ ratio was constant during the entire metamorphic cycle of the rock. We therefore compared the P–T isochemical section of Figure 7 with a T–fO2 isochemical section calculated at 0.9 GPa, which is portrayed in Figure 8. The starting composition is the same as that used in Figure 7, but considering FeO as total iron. The peak (pre-S2) Na-Amp1+Wm1+Ttn1+Ep1+Pl1 mineral association is stable at 460°C and logfO2 ≅ −25.5, corresponding to FMQ-1 (FMQ is the reference fayalite–magnetite–quartz buffer). It is worth noting that the stability of epidote is strongly influenced by the oxidation state of the bulk composition, therefore by the Fe2+/Fe3+ ratio of the rock. The fO2 value calculated from forward modelling enables a back calculation of the expected FeO and Fe2O3 content of the whole rock using the equation of Kress & Carmichael (Reference Kress and Carmichael1988). The measured Fe2+/Fe3+ ratio at T = 450°C and P = 1 atm would be stable at logfO2 = −24, which is perfectly consistent with the values calculated in Figure 8, if we consider that fO2 slightly decreases with increasing pressure. We can therefore assume that the Fe2+/Fe3+ content used to reconstruct the P–T stability field of epidote- and Na-amphibole-bearing assemblage is representative of the composition of the rock at the pressure-peak conditions.
Isochemical T–fO2 section for Morghab meta-basalt calculated in the same system as that of Figure 7. The tiny red area shows the hypothetical stability field of the HP paragenesis. The red curve delineates the stability of epidote solid solution as a function of the oxidation state of the rock. The grey curve is the FMQ (fayalite–magnetite–quartz) reference redox buffer. Abbreviations are the same as Figure 7, except hem – haematite.

6. Discussion
The three main units constituting the gross part of the AMC show a complex structural pattern that is the result of at least three deformation events. The MC, CGC and OC were refolded together during the last deformation stage (D3) and overthrust by the Lakh Marble unit (Zanchi et al. Reference Zanchi, Malaspina, Zanchetta, Berra, Benciolini, Bergomi, Cavallo, Javadi and Kouhpeyma2015). D3 structure developments occurred at non- or very low-grade metamorphic conditions (Fig. 3e). The metamorphic evolution of the three units should then be related to pre-D3 deformation stages.
Field structural analyses (Zanchi et al. Reference Zanchi, Malaspina, Zanchetta, Berra, Benciolini, Bergomi, Cavallo, Javadi and Kouhpeyma2015) individuated a regional foliation (S2) that is almost parallel in the MC and CGC units, suggesting that it is probably related to the same deformation event that affected the two units during or after their tectonic coupling. However, the detailed study of microstructures and mineral chemistry of blueschist-facies mineral assemblages in the AMC rocks presented in this study suggests that the three units experienced tectonometamorphic evolutions that differed in some stages.
The spatial relationships between compositionally distinct amphiboles in the MC, CGC and OC mafic rocks point to a pre-S2 (regional foliation) pressure peak in the MC. Amphiboles (Amp1) included in plagioclase (Pl1) and epidote (Ep2) porphyroblasts are glaucophane or ferroglaucophane (Table 2; Fig. 6), whereas Amp2, aligned along the main foliation (S2), are calcic amphiboles (Amp2 in Table 2). Deformation–recrystallization relationships thus indicate that peak pressure (0.80–0.95 GPa at T of 410–450°C, Fig. 7) was reached by the MC mafic schists before the development of the S2 foliation. Calcic amphiboles (Amp2) and epidotes (Ep2) syn-kinematic with the S2 foliation display in turn a core–rim compositional zoning indicative of a pressure increase during or after the D2 deformation event. Based on these data we can define a clockwise P–T path for the AMC (Fig. 9), with a blueschist-facies stage followed by greenschist re-equilibration at lower pressure and later underplating to greater depths. The amphibole chemical composition suggests that the late-S2 metamorphic stage did not reach the pressure-peak experienced by the MC mafic rocks during the pre-D2 evolution.
(a) P–T estimates and inferred P–T paths of the CGC, MC and OC blueschists. P–T estimates for the GCG and OC metabasites are from Zanchi et al. (Reference Zanchi, Malaspina, Zanchetta, Berra, Benciolini, Bergomi, Cavallo, Javadi and Kouhpeyma2015). Representative reconstructed P–T paths for blueschists from the Franciscan subduction complex (Ernst, Reference Ernst1988; Banno et al. Reference Banno, Shibakusa, Enami, Wang and Ernst2000; Ukar & Cloos, Reference Ukar and Cloos2014), Oman (Yamato et al. Reference Yamato, Agard, Goffé, de Andrade, Vidal and Jolivet2007; Agard et al. Reference Agard, Searle, Alsop and Dubacq2010) and Zagros (Angiboust et al. Reference Angiboust, Agard, Glodny, Omrani and Oncken2016) are reported for comparison. Metamorphic facies are from Evans (Reference Evans1990). (b) Cartoon depicting the suggest geodynamic scenario in which the tectonic units of the AMC acquired their contrasting P–T evolutionary paths.

The CGC and OC mafic rocks display a contrasting metamorphic evolution. HP–LT metamorphism is demonstrated to have followed a greenschist-facies metamorphic event as shown by microstructures and mineral chemistry. Sodic amphibole (Amp2) in CGC rocks is aligned along the main foliation (S2, Fig. 5), whereas low-P actinolitic amphibole (Amp1) is preserved as inclusions within Pl1 and Ep1 porphyroblasts which are pre-kinematic with respect to S2. The compositional variation of epidote, with syn-S2 Ep2 enriched in Fe3+ with respect to Ep1, and the growth of rutile instead of titanite as the main Ti-bearing phase, could be considered as clues that point to a P increase during the D2 deformation event. Nevertheless, special care should be taken as at low to medium pressure, the compositional variation of epidote also depends on fO2, coexisting Ca-Al silicates and H2O-content (e.g. Grapes & Hoskin, Reference Grapes, Hoskin, Liebscher and Franz2004).
The meta-pillow basalts provide less information on the deformation–metamorphism relationships as they are substantially non-deformed. A poorly developed primary foliation (S1) is defined by the SPO of greenschist-facies minerals, with actinolitic amphibole (Amp1) and chlorite as the main mineral phases. The S1 fabric is overprinted by the static growth of sodic amphibole (Amp2), white mica (Wm2) with Si up to 3.56 apfu and a second generation of titanite (Ttn2). The reconstructed recrystallization stages point to a P–T evolution similar to the one shown by the CGC, with an early greenschist-facies stage followed by re-equilibration at higher pressure (Fig. 9).
Isochemical P–T pseudosections (Fig. 7) presented in this work and in Zanchi et al. (Reference Zanchi, Malaspina, Zanchetta, Berra, Benciolini, Bergomi, Cavallo, Javadi and Kouhpeyma2015) suggest that the CGC and meta-basalts of the OC reached a similar pressure (0.6–0.9 GPa) at temperatures slightly higher for the OC (390–440°C) with respect to the CGC (320–380°C). Based on these considerations we can argue that the CGC mafic rocks and the OC meta-basalts experienced counter-clockwise P–T paths with a first metamorphic stage that occurred at relatively HT and LP (greenschist facies), followed by a HP–LT (epidote blueschist facies) re-equilibration (Fig. 9).
The metamorphic gap between syn-S2 foliation phase assemblage of the MC (greenschist facies) and CGC (blueschist facies) indicates that the regional foliation in the two tectonometamorphic units formed at different ambient conditions.
The detailed microstructural and microprobe chemical analyses reveal different metamorphic stages characterizing the evolution of each AMC unit. A greenschist-facies metamorphism, likely occurring at low pressure as suggested by the absence of garnet and Na-clinopyroxene, has been individuated in the CGC and OC rocks. Such a stage is recorded by the occurrence of calcic amphiboles included in pre-main foliation porphyroblasts (CGC) or as the primary assemblage (OC) overprinted by the later static growth of HP-phase assemblages. This stage could be related to an early heating during subduction initiation, before the depression of the geotherms by continuous subduction of the oceanic crust. An alternative hypothesis is that this low-pressure stage is related to seafloor metamorphism overprinted during subduction. Ocean floor metamorphism is commonly associated with diffuse veining and intense metasomatism, which are both absent in the AMC units. Quartz- and calcite-bearing veins occur in the pillow meta-basalts (Fig. 4d), but they cross-cut both pillows and sheared domains with a blueschist-facies overprint (Fig. 4b). This suggests that veining represents a late-stage feature, post-dating the burial and exhumation of the OC unit. The same holds true also for the mafic schist and associated rocks of the CGC (Zanchi et al. Reference Zanchi, Malaspina, Zanchetta, Berra, Benciolini, Bergomi, Cavallo, Javadi and Kouhpeyma2015).
The counter-clockwise P–T paths experienced by CGC and OC were likely due to early heating when they were underthrust beneath the southern Eurasia margin at the beginning of subduction (Fig. 9).
Such counter-clockwise P–T paths are common within evolved accretionary wedges, when mafic rocks derived from the subducting oceanic crust or sediments scraped off the evolving prism are accreted in the early stages of subduction and later buried to increasing depth while geotherms are progressively depressed (Cloos, Reference Cloos1982).
On the other hand, the P–T path of the MC is rather peculiar: an early HP–LT metamorphic stage is followed by greenschist-facies re-equilibration with a further pressure increase as suggested by amphibole and epidote compositional zoning. P–T estimates made by forward thermodynamic modelling (fig. 24 in Zanchi et al. Reference Zanchi, Malaspina, Zanchetta, Berra, Benciolini, Bergomi, Cavallo, Javadi and Kouhpeyma2015) indicate similar pressures of the CGC and OC relative to the pre-S2 metamorphic peak, but at higher T (Fig. 9). Dynamic metamorphism represented by the syn-S2 metamorphic stage re-equilibrated the HP–LT phase assemblages at greenschist-facies conditions. The chemical compositions (Fig. 6) of amphibole and epidote that grew during this greenschist-facies event point to a late- to post-deformation pressure increase. Summarizing, (Table 2) the MC mafic rocks experienced a clockwise P–T path, with an early HP–LT stage followed by exhumation at lower depths (greenschist-facies re-equilibration) and subsequent pressure increase likely due to re-subduction within the accretionary wedge.
Despite the possible difference in P–T paths experienced by the three units, a temperature/depth gradient of c. 15°C km−1 seems to be the best estimate for the peak pressure in all units (Fig. 9).
Counter-clockwise P–T paths within exhumed accretionary prisms are well known for block-in-matrix subduction mélanges, like the Franciscan Complex (Ukar, Reference Ukar2012; Ukar & Cloos, Reference Ukar and Cloos2014), but are less common in HP–LT complexes made of coherent tectonic units. The Hajiabad blueschists of the Zagros orogen (Agard et al. Reference Agard, Monié, Gerber, Omrani, Molinaro, Meyer and Yamato2006; Angiboust et al. Reference Angiboust, Agard, Glodny, Omrani and Oncken2016) display instead such features (Fig. 9). Despite different metamorphic peak conditions, several units underwent an initial heating stage during underplating, followed by HP–LT dynamic metamorphism. Geochronological data suggest that tectonic units reached pressure peak at different times (Angiboust et al. Reference Angiboust, Agard, Glodny, Omrani and Oncken2016). The occurrence and preservation of counter-clockwise P–T paths are likely favoured for tectonic units that were underplated in the first subduction stages, along a relatively hot (15–17°C km−1) geothermal gradient. Geotherms are then progressively depressed as the subduction zone evolves and early subducted units can be exhumed along a cold (< 10°C km−1) subduction channel.
The age of HP–LT metamorphism in the AMC units is debated. Bagheri & Stampfli (Reference Bagheri and Stampfli2008) proposed an Early Permian age (285 Ma) for blueschists of the CGC, and a ‘Variscan’ age for the HP–LT metamorphism of the MC, suggesting that the two units formed in distinct times and palaeotectonic settings. However, these geochronological data are highly debatable (Zanchi et al. Reference Zanchi, Malaspina, Zanchetta, Berra, Benciolini, Bergomi, Cavallo, Javadi and Kouhpeyma2015) as microstructural and chemical features of the dated minerals are loosely constrained. To our knowledge metamorphism and deformation of AMC units should be constrained to pre-Sakmarian (c. 300 Ma or older) times (Zanchi et al. Reference Zanchi, Malaspina, Zanchetta, Berra, Benciolini, Bergomi, Cavallo, Javadi and Kouhpeyma2015) and no robust data exist on the age of HP–LT metamorphism. Even if we take as valid the available geochronological data of the HP–LT metamorphism of the AMC, we need to consider that in the context of a long-lasting subduction (e.g. several tens of millions of years) the subducted rocks could reach the metamorphic peak at different ambient conditions and at different times (e.g. Gerya, Stockhert & Perchuk, Reference Gerya, Stockhert and Perchuk2002; Ukar, Reference Ukar2012). Therefore, the meta-basalts and the blueschists of the CGC and MC, even if they recorded contrasting P–T evolutions and were possibly metamorphosed at different ages, could still be considered as parts of a single accretionary complex.
The nature and provenance of the continental blocks that collided with the southern Eurasian margin is also controversial. The Anarak block strongly differs from the Upper Palaeozoic successions of Central and North Iran that record an extensional evolution related to the opening of the Neo-Tethys that caused the northward drift of Iran (Angiolini et al. Reference Angiolini, Gaetani, Muttoni, Stephenson and Zanchi2007; Gaetani et al. Reference Gaetani, Angiolini, Ueno, Nicora, Stephenson, Sciunnach, Rettori, Price, Sabouri, Brunet, Wilmsen and Granath2009). A possible provenance, discussed in Zanchi et al. (Reference Zanchi, Malaspina, Zanchetta, Berra, Benciolini, Bergomi, Cavallo, Javadi and Kouhpeyma2015), is that the AMC was part of the accretionary wedge developed above the Palaeo-Tethys subduction zone. In NE Iran, the Variscan–Cimmerian complexes of Binalood and Fariman (Sheikholeslami & Kouhpeyma, Reference Sheikholeslami and Kouhpeyma2012; Zanchetta et al. Reference Zanchetta, Berra, Zanchi, Bergomi, Caridroit, Nicora and Heidarzadeh2013) recorded the upper plate history of the Palaeo-Tethys subduction. The AMC could be originally placed to the SW of the Fariman complex and later shifted westwards to its present-day position in the framework of the large counter-clockwise rotation along a vertical axis that affected Central Iran from Triassic time (Muttoni et al. Reference Muttoni, Mattei, Balini, Zanchi, Gaetani, Berra, Brunet, Wilmsen and Granath2009; Mattei et al. Reference Mattei, Cifelli, Muttoni and Rashid2015).
7. Conclusions
The AMC of Central Iran is made of several units among which three of them, the Morghab, Chah Gorbeh and meta-basalts complexes, have been metamorphosed at HP–LT conditions within the blueschist facies.
At least three deformation events have been recognized in the MC and CGC. The second deformation stage is responsible for the development of the regional foliation (S2) that is generally concordant in the two units. Microstructural investigations and microprobe analyses demonstrated that the main foliation developed at blueschist-facies and greenschist-facies conditions for the CGC and MC units, respectively. The main fabric element of the CGC and MC thus formed when the two units were at different depths within the accretionary wedge.
The reconstruction of the deformation–metamorphism relationships and P–T estimates of the metamorphic stages allowed the definition of a clockwise P–T path for the MC and a counter-clockwise path for CGC and meta-basalts of the OC. P–T conditions at metamorphic peak were of 410–450°C at 0.78–0.9 GPa for the MC, 390–440°C at 0.6–0.9 GPa for the meta-basalts and 320–380°C at 0.6–0.9 GPa for the CGC.
The presented data suggest that the three units reached almost the same depth (c. 25 km) within the Anarak accretionary wedge, but followed different subduction–exhumation paths that resulted in a contrasting P–T evolution.
Acknowledgements
This paper results from the PRIN 2010/2011 Project BIRTH AND DEATH OF OCEANIC BASINS: GEODYNAMIC PROCESSES FROM RIFTING TO CONTINENTAL COLLISION IN MEDITERRANEAN AND CIRCUM-MEDITERRANEAN OROGENS and the DARIUS PROGRAMME. We are grateful to Vachik Hairapetian (Department of Geology, Esfahan Branch, Islamic Azad University, Iran) for providing us information on the age of the Lakh Marble. Comments and suggestions by Yann Rolland and an anonymous reviewer helped us to improve the quality of the paper. G. Capponi is warmly thanked for the editorial handling of the paper. We are grateful to the Geological Survey of Iran (Teheran branch) for its continuous support during several years of common research activities in Central Iran.