

1. Introduction
Glacial ice is the only known source of well-preserved ancient air. Analyses of air extracted from ice cores have demonstrated the coupling between global climate and greenhouse gases, and provided paleoenvironmental information ranging from changes in the global biospheric productivity to rapid temperature fluctuations over ice sheets (Reference Severinghaus, Sowers, Brook, Alley and BenderSeveringhaus and others, 1998; Reference PetitPetit and others, 1999; Reference BenderBender, 2003). One of the limitations of paleo-atmospheric studies using ice cores is the relatively small amount of ice (and trapped air) available for analyses for any given time period (typically <1 kg ice per sample, yielding <100 cm3 of air). For components present in very low (e.g. parts per trillion (ppt) or smaller) concentrations, this either severely limits the quality of possible analyses or makes the measurements entirely unfeasible. One of the measurements that have thus far been impossible due to insufficient ancient ice and air availability is carbon-14 of methane (14CH4).
Ice-core records from Greenland and Antarctica show large and rapid variations in atmospheric methane concentration ([CH4]) in response to climate change (Reference Chappellaz, Blunier, Raynaud, Barnola, Schwander and StaufferChappellaz and others, 1993; Reference Brook, Harder, Severinghaus, Steig and SucherBrook and others, 2000). Measurements of ambient atmospheric 14CH4 in the past two decades have helped to constrain the fossil CH4 contribution to the global budget, as well as reveal the 14CH4 rise due to production from pressurized-water reactors (Reference Conny and CurrieConny and Currie, 1996; Reference Lassey, Lowe and SmithLassey and others, 2007). 14C can be a similarly powerful tool for understanding paleo-methane budgets and changes in the methane sources during the rapid climatic transitions at the end of the last glacial period. Recent studies of δD and δ13C of methane place constraints on methane budgets during the last glacial termination (Reference Schaefer, Whiticar, Brook, Petrenko, Ferretti and SeveringhausSchaefer and others, 2006; Reference SowersSowers, 2006). However, the uncertainties and similarities in the dD and δ13C signatures of many methane sources preclude definitive methane budget reconstructions. The great advantage of 14CH4 is that it can definitively separate biogenic (wetlands, plants, animals) sources from geologic and clathrate sources. Biogenic 14CH4 mostly follows atmospheric 14CO2 (Reference WahlenWahlen and others, 1989; Reference Quay, Stutsman, Wilbur, Snover, Dlugokencky and BrownQuay and others, 1999), while most geologic and clathrate sources are very old and either contain no measurable 14C or very low 14C levels (Reference WincklerWinckler and others, 2002; Reference Grabowski, Knies, Turney, Pohlman, Mitchell and CoffinGrabowski and others, 2004; Reference Kessler, Reeburgh, Southon, Seifert, Michaelis and TylerKessler and others, 2006).
Reference Kennett, Cannariato, Hendy and BehlKennett and others (2000, Reference Kennett, Cannariato, Hendy and Behl2003) interpreted negative δ13C excursions in the record of benthic and planktonic foraminifera from the Santa Barbara Basin sediments as evidence of massive marine CH4 clathrate destabilization at the onset of several abrupt warming events during the last 100 kyr. They suggested that several large and rapid atmospheric CH4 increases, coincident with the abrupt warming events, were therefore caused by release of CH4 from marine clathrates to the atmosphere. This is known as the ‘clathrate hypothesis’. The clathrate hypothesis also states that the clathrate-released CH4 contributed to further warming during these events. Two such events occurred during the last glacial termination, during the Oldest Dryas (OD)–Bølling (∼14700 years BP, where present = AD 1950) and Younger Dryas (YD)–Preboreal (PB) (∼11 600 years BP) climatic transitions. Quantifying clathrate contributions to the methane increases during abrupt warming events at the end of the last glacial period is particularly relevant in the light of current anthropogenic warming. By recent estimates, the present amount of methane carbon associated with clathrates is 500–5000 × 1012 kg (Reference Buffett and ArcherBuffett and Archer, 2004; Reference MilkovMilkov, 2004); which, at the upper end, is comparable to the estimated carbon content of all fossil fuels. Future warming of the ocean has the potential to destabilize large amounts of methane clathrate, providing a positive feedback to the warming.
For ice containing pre-Holocene air with [CH4] of ∼500 ppb, at least 1000 kg ice is required to provide ∼25 mg carbon, which is near the lower limit required for an accelerator mass spectrometry (AMS) measurement of 14C. In this paper, we describe the techniques developed to extract and assess the quality of very large (∼100 LSTP (standard temperature and pressure)) samples of ancient air from glacial ice that are required for 14CH4 analyses.
Several experimental challenges must be overcome to obtain air samples that are suitable for paleo-14CH4 analyses. First, sufficient ice of the correct and well-constrained age with a well-preserved methane record must be obtained. Second, apparatus has to be developed capable of extracting ∼100 L of air from >1000 kg of ice in a reasonable amount of time and without altering the CH4. Finally, possible 14CH4 contamination from ambient air as well as the effects of gas isotopic fractionation and air dissolution during the melt extraction must be quantified.
This paper uses the d notation to report relative isotopic abundances as well as gas ratios. For isotopes, abundance ratios of the heavy and light isotope are compared between sample and standard, as follows:

In this paper, the standard for all gas data using the d notation is modern atmosphere at La Jolla, and the standard for oxygen-18 of ice is Standard Mean Ocean Water (SMOW).
2. The Pâkitsoq Ice Outcrop
Previous work has demonstrated that large quantities of ice dating to the last glacial termination are exposed at the surface at the ice-margin ablation site Pâkitsoq in West Greenland (Reference Reeh, Oerter, Letréguilly, Miller and HubertenReeh and others, 1991; Reference Petrenko, Severinghaus, Brook, Reeh and SchaeferPetrenko and others, 2006). An ice-sheet flow model indicates that this ice originates near Greenland Summit, ∼190 km south and 40 km west of the Greenland Ice Sheet Project 2 (GISP2) site (Reference Reeh, Oerter and ThomsenReeh and others, 2002). The ice stratigraphy is rotated nearly 90° about an axis parallel to the ice margin, exposing a range of ages at the outcrop. In an idealized flow situation the oldest ice would be found nearest to the ice margin in the ablation zone, with ice becoming younger with increasing distance from the ice margin, thus exposing a ‘horizontal ice core’ on the ice surface. This is the general age pattern observed for Pâkitsoq ablation ice. However, the situation is complicated locally by large-scale folding of the ice layers, which has been attributed mostly to ice-flow interaction with bedrock topography (Reference Petrenko, Severinghaus, Brook, Reeh and SchaeferPetrenko and others, 2006). The ages for ice sections dating to the last glacial termination are established by correlating Pâkitsoq surface ice records of δ15N of N2, δ18O of O2, δ18Oice and [CH4] with records from GISP2 (Reference Petrenko, Severinghaus, Brook, Reeh and SchaeferPetrenko and others, 2006). Very accurate dating is possible for ice dating from the YD–PB and OD–Bølling climatic transitions because of unique combinations of values for the four geochemical tracers observed in the GISP2 ice core for these periods, as well as the rapid changes in δ15N, [CH4] and δ18Oice during these transitions.
Five field seasons of ice sampling at Pâkitsoq demonstrated that (1) despite 2–3 m of annual ablation at the site, the ice-surface stratigraphy remains mostly constant from year to year and (2) the δ15N, δ18Oice, δ18Oatm and [CH4] records in Pâkitsoq ice and occluded air are mostly intact and suitable for paleoclimatic studies, although sporadically elevated [CH4] (by up to ∼500 ppb) was observed in some ice sections (Reference Petrenko, Severinghaus, Brook, Reeh and SchaeferPetrenko and others, 2006). Pâkitsoq ice contains thin planar bands with a high dust content (dust bands) as well as bands of bubble-free ice (blue bands). It was found that samples that contained dust bands as well as large (>∼2 mm width) blue bands yielded elevated [CH4] with respect to contemporaneous GISP2 ice. Small, non-continuous blue bands (‘cryptic blue bands’) do not appear to result in elevated [CH4] when included in the samples (Reference Petrenko, Severinghaus, Brook, Reeh and SchaeferPetrenko and others, 2006).
3. Field Procedures
3.1. Sample cutting and cleaning
The large ice samples were cut from near-surface Pâkitsoq ice with oil-free electric chainsaws in 2004 (YD–PB samples) and 2005 (OD–Bølling samples) (Fig. 1a). Saw bars and chains were pre-cleaned ultrasonically in acetone. Figure 1b shows the orientation of the ice cut for the large air samples with respect to the ice surface and stratigraphy, using the samples spanning the YD–PB climatic transition as an example. At the start of a sampling season, the approximate location of the YD–PB CH4 transition was identified by referencing to a marker pole placed in the ice at the end of the previous season. Several short near-surface ice-sample profiles, oriented perpendicular to the stratigraphy, were collected at 5–20 cm resolution at the margins of and within the projected sampling area. The extracted air was analyzed immediately for [CH4] by gas chromatography (GC) as described in Reference Petrenko, Severinghaus, Brook, Reeh and SchaeferPetrenko and others (2006) to redetermine the exact location and span of the CH4 transition, as well as [CH4] in the ice to either side of the transition.
(a) Field sampling of Younger Dryas ice. (b) A simplified schematic illustration of the ice cut at Pâkitsoq for the large air samples, using samples from the YD–PB transition as an example. The methane plot at the top does not represent real values and is used simply to illustrate the relative range of methane values spanned by each sample.

The ice stratigraphy at the Pâkitsoq site dips east (away from the ice margin) at 50–70° to the horizontal. Guided by [CH4] results from the field measurements, the sampling followed the spatial orientation of the stratigraphic layers with the aid of marker poles and geologic compasses for checking the dip of the ice layers cut. Most major blue bands and dust bands at Pâkitsoq parallel the stratigraphy; these were also used to guide the sampling. As shown in Figure 1b, the overall shape of the ice region cut for a sample was that of a parallelepiped with its long horizontal edges following the strike, and the inclined edges following the dip of the stratigraphy. At least the top 0.3 m of ice was removed and discarded to reduce the risk of contamination from the modern atmosphere. Further sample profiles for field [CH4] analyses were taken as the sampling progressed downward, to reconfirm the location of the YD–PB methane transition. The ice blocks were handled with vinyl gloves and placed on electropolished stainless-steel-topped tables for cleaning. All dust bands as well as any blue bands >-2 mm in width were removed. Between 4 and 15 mm of ice was removed from all surfaces of each block with clean electropolished stainless-steel chisels. Additional sample profiles and samples from corners of the ice areas cut were taken for laboratory analyses of δ15N of N2, δ18O of O2, δ18Oice and [CH4].
3.2. Air extraction
The air was extracted at the field site immediately after the ice was cut. Ice was loaded into a 670 L vacuum-melting tank (melter) constructed from chemically polished and surface-anodized 6061 aluminum alloy (Fig. 2). Some of the ice blocks were broken up once inside the melter to allow for tighter packing. The melter was sealed with a lid on a double Viton® O-ring flange. Once sealed, the melter was evacuated first to ∼130 hPa using two diaphragm pumps, and then to 8 hPa with a rotary vane pump. As the rotary vane pump contained oil, the air samples were never exposed to it, and the −40°C trap upstream of this pump (Fig. 2) was used to ensure that oil vapor did not diffuse into the sample transfer lines. Pressure inside the melter was monitored with a piezo pressure transducer. Ultra-high purity (uhp) nitrogen (N2; CH4–free) or argon (Ar; ∼40 ppb CH4) was added to the melter to ∼330 hPa, and the evacuation was repeated as above. The purpose of using Ar in place of N2 for a small number of samples was to test the efficacy of evacuation (see below). The uhp N2 or Ar flush was carried out three times; at the end of the third flush the melter was evacuated for 30 min after the pressure reached 8 hPa, which allowed for further flushing out of ambient air with water vapor.
Schematic of the large air sample melt extraction system. Gauge 1 is a 1300 hPa-range piezo pressure transducer. Gauge 2 represents three alternately used gauges: a 13 hPa-range capacitance manometer, a 1300 hPa-range piezo pressure transducer and a 15 bar-range mechanical gauge. Diaphragm pumps 1 and 2 are KNF Neuberger models N860 and N145, respectively.
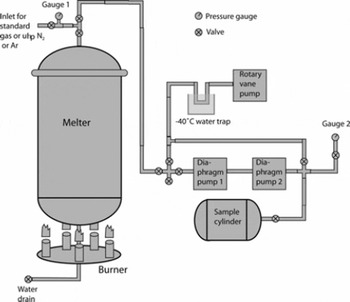
The melter was then isolated from the pumps, and the propane burner underneath the melter was lit. A thin cylindrical steel shroud was placed around the burner and the lower part of the melter, to facilitate efficient heat exchange. Melting progress was monitored through a glass window in the melter lid, and the burners were turned off when there were still a few ice blocks floating on top of the water. The melting process typically took 2–2.5 hours, with the final water temperature reaching 10–15°C. Pressure inside the melter headspace and temperature of the walls were recorded.
Air transfer to 35 L electropolished stainless-steel cylinders was done using two diaphragm pumps in series without drying the air. Immediately prior to the transfer, the line was flushed with uhp N2 or Ar for ∼30 s. With pumps running, leak checks were performed on the transfer line and the diaphragm pumps prior to each transfer using a capacitance manometer. These leak checks indicated that air from leaks during transfer amounted to a maximum of 0.03% of total sample air. The transfer times were ∼45 min per extraction for the YD, PB and YD–PB transition samples, and ∼30 min for the OD and Bølling samples. Pressure in the target cylinder was monitored with either a piezo pressure transducer or a mechanical high-pressure gauge. At the end of the transfer the pressures and temperatures of the melter and air cylinder were recorded.
The melter was closed and left overnight, with a further pressure and temperature reading taken in the morning, which served as a leak check of the melter itself. These leak checks indicated that the possible amount of ambient air leaking into the melter was <0.15% of the total sample air for all extractions (except one for the PB which indicated ∼0.3% possible ambient air). However, the slight pressure increase sometimes observed in the melter overnight was always smaller than that expected from outgassing of dissolved air from the meltwater (see section 4.3). The water level was recorded and the meltwater drained or filtered for particulates. Between 30 and 35 LSTP of air was obtained from each melt extraction, and air from two or three melt extractions was combined to form each sample listed in Table 1 (except for the Last Glacial Maximum (LGM) sample, which is from a single melt extraction). For the YD, PB and YD–PB transition samples, air from subsequent melt extractions was added directly to air from previous extraction(s). For the OD and Bølling samples, air from each melt extraction was initially pumped into individual cylinders, and then two or three extractions were combined in a single cylinder using two diaphragm pumps in series.
Measured and corrected [CH4],a CFC-11,b CFC-12,b δ18O of O2,c δAr/N2,c δKr/Ard and δXe/Ard in Pâkitsoq samples and melt-extraction blanks. Typical δ18O of O2 (for ice containing Oldest Dryas-age air), δAr/N2, δKr/Ar and δXe/Ar measured in small Pâkitsoq ice samples are shown for comparison with the large air samples. The [CH4] values in the ‘Corrected CH4’ column have been corrected for the melt-extraction blank and for dissolution during the melt extractions as described in section 4.3. [CH4], CFC-11 and CFC–12 and δAr/N2 measurements on the CH4 standard gas used in the blank extractions are also shown.e Modern ambient air CFC-11 and CFC-12 concentrations are shown for comparison. The expected [CH4] values for the large air samples, and the differences from expected values, are also givenf

3.3. Blank extractions
In order to assess 14CH4 contamination from the air-extraction procedure, simulated extractions with a synthetic fossil CH4/air mixture were conducted over the course of the sampling season as follows. For each sample of distinct age, blank extractions were conducted after the first melt extraction and the last melt extraction of that type of sample, to confirm that the extraction blank did not change over the sampling season. For example, the YD samples have an accompanying YD blank. Immediately after the melt extraction was complete, the meltwater was heated to ∼40–50°C and boiled under vacuum (while pumping on the melter headspace) to degas for 1 hour. The melter was then closed and left to cool overnight.
Headspace pressure and melter temperature were recorded the following morning and served as a leak check. The headspace was evacuated for 0.5 hour with a diaphragm vacuum pump to remove any CH4 that may have been produced, as well as any remaining dissolved gases that may have equilibrated with the headspace overnight. A standard gas containing ∼500 ppb of fossil CH4 in uhp air was then introduced into the headspace. The gas stayed in the melter for the same duration as a typical melting time, and was then transferred into the same type of stainless-steel cylinder as the sample air using exactly the same transfer procedure. Although the simulated extractions were done in batches of two or three (over meltwater from the same ice extraction), one simulated extraction was done for each melt extraction. The amount of standard gas used in each simulated extraction was such that the amount of CH4 was roughly equal to that in a real extraction. The amount of standard gas used and the duration of simulated extractions were adjusted so that the cumulative amount of CH4 in all the sample extractions of a particular age (e.g. YD) as well as the cumulative sample time in the melter were equal to the cumulative amount of CH4 and time spent in melter for the respective blank sample. For the OD and Bølling samples, where the sample air experienced an additional transfer between cylinders, this was also mimicked for the blanks.
4. Effects of Melt Extraction on Air Sample Composition
4.1. [CH4] blank of melt extractions
The [CH4] for all field blanks was <4 ppb elevated over the [CH4] of the standard gas (Table 1). This represents a remarkable improvement over the [CH4] blanks we observed in the early melter trials prior to surface treatment ([CH4] increases of up to 1500 ppb). Several aluminum surface treatments were investigated, and the low-[CH4] blanks shown in Table 1 were finally achieved through chemically polishing (a 90°C bath containing 80% phosphoric acid plus nitric and sulfuric acids) and then anodizing the melter surface. The blank samples were saved for subsequent processing for 14C to quantify any 14CH4 blank from the melt extractions.
One potentially important shortcoming of the simulated blank extractions conducted in the field was that the ice-melting process (including the application of intense heat to the melter bottom) was not mimicked. To address this, a single simulated extraction was conducted with ∼410 kg of gas-free ice obtained from a commercial ice-carving supplier. Small subsamples of this ice were analyzed as described by Reference Petrenko, Severinghaus, Brook, Reeh and SchaeferPetrenko and others (2006), and found to be free of CH4. The gas-free ice was initially purchased in ∼150 kg blocks, and was processed exactly as described above in the melt-extraction procedure. The chainsaw, bar, chain, ice-scraping chisel and table were the same as used in the field. The major differences were that (1) ∼2.5 times the usual amount of standard gas was used to provide sufficient pressure later for high-quality [CH4] measurements and (2) the ambient temperature (+20°C) was warmer than for a typical field extraction (+5°C). Following the gas-free ice-blank extraction, a further blank extraction was conducted over the meltwater using the usual blank procedure but again with ∼2.5 times more than usual standard gas. These tests are listed together near the bottom of Table 1. As can be seen, the [CH4] elevation over the standard gas value for both tests is <2 ppb. As the blank results are similar for both tests, we conclude that our field-blank approach is adequate in determining the [CH4] blank of ice-melt extractions for each sample.
Pâkitsoq air samples and blanks were stored in electro-polished steel cylinders for either 1 year (OD–Bølling samples) or 2 years (YD–PB samples) prior to processing for 14CH4. Repeated measurements of [CH4] over this time period (not shown) demonstrated that [CH4] was unchanged in all blank and sample cylinders over these time periods.
4.2. Remnant ambient air and isotopic fractionation during melt extraction
For three of the samples, uhp Ar was used instead of the uhp N2 for flushing the ice-filled melter prior to starting the melting. This was done to test the amount of ambient air that the melter-evacuation step may have left behind. As can be seen from Table 1, these three samples (YD 2, YD–PB transition 2 and Bølling 2) indeed show δAr/N2 that is higher by ∼40%o than in the corresponding replicate samples using N2 as the flushing gas, meaning that there is ∼4% more Ar due to the leftover flushing gas. Since Ar is only ∼1% of air, the residual flushing gas comprises only ∼0.04% of the entire extracted air sample. The amount of residual ambient air in the melter should be much smaller than this because three Ar or N2 flush-and-evacuation cycles were performed after the melter was sealed.
δ18O of O2 was measured in the large air samples and in Pâkitsoq ice (Table 1). The procedure for air extraction from small ice samples as well as the mass spectrometry method for all samples is described in Reference Petrenko, Severinghaus, Brook, Reeh and SchaeferPetrenko and others (2006). For the large Pâkitsoq air samples and blanks, 1–2 cm3 STP aliquots were taken for the measurement by expanding the air sample into a small evacuated volume and allowing the air to equilibrate between this volume and the parent tank for at least 10 min. A second expansion and equilibration was performed for the blank tanks, which were at higher pressure, to reduce the aliquot amount. The air aliquot was then cryogenically transferred to a stainless-steel dip tube in the same way as for air extracted from ice. The air aliquots from the CH4 standard (a high-pressure cylinder) were collected by flowing the gas for 2 min through a regulator set to ∼2 bar, then a ∼4 m length of 6 mm OD Synflex® tubing, then through two small (∼1.3 cm3) sampling volumes, followed by another ∼4 m length of Synflex® tubing. The sampling volumes were closed immediately after the gas flow was stopped and the air aliquots cryogenically transferred as for the rest of the samples.
The primary objective of δ15N of N2 and δ18O of O2 measurements on the large air samples was age determination. However, the isotopic measurements also serve to demonstrate that the melt-extraction procedure does not result in significant gas isotopic fractionation. The δ18O of O2 values shown for Pâkitsoq ice in Table 1 are for Oldest Dryas age ice and, as can be seen, they agree to within 0.1‰ with those in the large air samples. The δ18O of O2 values measured in ice of other ages, as well as δ15N measurements (Figs 4 and 5) show similar or better agreement with values measured in the large air samples. Assuming that all isotopic fractionation during melt extraction is kinetic in nature, the effect on CH4 isotopes should also be negligible. This was confirmed by the good agreement of δ13CH4 measured in the large air samples with δ13CH4 measured in smaller ice samples (Reference Schaefer, Whiticar, Brook, Petrenko, Ferretti and SeveringhausSchaefer and others, 2006).
4.3. Solubility loss of gases and corrections to [CH4]
Some of the air from the gas bubbles in ice is lost to dissolution in the meltwater during melt extraction. At 0°C, the solubility of CH4 is close to that of Ar and O2 and about 2.5 times that of N2 (Table 2). Because of this, if a substantial fraction of air does dissolve in the meltwater, the [CH4] in the headspace (and thus the extracted air sample) is effectively reduced. To determine the true [CH4] in the sampled ice, a correction must be made for this effect. To better understand the solubility effects during the melt extractions, we measured Kr/Ar and Xe/Ar ratios in the large air samples spanning the YD–PB transition, as well as in small samples of Pâkitsoq ice using established methods described in Reference Headly and SeveringhausHeadly and Severinghaus (2007). Kr is about twice as soluble as CH4 and Ar, and Xe is about four times more soluble (Table 2); thus these gases would show an enhanced solubility signature. δAr/N2 was also measured in all large air samples as well as in Pâkitsoq ice. For δAr/N2 measurements, the procedure for air extraction from ice was as described in Reference Petrenko, Severinghaus, Brook, Reeh and SchaeferPetrenko and others (2006) and the decanting procedure for large air samples was the same as for δ18O described above. The Ar/N2 ratios were determined by measuring the 40/28 mass ratios using a Finnigan Delta XP dual dynamic inlet isotope ratio mass spectrometer. Corrections were made for sample/standard pressure imbalance and for O2/N2 ratio chemical slope as described by Reference Severinghaus, Grachev, Luz and CaillonSeveringhaus and others (2003). The reference was clean dry La Jolla air.
Solubilities of gases of interest in terms of Henry’s law constant at 0°C. All solubilities are from Reference Wilhelm, Battino and WilcockWilhelm and others (1977), converted from units of molar fraction
We expect the gases to be dissolving primarily by the following two mechanisms. First, gas dissolves from the air bubbles as they rise through the water. During melt extraction, the water level rises quickly to cover most of the ice blocks, and most of the melting and air release happens under water. Because the air bubbles are released and rise near the surfaces of the ice blocks, the effective temperature of the water they exchange gases with is near 0°C. Second, gas enters the liquid by dissolving directly into the water from the melter headspace. The surface water is constantly in contact with floating ice; we expect its temperature to also be near 0°C. Thus, 0°C is the most likely temperature of the water with which the gases equilibrate.
Knowing the typical water and headspace volumes for a melter extraction (484 and 186 L, respectively) and the typical headspace temperature (284 K), it can be shown that the fraction of a particular gas that dissolves in the water at full equilibrium is:
where F w is the mole fraction of the total amount of a given gas which is dissolved, K H the Henry’s law constant for the gas at dissolution temperature, V w the water volume (L), V air the headspace volume (L) and T air the temperature (K) of the gas in the headspace. The molar fractions of each gas dissolved can also be calculated for incomplete solubility equilibrium situations (e.g. if only 50% of the gas that could be dissolved is actually dissolved). Knowing the starting δAr/N2, δKr/Ar and δXe/Ar in Pâkitsoq ice (Table 1), the δAr/N2, δKr/Ar and δXe/Ar values expected in the samples extracted from the headspace for various fractions of full-solubility equilibrium reached can be determined (Fig. 3a). We can then estimate the fraction of full-solubility equilibrium achieved for the samples by plotting δKr/Ar and δXe/Ar vs δAr/N2 along with our model predictions (Fig. 3b).
Solubility effects on gases during melter extractions. (a) Modelled δAr/N2, δKr/Ar and δXe/Ar vs fraction of full-solubility equilibrium reached at 0°C. (b) Measured sample and model δKr/Ar and δXe/Ar plotted vs δAr/N2. Data that do not lie on the modelled curves are for samples YD 2 and YD–PB transition 2, which used Ar flushing. Sample error bars are smaller than the size of points and are not shown. (c) Same as (b), except that gas ratios for YD 2 and YD–PB transition 2 samples have been corrected for residual Ar from flushing as described in section 4.3.

As can be seen, four of the samples fit the models well, while two samples (YD 2 and YD–PB transition 2) are shifted strongly in δAr/N2. For both of these samples, the melter flush used Ar, and, as discussed above, they have elevated Ar levels. This effect can be corrected for by assuming that the true Ar/N2 ratio of these samples is as in their N2-flushed duplicates (YD 1 and YD–PB transition 1). When this is done, and the δKr/Ar and δXe/Ar values are corrected to account for lower true Ar levels, the plot becomes as shown in Figure 3c. There is excellent agreement between the data and the melter solubility model. Such agreement can only be achieved if all four gases (N2, Ar, Kr and Xe) within any given sample are reaching the same fraction of full-solubility equilibrium, despite their different solubilities and diffusivities in water. Although literature estimates of diffusivity in water for the gases of interest vary somewhat, the diffusivities in water of Ar, Kr and Xe in the range 0–10°C are always slightly lower, while the diffusivity in water of N2 is slightly higher than that of CH4 at equivalent temperature. The full range of measured diffusivities in water for all gases is 0.63–1.50 × 10⁻⁵ cm2 s−1 (Reference Smith, Friess and MoralesSmith and others, 1955; Reference Ferrell and HimmelblauFerrell and Himmelblau, 1967; Reference Boerboom and KleynBoerboom and Kleyn, 1969; Reference Maharajh and WalkleyMaharajh and Walkley, 1973; Reference Jähne, Heinz and DietrichJähne and others, 1987). The spread of samples along the model lines is most likely due to variability between samples of the fraction of full-solubility equilibrium attained.
Because N2, Ar, Kr and Xe all appear to achieve the same fraction of full-solubility equilibrium within any given sample, we conclude that CH4 in that sample also achieves the same fraction of full-solubility equilibrium. Based on δXe/Ar (Xe being the most soluble and therefore the best estimator), we estimate the full range of solubility equilibrium fractions observed in our samples to be 0.42–0.78 when sample δXe/Ar measurement errors are taken into account. Calculating the fractions of N2, O2, Ar and CH4 dissolved for this range of equilibrium fractions, we can determine the minimum (1.02) and maximum (1.06) correction factors that need to be applied to the measured [CH4]. These corrections, along with the blank corrections, are incorporated into the range of corrected [CH4] values given in Table 1. Although Kr and Xe were not measured for the OD–Bølling samples, we can expect the range of necessary solubility corrections to be the same because the extraction procedure was effectively the same as for the YD–PB samples. We therefore apply the same solubility corrections to all samples.
Kr and Xe were not measured in the extraction blanks. However, δAr/N2 in the samples shows a large Ar depletion compared to Pâkitsoq ice, so it can also serve as an indicator of dissolution of a substantial fraction of the gases. Interestingly, no significant δAr/N2 depletion compared to the methane standard gas is observed in the YD–PB extraction blanks, and a slight enrichment is observed in the OD–Bølling extraction blanks. This suggests that, unlike the ice-melt extractions, there is no substantial exchange of gases between the headspace and the water for the extraction blanks. Therefore there is no need to correct the extraction blank [CH4] for solubility effects.
The greatly enhanced gas exchange in the actual melt extractions compared to the blanks is most likely due to gas dissolution directly from the rising gas bubbles during melting. This is clear from a comparison of δAr/N2 in the actual samples with that for the gas-free ice blank (Table 1). The gas-free ice blank involved the same vigorous heating and water convection as the actual samples, yet its δAr/N2 indicates 0.06–0.07 for the fraction of full-solubility equilibrium reached, compared to 0.42–0.78 determined for the actual samples.
After the solubility and blank corrections are applied, it can be seen from Table 1 that the [CH4] in most of the samples is 0–132 ppb higher than expected from [CH4] in GISP2 contemporaneous ice. Some sections of ice with elevated [CH4] have been previously observed at Pâkitsoq (Reference Petrenko, Severinghaus, Brook, Reeh and SchaeferPetrenko and others, 2006). [CH4] analyses on small ice samples taken from the same ice sections as the large samples also yield a few values that are elevated (by up to 500 ppb in one case) with respect to GISP2 [CH4] (Figs 4 and 5). Further, [CH4] in the contaminated PB sample is higher than the ambient atmospheric value, strongly indicating in situ CH4 production in the ice. In situ CH4 production has previously been observed and attributed to microbial sources in ice (Reference Campen, Sowers and AlleyCampen and others, 2003; Reference PricePrice, 2007). It is thus possible that the observed [CH4] elevation over GISP2 in the large air samples is due to a small amount of microbial CH4 production in Pâkitsoq ice; however, this is not well understood.
Geochemical records of the YD–Preboreal transition (a) in the GISP2 ice-core record and (b) at the Pâkitsoq ice outcrop in 2004. Both records are plotted vs gas age for easy comparison. The gas age scale for Pâkitsoq was established as described in section 5, and the distances of the main age tie points in the Pâkitsoq horizontal profile are indicated. The age–distance relationship in Pâkitsoq ice is variable (Reference Petrenko, Severinghaus, Brook, Reeh and SchaeferPetrenko and others, 2006). For example, for the Pâkitsoq ice section shown on the plot, ice containing gases of Preboreal age is relatively less thinned. (a) GISP2 δ15N of N2 is from Reference Severinghaus, Sowers, Brook, Alley and BenderSeveringhaus and others (1998), [CH4] is from Reference Brook, Harder, Severinghaus, Steig and SucherBrook and others (2000) and δ18Oice is from Reference Grootes and StuiverGrootes and Stuiver (1997). All GISP2 data are plotted on the gas age scale as in Reference Schaefer, Whiticar, Brook, Petrenko, Ferretti and SeveringhausSchaefer and others (2006). (b) δ15N of N2, δ18Oatm and [CH4] in the Pâkitsoq large air samples and δ15N of N2, δ18Oatm, [CH4] and δ18Oice in small ice samples taken for stratigraphic age control. The horizontal error bars on the large air samples indicate the maximum possible range of gas ages included in the samples with respect to the GISP2 gas age scale. Measurements of δ15N on the large air samples were performed simultaneously with measurements of δ18O of O2 as described in the text. Measurements of δ15N, δ18Oatm, [CH4] and δ18Oice on the small ice samples were performed as described in Reference Petrenko, Severinghaus, Brook, Reeh and SchaeferPetrenko and others (2006). The pooled standard deviation for the small ice sample measurements was 0.009‰ for δ15N and 0.024‰ for δ18Oatm. The average standard deviation of the small ice sample [CH4] measurements (includes reproducibility of repeated measurements on the same sample as well as variation in the methane blank) was 26 ppb. The age-control small ice sample set consisted of a single horizontal sample profile collected near the northern end of the sampling area (strike of the stratigraphy is approximately north–south), along with samples from the corners of ice areas cut for each large sample (not shown). Note that sample age decreases with profile distance for the YD–PB transect but increases with profile distance for the OD–Bølling transect (Fig. 5). This is due to these transects lying on opposite sides of the axis of a large-scale fold in the ice; for a more detailed discussion see Reference Petrenko, Severinghaus, Brook, Reeh and SchaeferPetrenko and others (2006). The Pâkitsoq deposition site is slightly warmer than Summit (with δ18Oice higher by 1–2%), with slightly thinner firn (as indicated by 0.02‰ lower δ15N). This predicts a slightly lower gas-age/ice-age difference for Pâkitsoq than for GISP2. This has been taken into account when using inflection points in the Pâkitsoq δ18Oice record to establish gas-age tie points.

Geochemical records of the OD–Bølling transition (a) in the GISP2 ice-core record and (b) at the Pâkitsoq ice outcrop in 2005. As in Figure 4, both records are plotted vs gas age. (a) GISP2 δ15N of N2 is from Reference Severinghaus and BrookSeveringhaus and Brook (1999), [CH4] is from Reference Brook, Harder, Severinghaus, Steig and SucherBrook and others (2000) and δ18Oice is from Reference Grootes and StuiverGrootes and Stuiver (1997). All GISP2 data are plotted on the gas age scale as in Reference Severinghaus and BrookSeveringhaus and Brook (1999). (b) OD–Bølling transition Pâkitsoq large air samples and small ice samples taken for stratigraphic age control, similar to Figure 4b. The age-control small ice sample set in this case consisted of four horizontal profiles, collected along the top and bottom southern edges, near the center, and along the northern edge of the sampling area. Only the center profile is shown to avoid overloading the plot. The large Bølling samples included some gas from the OD–Bølling CH4 transition.

4.4. CFC-based constraints on contamination from modern atmospheric CH4
14CH4 of modern ambient air is ∼130% modern carbon (pMC) (Reference Quay, Stutsman, Wilbur, Snover, Dlugokencky and BrownQuay and others, 1999), while the 14CH4 for all Pâkitsoq samples is expected to be <30 pMC. It is therefore important to quantify the amount of modern ambient CH4 that may somehow be included in our samples. The large size of the air samples enabled us to perform CFC-11 and CFC-12 measurements for this purpose (Table 1). CFC-11 and CFC-12 have been shown to only have recent anthropogenic sources (Reference ButlerButler and others, 1999). Neither the extraction blanks nor the CH4 standard gas contain measurable amounts of CFC-11 or CFC-12. Any CFCs observed in the samples must therefore arise either from contamination by modern air in the ice or from a handling-related process that is not mimicked by the blanks. The maximum observed CFC-12 value in our samples is 2.8 ppt, or 0.5% of the concentration in modern ambient air. The CFC-11/12 concentration ratio in ambient air is ∼0.5, while in our samples this ratio is 1.53 ± 0.24. Because the CFC levels are so low in these samples, the measured values are comparable to the estimated uncertainties (Table 1). However, the fact that the ratio is calculated on the basis of 12 different samples lends confidence to this value. The observed CFC-11/12 ratio is very different from the ambient ratio, demonstrating that direct leaks of ambient air are not the dominant source of the CFCs, and that ambient air leaks are therefore not a significant source of CH4 contamination.
The observed CFC-11/12 ratio of 1.53 ± 0.24 is close to the value we calculate for CFC-11 and CFC-12 dissolved in ∼0°C water at equilibrium with air containing modern CFC11 and CFC-12 concentrations (1.92) (Reference Warner and WeissWarner and Weiss, 1985). One possibility is that the CFCs are originating from the blue bands in Pâkitsoq ice. The origin of blue bands is currently unknown, but it is possible that they are created when basal water is injected into cracks in the ice. This water may originate from moulins, and thus carry a recent atmospheric gas signature, which includes some modern CH4. The effect of dissolved CFCs from blue bands equilibrating between the meltwater and headspace during a melt extraction can be modelled, and our calculations (not shown) yield CFC concentrations of a similar range to those observed, but the predicted CFC-11/12 ratios are ≤1, which argues against blue bands being a major contributor of CFCs/modern air to the samples. Another line of evidence against the blue band source of CFCs comes from earlier air samples extracted at Pâkitsoq in 2003 (not discussed in this paper; see Reference Schaefer, Whiticar, Brook, Petrenko, Ferretti and SeveringhausSchaefer and others (2006), for more on 2003 samples), for which even the smallest blue bands were removed. These show CFC-11 and CFC-12 concentrations in the same range as samples shown in Table 1, and a CFC-11/12 ratio of 1.22 ± 0.25, which agrees, within errors, with that for the samples in Table 1.
Another possible CFC source is dissolution of modern air in the liquid layer on the surface of all ice pieces that were loaded into the melter, as well as in the small amount of meltwater pooling at the melter bottom (the temperatures at Pâkitsoq were always above freezing during our field campaigns). In this case, the effective water volume for gas equilibration during a melt extraction may be smaller than the overall meltwater volume, because CFCs are present in a thin liquid layer on the ice-block surfaces and will equilibrate with the headspace before most of the ice is melted. The sample CFC-11/12 ratios predicted by this scenario match the observed ratios, and we therefore consider this to be the most likely source of CFCs in the samples. Of course some modern CH4 would, in this case, be dissolved on the ice block surfaces as well. Based on CH4 solubility in 0°C water (2.56 × 10⁻³ M atm−1; Table 2), we calculate that, with this scenario, the added modern CH4 would account for a maximum of ∼0.4% of the total CH4, resulting in a maximum 14C shift of ∼0.4 pMC in the samples. It is likely that even though a measurable amount of CFCs were trapped in the melter, most of the ambient CH4 was removed during the flushing/evacuation steps because CFCs are known to adhere to a variety of surfaces and dissolution on ice-block surfaces may not be the only process responsible for their presence. Because of this, as well as because the calculated 14C correction is uncertain and small, we do not plan to include this correction in our 14C calculations.
5. Ages of the Large Air Samples
The ages of the large air samples were established by correlating records of δ15N of N2, δ18Oatm (δ18O of O2, corrected for gravitational fractionation in the firn) (Reference BenderBender and others, 1994), [CH4] and δ18Oice in Pâkitsoq ice with the GISP2 ice-core record of the same tracers. δ15N of N2, δ18O of O2 and [CH4] were measured in the large air samples as well as in small ice samples from horizontal profiles and from the corners of the sampling area (see section 3.1). δ18Oice was also measured in the horizontal-profile samples. The δ15N of N2 (Figs 4 and 5) and δ18Oatm (Fig. 4) values in the large air samples are consistent with values expected from the GISP2 ice-core record, with the [CH4] values being higher than in GISP2 by 0–132 ppb, as discussed above. To illustrate how the dating is accomplished, Figures 4 (YD–PB) and 5 (OD–Bølling) show δ15N, [CH4] and δ18Oatm for the large air samples (δ18Oatm in Fig. 4 only), as well as δ15N, [CH4], δ18Oice and δ18Oatm for the small ice samples (δ18Oatm in Fig. 4 only) collected for age control. Records from contemporaneous GISP2 ice are included in each figure for comparison.
As can be seen, the [CH4] values in the large air samples are mostly in good agreement with [CH4] measurements on stratigraphically equivalent small ice samples. Several of the small ice samples exhibit [CH4] that is elevated (by up to 500ppb in one case) with respect to the GISP2 record; this may be due to microbial in situ production as mentioned above. δ15N in the large air samples appears to be shifted down by ∼0.02‰ with respect to the small ice samples, possibly due to fractionation, but this shift is close to the analytical uncertainty (0.009‰).
The best age determination for the large air samples is achieved through establishing gas age scales for sampled sections of Pâkitsoq ice. Because all samples (except for LGM) are centered around climatic transitions involving large and rapid changes in several geochemical tracers, several good tie points are available for correlating the Pâkitsoq surface record with the GISP2 gas age scale. The main gas age tie points are listed in Table 3. We have found δ15N to be the most robust and precise of the measurements on Pâkitsoq ice. δ15N peaks record rapid surface temperature changes (Reference Severinghaus, Sowers, Brook, Alley and BenderSeveringhaus and others, 1998) that were almost certainly synchronous over all of Greenland. Further, the Pâkitsoq deposition site is modelled to be within ∼200 km of Summit, and Pâkitsoq δ15N shows a constant offset of only ∼−0.02% from GISP2 values during intervals of stable climate (YD and OD). These lines of evidence suggest that the Pâkitsoq and GISP2 deposition sites for the climatic intervals of interest had similar firn thicknesses. We therefore make the assumption that the temporal evolution of the δ15N peaks in GISP2 and Pâkitsoq for the YD–PB and OD–Bølling abrupt warming events is the same and use δ15N for most of the gas-age tie points. We note that the other tracers are consistent with the ages so determined in all cases.
Main age tie points used to establish the gas chronology of the sampled Pâkitsoq ice sections. In addition to the points shown, more gradual changes in δ15N from GISP2 were used to obtain additional age control points for the Preboreal, Oldest Dryas and Bølling samples. The GISP2 δ15N data used for correlation with Pâkitsoq records are from Reference Severinghaus, Sowers, Brook, Alley and BenderSeveringhaus and others (1998), Reference Severinghaus and BrookSeveringhaus and Brook (1999) and Reference KobashiKobashi (2007). δ18Oice data used are from Reference Grootes and StuiverGrootes and Stuiver (1997), and δ18Oatm data used are from Reference Bender, Malaize, Orchardo, Sowers, Jouzel, Clark, Webb and KeigwinBender and others (1999) and Reference Severinghaus, Beaudette and BrookSeveringhaus and others (2006). For each time period involved, the best available ice-core gas age scale was used

Once the gas-age tie points are established, the age–distance relationship for ice between any two tie points can be determined from the stratigraphic positions of the tie points in the Pâkitsoq profile. Based on these age–distance relationships, the average gas ages, as well as the maximum possible age spans, of the large air samples can be calculated (Table 4). This approach allows for mean age determination with <1 % absolute uncertainty for the YD–PB transition samples and ∼2% absolute uncertainty for the OD–Bølling transition samples. The age of the LGM sample, however, is not well constrained because the four tracers we measured were not changing significantly around the time of the LGM.
Large air sample mean ages, uncertainties and maximum ranges of ages of ancient air possibly included in the large air samples

6. Summary and Outlook for using Pâkitsoq Ice to Reconstruct Paleoatmospheric 14CH4
A novel method has been developed for obtaining very large (∼100 L STP) ancient air samples for paleoatmospheric 14CH4 analyses. This air was extracted from ancient glacial ice outcropping at the Pâkitsoq ablation site. The combination of δ15N of N2, δ18O of O2, δ18Oice and [CH4] allows for unambiguous dating of the air samples, especially at times of abrupt climatic transitions when several of these tracers are changing rapidly. The method involves large-scale melt extractions performed in the field, accompanied by simulated extractions to test the procedural [CH4] and 14CH4 blanks.
The field blank extraction procedure has been shown to simulate the [CH4] blank for actual melt extractions well, and [CH4] melt-extraction blanks for all large air samples are <4 ppb. The amount of possible contamination to sample 14CH4 from ambient air via several mechanisms was constrained using δAr/N2 and CFC-11 and CFC-12 measurements and found to be negligible for all samples. δAr/N2, δKr/Ar and δXe/Ar were measured in the samples to constrain gas loss to dissolution in water during the melt extractions. The results show excellent agreement with a simple solubility model and indicate that all gases of interest were reaching the same fraction of full-solubility equilibrium within a given sample, which allowed corrections to sample [CH4] to be made.
Thirteen large air samples dating to the YD–Preboreal and OD–Bølling rapid climatic transitions, as well as to the LGM were obtained using these methods. After corrections for dissolved gases, Pâkitsoq sample [CH4] values appear to exceed contemporaneous GISP2 [CH4] by 0–132 ppb for most samples. However, preliminary tests suggest that the solubility effect was likely to be important for the GISP2 [CH4] record as well, and the reported GISP2 [CH4] may be ∼2% too low. If GISP2 [CH4] is corrected up by 2%, Pâkitsoq [CH4] for YD samples comes into agreement with the GISP2 data (Table 1). With this correction, the [CH4] ranges for the Pâkitsoq PB and OD samples also overlap with the expected [CH4] ranges from GISP2. However, [CH4] values for Pâkitsoq ‘contaminated’, Bølling and possibly YD–PB transition samples remain higher than the GISP2 values even after the 2% correction. This [CH4] excess is probably due to in situ CH4 production in Pâkitsoq ice, and indicates that 14CH4 in some Pâkitsoq samples is probably altered from the true paleoatmospheric signal.
A full treatment of the effects of in situ CH4 production at Pâkitsoq on sample 14CH4 is beyond the scope of this paper and will be given elsewhere along with the 14CH4 results. Briefly, the comparison of measured 14CH4 in the contaminated OD and PB samples with 14CH4 of other samples of the same age (other PB and OD samples) permits an estimate of the 14CH4 of the contaminant: 84.1 ± 20.5 pMC for the contaminated OD sample; 79.3 ± 3.9 pMC for the contaminated PB sample. A correction can then be applied to the other samples, assuming that the 14CH4 of the in situ contaminant for all samples spanning the YD–PB transition is the same as for the contaminated PB sample, and for samples spanning the OD–Bølling transition it is the same as for the contaminated OD sample. A further assumption made with this correction is that the true [CH4] values of the samples are as recorded for contemporaneous air in the GISP2 ice core. This correction results in an increase in 14CH4 uncertainties from ∼0.7 pMC to 1.6–2.6 pMC for the averages of replicate samples. For comparison, the predicted difference in 14CH4 between an all-wetland and an allclathrate scenario is ∼10 pMC for the YD–PB CH4 transition and ∼6 pMC for the OD–Bølling transition. Thus, the Pâkitsoq 14CH4 results should still allow us to distinguish between the two hypotheses for each transition. However, the increased uncertainties limit our ability to detect a clathrate (fossil) contribution to the CH4 increases. In the case of the YD–PB CH4 increase, we should be able to detect a clathrate contribution of ∼25% or greater; in the case of the OD–Bølling transition it is ∼55% or greater.
A further potential complication is the possibility of direct cosmogenic production of 14CH4 molecules in ice in accumulation and ablation zones. This is surprising, but is suggested by the Pâkitsoq 14CH4 results (measured 14CH4 values are still higher than maximum predicted values by ∼20% even after the corrections described above). This is also beyond the scope of this paper, and further work is currently underway to understand this phenomenon and correct the 14CH4 values for possible cosmogenic production.
In conclusion, the technique presented here is successful in extracting very large samples of trapped air from glacial ice without alteration of CH4 and a number of other gases of interest. However, the utility of 14CH4 from Pâkitsoq ice for testing the clathrate hypothesis and quantifying the fossil components of paleo-CH4 budgets is limited by in situ production of CH4 in some ice sections at this site. Colder ablation sites in Antarctica where old ice is exposed at the surface, such as Mount Moulton (Reference Popp, Sowers, Dunbar, McIntosh and WhitePopp and others, 2004) or Taylor Glacier (Reference Aciego, Cuffey, Kavanaugh, Morse and SeveringhausAciego and others, 2007), may avoid this problem and provide higher-quality 14CH4 records. Direct cosmogenic production of 14CH4 in ice, if real, presents a ubiquitous obstacle for 14CH4 reconstructions and must be understood before the fossil fractions of past CH4 budgets can be quantified.
The large size of the extracted air samples and the demonstrated lack of significant ambient air contamination lends them to a number of paleoatmospheric analyses beyond 14CH4, that have not previously been possible due to insufficient air availability. For example, carbon tetrafluoride (CF4) is known to have anthropogenic sources but is suspected to have some natural sources as well, and has been successfully measured in these samples. The meltwater from the ice extractions can also be filtered for particulates such as wind-blown dust and pollen.
Acknowledgements
This work was supported by US National Science Foundation grants OPP 02-21470 (to J.P.S.) and OPP 02-21410 (to E.J.B.), a Packard Fellowship (to J.P.S.) and American Chemical Society Petroleum Research Fund grant No. 42551-AC2 (to E.J.B.). We thank the University of California–San Diego’s Campus Research Machine Shop for their excellent work fabricating the melter, and B. Miller, R. Keeling, B. Deck, J. Marrin and D. Etheridge for helpful discussions. We thank J. Melton and M. Arsenault for help with field sampling and methane measurements. K. Riedel performed some of the CH4 analyses at NIWA. L. Bjerkelund ably assisted with CH4 measurements in mini-melter tests. VECO Polar Resources provided outstanding logistical support in the field. C. Wies-man of Sapa Anodizing chemically polished test pieces free of charge and provided helpful discussions. We thank the Glaciology Group, Niels Bohr Institute, University of Copenhagen, Denmark, for performing the δ18Oice measurements. We also thank Field Coordinator P. Rose for his excellent help with logistics and sampling. R. Beaudette and M. Croon helped with melter testing at SIO. We thank the Danish Polar Center and Greenland Home Rule for permission to carry out this research. This paper was improved by suggestions from an anonymous reviewer.


