


Impact statement
There is a critical need to standardize measurements of atmospheric CO2 removal via carbon dioxide removal (CDR) technologies, create guidelines for reporting carbon credit generation, and develop methods for verifying that each carbon credit placed on the market represents a net tonne of CO2 equivalent removed from the atmosphere and durably stored. The monitoring (or measuring), reporting, and verification (MRV) of carbon credits is essential to provide confidence to commercial operators, investors, regulators and the public sector in the efficacy of a CDR approach. Presenting peer-reviewed protocols that explicitly outline requirements for the MRV of carbon credits generated by CDR technologies at megatonne and gigatonne scales is critical for establishing confidence in the ability for CDR to verifiably remove large quantities of CO2 from the atmosphere and for limiting skepticism about the operations of the carbon credit market. This is a substantial but necessary undertaking for the CDR community. This work provides contributions to the monitoring/measuring sector of MRV by discussing the accuracy and precision presented by five analysis techniques used for the quantification of CaCO3 generated during the carbonation stage of a lime carbonation DAC system. Developing and presenting standard operating procedures for CaCO3 analysis techniques and providing assessed accuracy and precision metrics corresponding to each technique will aid companies and institutions studying and operating lime carbonation DAC. Public acceptance of standard operating procedures for carbonate content analysis will provide verifiable and reliable quantification of atmospheric CO2 removed by these processes and build confidence in the integrity of carbon credits generated by lime carbonation DAC systems.
Introduction
The release of anthropogenic carbon dioxide (CO2) into the atmosphere has led to increased global warming and climate change. While CO2 emission reduction efforts are critical for achieving climate targets articulated by the Paris Climate Agreement, there is also a need to remove CO2 directly from the atmosphere using carbon dioxide removal (CDR) technologies. Methods for CDR include (but are not limited to): direct air carbon capture and storage (DACCS), afforestation/reforestation, bioenergy with carbon capture and storage (BECCS), coastal wetland management, biochar, peatland and wetland restoration, soil carbon sequestration and agroforestry (Smith et al., Reference Smith, Geden, Nemet, Gidden, Lamb, Powis, Bellamy, Callaghan, Cowie, Cox, Fuss, Gasser, Grassi, Greene, Lück, Mohan, Müller-Hansen, Peters, Pratama, Repke, Riahi, Schenuit, Steinhauser, Strefler, Valenzuela and Minx2023), as well as geochemical techniques including ocean alkalinity enhancement, CO2 mineralization (in situ and ex situ), enhanced weathering in soils, and ‘hybrid’ forms of DAC which utilize the carbonation of alkaline materials (Campbell et al., Reference Campbell, Foteinis, Furey, Hawrot, Pike, Aeschlimann, Maesano, Reginato, Goodwin, Looger, Boyden and Renforth2022).
DAC is being explored as a useful method for capturing atmospheric CO2 through reactions with sorbents such as metal-organic frameworks and amine-modified materials (Shi et al., Reference Shi, Lin and Chen2022) or alkaline liquids (Keith and Ha-Duong, Reference Keith and Ha-Duong2002) in a chemical engineering process. The CO2 bound to the sorbent/alkaline material is concentrated during regeneration to produce a pure CO2 gas stream for geological storage. Given the scalability of the technology and durability of the stored CO2, there is active commercial and academic research and development of these systems (NASEM, 2019).
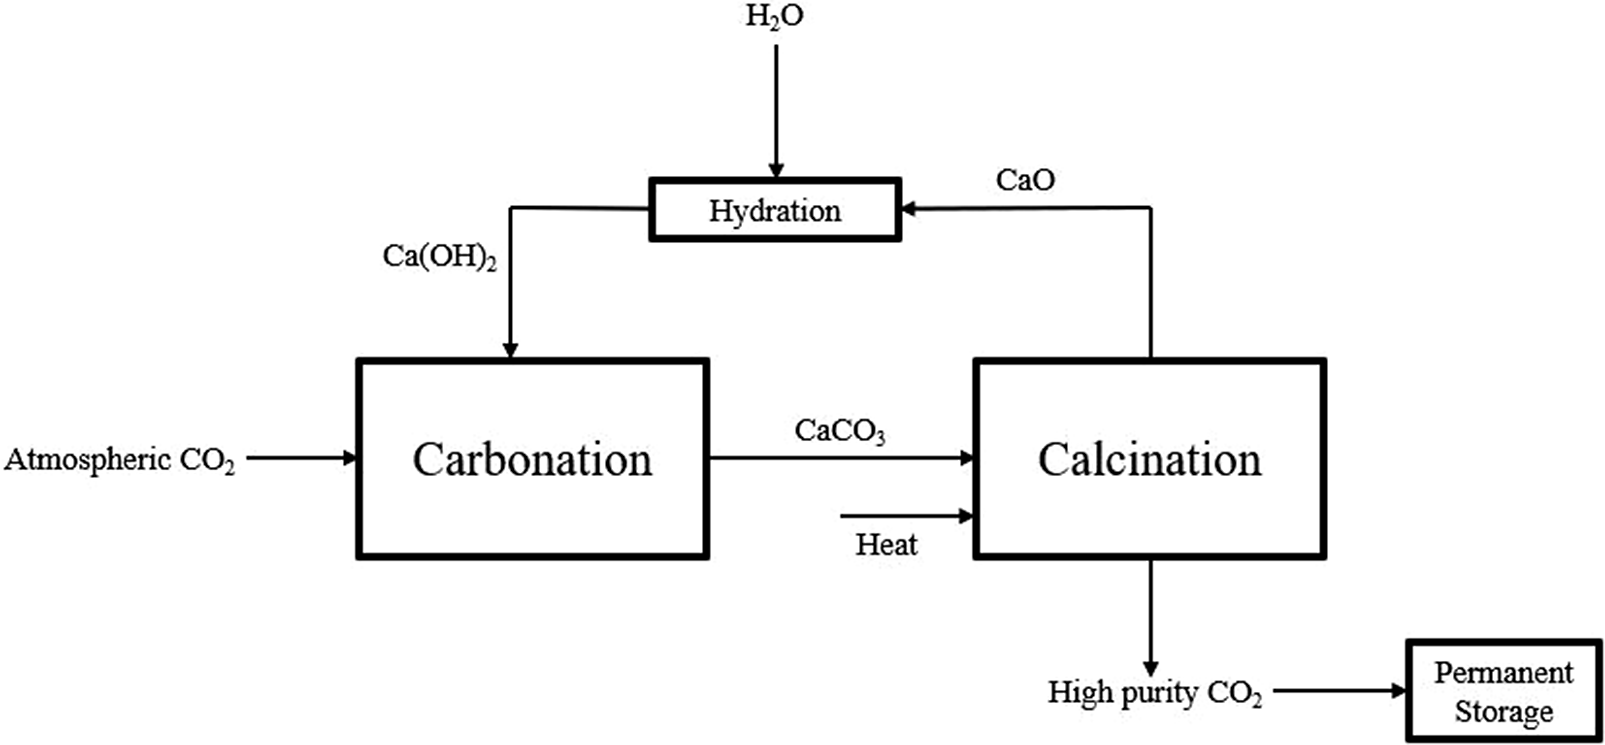
An alternative DAC type has been proposed in which atmospheric CO2 is captured in a reaction with solid mineral alkaline materials to form stable carbonate minerals (herein referred to as ‘oxide looping’ direct air capture (OxL-DAC)) (Kelemen et al., Reference Kelemen, McQueen, Wilcox, Renforth, Dipple and Vankeuren2020, Reference Kelemen, Wilcox, McQueen, Dipple and Renforth2022; McQueen et al., Reference McQueen, Kelemen, Dipple, Renforth and Wilcox2020). These carbonate minerals can then be chemically decomposed by heating to high temperatures, releasing CO2 to be purified, compressed and stored. OxL-DAC systems primarily use calcium- or magnesium-based oxides or hydroxides (e.g., lime (CaO, Ca(OH)2)), with the first commercial systems focusing on calcium given its availability, relative cost and ease of material handling. OxL-DAC which utilizes lime material for carbonation is hereafter referred to as ‘lime carbonation DAC’ (Figure 1). This process is analogous to calcium looping for carbon capture and storage (e.g., Abanades et al., Reference Abanades, Alonso, Rodríguez, González, Grasa and Murillo2009), but operates at ambient temperatures within the carbonation step.
Simplified process flow diagram for lime carbonation DAC.

 $$ \mathrm{C}\mathrm{a}\mathrm{r}\mathrm{b}\mathrm{o}\mathrm{n}\mathrm{a}\mathrm{t}\mathrm{i}\mathrm{o}\mathrm{n}:\hskip0.6em Ca{(OH)}_{2\ (s)}+{CO}_{2\ (g)}\to {CaCO}_{3\ (s)}+{H}_2{O}_{(g/l)} $$
 $$ \mathrm{C}\mathrm{a}\mathrm{l}\mathrm{c}\mathrm{i}\mathrm{n}\mathrm{a}\mathrm{t}\mathrm{i}\mathrm{o}\mathrm{n}:\hskip0.6em {CaCO}_{3\ (s)}+heat\to {CaO}_{(s)}+{CO}_{2\ (g)} $$
 $$ \hskip-2.8em \mathrm{H}\mathrm{y}\mathrm{d}\mathrm{r}\mathrm{a}\mathrm{t}\mathrm{i}\mathrm{o}\mathrm{n}:\hskip0.6em {CaO}_{(s)}+{H}_2{O}_{(g/l)}\to Ca{(OH)}_{2\ (s)} $$
Often, calcium hydroxide (Ca(OH)2) is utilized as the carbonating source instead of calcium oxide (CaO) (Reactions 1–3), as this results in higher carbonation extents (Dostie et al., Reference Dostie, Rausis and Power2024; Hawrot and Renforth, Reference Hawrot and Renforth2025). However, Ca(OH)2 is not found naturally in large quantities; it is instead a manufactured product generated through the calcination of calcium carbonate (CaCO3) into CaO, followed by hydration.
In a lime carbonation DAC system, the carbonation reaction constitutes the point at which CO2 is removed from the atmosphere, and thus its quantification is critical for proper monitoring (or measuring), reporting and verification (MRV) of generated carbon credits. For closed-loop lime carbonation DAC systems (Figure 1), the CO2 quantity leaving the kiln post-calcination is equal to the CO2 removed from the atmosphere (less any oxidized fossil carbon added to the kiln as a source of energy). The mass flow of this concentrated CO2 stream is relatively straightforward to measure. However, given that some lime will be lost or become ineffective, requiring the introduction of fresh limestone into the process and that potential variability of carbon contents in fuels used for calcination must be considered, the ambiguity in this mass balance suggests that a robust MRV protocol for lime carbonation DAC systems must include the measurement of carbonation. In addition to MRV, practitioners should monitor carbonation to understand and optimize their process operating efficiency. Particularly, achieving maximum carbonation extents in the shortest time is desirable (Hawrot and Renforth, Reference Hawrot and Renforth2025) and thus material carbonation extents must be measured throughout the process.
Currently, there is not a standardized MRV protocol specific to lime carbonation DAC which has been made publicly available, although Isometric (2025) provides a generalized MRV protocol applicable to all types of DAC, outlining a detailed carbon credit calculation approach, a DAC system boundary definition, and further discussion of durable CO2 storage options useful for performing the necessary carbon accounting for a DAC system. However, this protocol does not suggest methods for measuring CO2 removal (in the form of CaCO3 production) during carbonation. Advances to the measurement/monitoring component of MRV can be made for lime carbonation DAC by verifying the accuracy and precision of well-known carbonate content measurement techniques as applied to measuring carbonates in material representative of that exhibited by carbonation-stage material in a lime carbonation DAC system.
In this work, methods for carbonate content measurement are systematically evaluated, comparing key performance indicators including accuracy, precision, cost and sample analysis throughput, forming the basis for the development of a standard operating procedure (SOP) for each of the considered techniques. While this manuscript focuses on materials produced from lime carbonation DAC, the presented results may also be useful, although not directly comparable, to the wider study of carbonation of alkaline materials, including calcium looping or other Ca(OH)2-based carbon capture and storage (CCS) systems (e.g., Bortuzzo et al., Reference Bortuzzo, Bertagna, Braidotti and Bucci2025).
Carbonate content of natural soils and sediments can be quantified using several methods (e.g., calcimetry, thermogravimetry), which are generally accepted to yield reliable and accurate results; however, their application to samples with high Ca(OH)2 content has not been assessed. Additionally, as soils and sediments do not generally exhibit high (70–100%) carbonate contents which are displayed at the ‘end’ of the carbonation stage of lime carbonation DAC, it is necessary to assess the accuracy and precision of accepted carbonate content measurement methods under the condition of high CaCO3 presence. Methods for measuring carbonate contents in soils and sediments have been explored and compared (Fu et al., Reference Fu, Jian, Zhang and Shang2020) and may guide the development of measurement protocols used to monitor the progress of lime carbonation. However, differences in material composition between soils/sediments and samples taken from lime carbonation plots may cause issues in maintaining established accuracies and precisions for measurement protocols developed for and tested on soils/sediments specifically, as differences in carbonate composition have been shown as a major factor influencing the accuracy of carbonate content measurement techniques (Fu et al., Reference Fu, Jian, Zhang and Shang2020).
The techniques chosen for study by this work (see Table S1 in the Supplementary Material) have been selected for their potential applicability to measure the carbonate content of solid samples containing almost solely CaCO3 and Ca(OH)2, representative of samples taken during the carbonation stage of lime carbonation DAC. Hereafter, for simplicity, the combination of the set method run on a specific CaCO3 quantification instrument is referred to as an ‘analysis technique.’
Methods
Sample preparation
A set of experimental samples with known amounts of CaCO3 and Ca(OH)2 (see Table S2 in the Supplementary Material), typical of material present in a lime carbonation DAC system, was prepared to test the performance of five analysis techniques for CaCO3 content quantification.
In this work, carbonate content is defined as the molar ratio between the moles of solid CaCO3 present in a given sample and the total moles of material, as outlined by Equation (1). Quantification of carbonate content by Equation (1) applies to this study due to the high purity level of the CaCO3 and Ca(OH)2 used and that these are the only chemical species present in the analyzed samples:
 $$ carbonate\ content\hskip2pt (\%)={n}_{CaCO_3}\times 100\ /({n}_{CaCO_3}+{n}_{Ca(OH{)}_2})\ \ . $$
The measurement of moles of Ca(OH)2 was not taken directly by any of the following analysis techniques, even when direct measurement might have been possible. For consistency, this metric was determined stoichiometrically by Equation (2):
 $$ {n}_{Ca{(OH)}_2}=({m}_{sample,\ initial}-{m}_{CaCO_3,\ measured})/{MW}_{Ca{(OH)}_2}, $$
where nCaCO3 is the moles of CaCO3, nCa(OH)2 is the moles of Ca(OH)2, msample, initial is the mass (g) of the sample prior to analysis, mCaCO3, measured is the mass (g) of CaCO3 measured within the sample, and MWCa(OH)2 is the molecular weight (g/mol) of Ca(OH)2.
Sample batches containing a range of molar carbonate contents (0%, 10%, 20%, 40%, 75% and 100%, defined by Equation (1)), were prepared by mixing specified amounts of high purity CaCO3 (99.95–100.05%, Thermo Fisher) and Ca(OH)2 (99.995%, Thermo Fisher) (see Table S2 in the Supplementary Material).
Methods for the five analysis techniques are outlined below. Ten samples from each of the six molar carbonate compositions were analyzed by each of the five analysis techniques. Each of the six carbonate compositions was prepared individually for each of the five analysis techniques to minimize time between sample preparation and analysis and avoid Ca(OH)2 carbonation prior to analysis. Each of the six carbonate compositions for each of the five analysis techniques was prepared in duplicate to allow for the verification of sample preparation accuracy by analyzing half of the required samples from each batch.
Loss on ignition
Loss on ignition (LOI) measurements were performed using a muffle furnace (Carbolite Gero CWF11/5, manufactured in the UK, samples run at Heriot-Watt University), undertaken in two stages (Coats and Redfern, Reference Coats and Redfern1963; Campbell et al., Reference Campbell, Bastianini, Buckman, Bullock, Foteinis, Furey, Hamilton, Harrington, Hawrot, Holdship, Knapp, Maesano, Mayes, Pogge von Strandmann, Reershemius, Rosair, Sturgeon, Turvey, Wilson and Renforth2023; Hawrot, Reference Hawrot2024). In the first stage, 2 g ± 0.05 g of samples were transferred to porcelain crucibles, covered with a porcelain lid and heated to 520°C (heating ramp speed of 30°C/min, isothermal for 4 h). Samples were then cooled to ~250°C, removed from the furnace, cooled further in ambient conditions for 3–5 min, then weighed.
In the second heating stage, samples and crucibles were placed back into the furnace and heated to 1100°C (heating ramp speed of 30°C/min, isothermal for 9 h), facilitating the decomposition of CaCO3 according to Reaction 2. Samples were then cooled to ~250°C, removed from the furnace, cooled in ambient air for 3–5 min and weighed. All masses were recorded to one-thousandth of a gram. One standard of 99% CaCO3 was run for every 10 samples for internal calibration.
Weight measurements before and after each heating stage can be taken in conjunction with the stoichiometric relations of Reaction 2 to determine the mass (g) of CaCO3 (mCaCO3) in a given sample (Equation (3)). Equation (4) is used to calculate the mass (g) of CaCO3 in the standard (mst, CaCO3) to determine the deviation of the standard measured CaCO3 value from the standard actual CaCO3 value (Est) (Equation (5)), which is then used to determine the moles of CaCO3 present in the material (nCaCO3) (Equation (6)). Equations (1) and (2) were then used to determine the molar carbonate content (%) in each sample:
 $$ {m}_{CaC{O}_3}=({m}_{stage1}-{m}_{stage2})\times {MW}_{CaC{O}_3}\ /\ {MW}_{C{O}_2}, $$
 $$ {m}_{st,\ {CaCO}_3}=({m}_{st,\ stage1}-{m}_{st,\ stage2})\times {MW}_{CaC{O}_3}\ /\ {MW}_{C{O}_2}, $$
 $$ {E}_{st}=({m}_{ex,\ {CaCO}_3}-{m}_{st,\ {CaCO}_3})\ /\ {m}_{ex,\ {CaCO}_3}, $$
 $$ {n}_{CaC{O}_3}=({E}_{st}+{m}_{CaC{O}_3})\ /\ {MW}_{CaC{O}_3}, $$
where mstage1 is the mass (g) of the sample after stage 1 heating, mstage2 is the mass (g) of the sample after stage 2 heating, mst, stage1 is the mass (g) of the standard after stage 1 heating, mst, stage2 is the mass (g) of the standard after stage 2 heating, MWCO2 is the molecular weight (g/mol) of CO2, MWCaCO3 is the molecular weight (g/mol) of CaCO3 and mex, CaCO3 is the expected mass (g) of CaCO3 in the standard.
Thermogravimetric analysis
Thermogravimetric analysis (Coats and Redfern, Reference Coats and Redfern1963; Campbell et al., Reference Campbell, Bastianini, Buckman, Bullock, Foteinis, Furey, Hamilton, Harrington, Hawrot, Holdship, Knapp, Maesano, Mayes, Pogge von Strandmann, Reershemius, Rosair, Sturgeon, Turvey, Wilson and Renforth2023) (Discovery TGA 5500, manufactured in the USA/Germany, samples run at Heriot-Watt University) was carried out under an ~100% N2 atmosphere (flow at 25 mL/min) to inhibit carbonation during low temperature heating stages of the analysis. To ensure a completely inert environment, a blank run was conducted prior to the analysis of each sample set (approximately every 10 samples) to flush the system with N2. A temperature ramp of 8°C/min (balance flow at 10 mL/min) was used to heat from 25°C to 1000°C, after which the run was terminated. Samples were prepared and loaded into the analyzer immediately before analysis (avoiding the use of an auto-sampler) to minimize any risk of Ca(OH)2 carbonation prior to analysis. Moles of CaCO3 in the sample (nCaCO3) were calculated using Equation (7). Equations (1) and (2) were then used to determine the molar carbonate content (%) in each sample:
 $$ {n}_{CaCO_3}=\left({m}_{start,\hskip2pt decomposition\hskip2pt -\hskip2pt }{m}_{end,\hskip2pt decomposition}\right)/{MW}_{CO_2}, $$
where mstart, decomposition and mend, decomposition are the sample masses (g) at the beginning and end of CaCO3 thermal decomposition, respectively, as identified by distinct weight losses over time.
Volumetric calcimetry
The concentration of total carbonate content was determined using an Eijkelkamp calcimeter (manufactured in the Netherlands, samples run at Heriot-Watt University) (International Organization for Standardization, 1995). 0.3 g ± 0.001 g of sample was weighed out into a 200 mL Erlenmeyer flask. 20 mL of deionized water was transferred into the flask using a measuring pipette. 7 mL of 4 M HCl (prepared and supplied by Honeywell Chemicals) was transferred using a measuring pipette into a flat-bottomed glass test tube and placed upright into the flask using tweezers. The headspace in the flask was connected to the calcimeter via a tube passing through a rubber stopper. The reservoirs were lined up to the burette to obtain a start position and this value was recorded. The Erlenmeyer flask was gently tipped until the acid completely emptied out of the test tube onto the sample and the flask was gently agitated for 30 s to assist the reaction. When the reading on the burette remained stable, a reading was taken. This method was calibrated using 0.2 g and 0.4 g of analytical grade CaCO3 and two blank runs per sample. Moles of CaCO3 (nCaCO3) present in the sample were determined using Equation (8). Equations (1) and (2) were then used to determine the molar carbonate content (%) in each sample:
 $$ {n}_{CaC{O}_3}=({m}_2 \times ({V}_1-{V}_3))\ /({MW}_{CaC{O}_3} \times ({V}_2-{V}_3)), $$
where m2 is the mean mass (g) of the two calibration standards, V1 is the volume (mL) of CO2 produced by the sample reaction, V2 is the mean volume (mL) of CO2 produced by the standards’ reactions, V3 is the volume (mL) change in the blank runs and MWCaCO3 is the molar mass (g/mol) of CaCO3.
Combustion analysis of carbon via infrared absorption
A LECO RC612 (manufactured in the USA, samples run at Newcastle University) was used to quantify carbonate content in samples through combustion analysis of carbon via infrared absorption (CAC-IR) (International Organization for Standardization, 2000). Samples of 0.150 g ± 0.001 g were prepared in ceramic crucibles using an analytical balance and loaded on the autosampler attached to the instrument. While the autosampler was used to hold samples prior to analysis, samples were prepared and loaded onto the autosampler immediately before analysis to minimize any risk of Ca(OH)2 carbonation, a potential contribution to error. By this method, samples were exposed to ambient air for a maximum of 6 min prior to analysis. The furnace method was run as ‘Synthetic/Blanks’ to hold the furnace temperature constant at 1000°C for the analysis of the entire sample set. For all standards and samples analyzed, the method was set to ‘Soils, Rocks and Shale’ and an analysis time of 200 s was used to ensure complete calcination of CaCO3 present in the samples.
Prior to the start of sample analysis, five blank crucible runs were conducted to ensure there was no carbon present within the system and no false detection of carbon by the internal NDIR cell. A calibration curve was then established by running a total of 12 calibration standards of 99% CaCO3 with weights ranging from 0.05 g to 0.30 g in 0.05 g increments, each in duplicate. Using the intensity signals received by the infrared cell from these standard runs, a calibration was developed automatically by the instrument’s software and its accuracy and precision verified by running three additional 99% CaCO3 standards with weights of 0.15 g. The carbon ratio measured from these drift standards should be 12.0006% ± 0.050% C, otherwise, the calibration should be repeated.
A drift standard of 99% CaCO3 was run once every 10 samples and verified to be within the aforementioned range. Moles of CaCO3 (nCaCO3) were determined using Equation (10). Equations (1) and (2) were then used to determine the molar carbonate content (%) in each sample:
 $$ TCR={m}_{carbon}\ /\ {m}_{sample,\ initial}, $$
 $$ {n}_{CaC{O}_3}=TCR \times {m}_{sample,\ initial}\ /\ {MW}_{carbon}, $$
where the total carbon ratio (TCR) (Equation (9)) is represented by mcarbon/msample, initial and is provided as an analysis output from each sample run, msample, initial is the initial mass (g) of the sample used to determine the mass (g) of carbon detected by NDIR (mcarbon) and MWcarbon is the molecular weight (g/mol) of carbon.
Fourier transform infrared spectroscopy
A PerkinElmer Frontier Fourier transform infrared (FTIR) spectrometer (manufactured in the USA, samples run at Heriot-Watt University) was used to determine the amount of CaCO3 present in a sample (Reig et al., Reference Reig, Gimeno-Adelantado and Moreno2002; Khachani et al., Reference Khachani, El Hamidi, Halim and Arsalane2014; Veerasingam and Venkatachalapathy, Reference Veerasingam and Venkatachalapathy2014; Campbell et al., Reference Campbell, Bastianini, Buckman, Bullock, Foteinis, Furey, Hamilton, Harrington, Hawrot, Holdship, Knapp, Maesano, Mayes, Pogge von Strandmann, Reershemius, Rosair, Sturgeon, Turvey, Wilson and Renforth2023). IR absorbance spectra of CaCO3 are known to present peaks at 875 cm−1 and 712 cm−1, while a notable peak at 3,642 cm−1 is observed in the presence of Ca(OH)2. Samples derived from the mixing device were of satisfactory size and did not require additional comminution. ~0.1 g of sample was transferred into the sample port of the instrument, exposed to the crystal and then scanned from 4000 to 600 cm−1 in 10 scans.
Absorbance spectra for each sample were obtained. To quantify the amount of CaCO3 present, a calibration curve was developed using 98% Ca(OH)2 and 99% CaCO3. Calibration standards with molar CaCO3 contents of 0%, 15%, 50%, 85% and 100% were prepared using the sample preparation protocol. Five samples from each composition were analyzed via FTIR and their absorbances at 712 cm−1 and 3642 cm−1 were recorded. A calibration curve (R 2 = 0.989) was created by plotting the ratios of absorbances at these peaks against the known molar carbonate contents of the calibration standards (see Figure S1 in the Supplementary Material) and presented by Equation (11):
 $$ carbonate\ content\hskip2pt (\%)= - \mathrm{ln}\hskip2pt (F\ /\ 6.49)\ /\ 0.0479, $$
 $$ F={A}_{3642}\ /\ {A}_{712}, $$
where F is a unitless ratio, A3642 is the absorbance at the 3,642 cm−1 peak and A712 is the absorbance at the 712 cm−1 peak.
Technoeconomic assessment and multi-criteria analysis
A bottom-up technoeconomic assessment was undertaken, in which the capital expenditure ($2024, ‘CAPEX’) and operating expenditures ($2024, ‘OPEX’) were derived for each analysis technique (see Tables S3 and S4 and Equations (S1)–(S6) in the Supplementary Material). Net present value (NPV) for each analysis technique for the analysis of Ncumulative samples over a 10-year service life at an analysis demand of N samples per year (90,000 for the high base case and 10,000 for the low base case) was calculated for the United States and presented in dollars for a 2024 base year. Levelized cost (LC) was then calculated according to Equation (13):
 $$ LC=NPV\ /\ {N}_{cumulative}\ \ . $$
A multi-criteria analysis of accuracy, precision, sample throughput and levelized cost (high sample-demand scenario) for the five studied techniques was conducted to provide a comprehensive view of their performance across the four critical factors. A range of values for each of the four factors was determined independently and divided into 5 even sub-ranges (see Table S5 in the Supplementary Material). Each subrange was assigned a corresponding ‘score’, 1–5, with a score of ‘5’ representing the highest sample throughput, precision, and accuracy and the lowest levelized cost (i.e., ‘5’ represents the most optimal values for each of the factors).
Results
Measurement performance of analysis techniques for CaCO3 quantification
Overall, LOI and CAC-IR presented the highest accuracy of the five analysis techniques, while LOI and TGA presented the highest precision.
‘Measurement error’ is defined as the difference between the molar carbonate content (%) measured in the sample, and the actual molar carbonate content (%) of the prepared sample batch from which the individual sample was taken (Figure 2). This metric was used in the following analysis because it provides a standardized representation of measured carbonate content, enabling comparisons between samples with differing carbonate contents.
Measurement error versus molar carbonate content for each analysis technique. Measurement error is the difference between the measured molar carbonate content (%) in the sample and the actual molar carbonate content (%) of the prepared sample batch from which the individual sample was taken.

The result of z-score calculations (see Table S6 in the Supplementary Material) relating the measurement error mean to the measurement error standard deviation for each carbonate content and analysis technique combination identified a statistically significant difference between the mean of the measurement error data and a mean of 0 measurement error for the following instances: LOI when only one analyte was present (0% carbonate content (Ca(OH)2 only) and 100% carbonate content (CaCO3 only)), TGA at all carbonate contents in which Ca(OH)2 was present (0%, 10%, 20%, 40% and 75%), volumetric calcimetry at carbonate contents with low amounts of CaCO3 (0% and 10%), CAC-IR at 0%, 10% and 40% carbonate content, and for FTIR at carbonate contents with medium amounts of CaCO3 (20% and 40%).
Buyers of carbon credits and investors in CDR technologies may generally accept an error for carbon credit quantification accuracy within ±1–5% to ensure accurate technology performance tracking and instill trust in the integrity of purchased goods (Climate Action Reserve, 2021). Thus, to ensure correct calculations of carbon credits generated by lime carbonation DAC systems, ±3% has been identified as an acceptable limit of error for carbonate content measurement accuracy. Figure 3 relates the actual molar carbonate content (%) of the prepared sample batch from which each individual sample was taken to the mean measured molar carbonate content (%) calculated over 10 replicate samples, and identifies the mean measured values that fall within the accepted ±3% error range.
Comparison between actual molar carbonate content and mean measured molar carbonate content for (A) low (0–10%), (B) medium (20–40%) and (C) high (75–100%) molar carbonate content ranges. The dotted grey lines show a linear, 1:1 relationship between actual values and mean measured values. The shaded grey areas represent mean measured values within ±3% of actual values.

LOI and CAC-IR measured within ±3% of actual carbonate content values for every carbonate content studied across a mean of 10 replicate samples. Volumetric calcimetry and FTIR means did not measure within ±3% of actual values at any carbonate content, while TGA maintained mean measurements within this range for 0% and 100% carbonate contents only. Analyzing 10 replicate samples per data point increases the probability that the mean of these 10 samples falls within ±3%. However, a sample size of 10 may be unrealistic in practice. The probability (confidence) that an individual sample measurement taken for a specific carbonate content by each analysis technique will provide a measurement error within ±3% of 0 was calculated (see Table S7 in the Supplementary Material). High (>90%) confidence in an individual sample presenting a measurement error within ±3% of 0 was identified for: LOI for all carbonate contents, TGA for samples containing only CaCO3 (100% carbonate content), CAC-IR for carbonate contents with low to low-medium (0%, 10% and 20%) carbonate contents, and never for volumetric calcimetry or FTIR.
Technoeconomic assessment of analysis techniques for CaCO3 quantification
Accuracy and precision of an analysis technique alone are not the sole considerations for a company’s or institution’s decision regarding which analysis technique is most suitable for their purposes. Levelized costs of each analysis technique under high (90,000 per year) and low (10,000 per year) sample demand were calculated (see Table S8 in the Supplementary Material).
Multi-criteria evaluation of analysis techniques for CaCO3 quantification
Figure 4 shows the results of the multi-criteria comparison between the considered analysis techniques for CaCO3 quantification regarding four critical factors: accuracy, precision, sample throughput and levelized cost (high sample demand).
A multi-criteria evaluation of four critical factors for each analysis technique was determined based on an unweighted scoring system.

The confidence in the error of carbonate content measurements being within ±3% of 0 by each analysis technique was averaged across all carbonate contents. This average confidence represents the accuracy of the analysis technique. Average range values were calculated for each analysis technique across all carbonate contents, representing the precision of each analysis technique. Levelized cost values were taken for the high sample demand (90,000 samples/year) scenario. Values for each of the four critical factors were compiled and assigned scores (out of 5), then averaged across the four factors, presenting total scores both unweighted and weighted for accuracy and precision (see Table S9 in the Supplementary Material).
Given an even categorical weight, LOI and CAC-IR score comparably, presenting the highest average scores of the analysis techniques studied. However, with greater weighting on accuracy and precision, LOI surpasses the others. The methodological spread represented in Figure 4 suggests there is value in assessing priorities (accuracy, precision, cost, time) prior to selecting an analysis technique.
Discussion
High accuracy is critical to providing reputable and verifiable quantification of carbon credits from lime carbonation DAC processes, as measurements of carbonate content with an error beyond ±3% (as shown by Figure 3) at gigatonne-scale plant operation necessary for impactful CDR translate to an error on the order of tens of megatonnes of CO2 removed and billions of dollars of under or oversold credits. LOI and CAC-IR were presented as the most accurate techniques, achieving scores of 5 out of 5. High precision is crucial to the integrity of carbon credits generated by lime carbonation DAC, given that a precautionary approach to risk would require higher uncertainty within results to be compensated through an insurance (e.g., a buffer pool). LOI achieved the highest precision, scoring 5 out of 5. Discussions of potential uncertainties and errors for each of the five analysis techniques can be found in Section 7.1 of the Supplementary Material. High sample throughput is essential for timely sample analysis, as even with proper storage of samples prior to analysis, if samples are left for a long time between collection and analysis, moisture and CO2 may continue to be absorbed by samples, resulting in changes in sample composition and inaccurate measurements of total CO2 removal. Erroneous understandings of optimized process engineering, plant design, and system technoeconomics and other time considerations, such as funding opportunity deadlines for academic groups and investor demands for startup companies, as well as the overall need for significant CDR to be completed over the next 25 years, may result from slow sample analysis, promoting the requirement for high sample throughput. FTIR reached a score of 5 out of 5 in terms of sample throughput. Low-levelized cost of analysis is necessary for both academic and industry groups studying and building out lime carbonation DAC processes, as limited revenue for startups and the reliance of academic institutions on external funding require cost-efficient methods of analysis. Thus, a low-cost analysis technique is desirable if accuracy, precision and sample throughput are not compromised. Contributions to levelized cost for each analysis technique and potential strategies for cost reduction are discussed in Section 7.2 of the Supplementary Material. LOI and FTIR achieved the lowest levelized cost at the high sample throughput scenario, scoring 5 out of 5. Overall, LOI and CAC-IR achieved the highest average scores, though LOI presented the highest score when accuracy and precision were prioritized.
All four considered factors contribute significantly to the MRV of carbon credits generated by lime carbonation DAC and highlight the significance of using a well-rounded (accurate, precise, fast and low-cost) analysis technique. However, there are other factors which may influence the decision of a company/institution regarding which analysis technique provides the ‘best’ fit for monitoring a specific system. These factors (sample size, capacity for simultaneous moisture measurements, impurities, outsourcing sample analysis as opposed to purchasing equipment for analysis in-house) are discussed in Section 8 of the Supplementary Material but were determined to lie outside the scope of this study.
While this study does not prescribe a single SOP for measuring/monitoring the progress of lime carbonation DAC systems, these findings lay the groundwork for future SOP development. An SOP for carbonate quantification in lime carbonation DAC should include standardized procedures for sampling, analysis, calibration and reporting. Crucially, the choice of analysis technique should not be based on accuracy and precision alone. Different techniques may have specific constraints, such as required sample size, available equipment, total costs or processing time, which influence which method is most suitable. For example, a technique such as LOI that is destructive and requires a relatively large sample may not be appropriate for all systems, even if it offers high accuracy. These considerations should be evaluated on a case-by-case basis. To support this, we recommend that an SOP include justification that guides users in selecting appropriate methods based on the needs and limitations of their technology. Defining these elements is a critical next step toward consistent and reliable measurement across the CDR sector.
The implications of these findings for the broader CDR space are significant, where inconsistent or poorly defined measurement methods could lead to systematic over- or under-reporting of CO₂ removal. This, at scale, could lead to incorrect awarding of carbon credits and could undermine confidence in lime carbonation DAC as a reliable CDR pathway. By moving toward shared SOPs and transparent reporting, the sector can ensure higher data integrity, better comparability between technologies and stronger foundations for MRV systems, policy integration and market acceptance.
Conclusions
Robust systems of measurement are needed to establish confidence in lime carbonation DAC as a CDR technique and to promote the integrity of carbon credits produced by these processes. The generation and sale of carbon credits on carbon markets provides one of the few economically feasible ways to remove atmospheric CO2 to contribute to mitigating climate change. However, carbon markets will only continue to develop if carbon credits, as the product to be bought and sold, can be verified to the satisfaction of buyers, policymakers, the scientific community, and the public. As carbon credit verification begins with accurate measurements of CO2 removed from the atmosphere by a system, presenting methods for providing accurate and precise measurements of CO2 uptake into CaCO3 within a lime carbonation DAC system was the focus of this study.
This work provides a systematic comparison of five methods for carbonate content quantification for material from a lime carbonation DAC system. Accuracy for LOI was high, presenting a 98% mean confidence in measurement error being within ±3% of 0 across all carbonate contents. CAC-IR and TGA presented medium confidence (accuracy) (86% and 51%, respectively) in measurement error being within the desired range across all carbonate contents, while confidence was low for volumetric calcimetry and FTIR (26% and 14%, respectively). LOI also presented the highest precision (lowest data range (2.5) averaged across all carbonate contents) while the precision of TGA and CAC-IR was also high (average ranges of 3.4 and 3.7, respectively).
The levelized cost of analysis ranged from $1.8 to $16.5 for the high sample demand (90,000 samples/year) scenario, with the lowest per sample costs returned for FTIR and LOI ($1.8 and $2.2, respectively).
A multi-criteria scoring system based on accuracy and precision, sample throughput, and levelized cost showed that LOI and CAC-IR were the most well-rounded CaCO3 analysis techniques, each presenting an average score of 4.3 out of 5. When the scoring system was weighted for accuracy and precision, LOI presented the highest average score (4.7 out of 5), although if the factors were unequally weighted, given different priorities and levels of weight, it is possible that each technique would outcompete the others for at least one category.
The results of this study are impactful to the measuring/monitoring sector of MRV for lime carbonation DAC, as they establish the influence of analysis technique on CaCO3 quantification accuracy. As discrepancies in CaCO3 measurements outside of a ±3% error range represent underestimation or overestimation of CO2 removed from the atmosphere on the order of tens of megatonnes, the results of this work presents the importance of highlighting reliable and verifiable CaCO3 analysis techniques which should be used to monitor and measure CO2 removal via carbonation at various points throughout a lime carbonation DAC process to provide checks on final quantification and ensure technology optimization.
Open peer review
To view the open peer review materials for this article, please visit https://doi.org/10.1017/cat.2026.10010.
Supplementary material
The supplementary material for this article can be found at http://doi.org/10.1017/cat.2026.10010.
Data availability statement
The data that support the findings of this study are available from the corresponding author, A.T., upon reasonable request.
Acknowledgements
The authors would like to thank Dr. Sean Higgins, Dr. Kirsty Harrington, and Rachel Millar for laboratory support and guidance, as well as Dr. Cijo Xavier for his contribution to the CAC-IR analysis and method determination.
Author contribution
Conceptualization: A.T., O.H., J.S.; Data curation: A.T., O.H., J.S.; Formal analysis: A.T., O.H., J.S., P.R.; Funding acquisition: P.R.; Investigation: A.T.; Methodology: A.T., O.H., J.S.; Project administration: A.T.; Resources: P.R.; Supervision: J.S.C., P.R.; Validation: A.T.; Visualization: A.T.; Writing – original draft: A.T., O.H., J.S., P.R.; Writing – review and editing: A.T., O.H., J.S., J.S.C., P.R.
Financial support
A.T.’s studentship was supported through a James Watt Scholarship scheme at Heriot-Watt University. Origen Carbon are thanked for their contribution to A.T.’s studentship.
Competing interests
A.T. reports a relationship with Origen Carbon Ltd that includes funding grants. O.H. reports a relationship with Seabound Carbon Ltd that includes: employment and equity or stocks. J.S. reports a relationship with Origen Carbon Ltd that includes employment. O.H. has patent #PCT/GB2024/052496 pending to Origen Carbon Ltd. J.S. has patent #PCT/GB2024/052496 pending to Origen Carbon Ltd. P.R. has patent #US20220347650A1 pending to University of British Columbia, Columbia University in the City of New York, University of Pennsylvania. The remaining author declares none.


 Open access
Comments
Dear the Editors of Cambridge Prisms: Carbon Technologies:
Please find attached a manuscript to be considered for publication in the special issue: Innovations in Carbon Dioxide Removal.
This report is the first to demonstrate that the choice of analytical technique for quantifying CaCO3 content significantly affects estimates of atmospheric CO2 removal via lime carbonation. This work compares the accuracy and precision of five analysis techniques for CaCO3 quantification and provides a technoeconomic assessment evaluating levelized costs under two scenarios.
This work advances monitoring/measuring, reporting and verification (MRV) frameworks for carbon credits generated by mineralization-based direct air capture (e.g., McQueen et al., 2020, Nature Communications, https://doi.org/10.1038/s41467-020-16510-3). Its findings contribute to the measuring/monitoring component of MRV for lime carbonation DAC, ensuring accurate CO2 removal / carbon credit quantification integral to technological development and establishing integrity within the carbon market.
Direct air capture has gained considerable recent attention within and beyond the CDR community, with MRV for large-scale systems receiving notable enthusiasm and scrutiny. We believe this report will be of interest to the readers of Cambridge Prisms: Carbon Technologies and particularly this special issue on Innovations in Carbon Dioxide Removal, as it neatly ties together the science behind measuring atmospheric CO2 removal by mineralization-based direct air capture and the subsequent monetary impact this has on system development.
Please do get in touch if anything further is needed. I look forward to hearing from you at your earliest convenience.
Yours Truly,
Aimee Titche