

Introduction
Intrauterine growth restriction (IUGR) is a major concern both in human and animal (Dong et al., Reference Dong, Zhong and He2016). Pigs are multifetal animals and exhibit serious IUGR occurrence, which can be as high as 15–20%, and often used as a model for human IUGR studies (Anderson and Parker Reference Anderson and Parker1976; Ma et al., Reference Ma, Tao and Song2024; Niu et al., Reference Niu, Zhao and He2021). IUGR exerts profound detrimental effects on neonatal survival, postnatal development, immune function, and long-term health (Wu et al., Reference Wu, Bazer and Datta2008; Xiao et al., Reference Xiao, Zou and Li2022). In particular, IUGR can bring a series of adverse consequences to piglets, culminating in poorer survival rates, attenuated growth, and developmental impairments in various organs (Oksbjerg et al., Reference Oksbjerg, Nissen and Therkildsen2013; Wu et al., Reference Wu, Bazer and Wallace2006). Therefore, IUGR has attracted increasing attention in animal production (Ferenc et al., Reference Ferenc, Pilżys and Skrzypek2017).
Exosomes are nanosized (30–150 nm) membrane vesicles secreted by living cells and are widely distributed in tissues and biological fluids, including blood, saliva, urine, and breast milk (Théry et al., Reference Théry, Zitvogel and Amigorena2002). Their function as key mediators of intercellular communication, modulating a variety of biological processes through the transfer of molecular cargo such as microRNAs (miRNAs), proteins, and lipids (Fang et al., Reference Fang, Lv and Lv2018). Increasing evidence has revealed their involvement in diverse physiological and pathological processes, including cellular functions, immune responses, pregnancy, cardiovascular disease, central nervous system-related disorders, and cancer progression (Kalluri and LeBleu Reference Kalluri and LeBleu2020). Moreover, the promise of exosomes as diagnostic and therapeutic applications is being actively investigated for a wide spectrum of diseases (Sun et al., Reference Sun, Wang and Li2020; Zhou et al., Reference Zhou, Xie and Wang2020). However, it is still not well understood how serum exosomes function in the context of IUGR.
Among exosomal cargos, miRNAs exert profound effects on biological functions (Vicencio et al., Reference Vicencio, Yellon and Sivaraman2015). MiRNAs are conserved noncoding RNAs (19–25 nucleotides) that are highly conserved across species. Their functions are primarily to regulate gene expression through posttranscriptional mechanisms (Boon and Dimmeler Reference Boon and Dimmeler2015; Lu and Rothenberg Reference Lu and Rothenberg2018). Dysregulated exosomal miRNAs have been implicated in numerous pathologies and are increasingly recognized as both biomarkers and therapeutic targets (Ho et al., Reference Ho, Clark and Le2022; Mitchell et al., Reference Mitchell, Parkin and Kroh2008; Redell et al., Reference Redell, Moore and Ward2010). For example, umbilical cord plasma exosomal miRNAs represent promising diagnostic and management biomarkers for IUGR fetuses in lambs (Lu et al., Reference Lu, Li and Zheng2023). While these observations reveal that exosomal miRNAs are pivotal in IUGR, whether serum exosomal miRNAs contribute to IUGR pathogenesis remains largely unexplored.
The mammalian intestine harbors a complex microbial ecosystem, which plays essential roles in nutrient metabolism, intestinal morphology, immune regulation, and disease resistance (Buffie and Pamer Reference Buffie and Pamer2013; Zhu et al., 2024). In pigs, IUGR has been associated with alterations in fecal microbiota composition and metabolic profiles, suggesting that intestinal dysbiosis may contribute to impaired growth and health (Kamada et al., Reference Kamada, Seo and Chen2013). Emerging evidence indicates that the gut microbiota regulates host miRNA expression, suggesting a potential crosstalk between microbial dysbiosis and serum exosomal miRNAs in IUGR (Ambros Reference Ambros2001; Dalmasso et al., Reference Dalmasso, Nguyen and Yan2011; Li et al., Reference Li, Li and Zhu2018). However, this potential interplay remains poorly characterized.
In the present study, 15-day-old piglets were selected for this study because this age represents a convergence of two key developmental challenges: a critical period in immune system maturation and the clear manifestation of growth retardation in IUGR compared to normal birth weight (NBW) piglets, both crucial for long-term development (Lessard et al., Reference Lessard, Blais and Beaudoin2018). Therefore, we compared serum exosomal miRNAs and cecal microbiota between IUGR and NBW piglets to elucidate the association of serum exosomal miRNAs with IUGR and alterations in the gut microbiota of IUGR neonates. Our findings demonstrate that serum exosomal miRNAs exhibit potential as diagnostic biomarkers for IUGR and hold promise for informing therapeutic strategies.
Materials and methods
Experimental animals and tissue collection
All experiments were conducted in accordance with the guidelines of the Institutional Animal Care and Use Committee of the Jinhua Academy of Agricultural Sciences (Zhejiang Province, China). After screening, six sows that had similar litter sizes and met the selection criteria for IUGR were selected. The newborn piglets (Jinhua) that weighed within 0.5 standard deviation (SD) of the mean birth weight (BW) of the littermates were defined as NBW, whereas those with 2 SD lower BW were defined as IUGR (D’Inca et al., Reference D’Inca, Kloareg and Gras-Le Guen2010; Wang et al., Reference Wang, Huo and Shi2005). According to this criterion, one IUGR (0.85 ± 0.08 kg) and one NBW (1.63 ± 0.10 kg) male piglets were chosen from each sow. A total of six IUGR piglets and six NBW piglets were selected and divided into two groups. Piglets were fasted for 2 h before being euthanized. Blood was obtained through jugular venipuncture. For the purpose of exosome and miRNA analysis, the centrifugation conditions for the blood: 4°C, 1509×g, 10 min. Subsequently, the serum was frozen and stored at −80°C for subsequent experimental processing. Following euthanasia, intestinal segments (with luminal contents), heart, spleen, liver, and other organs were immediately harvested. These preserved samples were then archived at −80°C for subsequent molecular analyses. This study was conducted in accordance with a protocol by the Institutional Animal Care and Use Committee of the Zhejiang Academy of Agricultural Sciences (Approval No.: 2025SZD1B07).
Exosomes isolation
Exosomes were purified from the serum as previously described (Théry et al., Reference Théry, Amigorena and Raposo2006). All centrifugation steps were performed at 4°C. Specifically: (1) Samples were centrifuged at 2,000 × g for 20 min to remove particulate matter; (2) Supernatants were further centrifuged at 11,000 × g for 30 min to eliminate residual debris; (3) The supernatant was subsequently filtered through a 0.22-μm pore membrane (Millex GP); (4) Ultracentrifugation was carried out twice at 111,000 × g for 2 h each using an SW41T rotor (Beckman Coulter, USA). The resulting pellet was resuspended in phosphate-buffered saline (PBS) and stored at −80°C until analysis. For short-term storage prior to experiments, samples were kept at −4°C in PBS. The isolated exosomes were characterized by transmission electron microscopy (TEM) and nanoparticle tracking analysis (NTA).
16S rRNA sequence analysis
Extraction of genomic DNA from cecal contents was carried out employing the E.Z.N.A. Soil DNA Kit (Omega Bio-tek, Norcross, GA, USA). PCR amplification targeting the hypervariable V3-V4 region of the 16S rRNA gene was carried out on the DNA samples, employing the primer pair 338F(5′-ACTCCTACGGGAGGCAGCA-3′)/806R(5′-GGACTACHVGGGTWTCTAAT-3′). The integrity of the PCR products was verified by electrophoresis on a 1.8% agarose gel. We constructed small fragment libraries which were subsequently subjected to paired-end sequencing on an Illumina Nova Seq instrument (Illumina, USA). The sequencing service was provided by LC-Bio Technology Co., Ltd. (Hangzhou, China).
Small RNA sequencing analysis
Small RNA and mRNA sequencing was performed by LC Sciences (Hangzhou, China) on an Illumina HiSeq 2500 platform. For the prediction of miRNA target binding sites, the TargetScan (v6.0) and miRanda (v3.3a) algorithms were employed (Ma et al., Reference Ma, Lyu and Song2023).
Statistical analysis
Statistical significance between the IUGR and NBW piglets were defined as p < 0.05. Correlations among microbiota, Species Distribution Models, and body weight (BW) were evaluated using Spearman’s correlation coefficient. Data are expressed as mean ± SEM. Analyses were performed with SPSS 26.0 (SPSS Inc., Chicago, IL, USA), and visualizations were generated using R packages (ggplot2 v3.3.5) and GraphPad Prism v9.5 (San Diego, CA, USA).
Results
Impaired growth and organ development in IUGR piglets
To compare the growth status between groups, the average weights of IUGR and NBW piglets were 3.23 ± 0.33 and 5.33 ± 1.37 kg, respectively (Fig. 1A). Moreover, among IUGR piglets, morphometric analysis revealed that jejunal and ileal lengths were significantly shorter than NBW piglets, and there were no significant differences in their duodenum, cecum, colon, and rectum lengths (Fig. 1B-G). In addition, IUGR piglets exhibited significantly lower heart, liver, and kidney weights than NBW piglets, whereas the spleen was not significant difference (Fig. 1H-K). Additionally, no differences were found in the heart, liver, kidney, and spleen index (Fig. 1L-O). These results indicate that IUGR causes severe impairments in postnatal growth and organ development.
Differences in organ growth and development between the IUGR and NBW piglets. (A) Body weight of the IUGR and NBW piglets; (B–G) Duodenal, jejunum, ileum, cecum, colon, and rectal lengths of the IUGR and NBW piglets; (H–K) Heart, spleen, liver, and kidney weights of the IUGR and NBW piglets; (L–O) Heart, Spleen, Liver and Kidney indices of the IUGR and NBW piglets. The data are presented as the means ± SEMs, n = 6; *p < 0.05, **p < 0.01.

Gut microbiota dysbiosis and functional alterations in IUGR piglets
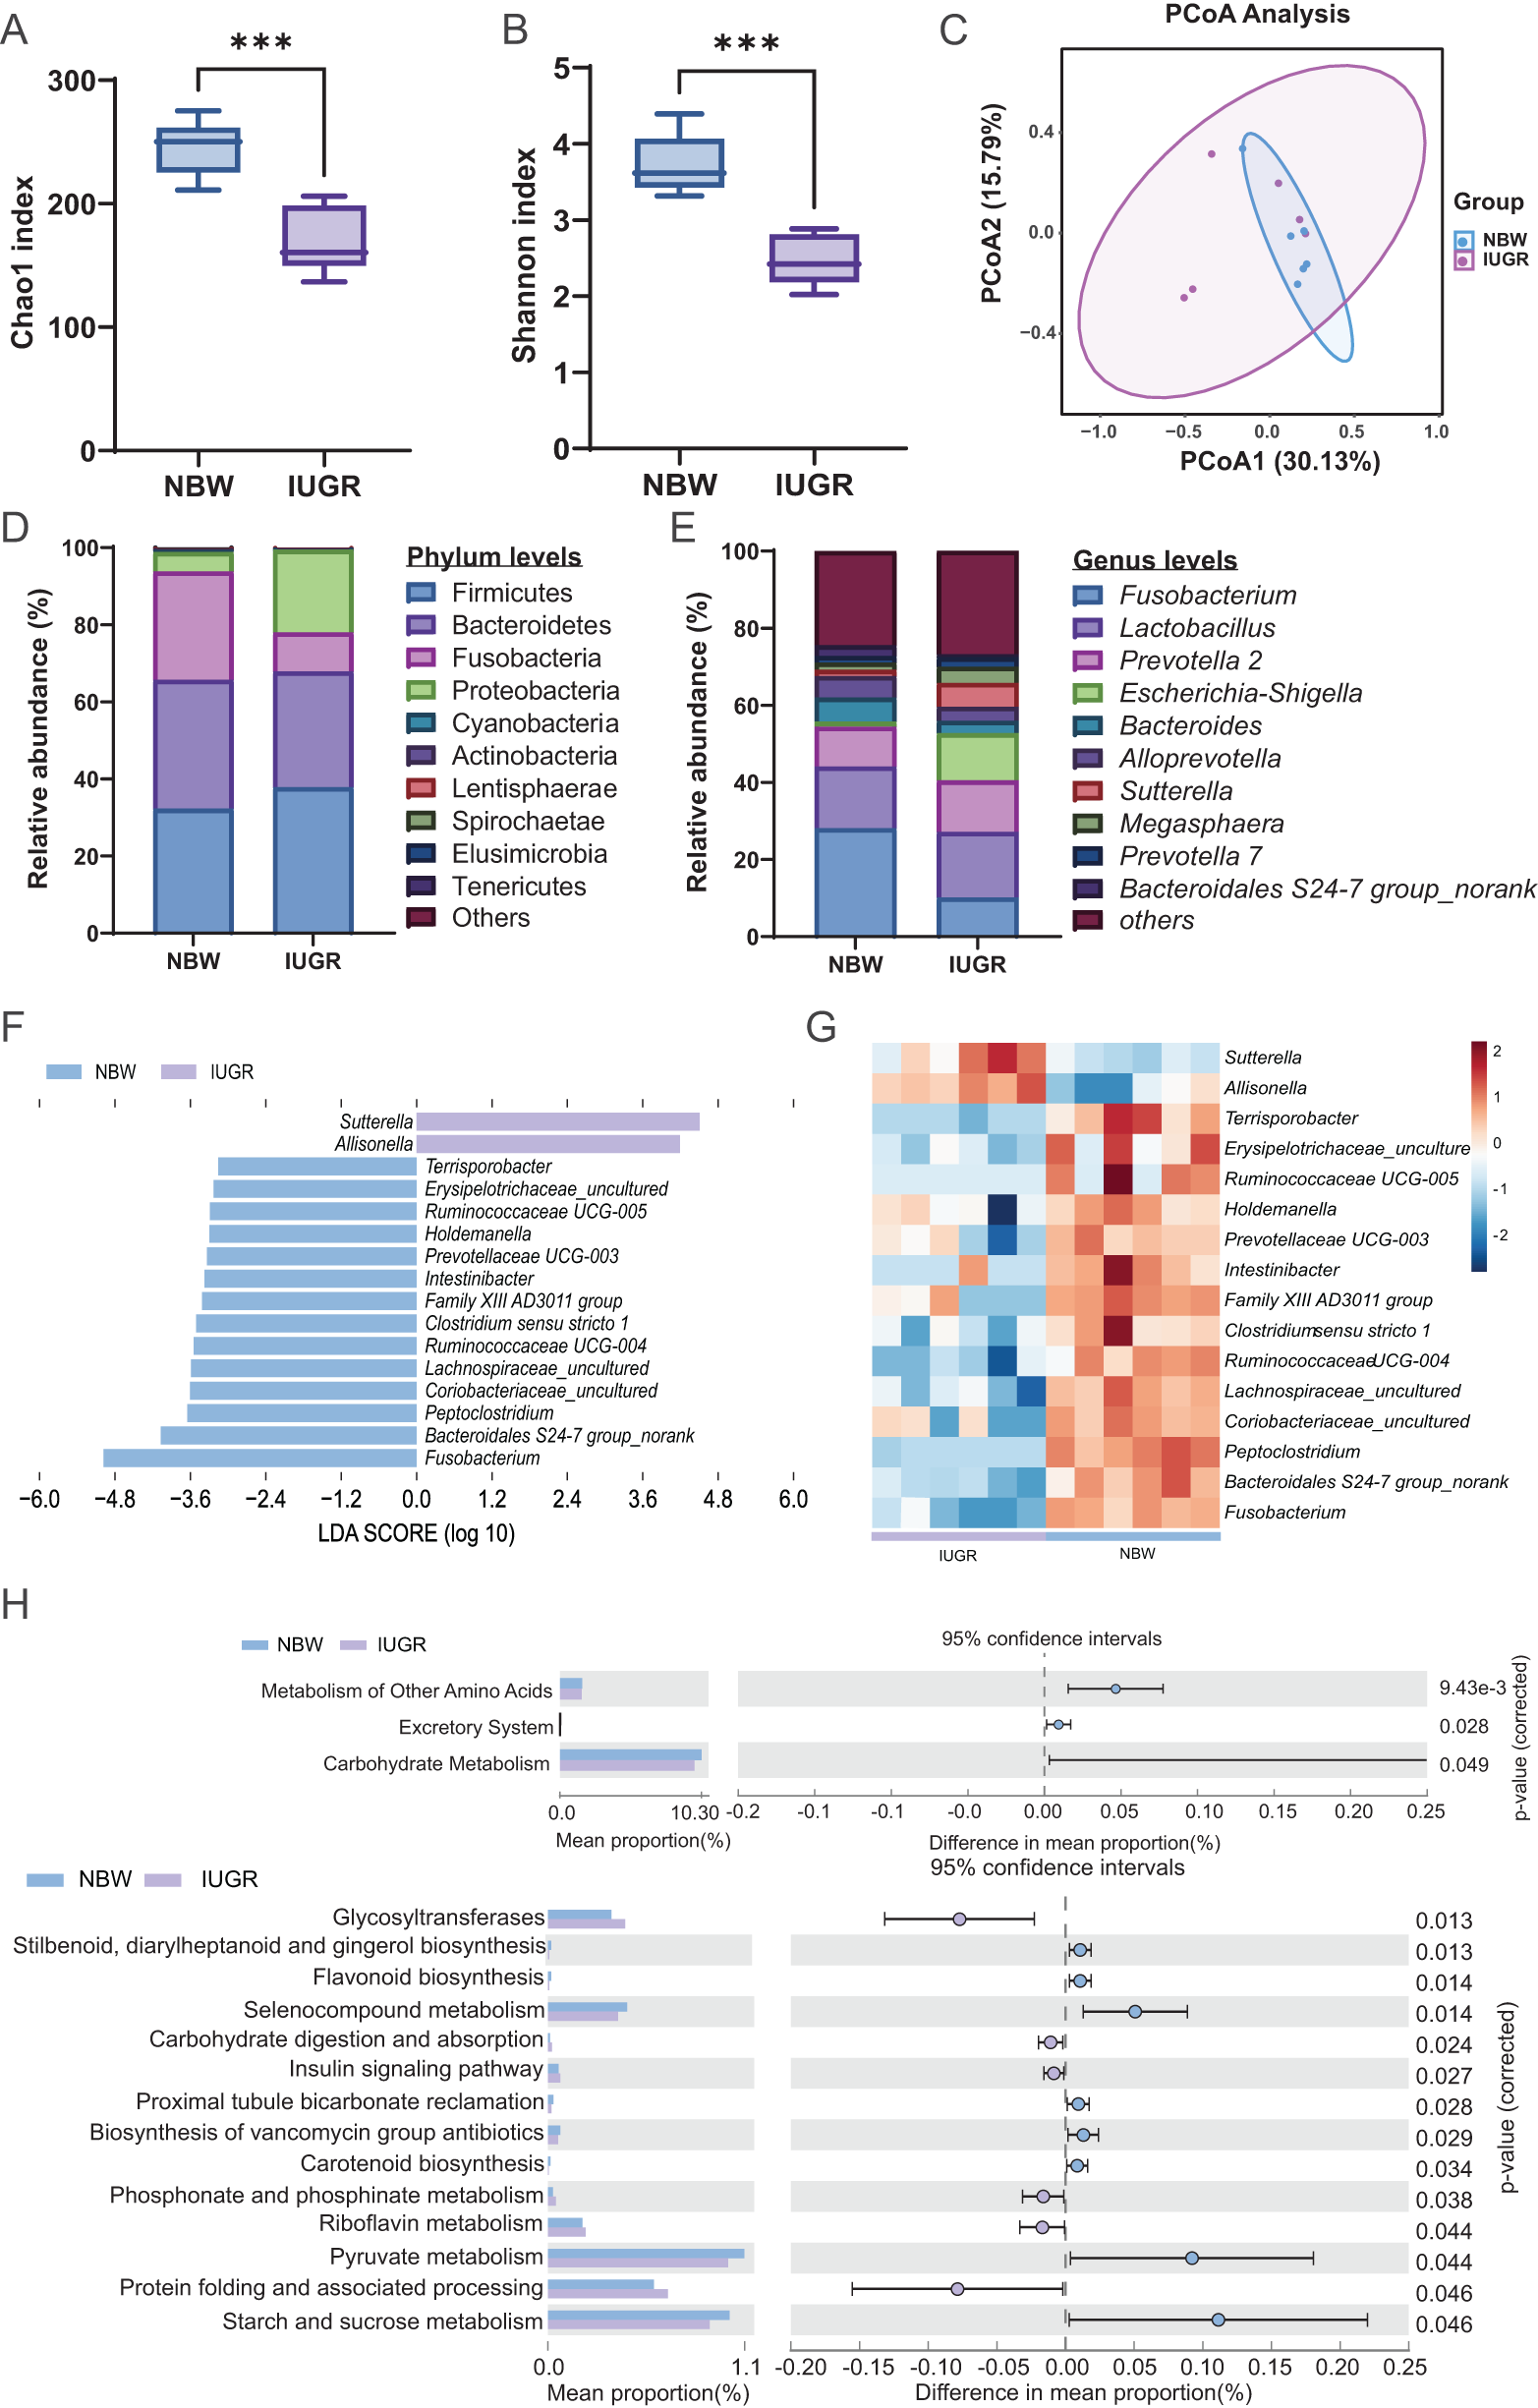
The cecal microbiota composition of IUGR and NBW piglets is presented in Fig. 2. Both Chao1 and Shannon index were significantly reduced in IUGR piglets, indicating decreased microbial richness and diversity (Fig. 2A-B). Principal component analysis (PCA) revealed limited separation between the two groups (Fig. 2C).
Differences in cecum microbial community diversity between the IUGR and NBW piglets. (A) Chao1 index; (B) Shannon index; (C) PCA of gut microbiota based on Bray‒Curtis distances; (D) Relative abundance of the top 10 bacteria at the phylum level; (E) Relative abundance of the top 10 bacteria at the genus level; (F) LEfSe analysis of intestinal flora in IUGR and NBW piglets: Histogram of the distribution of LDA values (log10) showing biomarkers with statistically significant differences between the two groups, colonies with significant differences between the two groups; the length of the columns indicates the influence of the cecum on the differences between the two groups; (G) Heatmap of the correlation between IUGR and NBW cecum contents differential bacteria; and (H) Function predictive analysis of gut microbiota. The data are presented as the means ± SEMs, n = 6; *p < 0.05, **p < 0.01.

At the phylum level, the cecal microbiota of both IUGR and NBW piglets were dominated by Bacteroidetes and Firmicutes, with Proteobacteria being the third most abundant phylum (Fig. 2D). In IUGR piglets, Lactobacillus was the predominant genus, followed by Prevotella_2, Escherichia-Shigella, Fusobacterium, Sutterella, and Alloprevotella. In contrast, NBW piglets exhibited Fusobacterium as the most prevalent genus, with Lactobacillus, Prevotella_2, Bacteroides, and Alloprevotella among the next most abundant (Fig. 2E).
To assess the differences in genus-level microbial composition of the gut flora between the IUGR and NBW piglets, we further employed LEfSe analysis (linear discriminant analysis; LDA > 3.0). It revealed 2 and 14 differential genera in the two groups, respectively (Fig. 2F). Heatmap of the differential genera obtained from LEfSe indicated distinct clustering between the IUGR and NBW piglets. Specifically, Sutterella and Allisonella were enriched in IUGR piglets, while Fusobacterium and Bacteroidales S24-7 group_norank showed higher abundance in the NBW piglets (Fig. 2G).
Functional prediction of the intestinal flora of IUGR and NBW piglets was performed using the PICRUSt2 software, and a total of 5965 KEGG functional gene KOs were obtained by comparing the KEGG databases, corresponding to 7 level 1 pathways, 39 level 2 pathways, and 261 level 3 pathways. STAMP analysis revealed that, compared to NBW piglets, IUGR piglets revealed significantly reduced abundance of metabolism of other amino acids and carbohydrate metabolism pathways (Fig. 2H). These findings suggest that IUGR disrupts gut microbiota composition and metabolic potential, which may compromise intestinal health.
Altered serum exosomal miRNA profiles in IUGR piglets
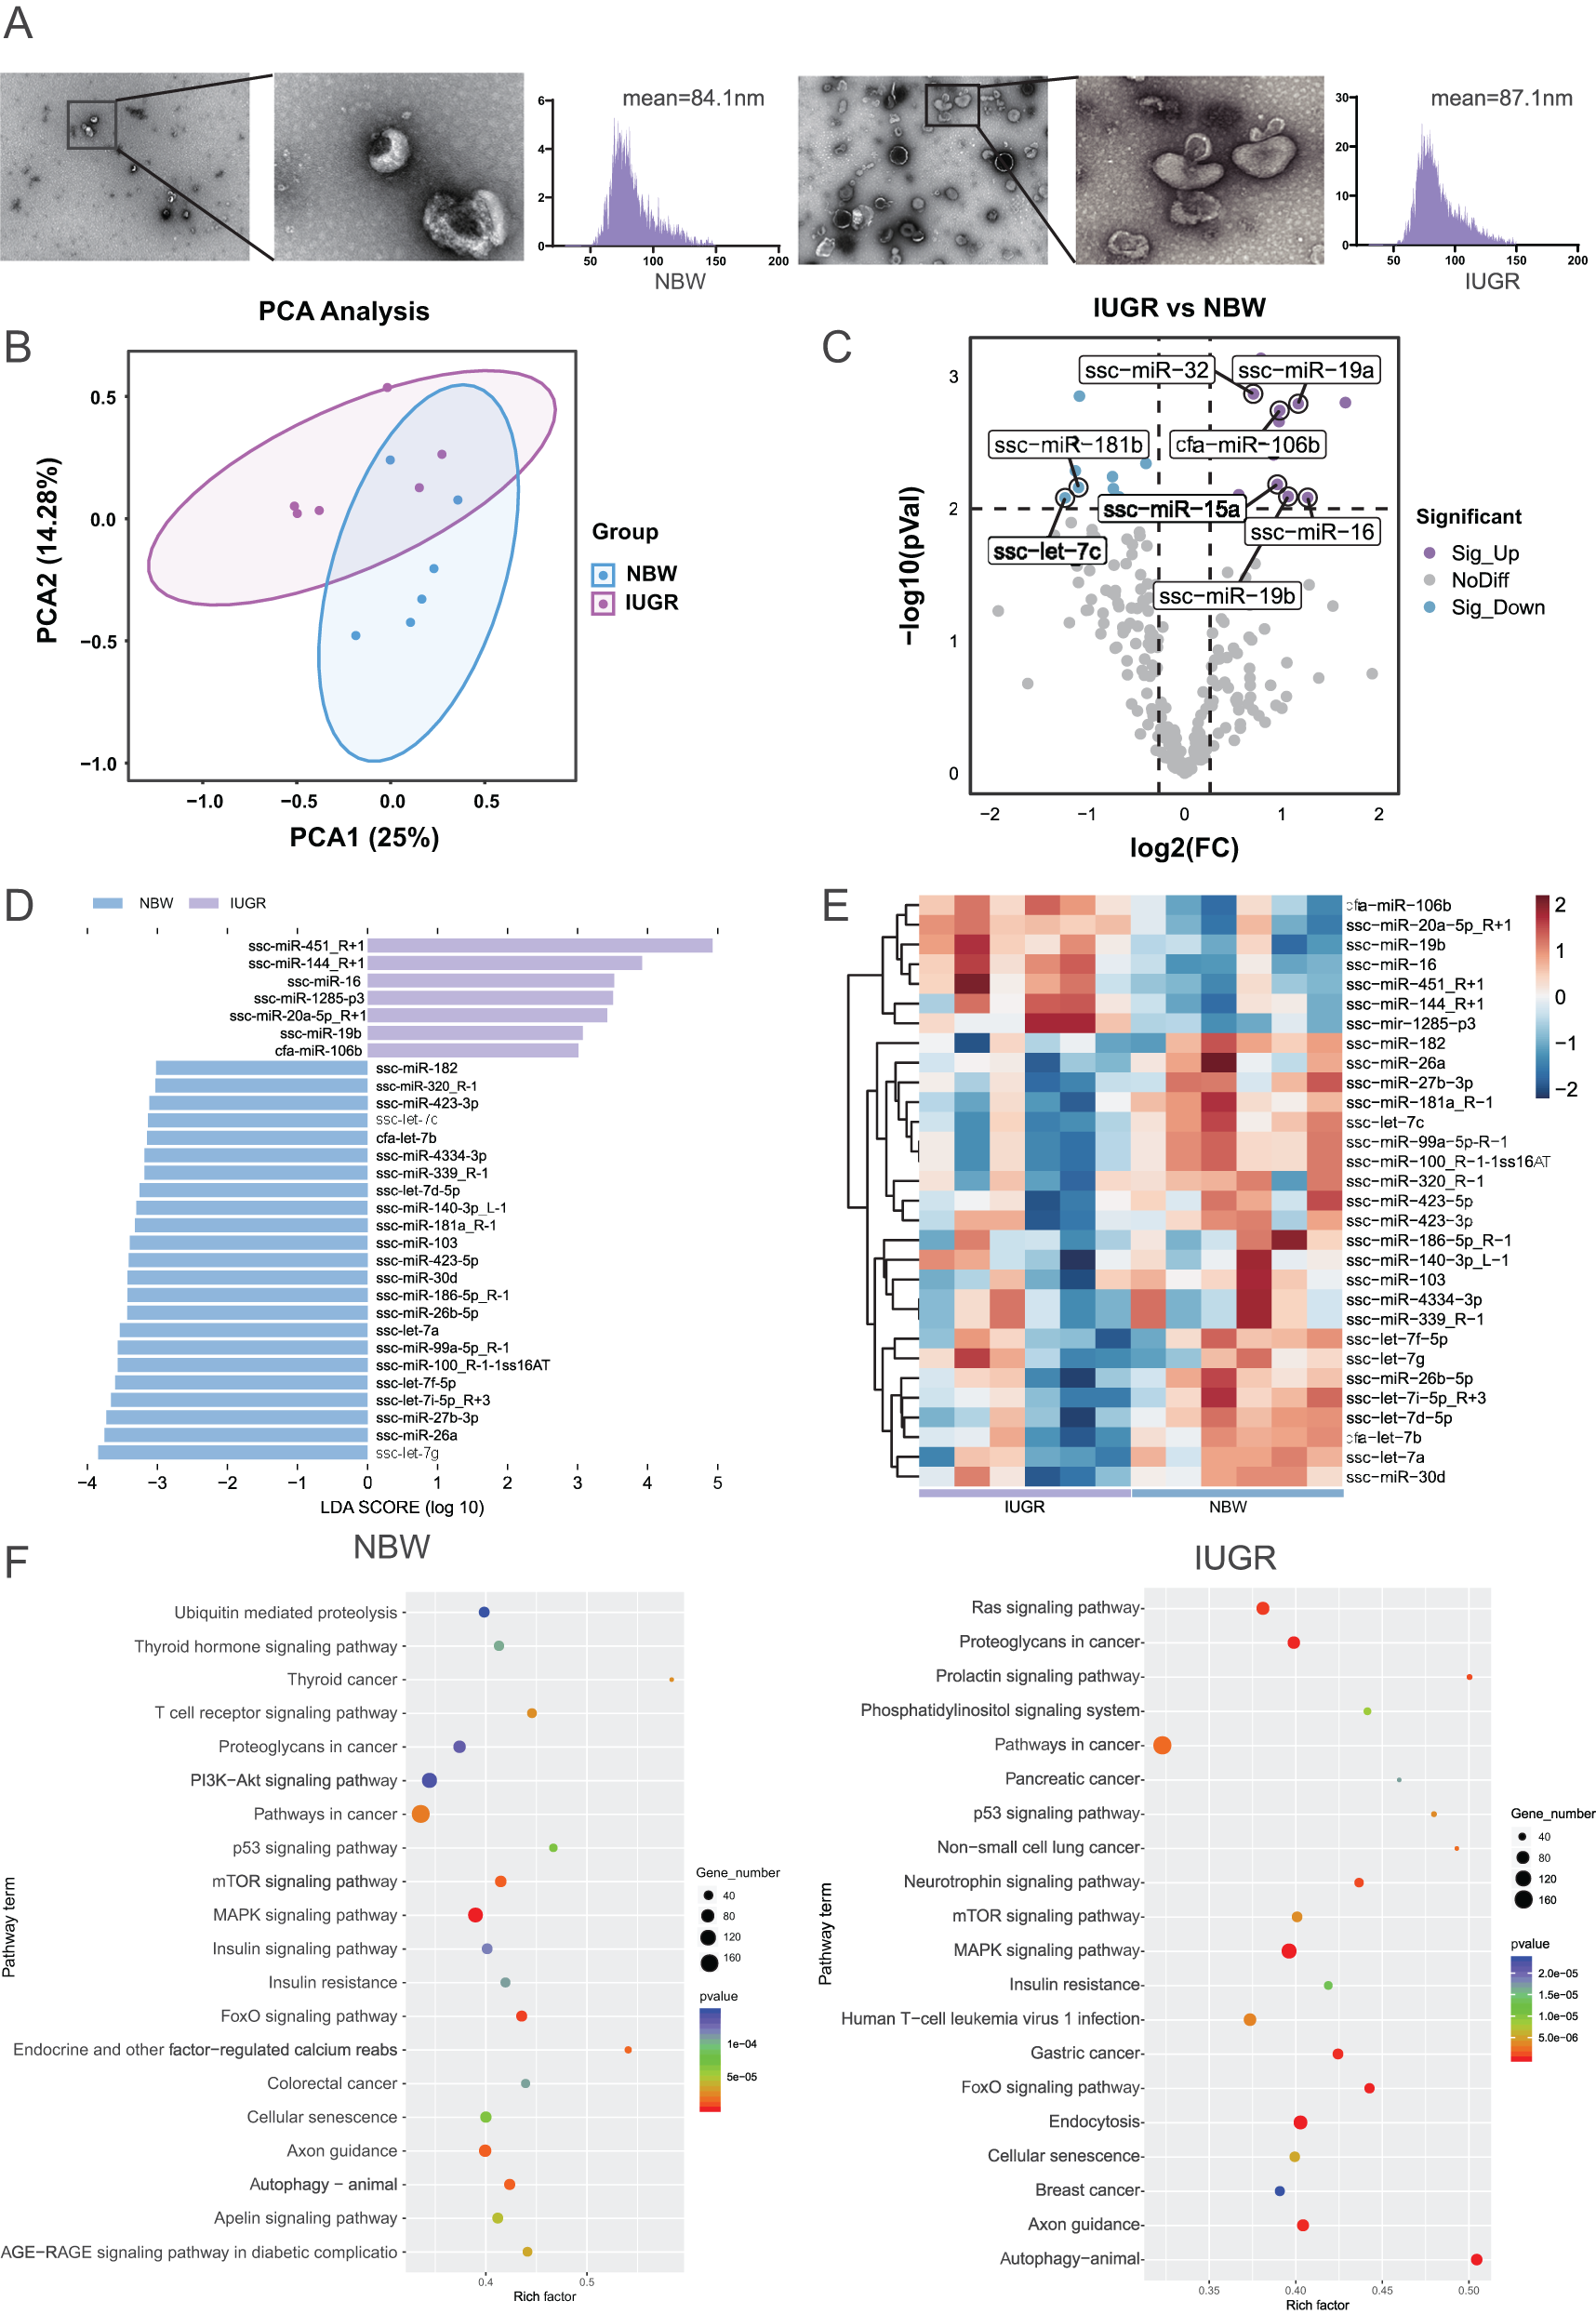
To explore the functional role of serum exosomes, we isolated serum exosomes and characterized using TEM, which confirmed the presence of vesicles with characteristic spherical morphology (Fig. 3A). NTA revealed a mean particle diameter of 84.1 ± 17.6 nm for serum exosomes in the NBW piglets, compared to 82.8 ± 17.8 nm in the IUGR piglets. The size distribution of detected particles fell predominantly within the 30–150 nm range (Fig. 3A). PCA results revealed an overlapping distribution between the IUGR and NBW groups, indicating no clear separation in their microbial profiles (Fig. 3B). Differential expression analysis (p < 0.01, |log2FC| > 1.2) identified a total of 28 expressed miRNAs between serum exosomes of IUGR and NBW groups, including 14 upregulated miRNAs such as ssc-miR-16 and ssc-miR-19b, while 14 miRNAs were significantly downregulated, mainly including ssc-let-7c (Fig. 3C).
Differences in the miRNA profiles of serum exosomes between IUGR and NBW piglets. (A) TEM imaging and NTA of serum exosomes (scale bar: 100 nm); (B) PCA of miRNAs based on Bray‒Curtis distances; (C) Volcano map of differentially expressed genes in the IUGR and NBW piglets; (D) LEfSe analysis of differentially expressed miRNAs in IUGR and NBW piglets; (E) Heatmap of differentially expressed miRNAs in the IUGR and NBW piglets; (F) KEGG pathway analysis of differentially expressed miRNAs. The data are presented as the means ± SEMs, n = 6; *p < 0.05, **p < 0.01.

To compare differential miRNA expression profiles between the IUGR and NBW groups, further LEfSe analysis (LDA > 3.0) showed that there were 7 and 23 differential miRNAs between the two groups, respectively (Fig. 3D). Then, the heatmap was generated to visualize expression patterns of the 30 most differentially expressed genes (DEGs) between the IUGR and NBW piglets (Fig. 3E).
KEGG pathway enrichment analysis was performed on the DEGs. It revealed a shared significant enrichment in both groups such as mTOR signaling, MAPK signaling, and pathways in cancer (Fig. 3F). These results suggest that these miRNAs are strongly associated with IUGR and may serve as candidate biomarkers.
Functional insights into key differentially expressed miRNAs
Target prediction (TargetScan > 95, miRDA score <−30) revealed that differentially expressed miRNAs were closely associated with genes involved in inflammatory and developmental processes, including the MAPK signaling pathway, mitochondrial RNA catabolism, BMP and Wnt signaling, liver development, and planar cell polarity regulation (Fig. 4A-B).
Integrated miRNA/mRNA network analysis and correlation analysis. (A) Network connecting miRNAs and target mRNAs obtained using TargetScan and miRDA; (B) GO analysis of these target genes performed using Cystoscope Clue GO. Each node (circle) represents a distinct pathway, and the edges represent the genes overlapping between two pathways.

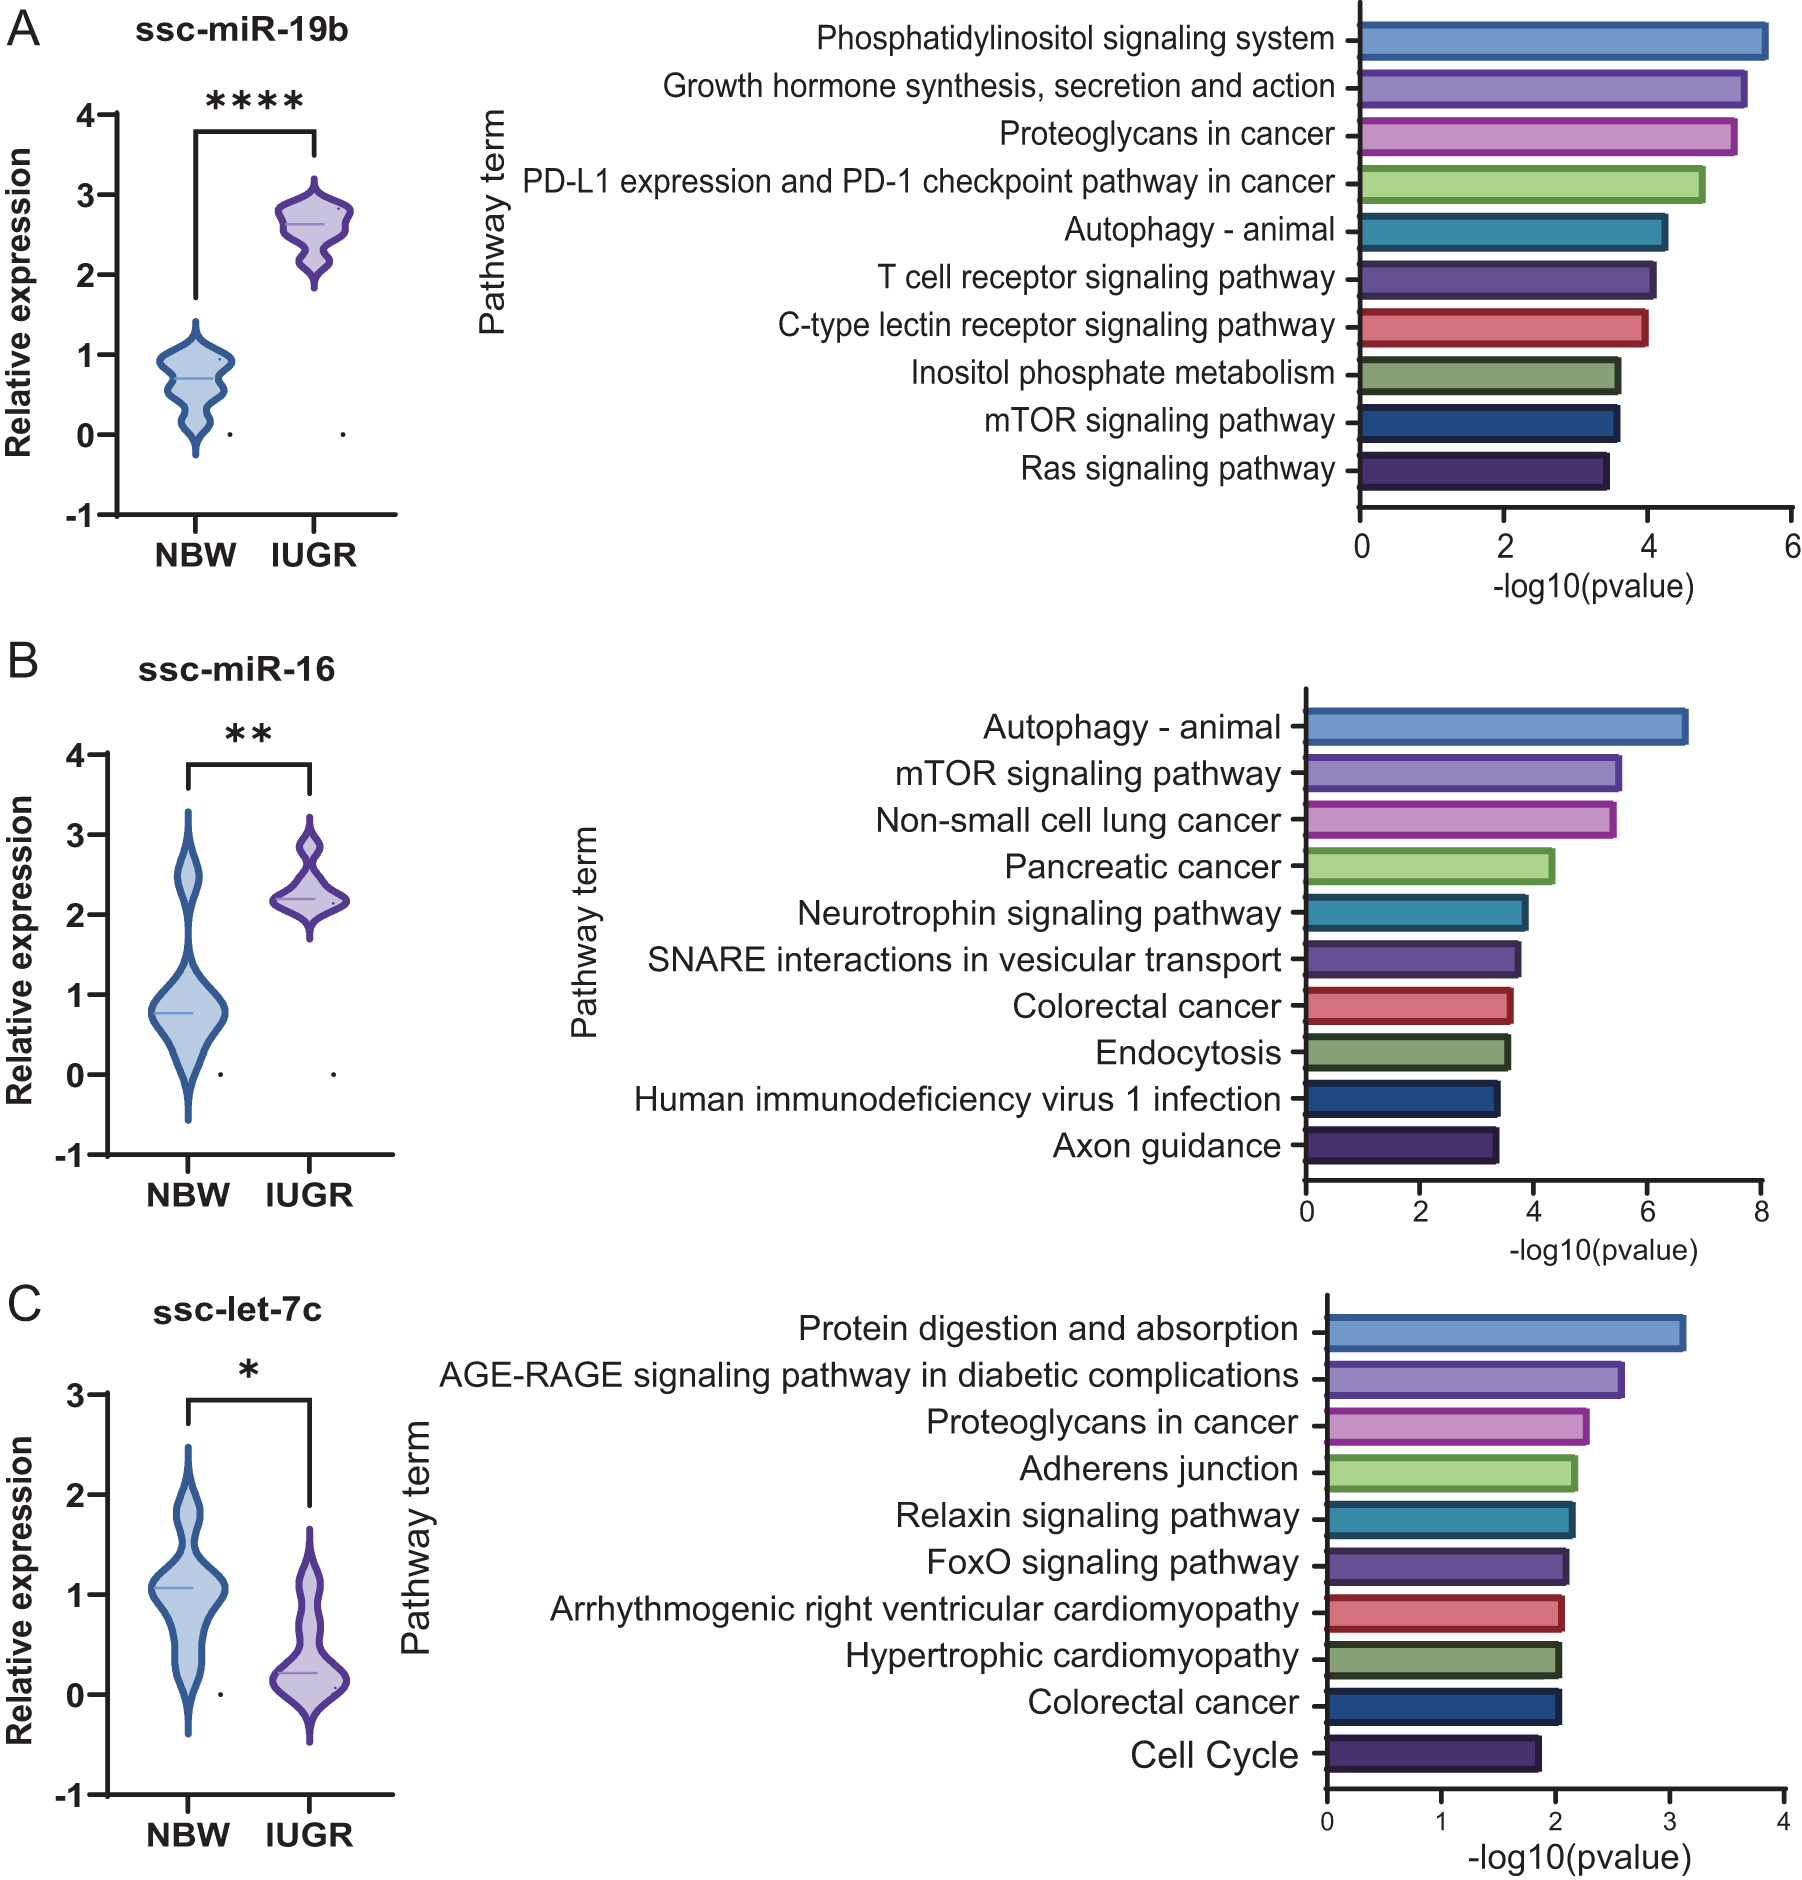
Among them, three miRNAs, including ssc-miR-19b, ssc-miR-16, and ssc-let-7c, were identified as key regulators. Both ssc-miR-19b and ssc-miR-16 were significantly upregulated in IUGR piglets and enriched in pathways related to cellular signaling and metabolism, including the mTOR signaling pathways, as well as infection – and hormone-related pathways (Fig. 5A-B). In contrast, ssc-let-7c was significantly downregulated and primarily associated with pathways related to metabolism and protein digestion and absorption (Fig. 5C). Together, these findings suggest that dysregulation of exosomal miRNAs in IUGR piglets may contribute to impaired intestinal development and nutrient metabolism through coordinated modulation of inflammatory and metabolic signaling pathways.
Functional Insights into key differentially expressed miRNAs. (A) Relative expression levels of ssc-miR-19b and KEGG functional analysis; (B) Relative expression levels of ssc-miR-16 and KEGG functional analysis; (C) Relative expression levels of ssc-let-7c and KEGG functional analysis(C). The data are presented as the means ± SEMs, n = 6; *p < 0.05, **p < 0.01.

Correlation between differentially expressed miRNAs and gut microbiota
Correlation analysis revealed distinct modular patterns linking gut microbial genera with miRNA expression. Specifically, the genera located in the upper right quadrant (Sutterella and Allisonella) showed robust positive correlations with the miRNA groups situated in the lower left quadrant (which included ssc-miR-16 and ssc-miR-19b). Notably, the abundance of Allisonella demonstrated a strong correlation with the expression level of ssc-miR-16 (r = 0.704, p < 0.010) (Fig. 6A). According to linear correlation analysis, ssc-miR-16 and ssc-miR-19b were positively correlated with Allisonella but negatively correlated with Clostridium sensu stricto 1, while ssc-let-7c showed a negative linear correlation with Allisonella and a significant positive correlation with Clostridium sensu stricto 1 (Fig. 6B). These findings suggest close host–microbe interactions involving exosomal miRNAs and gut microbiota in IUGR piglets.
Correlation between differential miRNAs and bacterial genera between IUGR and NBW piglets. (A) Heatmap of correlation between colony genus level and serum miRNA expression level obtained by Spearman correlation analysis; (B) The relationship between microRNAs and bacterial genus expression. The data are presented as the means ± SEMs, n = 6; *p < 0.05, **p < 0.01.

Discussion
In pig industry, IUGR is a widespread metabolic disorder in swine production, adversely affecting postnatal growth performance and overall health (Bai et al., Reference Bai, Jiang and Wang2024). Therefore, reducing its incidence is critical for improving both animal and public health. Previous studies have shown that miRNAs regulate diverse biological processes and are implicated in numerous human diseases, with differential miRNA expression being a hallmark of conditions such as pre-eclampsia and IUGR (Hu and Zhang Reference Hu and Zhang2019). In summary, we demonstrated that the serum exosomal miRNA profiles with IUGR piglets are distinct from normal fetuses, indicating that differentially expressed miRNAs may serve as valuable biomarkers for IUGR detection.
IUGR infants consistently exhibit impaired organ development and increased susceptibility to infections, resulting in elevated postnatal mortality and poor growth trajectories (Li et al., Reference Li, Huang and Lei2021). Across mammalian species, IUGR neonates display significantly lower BW than NBW piglets, with long-term health impairments (Darendeliler Reference Darendeliler2019). In pigs, IUGR piglets lead to significantly reduced small intestine and liver weights at birth, including a 14% decrease in the intestinal-to-BW ratio, along with persistent defects in intestinal development during lactation (Wang et al., Reference Wang, Lin and Liu2014). Consistent with these findings, our data confirm that IUGR piglets have lower BW, impaired organ development, and disrupted intestinal morphology. Therefore, IUGR substantially disrupts organ microarchitecture and intestinal integrity in neonatal piglets, warranting further investigation into its impact on digestive function.
The intestine serves as a vital organ for nutrient digestion, absorption, and metabolism, as well as the largest immune barrier against pathogens in animals (Tang et al., Reference Tang, Zhang and Azad2022). IUGR has been shown to impair intestinal health in piglets by disrupting morphological integrity, compromising barrier function, and disturbing microbial colonization (D’Inca et al., Reference D’Inca, Gras-Le Guen and Che2011; Dong et al., Reference Dong, Zhong and Ahmad2014). Beyond structural defects, the establishment and maturation of gut microbiota are critical for metabolic health and growth in mammals (Clarke et al., Reference Clarke, Murphy and O’Sullivan2014). Beyond structural defects, the establishment and maturation of gut microbiota are critical for metabolic health and growth in mammals (Jiang et al., Reference Jiang, Feng and Tao2019). To explore microbiota alterations in IUGR, we compared bacterial compositions at the genus levels between IUGR and NBW piglets. At the genus level, notable elevations in Escherichia–Shigella and Sutterella were detected, both of which are associated with pro-inflammatory responses. These findings align with human studies reporting reduced beneficial bacteria and enrichment of opportunistic pathogens in low-birth-weight infants (Lin et al., Reference Lin, Liu and Feng2012). Consequently, our results demonstrate that IUGR induces structural reorganization of the intestinal microbial architecture in neonatal piglets, ultimately promoting dysbiosis.
Accumulating evidence links intestinal developmental and functional impairments in IUGR piglets to altered expression of nutrient transporters and dysregulated nutrient and energy metabolism (Qi et al., Reference Qi, Wang and Tan2020; Wang et al., Reference Wang, Blachier and Fu2013; Wellington et al. Reference Wellington, Rodrigues and Li2021). Functional prediction of the gut microbiota further reveals disturbances in amino acid and carbohydrate metabolism in IUGR compared to NBW piglets. This metabolic disruption may originate early in development: impaired placental amino acid transport – a critical determinant of fetal growth that is a well-established limitation in IUGR pregnancies (Philipps et al., Reference Philipps, Holzman and Teng1978). Consistent with findings in humans, IUGR fetuses frequently exhibit decreased plasma amino acid levels and fetal uptake of essential amino acids is diminished in both human IUGR and relevant animal models (Cetin et al., Reference Cetin, Corbetta and Sereni1990; Economides et al., Reference Economides, Nicolaides and Gahl1989; Shimada et al., Reference Shimada, Powell and Jansson2024), Based on these observations, we propose that IUGR compromises intestinal nutrient absorption and disrupts microbial metabolic processes, collectively contributing to postnatal growth impairment. Therefore, our results show that IUGR compromises the developing gut ecosystem of neonatal piglets by impairing intestinal integrity and inducing microbial dysbiosis. It is well established that miRNAs serve as the principal bioactive components of exosomes and are transported primarily via this mechanism, playing diverse biological roles (Sun et al., Reference Sun, Kalionis and Lv2015; Valadi et al., Reference Valadi, Ekström and Bossios2007; Yu et al., Reference Yu, Liang and Huang2021). Research has implied that their importance in mammalian embryonic development (Zhang et al., Reference Zhang, Yu and Ning2025). This study compared the serum exosomal miRNA profiles between IUGR and NBW piglets. The identified differentially expressed miRNAs were significantly enriched in signaling pathways previously associated with IUGR, as revealed by KEGG pathway analysis, supporting their potential utility as clinical biomarkers. For example, miR-218, which we found elevated, has also been reported to be upregulated in IUGR fetuses (Tao and Xu Reference Tao and Xu2013). Moreover, aberrant expression of miR-29a in the small intestine has been shown to compromise epithelial integrity in growth-restricted piglets, and its inhibition may improve barrier function, underscoring its therapeutic relevance (Zhu et al., Reference Zhu, Wang and Yuan2017). Nevertheless, the molecular mechanisms through which exosomal miRNAs contribute to IUGR pathogenesis remain incompletely understood, warranting further functional investigation.
In this study, the miRNA–mRNA pairs exhibited pronounced enrichment across several crucial pathways, including the MAPK, mTOR signaling pathways, regulation of mitochondrial RNA metabolism, liver development and the Wnt/planar cell polarity pathway. These findings suggest that the examined miRNAs play regulatory roles in IUGR through these mechanisms. According to Zhang et al. (Reference Zhang, Chen and Li2020), AMPK signaling was inhibited in the intestinal tissue of weaned piglets with IUGR, leading to an abnormal energy state and decreased ATP generation. The liver, as a central organ for nutrient metabolism, is highly vulnerable to gestational IUGR (Trefts et al., Reference Trefts, Gannon and Wasserman2017). Previous studies have also frequently associated weaned IUGR piglets with disordered lipid metabolism and insulin resistance (He et al., Reference He, Dong and Xu2015). Hence, these results indicate that IUGR piglets exhibit intestinal inflammation and energy metabolism dysfunction, and enhancing intestinal nutrient absorption may facilitate their recovery.
Host-derived miRNAs are closely associated with the gut microbiota and are implicated in various diseases, including liver dysfunction, immune disorders, cognitive impairment, cardiovascular diseases, and infertility (Dong et al., Reference Dong, Liu and Yang2023). This study identified a strong association between gut microbiota and miRNAs, indicating that differential expression of serum-derived exosomal miRNAs holds predictive value for IUGR. Among these, ssc-miR-19b and ssc-miR-16 positively correlated and ssc-let-7c negatively correlated with Allisonella abundance. Previous studies have established ssc-miR-16 and ssc-let-7c as diagnostic biomarkers in various diseases (Atanassova and Georgieva Reference Atanassova and Georgieva2023; Guo et al., Reference Guo, Guo and Li2016; Gururajan et al., Reference Gururajan, Naughton and Scott2016; Mulholland et al., Reference Mulholland, Green and Buckley2019; Ortega-Hernandez et al., Reference Ortega-Hernandez, Escobar-Alvarado and Sanchez-Munoz2021), and ssc-miR-19b modulates disease progression via target gene regulation (Lv et al., Reference Lv, Tang and Peng2014; Martínez-Hernández et al., Reference Martínez-Hernández, Fuente and Lamana2020; Zhang et al., Reference Zhang, Wang and Dou2019). Research indicates that Allisonella is closely associated with intestinal inflammatory responses and barrier dysfunction (Garner et al., Reference Garner, Flint and Russell2002). Therefore, the upregulation of ssc-miR-16 and ssc-miR-19b and the downregulation of ssc-let-7c may be associated with IUGR. Collectively, these miRNA–microbiota interactions form a complex network contributing to IUGR pathophysiology, warranting additional investigation of host-microbial crosstalk. However, the specific mechanisms by which the gut microbiota influences miRNA expression remain to be further explored, as this could become an important avenue for predicting IUGR in the future.
Conclusion
In conclusion, this study reveals that serum miRNAs may serve as potential biomarkers for IUGR. Specifically, IUGR likely contributes to gut microbial dysbiosis during early postnatal development by reducing microbial diversity and abundance, thereby impairing intestinal mucosal integrity. Subsequently, miRNAs profiling of serum from NBW and IUGR piglets identified specific miRNAs associated with IUGR. Although it remains unclear whether these miRNAs directly regulate IUGR in vivo, the novel findings at least partially account for the intestinal dysfunction induced by IUGR and suggest their utility as diagnostic tools for early detection.
Acknowledgements
This work was supported by the National Natural Science Foundation of China (32372907). The authors thank all technical personnel for their contributions to this research.
Author contributions
Q.S.: Investigation, Methodology, Data curation, Writing; W.Z.: Investigation, Software; M.Y.: Investigation; Y.W.: Investigation; F.W.: Investigation; Y.X.: Supervision, Funding acquisition; S.Z.: Supervision, Research design; L.M.: Conceptualization, Supervision.
Conflicts of interest
The authors declare no conflicts of interest.


 Open access