

INTRODUCTION
Malaria and cutaneous leishmaniasis (CL) are serious, vector-borne infectious diseases, both of which are caused by parasites and co-endemic in Afghanistan. Malaria is caused by Plasmodium parasites that are spread to people through the bites of infected Anopheles mosquitoes which bite mainly between dusk and dawn. The World Health Organization (WHO) estimated that there were about 124–283 million cases of malaria in 2013 and an estimated 367000–755000 deaths [1]. Afghanistan has the fourth largest malaria burden worldwide of any country outside of Africa [Reference Naieni2] and the second highest burden of malaria in the Eastern Mediterranean region [Reference Safi3] with ~60% of the population, or nearly 14 million people, living in endemic areas of Afghanistan [Reference Adimi4]. Past evidence has shown that the use of vertical government indoor residual spraying and treatment with chloroquine had almost eradicated the disease before the military conflicts and instability [Reference Kolaczinski5]. The three decades of armed conflict have left the country's health sector barely functioning with many malaria programmes scrapped. With the restoration of political stability in 2001, some changes have begun to appear and more systematic studies on the disease are becoming possible. Currently the National Malaria and Leishmaniasis Control Programme (NMLCP) and partners are tasked with the routine information system to report monthly malaria cases by health facility [Reference Alegana6].
Leishmaniasis is the third most common vector-borne disease caused by the protozoan parasite Leishmania. Over 30 Leishmania species known to infect humans are transmitted by the bite of infected female phlebotomine sand flies [Reference Bates7]. There are three main types of leishmaniasis: (i) visceral leishmaniasis (VL), often known as kala-azar and the most serious form of the disease; (ii) CL which is the most common, and (iii) mucocutaneous [Reference Bates7]. The WHO's recent review shows that over 98 countries and territories are endemic for leishmaniasis. It is estimated that about 0·2–0·4 million new VL cases and 0·7–1·2 million new CL cases occur each year worldwide [8]. More than 70–75% of the global CL cases occur in ten countries: Afghanistan, Algeria, Brazil, Colombia, Costa Rica, Ethiopia, Iran, Peru, Sudan and Syria [8]. In Afghanistan, the majority of leishmaniasis cases are caused by Leishmania tropica which is transmitted anthroponotically (i.e. humans are the reservoir) by the sand fly (Phlebotomus sergenti) [Reference Ashford, Kohestany and Karimzad9–Reference Adegboye11]. Afghanistan is a CL-endemic country and the disease is of serious health concern with about 200 000 estimated new cases of CL infection reported nationwide and 67500 cases in Kabul alone [Reference Adegboye11, Reference Reithinger12]. The burden and the psychological consequences of an infected individual can be disturbing; in some cases infected women are stigmatized and may be deemed unsuitable for marriage and motherhood [Reference Reithinger13].
It is very common for vector-borne infectious diseases to have similar hotspots; this can be due to overlapping geographical distribution of the vector. The suitability of breeding sites and environmental conditions may enhance simultaneous transmission of multiple parasites. Incidences of multi-parasite infections have been documented in many continents both in animals and humans [Reference Petney and Andrews14–Reference van den Bogaart17]. Co-infection of a host by multiple parasite species is a commonly observed condition, where an individual's susceptibility and infectiousness are affected at various levels [Reference van den Bogaart16]. The co-existence of multiple pathogens in certain populations as well as their distribution is part of a natural selection, as a result of favourable ecological and host factors, which include the biological interactions of the parasites within the host [Reference van den Bogaart16, Reference van den Bogaart17]. The presence of both malaria and leishmaniasis in humans could influence disease outcome and progression of diseases due to the modulation of immune response [Reference van den Bogaart16, Reference Marques18, Reference Pinna19].
In Afghanistan, malaria incidence and transmission have been linked to a number of factors, including climate [Reference Adimi4, Reference Kolaczinski5] and climate change [Reference Dhimal, Ahrens and Kuch20–Reference Bounoua22], geography [Reference Brooker23, Reference Faulde24], migration [Reference Faulde24], socioeconomic level [Reference Howard25], as well as control strategies [Reference Rowland26]. However, the risks of anthroponotic cutaneous leishmaniasis (ACL) include poor housing, poor sanitary conditions (e.g. lack of waste management, open sewerage), which may increase sand-fly breeding and resting sites as well as their access to humans [Reference Salam, Al-Shaqha and Azzi27], and mass migration of infected (and infectious) Afghan refugees [Reference Rowland28]. Moreover, household construction materials, house design, density and presence of the disease in neighbourhoods are significant risk factors for the incidence of ACL [Reference Reithinger, Mohsen and Leslie29]. Rodents were revealed to be the natural host of zoonotic cutaneous leishmaniasis (ZCL) in the outbreak around Mazar-e Sharif and the seasonality in the occurrence of ZCL in humans was attributed to seasonal activity of the rodents [Reference Michael30]. Furthermore, altitude was found to be a risk factor as well as excess risk of CL in the northeastern and southeastern parts of Afghanistan [Reference Adegboye and Kotze31].
An important way to understand disease trends and planning prevention or eradication actions is to identify factors that might influence the incidence and transmission of the disease. A challenge in studying the vector-borne disease risk in Afghanistan is the heterogeneity of incidence, due to the high variation in the landscape and climate of the country. These diseases are sensitive to climatic changes such as rainfall, temperature and humidity. For example, some parts of Afghanistan that lie >2000 m above sea level are relatively free of malaria, while in areas of lower elevation malaria is prevalent between April and December. The impact of environmental influences on these diseases cannot be ruled out and human activity plays a significant role in the dispersion of the vectors, thereby changing the geographical distribution of the disease.
The main objective of this study is to investigate the association between the incidence of malaria and CL incidence in Afghanistan and identify the environmental risk factors associated with these two diseases. It is common to see individuals with both infections; multiple parasite infections are widespread across diverse ecosystems in the tropics and subtropics [Reference Raso15]. The formulated model will be used for short-term forecasting using 12-month incidence data from Afghanistan. Risk factors for multiple infections will be simultaneously analysed. As in most vector-borne diseases, geographical variations cannot be ruled out and risk factors may vary geographically [Reference Adegboye and Kotze32]. Here we develop a bivariate model that allows for incorporation of spatial information as well as temporal dependency.
DATA SOURCES
Study area and data collection
Afghanistan is a malaria- and CL-endemic country located in South Asia; it is a landlocked country that is characterized by mountainous regions. The NMLCP, under the Ministry of Public Health (MoPH), manages malaria and leishmaniasis surveillance. The datasets used in this study were confirmed primary malaria and CL cases reported to the Afghanistan Health Management Information System (HMIS) of the MoPH in 2009.
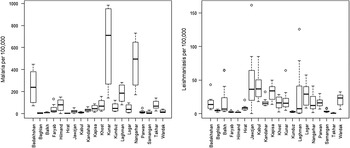
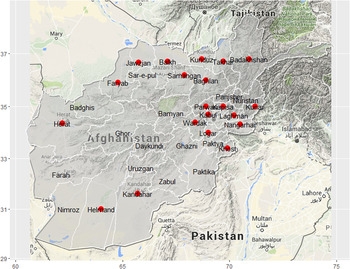
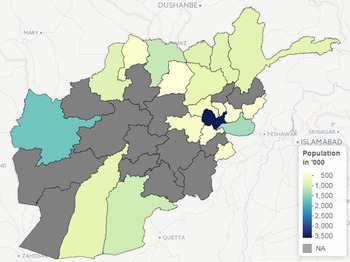
The malaria cases were confirmed by examining the blood slides at provincial or district hospitals; comprehensive health centres (CHC) or at basic health centres (BHC). The number of cases were noted on a weekly basis (when possible) and monthly reports were made to the district/provincial MoPH HMIS offices. A total of 390729 cases of malaria (from 521817 blood slides examined) were recorded in 2009, out of which 94% cases were Plasmodium vivax and the remaining cases were P. falciparum. The leishmaniasis infections were confirmed clinically or by examining the Leishmania parasites in the skin lesion biopsy using calibrated ocular micrometre-supported binocular light microscopy. The dataset consisted of 41072 CL cases from a total of 20 provinces in Afghanistan. In this study, the focus is on primary cases of P. vivax malaria because it is responsible for most of the malaria cases in Afghanistan. We focus here on the 20 provinces (out of 34 provinces in Afghanistan) with complete time-series cases of both malaria and CL monthly incidence data in 2009. The 2009 Afghanistan population data was obtained from the Central Statistics Organization of Afghanistan. The study area in this study represents about 75% of the entire population of Afghanistan in 2009. Figures 1–3 show the distribution of malaria and leishmaniasis cases, a map of Afghanistan giving the names and locations of the provinces included in the study and distribution of the Afghanistan population in 2009. See also Supplementary Appendices 1–4 for the time-series plots and maps of disease occurrence data.
Distribution of the reported total number of cases of malaria and leishmaniasis (per 100 000) at provincial level in Afghanistan in 2009. The line in the middle of the boxplot indicates the median value.
Map of Afghanistan showing the names and locations of the 20 provinces (red dots) included in the study.
The population of the 20 provinces in Afghanistan included in the study.
Environmental data
The role played by environmental factors in the dynamics and transmission of infectious diseases and their importance have been discussed elsewhere [Reference Hay33–Reference Adegboye and Kotze37]. The environmental covariates used in this study were altitude (metres), land surface temperature (LST) (K) and rainfall (mm). Datasets on these variables are available from the National Aeronautics and Space Administration (NASA) Earth Observations (NEO) (http://earthobservatory.nasa.gov/) and Shuttle Radar Topography Mission (SRTM) (http://srtm.csi.cgiar.org). The LST satellite datasets were collected by the Moderate Resolution Imaging Spectroradiometer (MODIS) at 1 km spatial resolution and temporal resolution of 1 month. Rainfall was measured by the Tropical Rainfall Measuring Mission (TRMM) (http://trmm.gsfc.nasa.gov/) jointly conducted by NASA and the Japan Aerospace Exploration Agency (JAXA) at monthly temporal resolution and 0·25° x 0·25° spatial resolution. The altitude data was extracted from the USGS ftpserver (http://srtm.csi.cgiar.org) at a 1-degree digital elevation model. The environmental datasets are depicted in Figures 4–6 while the time-series plots of the environmental data can be found in Supplementary Appendix 5.
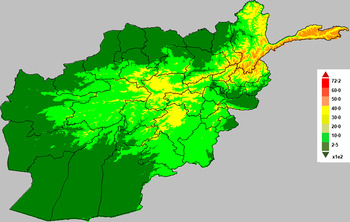
Map of Afghanistan showing the accumulated precipitation (mm) in 2009.
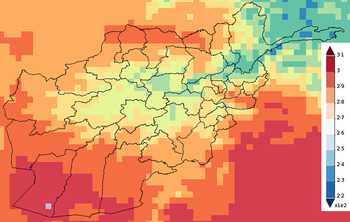
Map of Afghanistan showing the average temperature (K) in 2009.
Map of Afghanistan showing altitude (in metres).
Spatial scan statistics
Spatial and space–time scan statistics are versatile tools in infectious diseases surveillance for detecting clusters in disease outbreaks. The use of spatial scan statistics under the framework of geographic information system is a growing area in disease modelling and disease epidemiology.
Our objective using scan statistics was to find significant case clusters, i.e. sets of provinces where the total case count was significantly larger than expected based on census population estimates. To find clusters of interest, we used SaTScan [Reference Kulldorff38] to apply a test statistic to province-level case counts aggregated in circular windows of increasing radius centred at each province centroid, with a maximum cluster size of provinces covering 50% of the national population. Clusters with the largest test statistics were tested for statistical significance. This significance was assessed using the default 999 Monte Carlo trials drawn under the null hypothesis that the observed case count represents the census distribution [Reference Hohle39]. If the P value derived by ranking a test statistic calculated from observed data against the 999 statistics calculated similarly for the Monte Carlo trials was below our alpha level of 5%, then the observed cluster was considered significant. For the test statistic, we used SaTScan's Poisson log likelihood ratio, and we conducted this analysis separately for malaria and leishmaniasis.
Spatial time-series models
A multivariate model was used to simultaneously assess the effects of environmental variables on malaria and leishmaniasis using province-level monthly aggregated data. Also, when the interdependency between disease cases, caused by different pathogens, is of particular interest to further understand the dynamics of such diseases, a multivariate model is appropriate [Reference Hohle39]. Another important phenomenon in time-series analysis of infectious disease is overdispersion. It is very common to model the number of monthly cases of infectious disease incidence at each location or time as a Poisson count. However, when overdispersion is more likely, then the usual Poisson assumption does not reflect the overdispersion.
In this study, overdispersion is of particular interest because of the aggregation of data from homogeneous zones (where the data have a similar distribution) with significant differences among the zonal means. Similarly, the differences in these means may be due to non-uniform underreporting of disease incidence which may likely induce overdispersion. The Negative binomial (NegBin) model is a flexible observation model that allows for overdispersion [Reference Held, Hohle and Hofmann40]. The Poisson distribution is replaced with the negative binomial $y_{i,t} \vert y_{i,t - l} \sim {\rm NegBin}\!\left( {\mu _{i,t},\psi} \right)$
to allow for overdispersion through the specification of the overdispersion parameter ψ, while the conditional mean and the conditional variance are given by μ
i,t
and μ
i,t
, (1 + ψμ
i,t
), respectively [Reference Paul and Held41, Reference Paul, Held and Toschke42].
$y_{i,t} \vert y_{i,t - l} \sim {\rm NegBin}\!\left( {\mu _{i,t},\psi} \right)$
to allow for overdispersion through the specification of the overdispersion parameter ψ, while the conditional mean and the conditional variance are given by μ
i,t
and μ
i,t
, (1 + ψμ
i,t
), respectively [Reference Paul and Held41, Reference Paul, Held and Toschke42].
Model specification
The multivariate analysis will be implemented via an adapted version of the bivariate model proposed by Paul & Held [Reference Paul and Held41]. The model allows for different types of variation and the correlation will be incorporated within a single model. Let y
i,t
denote the number of cases of specific disease in ‘unit’ i = 1, 2, …, m, at time t = 1, …, T; the unit in this case might represent geographical regions or multiple diseases. The disease counts are assumed to be negatively binomially distributed, $y_{i,t} \vert y_{i,t - 1} \sim {\rm NegBin}\left( {\mu _{i,t},\psi} \right)$
with the conditional mean given by
$y_{i,t} \vert y_{i,t - 1} \sim {\rm NegBin}\left( {\mu _{i,t},\psi} \right)$
with the conditional mean given by
 $$\mu _{i,t} = \nu _{i,t} + \lambda _{i,t}y_{i,t - 1} + \phi _{i,t}\mathop \sum \limits_{\,j \ne i} w_{\; j,i\;} y_{\,j,t - l},$$
where ν i,t , λ i,t , ϕ i,t > 0; log(ν i,t ) is the endemic component, log(λ i,t ) is the autoregressive component, while log(ϕ i,t ) is the neighbour-driven component; y j,t−l denotes the disease counts in unit j at time ‘t − l’ with lag l ∈ {1, 2, …} and w j,i is the row-standardized spatial weights matrix (which define how cases in other regions j relate to cases in region i) is specified as follows: w j,i = 1/no. of neighbours of region i. The matrix ω i,j is based on contiguous neighbouring regions in which neighbours have a value of 1 and 0 otherwise.
Univariate models
In the general model, we considered special cases of equation (1). We fitted a negative binomial model to the univariate time-series of malaria and leishmaniasis diseases separately as models 1 and 2. The three unknown quantities, endemic component (ν i,t ), autoregressive epidemic component (λ i,t ), and neighbour-driven spatio-temporal component (ϕ i,t ) will be decomposed additively on the log scale. We have used the following model formulations in order of complexity models #a to #d, where # is the indicator for the type of disease, i.e. 1 refers to models for the malaria disease (models 1a–1d) while 2 indicates models for the leishmaniasis disease (models 2a–2d).
Model #a. This is a baseline model which includes a trend parameter, sinusoidal wave of frequency to capture seasonality and the offset population size in the endemic term (without random effects), and neighbour driven term with no autoregressive term. The model is given as:
 $$\mu _{i,t} = \nu _{i,t} + \phi _{i,t}\mathop \sum \limits_{\,j \ne i} w_{\,j,i\;} y_{\,j,t - l},$$
where ${\rm log}(\nu _{i,t}) = \log (n_{i,t}) + a_0 + a_1t + a_2\sin \left( {\displaystyle{{2\pi} \over {12}}t} \right) + a_3\cos \left( {\displaystyle{{2\pi} \over {12}}t} \right)$
and log(ϕ
i,t
) = γ
0
${\rm log}(\nu _{i,t}) = \log (n_{i,t}) + a_0 + a_1t + a_2\sin \left( {\displaystyle{{2\pi} \over {12}}t} \right) + a_3\cos \left( {\displaystyle{{2\pi} \over {12}}t} \right)$
and log(ϕ
i,t
) = γ
0
Model #b. Model b is similar to model a and, in addition, includes an autoregressive term defined as log(λ i,t ) = β 0.
Model #c. This model is similar to model b and, in addition, includes a random-effects parameter α i in the endemic component.
Model #d. Model d is similar to model c and, in addition, includes explanatory variables in the autoregressive component.
 $$\mu _{i,t} = \nu _{i,t} + \lambda _{i,t}y_{i,t - 1} + \phi _{i,t}\mathop \sum \limits_{\,j \ne i} w_{\,j,i\;} y_{\,j,t - l},$$
 $${\rm log}(\nu _{i,t}) = \log (n_{i,t}) + \alpha _i + \alpha _0 + \alpha _1t + \alpha _2\sin \left( {\displaystyle{{2\pi} \over {12}}t} \right) + \alpha _3\cos \left( {\displaystyle{{2\pi} \over {12}}t} \right),$$
 $$\eqalign{ {\rm log}(\lambda _{i,t}) &=\beta _0 + u_{i,t}\beta _1 + x_{i,t}\beta _2 + z_{i,t}\beta _3\,{\rm and} \cr \log \left( {\phi _{i,t}} \right) &= \gamma _0,}$$
where α 0, α 1, α 2, α 3, β 0, β 1, β 2, β 3, γ 0 are the regression parameters; α i is a random effect that is normally distributed with a mean 0 and variance Σ; u i,t , x i,t , z i,t correspond to the environmental variables altitude, precipitation and temperature; n i,t the offset population size and log(ϕ i,t ) is the neighbour-driven component. An attempt to add a region-specific random-effects term in the neighbour-driven component proved computationally unfeasible.
The endemic component explains the baseline rate of cases that is persistent with a stable temporal pattern (in our case 1 month lag, l = 1). The trend parameter and sinusoidal wave of frequency in the endemic component are used to account for seasonal variation of disease incidence while the random effect term α
i
in models #c and #d is the region-specific random effect which is assumed to be an independent and identically distributed Gaussian effect with variance $\; \sigma _\nu ^2 $
. The autoregressive epidemic component (λ
i,t
) is used to capture the occasional outbreaks while the neighbour-driven spatio-temporal component (ϕ
i,t
) enables interdependency exploration between provinces via a spatial weight matrix (w
j,i
).
$\; \sigma _\nu ^2 $
. The autoregressive epidemic component (λ
i,t
) is used to capture the occasional outbreaks while the neighbour-driven spatio-temporal component (ϕ
i,t
) enables interdependency exploration between provinces via a spatial weight matrix (w
j,i
).
Multivariate models
Furthermore, we fitted a bivariate model (model 3) to the monthly numbers of malaria (mal) and leishmaniasis (les) simultaneously. In this case, equation (1) will be defined as follows: let y i,t represent the number of malaria (i = 1) and leishmaniasis (i = 2) cases at time-series t = 1, …, 12. The joint analysis of a malaria and leishmaniasis time-series model with random effects will be specified as equation (3). The conditional mean for the bivariate time-series model (M3) in general formulation is given as:
 $${\left( {\matrix{ {\mu _{{\rm mal},t}} \cr {\mu _{{\rm les},t}} \cr}} \right)} = {\left( {\matrix{ {\lambda _{{\rm mal}\; \; \; \; \; \;} \phi _{{\rm mal}}} \cr {\phi _{{\rm les}\; \; \;} \; \; \; \; \lambda _{{\rm les}}} \cr}} \right)} {\left( {\matrix{ {{\rm ma}{\rm l}_{t - 1}} \cr {{\rm le}{\rm s}_{t - 1}} \cr}} \right)} + {\left( {\matrix{ {\nu _{{\rm mal},t}} \cr {\nu _{{\rm les},t}} \cr}} \right)}.$$
The endemic component includes single seasonal terms for both ‘mal’ and ‘les’. The interdependencies between malaria and leishmaniasis is captured by ϕ mal and ϕ les, which would allow us to investigate whether malaria infections predispose leishmaniasis or vice versa. For example, to investigate whether malaria infections predispose leishmaniasis in Afghanistan, the mean of the negative binomial model will be given as:
 $${\left( {\matrix{ {\mu _{{\rm mal},t}} \cr {\mu _{{\rm les},t}} \cr}} \right)} = {\left( {\matrix{ {\lambda _{{\rm mal}}\phi} \cr {0\; \; \; \; \; \; \; \lambda _{{\rm les}\; \; \;}} \cr}} \right)} {\left( {\matrix{ {{\rm ma}{\rm l}_{t - 1}} \cr {{\rm le}{\rm s}_{t - 1}} \cr}} \right)} + {\left( {\matrix{ {\nu _{{\rm mal},t}} \cr {\nu _{{\rm les},t}} \cr}} \right)},$$
where ϕ quantifies the influence of past malaria cases on the leishmaniasis disease incidence [Reference Blanford36].
All models were implemented in R using the package surveillance [Reference Hohle39] as function hhh4 [Reference Paul, Held and Toschke42] which can be downloaded from the CRAN server at www.r-project.org. The inference for the regression parameters was based on penalized likelihood [Reference Paul and Held41]. In all models, the statistical importance of the variables was judged at 5% level of significance and a positive coefficient implies an increased incidence of the disease when the variable increases.
Model validation
In this study, the proper scoring rules were used to assess the best model. This is because there is no suitable model choice criterion available for nonlinear random-effects models and the extension of classical model choice criteria such as Akaike's Information Criterion (AIC) or Bayesian Information Criterion (BIC) to mixed models is challenging [Reference Paul and Held41, Reference Held and Paul43]. However, Held & Paul [Reference Held and Paul43] noted that asymptotically AIC and the cross-validated logarithmic score are equivalent while BIC corresponds to the logarithmic score of the one-step-ahead predictions of the complete data.
A proper scoring rule measures the differences between the actual observed value and estimated predictive values [Reference Paul and Held41, Reference Held and Paul43]. A larger proper score indicates a larger discrepancy in the predictive model. For observed value, y; let P(Y = y) and P(Y ⩽ y) denote the probability mass function and cumulative probability distribution of the negative binomial distribution respectively. The logarithm score of predictions, is given as; log S(P, y) = −log[P(Y = y)] which is sensitive to extreme cases (it penalizes low probability). Similarly, a less sensitive scoring rule, the rank probability score (RPS) is given as; ${\rm RPS}\left( {P,y} \right) = \mathop \sum \nolimits_{k = 0}^\infty \left[ {P\left( {Y \le y} \right) - 1\left( {y \le k} \right)} \right]^2$
.
${\rm RPS}\left( {P,y} \right) = \mathop \sum \nolimits_{k = 0}^\infty \left[ {P\left( {Y \le y} \right) - 1\left( {y \le k} \right)} \right]^2$
.
We computed the mean scores over a set of predictions based on probabilistic one-step-ahead predictions (the model needs to be re-fitted at each time point). Finally, a Monte Carlo permutation test was used to evaluate mean scores between two models by testing the statistical significance of the observed difference between mean scores from two different models using 9999 random permutations. The Monte Carlo P value is calculated as:
 $$\matrix{\hbox{no. of differences larger than observed difference} \cr \left( \hbox{in absolute value} \right)+{1}}\over \hbox{no. of permutations + 1}$$
RESULTS
Preliminary data analysis
In this study, we used the following environmental and climatic factors: altitude (metres), cumulative rainfall (mm) and maximum temperature (K) to simultaneously explain the incidence of malaria across the provinces of Afghanistan.
Temporal variation
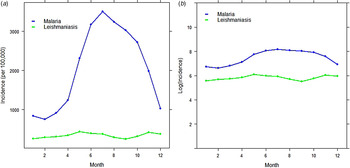
The analysis was begun by exploring the temporal pattern of the monthly cases of malaria and leishmaniasis separately. Figure 7(a, b) shows the time-series plot of the provincial-level aggregated montly incidence of malaria and leishmaniasis diseases per 100 000, as well as the plot of the log-transformed national aggregated monthly incidence of both diseases. Although the monthly profile of leishmaniasis revealed two peaks in the disease occurrence – June to July and November to January – which coincides with summer and winter, respectively, the June–July peak is more obvious and occurred in the same period as malaria. The malaria plot also showed a strong seasonal pattern with high disease incidence in the summer (June–August).
Time-series plot of (a) the provincial level and aggregated monthly incidence of malaria and leishmaniasis diseases (per 100 000), (b) log-transformed provincial level aggregated monthly incidence of malaria and leishmaniasis in Afghanistan.
Spatial variation and hotspot analysis
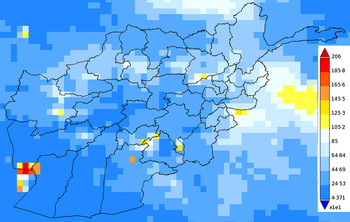
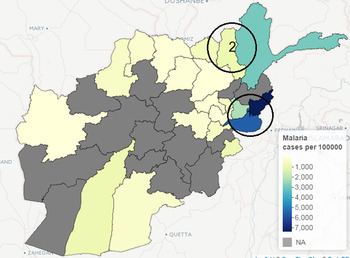
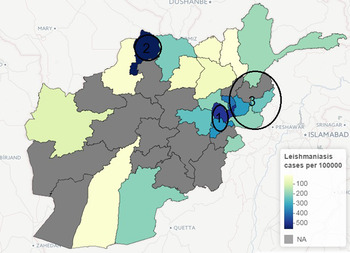
The incidence of leishmaniasis occurred in < 1% of the population except in Kabul province in 2009, with about 2% of the population infected with the disease. Kabul city accounted for >50% of the total new cases of leishmaniasis in 2009, although this may be attributed to availability of healthcare facilities, which is crucial for data gathering in public health studies. Similarly, geographical heterogeneity was observed in the crude counts of malaria across provinces; cases of P. vivax malaria are more prevalent in the province of Nangarhar (43·2% of all cases), followed by Kunar (13·8%) and Badakhshan (8·5%). (See Supplementary Appendices 1–4 for the individual time-series of province level data for both malaria and leishmaniasis.) Geographical disparity in the occurrence of malaria and leishmaniasis in Afghanistan were noted in Figures 8 and 9 (clusters were detected by SaTScan analysis). Malaria incidence shows a clear pattern and six provinces form two geographical clusters (Fig. 8). The first cluster is located in the Eastern part, with a relative risk of 10·79, which comprises Kunar, Nangarhar and Laghman province, while the second cluster is located in the northeastern region. Three geographical clusters (hotspots) were confirmed for leishmaniasis. Higher incidences of leishmaniasis were observed around Kabul area (hotspot 1), northwestern (hotspot 2) and eastern (hotspot 3) regions of Afghanistan (Fig. 9). The relative risk for Kabul and Logar was 5·013, the highest in the three hotspots. Although the hotspot analysis indicates that similar disease clusters exist for malaria and leishmaniasis, especially in the eastern part of the country, the relative risk of malaria (10·79) is higher than that of leishmaniasis (1·15) in this region.
Map of Afghanistan showing hotspots of new malaria cases (per 100 000) in 2009.
Map of Afghanistan showing hotspots of new leishmaniasis cases (per 100 000) in 2009.
Univariate analysis
It is natural to model disease incidence at each location as a Poisson count. However, as mentioned above, there is the possibility of overdispersion of malaria and leishmaniasis incidences across different locations. Therefore, we began the analysis by assessing the appropriateness of the NegBin model rather than a Poisson model by fitting a basic model with only fixed effects parameters to the malaria data and leishmaniasis data separately. The Poisson model (ψ = 0) provides a poorer fit with an AIC of 21573·29 against the NegBin model (model 1a) with AIC = 3248·06 and ψ = 1·425 (s.e. = 0·116). We then fitted models 1 and 2 to the data following the specification described in equation (2).
For the univariate analysis of the malaria, the results showed that model 1a gave poor prediction based on probability score. The inclusion of random intercept in the endemic component in model 1c improved the model fit. After adding explanatory variables to model 1c (to form model 1d), model 1d provided a better fit based on probability score and Monte Carlo P value than model 1c. Model 1d included autoregression, a seasonal random-effect term as well as environmental variables. Similarly, based on the univariate analysis of the leishmaniasis data, the best model (model 2d) according to probability score (and Monte Carlo P value) included autoregression, environmental variables and random-effect term in the endemic component. The environmental covariates, precipitation and temperature were statistically informative for the risk of transmission of malaria, while altitude and temperature were important for leishmaniasis. As shown in Tables 1 and 2, the best-fitting model for the malaria data (model 1d) indicates that the seasonal variation, measured by υ
i,t
, has significant effect on malaria incidence while the dependency on the cases in the previous month can be explained by precipitation and temperature (λ
i,t
). Although, the $\overline {{\rm log\;} S} $
value for model 1b is lower than that of model 1d, we based our model assessment on the
$\overline {{\rm log\;} S} $
value for model 1b is lower than that of model 1d, we based our model assessment on the $\overline {{\rm RPS}} $
value which has been shown to have clear advantages over other scoring rules [Reference Boero, Smith and Wallis44].
$\overline {{\rm RPS}} $
value which has been shown to have clear advantages over other scoring rules [Reference Boero, Smith and Wallis44].
Results from univariate analysis of malaria disease in Afghanistan 2009 with standard errors
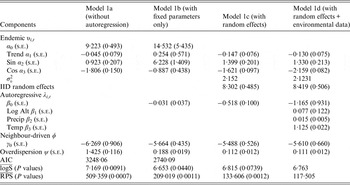
IID, Independent and identically distributed; AIC, Akaike's Information Criterion.
In the rows for $\overline {{\rm logS}} $
and
$\overline {{\rm logS}} $
and $\overline {{\rm RPS}} $
measures, the Monte Carlo P values give comparisons of malaria models 1a–1c to the best model (model 1d) based on permutation tests for paired observations (9999 permutations).
$\overline {{\rm RPS}} $
measures, the Monte Carlo P values give comparisons of malaria models 1a–1c to the best model (model 1d) based on permutation tests for paired observations (9999 permutations).
Results from univariate analysis of leishmaniasis disease in Afghanistan 2009 with standard errors
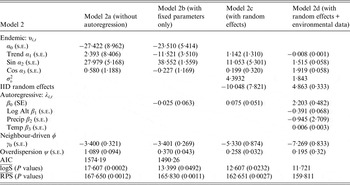
IID, Independent and identically distributed; AIC, Akaike's Information Criterion.
In the rows for $\overline {{\rm logS}} $
and
$\overline {{\rm logS}} $
and $\overline {{\rm RPS}} $
measures, the Monte Carlo P values give comparisons of leishmaniasis models 1a–1c to the best model (model 1d) based on permutation tests for paired observations (9999 permutations).
$\overline {{\rm RPS}} $
measures, the Monte Carlo P values give comparisons of leishmaniasis models 1a–1c to the best model (model 1d) based on permutation tests for paired observations (9999 permutations).
Multivariate analysis
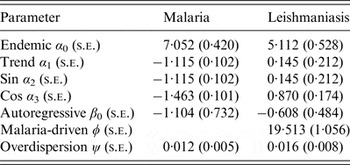
Until now, separate univariate models have been fitted to malaria and leishmaniasis. Joint models for malaria and leishmaniasis was introduced via the bivariate time-series model. A number of candidate models are fitted based on different interdependencies structure [e.g. in equation (5)]; however, the model that includes the influence of past malaria cases (lag of 1 month) on the incidence of leishmaniasis has the best fit with the smallest AIC = 286·93. The model allows the investigation of whether malaria infections predispose leishmaniasis disease. The model consists of two fitted means μ mal,t and μ les,t . Table 3 shows the results from the bivariate model that indicates the effect of past malaria cases on the incidence of leishmaniasis. The mean μ mal,t can be separated into two additive components: an endemic and autoregressive components for the malaria data while the mean μ les,t can be separated into an endemic, an autoregressive and a malaria-driven component for the leishmaniasis data. The model suggests that there is an association between malaria disease and leishmaniasis with ϕ = 19·513 which quantifies the influence of past malaria cases on the leishmaniasis disease incidence.
Bivariate analysis of malaria and leshmaniasis disease in Afghanistan 2009
DISCUSSION
This project represents the first study to investigate the association between the incidences of malaria and leishmaniasis in Afghanistan and identify the risk factors associated with these two diseases. Three classes of flexible statistical models were presented. First, two univariate models which were fitted to malaria and leishmaniasis data separately were used. Then bivariate models for simultaneously modelling of the dependency between malaria and leishmaniasis incidence was conducted.
Often, there exist geographical and temporal variations in the incidence of vector-borne diseases; these vector pathogens are often affected by a multitude of factors, some of which are climatic variables (abiotic) and others are human activities such as farming [Reference Hay33, Reference Rogers34, Reference Adegboye and Kotze37]. The relationship between infectious disease incidence and climatic variables is complex [Reference Adimi4, Reference Kiang35, Reference Blanford36]. Some studies have argued that the precise shape of the relationship is questionable [Reference Adegboye and Kotze32, Reference Kiang35].
For the univariate models, the environmental covariates, precipitation and temperature, were statistically informative for the risk of malaria, while altitude and temperature were important for leishmansiasis. Failure to find effects of precipitation as significant risk factor in the transmission of leishmaniasis may be a result of data aggregation. Perhaps weekly environmental data would provide more information than monthly data in the case of short-term variations. In the best fitting model for the malaria data (model 1d), the seasonal variation, measured by υ i,t , showed a significant effect, while dependency on the number of cases in the previous month was explained by precipitation and temperature. Similar to leishmaniasis disease, there was a significant effect of the influence of adjacent regions on malaria incidence. The outbreak size of leishmaniasis in the previous month is associated with altitude and temperature (model 2d).
Environmental and climate risk factors, such as temperature, precipitation and altitude, play a major role in spreading both diseases in the studied areas. Harsh environment in the studied areas may lead to over exposure of the population to these two diseases. Precipitation is an important environmental factor for the transmission of leishmaniasis and malaria because it directly affects their vectors. For example, rodents are natural hosts of ZCL and their associated activities with the sand-fly vector is directly linked to the surge in the occurrence of human ZCL [Reference Faulde45]. The vectors flourish in areas with high annual precipitation which provide a suitable environment [Reference Fathy, El-Kasah and El-Ahwal46]. Precipitation has also been described to provide the greatest contribution in defining the potential distribution of the sand fly [Reference Abdel-Dayem47]. It is not surprising that areas with high precipitation are known for farming, which in turn provides shelter for rodents and hence an ideal habitat for sand flies which are natural hosts of ZCL [Reference Fathy, El-Kasah and El-Ahwal46]. Similarly, precipitation also means that a small body of water can easily serve as a habitat for infective mosquitoes and breeding sites, which consequently increases the transmission of malaria. In Afghanistan, the northern region is known for rice farming [Reference Faulde48] and the same bodies of water are often used for irrigation throughout the year.
Our findings show an increase in precipitation has a positive effect on malaria; however, precipitation has no significant effect on leishmaniasis. One explanation for a non-significant effect of precipitation on leishmaniasis is that intense rainfall (>37·34 mm) can negatively affect the incidence of ZCL [Reference Toumi49] due to flooding of rodent burrows [Reference Chalghaf50].
The effect of temperature is key to the survival and lifespan of sand flies [Reference El-Shazly51]. Low temperatures negatively affects their longevity [Reference Chalghaf50] as well as high temperatures [Reference El-Shazly51]. Poor housing and poor sanitary conditions are common risk factors for ACL because they can serve as breeding and resting sites for the disease vectors [Reference Salam, Al-Shaqha and Azzi27], thereby protecting them from extreme temperatures. Similarly, extreme temperatures (especially <24 °C and >33°C) can hinder the breeding of malaria vector [Reference Mordecai52, Reference Gilioli and Mariani53]. At that temperature level, it is unsuitable for their survival or larval and incubation duration [Reference Sachs and Malaney54]. The relationship between altitude and malaria/leishmaniasis is associated with their vectors. Altitude has been described as being closely related to temperature, rainfall and vegetation [Reference El-Shazly51]. At higher altitudes, the temperature is lower, precipitation increases and vegetation changes [Reference Chalghaf50].
There are a number of limitations to this study; the use of monthly provincial-level aggregated data reduced the number of time points for the data counts, thereby making it difficult to model the seasonal variation adequately. Moreover, the exact dates of infections are unknown, which may affect autocorrelation. Additionally, one of the limitations of conducting a national-level research on malaria and leishmaniasis in Afghanistan is the availability of long-term data. Despite these data limitations, our study provides extensive information that can supplement patient-specific studies to assess the effect of previous malaria cases on leishmaniasis and to understand and quantify the impact of environmental risk factors. We were able to formulate models that could be used for short-term forecasting using 12-month incidence data from Afghanistan.
The study of malaria and leishmaniasis is of paramount importance in public health study of parasitic infections. The two diseases are currently two of the major causes of mortality and morbidity among human parasitic infections, with an enormous social and economic impact [Reference Marques18]. The current study shows an association between the incidence of malaria and leishmaniasis incidence in the studied areas of Afghanistan. The hotspot analysis indicates that there is one hotspot in common between the two diseases (cluster 1 for malaria and cluster 3 for leishmaniasis) while the other clusters occurred in different provinces. The geographical overlap of the two diseases may be a result of the two major parasitic diseases overlapping geographically and, more importantly, it may be due to the fact that the two diseases are co-infected within the same patients [Reference van den Bogaart16, Reference van den Bogaart17].
Findings in this study suggest that people living in areas with malaria are at increased risk for leishmaniasis infection. This is in agreement with other studies that state concomitant Plasmodium infection seems to increase the susceptibility to leishmaniasis [Reference Marques18]. Moreover, previous studies has found patients suffering from malaria infections exhibit the presence of Leishmania parasites in their body [Reference Ab Rahman and Abdullah55] or vice versa [Reference van den Bogaart16, Reference van den Bogaart17]. The outcome of malaria infections can be altered according to the Leishmania species involved [Reference Pinna19]. When both malaria and leishmaniasis are present in humans, it affects the disease outcome and progression of disease due to the modulation of the immune response [Reference Marques18, Reference Pinna19].
The adaptability of the parasitic vectors has allowed malaria and leishmaniasis to spread into new and different environments [Reference Claborn56]. This issue will require increased efforts in the fields of urban entomology, civil engineering, disease surveillance and tropical urban ecology in order to address the continued spread of this disease. Given the geographical overlapping of endemic areas of both malaria and CL cases, the study highlights the presence and importance of environmental factors such as altitude, temperature and precipitation. Clinical concerns arise when the two diseases co-occur in the same patients or have similar transmission route. This may produce different symptoms and conditions along with increased mortality risk, possibly associated with inappropriate treatment. Local healthcare authorities should consider the co-infection problem by recommending systematic leishmaniasis screening for all malaria patients or vice versa in endemic areas.
SUPPLEMENTARY MATERIAL
For supplementary material accompanying this paper visit https://doi.org/10.1017/S0950268816002764.
ACKNOWLEDGEMENTS
The authors thank Sebastian Meyer and Michael Höhle for their helpful suggestions on package surveillance. We also thank the three anonymous reviewers for suggestions and comments to improve the manuscript. Special thanks go to Sarah Campion for her editorial feedback and careful reading of the manuscript.
DECLARATION OF INTEREST
None.


