

Introduction
Financial literacy refers to the knowledge and skills that individuals have about financial concepts, such as interest compounding, inflation, and risk diversification, and it is positively associated with better financial decision-making. Several studies have shown that individuals with higher levels of financial literacy are more likely to save, invest, and manage debt effectively: in a seminal paper, Lusardi and Mitchell (Reference Lusardi and Mitchell2011) found that individuals with higher levels of financial literacy are more likely to plan for retirement, and Jappelli and Padula (Reference Jappelli and Padula2013) showed that financial literacy is positively associated with higher savings rates. In addition to improving financial decision-making, financial literacy has also been linked to better overall financial well-being. For example, financially literate individuals are able to develop budgeting strategies and avoid falling into debt traps, make plans and follow them, anticipate future needs and possible unexpected expenses, and choose insurance and credit according to their needs and circumstances (Lusardi and Mitchell, Reference Lusardi and Mitchell2014). Financial literacy is associated with higher levels of financial market participation (van Rooij, Lusardi and Alessie, Reference van Rooij, Lusardi and Alessie2011), and investors with a low level of financial literacy often do not invest in risky assets at all (Calcagno and Monticone, Reference Calcagno and Monticone2015). Furthermore, financial knowledge is relevant to public decisions, too. Indeed, financially literate individuals are more willing to accept pension reforms (Oggero et al., Reference Oggero2023), and financial knowledge can reduce the political costs of such reforms (Fornero and Lo Prete, Reference Fornero and Lo Prete2019, Reference Fornero and Lo Prete2023). Also, financial literacy has the potential to reduce income and wealth inequalities (Gallo and Sconti, Reference Gallo and Sconti2023). Despite the importance of financial literacy, many individuals lack the necessary education and skills to effectively manage their finances.
Our paper investigates the extent to which individuals in Italy are knowledgeable about economics and finance using the Big Three financial literacy questions. According to a study by the OECD (2020a), Italy has a relatively low level of financial literacy compared to other European countries: the share of subjects who in 2020 recorded a knowledge score judged sufficient by the OECD – a score of 5 or more out of 7 – was 44.3%. This is lower than the OECD average of 57%. The data from the Standard & Poor’s Ratings Services Global Financial Literacy Survey (Global Finlit Survey) show that only 37% of Italians correctly understand basic financial concepts (Klapper and Lusardi, Reference Klapper and Lusardi2020). Fornero and Monticone (Reference Fornero and Monticone2011), using data from the Bank of Italy’s Survey on Household Income and Wealth, also show that the level of financial knowledge in Italy is low and varies a lot across regions.
Our analysis is facilitated by a new dataset of 5,000 Italian adults collected by BVA Doxa in collaboration with the Italian Financial Education Committee. These timely data offer the opportunity to look at recent data on financial literacy and the relationship between financial literacy and financial well-being, including across a range of population subgroups, after the COVID-19 crisis.
Our contribution to the literature is threefold. First, we use new data that provide unique information on financial knowledge and subjective well-being of Italian households. Second, we investigate the relationship between financial knowledge and resilience in the Italian context and into the COVID-19 pandemic. Third, we tackle the endogeneity issue in financial literacy by performing an instrumental variables estimation based on the approach developed by Lewbel (Reference Lewbel2012) that exploits heteroskedasticity in mismeasured or endogenous explanatory variables to construct instrumental variables.
We show that financial literacy is low in Italy, only 44% of Italians answer all the Big Three correctly, and there are significant gaps across demographic groups: a large majority of individuals fails to understand basic financial concepts, and the lack of knowledge is most acute for less-educated, female, and younger individuals. This is even more evident in the case of inflation, which is a fundamental concept to master for everyday financial and economic decisions in the current context of increases in prices.
Our results support the hypothesis that financial literacy can be considered an enabling factor for financial resilience. Indeed, those who have this basic financial know-how have greater financial resilience and are less likely to become overindebted.
In what follows, we first offer an overview of the new dataset used in the analysis. In Section 2, we describe the key questions on financial literacy and individuals’ responses both in the total sample and across demographic groups. Section 3 provides a multivariate analysis linking financial literacy to measures of financial resilience and overindebtedness. Section 4 concludes the paper.
Data Overview
In 2020, the Italian Financial Education Committee commissioned, for the first time, a national survey to gauge the financial knowledge and capability of Italian households. The survey is conducted online by BVA Doxa, normally during the months of April and May, and is representative of individuals older than 18 years of age and who are responsible for the management of household finances and/or are the most knowledgeable person about financial matters. It is a longitudinal survey following individuals over time. To improve the representativeness of the sample, the data are weighted for age, municipality size, region, education, presence of children, income, and employment status (Comitato per la programmazione e il coordinamento delle attività di educazione finanziaria, 2022).
The survey was repeated every year since 2020, and, in this study, we use the latest wave collected in June 2022. Some of the respondents in our sample (3,439 individuals) were already surveyed in previous waves, so that a portion of the dataset is longitudinal, but the sample is refreshed to keep the sample size at around 5,000 respondents. The 2022 dataset we use here provides a unique source of information on families’ financial knowledge and resilience in Italy. Descriptive statistics for the variables used in our work are provided in Table A1 in the Appendix. We note that employed individuals are overrepresented: the unemployment rate in our sample is 4%, as shown in Table A1 in the Appendix, while it was close to 8% in Italy over the same period.
Financial Literacy in Italy
To measure individuals’ level of financial knowledge, the survey asked the “Big Three” questions by Lusardi and Mitchell (Reference Lusardi and Mitchell2011, Reference Lusardi and Mitchell2014) that allow us to assess respondents’ understanding of basic concepts, such as knowledge of interest rate, inflation, and risk diversification. As described in Lusardi and Mitchell (Reference Lusardi and Mitchell2011), the first two questions indicate whether respondents have command of basic concepts related for example to saving, while the third question evaluates knowledge of risk diversification, relevant to making informed investment decisions. The exact wording of the financial literacy questions is as follows:
Understanding of Interest Rate
“Suppose you had €100 in a savings account that pays an interest rate of 2% per year and has no charges. After 5 years, how much do you think you would have in the account if you left the money to grow?”
-
(a) More than €102
-
(b) Exactly €102
-
(c) Less than €102
-
(d) Do not know
Understanding of Inflation
“Suppose you had €100 in a savings account that pays an interest rate of 1% per year and has no charges. Imagine that the inflation was 2% per year. After 1 year, how much would you be able to buy with the money in this account?”
-
(a) More than today
-
(b) Exactly the same
-
(c) Less than today
-
(d) Do not know
Understanding of Risk Diversification
“Do you think that the following statement is true or false? ‘Investing €1,000 in stocks of a single company usually is less risky than investing €1,000 in stocks of 10 different companies.’”
-
(a) True
-
(b) False
-
(c) Do not know
We should note that the question about risk diversification is different than the one used in the original Big Three, and comparisons across datasets should take this difference into consideration.
Table 1 reports the answers to the Big Three questions in the full sample (column 1) and the subsample of individuals aged 25–65 years (column 2). The first panel shows that the concept people know the most is interest rate: 71% of respondents answer the question correctly, and the percentage is slightly lower among individuals aged 25–65 years. This percentage is much higher than the one found in a previous study that used 2006 data collected by the Bank of Italy (Fornero and Monticone, Reference Fornero and Monticone2011).Footnote 1 Yet, even though the question is fairly basic, one-fifth (20%) of the sample selected the wrong answers. The percentage of correct answers decreases when considering the understanding of inflation: only about two-third (67%) of respondents answered this question correctly, while 19% got the question wrong. The proportion of “Do not know” answers is 14%, which is higher than for the question about the interest rate (9%). The percentage of correct answers is 65% among individuals aged 25–65 years, and this is the same fraction as the one found in the previous Italian study (Fornero and Monticone, Reference Fornero and Monticone2011). Although the dataset used here is different than the one used in the 2006 analysis, the lack of improvement in the understanding of inflation is worrisome given the current scenario of high inflation. Finally, the risk diversification concept is what Italians know the least, with only 64% providing correct answers to this question. Furthermore, almost one-fourth (24%) of people reported that they did not know the answer, the highest percentage among the Big Three. Besides the risk diversification concept, knowledge of stocks may be limited too. Indeed, the participation in the stock market is very low in Italy: in the early 2000s, the prevalence of direct stockholding and ownership through mutual funds was among the lowest among European countries (Jappelli and Padula, Reference Jappelli and Padula2015).
Summary statistics of the Big Three financial literacy questions (%)

Note: Distributions of responses to financial literacy questions in the full sample and for those aged 25–65 years. All figures are weighted. DK indicates respondents who do not know the answer.
Worldwide, according to the Global Finlit Survey, simple calculations of interest rates and inflation are what people know the most (Klapper and Lusardi, Reference Klapper and Lusardi2020). However, the last panel of Table 1 shows that only 55% of Italians were able to correctly answer both questions, and the share is even lower when considering individuals aged 25–65 years. In addition, almost one-third of the sample (30%) answered “Do not know” at least once. Those who correctly answered all the three questions are not even half (44%) of the sample. This percentage is only moderately higher than the one reported by the Global Finlit Survey conducted in 2014 and assessing knowledge of similar concepts. Among the major advanced economies (the G7 countries, that is, Canada, France, Germany, Italy, Japan, the United Kingdom, and the United States), in 2014, Italy was the country with the lowest financial literacy rate at 37% (Lusardi and Oggero, Reference Lusardi and Oggero2017). Eight years later, Italy still displays a low level of financial literacy.
Similar findings are provided in other surveys. For example, in 2020 (OECD, 2020a), 26 countries and economies (of which 12 OECD member countries), from Asia, Europe, and Latin America, participated in the second international survey of adults’ financial literacy competencies using the 2018 OECD/INFE toolkit. In this survey, the overall financial literacy score measures not only a set of basic financial skills but also attitudes and behaviors. The average score across participating OECD member countries was 13.0, with Italy scoring only 11.1. Importantly, it is relevant to mention that, even when considering both literacy and numeracyFootnote 2 (Kirsch, Yamamoto and Khorramdel Reference Kirsch, Yamamoto, Khorramdel and Maehler2020), which are two important components of individuals’ financial knowledge (Bottazzi and Lusardi Reference Bottazzi and Lusardi2021), measured in the OECD’s Programme for the International Assessment of Adult Competencies (PIAAC), Italy remains at the bottom of the distribution among the 35 countries surveyed. A result which is consistent with the findings reported here.
Who Knows the Least?
The level of financial literacy differs substantially across sociodemographics, and Table 2 reports the extent of such heterogeneity. The top panel of Table 2 focuses on differences across age. In our sample, 68% of the population fall into the working-age group of 36–65 years (Table A1); 65 years and above is the second-largest population group in Italy with 22.2% of the population. Younger adults (35 year or younger) represent 9.8% of the total sample in 2022. The data collected in the 2014 Global Finlit Survey and other surveys of financial literacy as well (Lusardi and Mitchell, Reference Lusardi and Mitchell2014) showed a nonlinear relation between knowledge and age: financial literacy displayed an inverted U-shaped profile, increasing at first with age and decreasing later in life (Lusardi and Oggero, Reference Lusardi and Oggero2017). Using the same age ranges considered here, Klapper and Lusardi (Reference Klapper and Lusardi2020) showed that in major advanced economies financial literacy is at its highest among individuals aged 36–50 years, while it is the lowest among people older than 65. The pattern is different in the most recent data from Italy. Table 2 shows that financial literacy correlates positively with age; it is lowest among those younger than 35 and increases progressively with age. While this is true for all the questions and the proportion of people who know the Big Three, we also note a large age gap in the knowledge of inflation, with a 24-percentage-point difference between the youngest and the oldest groups. This is probably a generational effect since older cohorts in Italy experienced high inflation in the 1970s, as we discuss in the next section. Nevertheless, it is alarming that only half (50%) of the young in Italy are knowledgeable about inflation, as the current inflationary scenario requires individuals to understand the workings of inflation, if they are to protect their savings and invest wisely. We also notice that, overall, the percentage of individuals answering “Do not know” at least once is much higher among the young (38% among individuals younger than 35 compared to 28% among those older than 65). For risk diversification, which is where also knowledge is lacking, the proportion of “Do not know” answer decreases with age, but remains high even among those older than 65. In sum, the differences in financial literacy across age point to a lack of knowledge especially among Generation Z and Millennials, who have to make economic and financial decisions that will likely have consequences for the rest of their life. In addition, today’s young generations face greater challenges due to the rise of FinTech, more complex financial products, more precarious jobs, and less generous pension systems.
Distribution of responses to financial literacy questions by age, sex, education, and employment status (%)

Note: All figures are weighted. DK indicates respondents who do not know the answer.
Previous research has documented a persistent gender gap in financial knowledge both in Italy and across countries (Bottazzi and Lusardi, Reference Bottazzi and Lusardi2021; Bucher-Koenen et al., Reference Bucher-Koenen2017; Cupák et al., Reference Cupák2018; Fornero and Monticone, Reference Fornero and Monticone2011; Lusardi and Mitchell, Reference Lusardi and Mitchell2014; Oggero, Rossi and Ughetto, Reference Oggero, Rossi and Ughetto2020). In line with the literature, Table 2 shows that not only Italian women are less likely to correctly answer the Big Three questions, but they are also much more likely to report they do not know the answer to these questions. Indeed, 25% of male respondents chose the “Do not know” option, compared to 39% of women. This gender gap is present in each of the financial literacy questions and at all ages. Bottazzi and Lusardi (Reference Bottazzi and Lusardi2021) show that not only Italian students score particularly low on the financial literacy assessment but Italy is the only country, among those that participated in the 2012 PISA assessment, that displays a gender difference in the average financial literacy score.Footnote 3
We find that this gap is highest for the question about inflation, where 21% of women reported they did not know the answer compared to 10% of men. Moreover, the proportion of “Do not know” is particularly high for the risk diversification question: more than 30% of women stated they did not know the answer to this question.
Finally, both the level of education and the employment status are correlated with individuals’ financial knowledge. Among those without a high school diploma, only 39% are able to answer all questions correctly, and almost the same percentage (37%) chose the “Do not know” option at least once. In contrast, more than half (56%) of those with a master degree correctly answered the Big Three, a percentage that is nevertheless low if we consider that these are highly educated people. The difference in financial literacy is even stronger across employment status. The unemployed are those who did worse, with less than one-third (30%) answering correctly the Big Three. The retired are more likely to correctly respond to all the questions, and this may also reflect the differences by age discussed above. Among workers, the self-employed are more likely to correctly answer all the questions, with 53% financially literate individuals compared to only 40% among employees.
These findings are consistent with results from other studies (Lusardi and Mitchell, Reference Lusardi and Mitchell2014), showing that gaps in financial literacy seem to persist over time and across countries.
The Knowledge of Inflation in Italy
We have shown in Table 2 that the knowledge of inflation is particularly low among the young and increases with age. Indeed, there is a significant age gap between the young and the old. This is probably a generational effect since older cohorts in Italy experienced a high level of inflation in the 1970s and 1980s. Figure 1 shows that the 1970s and 1980s were characterized, due to two oil shocks, by inflation above 20% in Italy. Hence, households had to learn how to cope with inflation. Interestingly, if experience leads to higher knowledge of inflation we should expect women, who deal with inflation in everyday life more than men, given the traditional family structure in Italy, to provide the right answer more frequently. Women are more likely to be the primary shopper within their household, and research has shown that gender differences in inflation expectations disappear once one controls for who is primarily responsible for the shopping (Weber et al., Reference Weber2022). However, the knowledge of inflation is lower among Italian women with respect to men.
Inflation consumer price for Italy 1960–2022.
Source: FRED, St. Louis Fed.
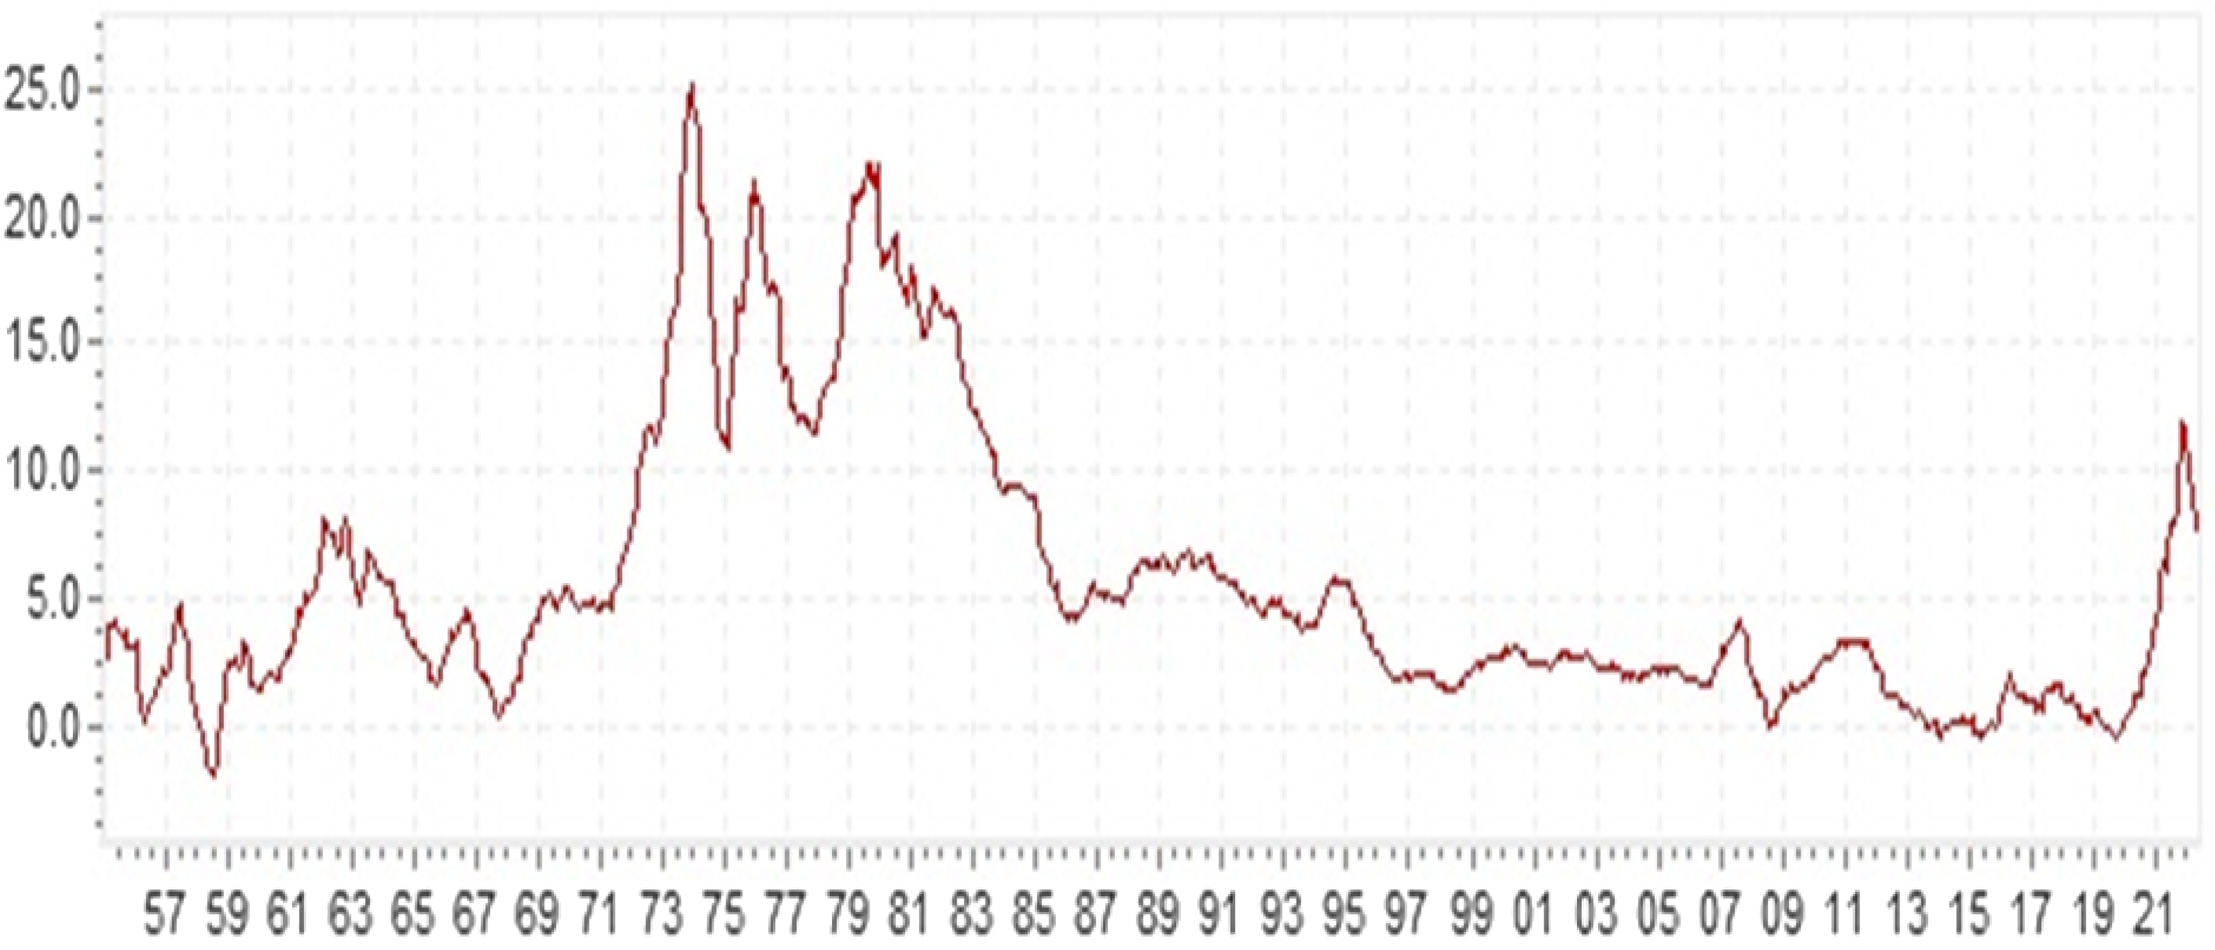
Table 2a provides a multivariate analysis of the question about inflation. Indeed, this concept is relevant for everyday financial and economic decisions in the current context of increases in prices. The multivariate analysis confirms that educational attainment is positively related to the knowledge of inflation, that women are significantly less likely to correctly answer the inflation question, and the self-employed are 10 percentage points more likely to choose the correct answer. The effect of age is also statistically significant at the 10% level. Thus, differences in knowledge persist even when considering all of the demographic variables together.
Determinants of knowledge of inflation

Note: Estimates use sample weights. The dependent variable is a dummy variable taking value 1 if the respondents correctly answered to the inflation question. The reference categories are male, <high school, and employee. Robust standard errors in parentheses. *** p < .01, ** p < .05, * p < .1.
Regional Differences
A specific characteristic of Italy is the large differences in financial literacy across regions. The first financial literacy assessment of the OECD’s Programme for International Student Assessment (PISA) on 15-year-olds in Italy showed sharp regional differences in financial knowledge (Bottazzi and Lusardi, Reference Bottazzi and Lusardi2021). In 2012, Italy’s performance in financial literacy was below the average of the OECD countries that participated in the assessment. However, this was not true for the whole country, as the difference between the best-performing regions (Friuli Venezia Giulia and Veneto) and the worst-performing one (Calabria) was larger than one proficiency level out of five (OECD, 2014a), so regions would rank very differently than the national average.
The figures reported in Table 3 show large regional differences in financial literacy among adults, too. The overall results on the Big Three questions also confirm the regional ranking found in the PISA financial literacy assessment (OECD, 2014b). Table 3 shows that the macro-region with the highest share of financially literate people is the North-East (51%), followed by the North-West (48%) and the Centre (44%). Individuals in Southern Italy and the islands are those who perform worse in each question and overall: only 38% of respondents in those regions were able to correctly answer all the Big Three questions. Comparing the correct responses to the Big Three across macro-regions, the risk diversification question remains the most difficult, with only 56% of respondents in the South and Islands giving the correct answer (vs. 65% in the Centre, 67% in the North-West, and 71% in the North-East).
Distribution of responses to financial literacy questions by macro-region (%)

Note: All figures are weighted. DK indicates respondents who do not know the answer.
These results depict a worrisome picture in terms of geographical disparities, with respondents in southern regions performing consistently worse in each of the Big Three questions. As regional differences are so large, interventions to increase financial literacy are of utmost importance. The coordination of such interventions at the national level should focus on reaching all regions, from North to South.
Does Financial Literacy Matter?
Main Results
The survey not only provides information on respondents’ sociodemographics and financial knowledge but also measures of well-being, such as measures of financial resilience and overindebtedness. Specifically, the survey asks respondents to evaluate their debt burden and their capacity to face financial shocks. Financial resilience is measured by assessing whether individuals would be able to come up with €2,000 in one month in case of a financial emergency. This is the metric by Lusardi, Schneider, and Tufano (Reference Lusardi, Schneider and Tufano2011) using US data; the $2,000 amount was chosen to be reflective of a mid-size shock that households could face in their everyday life, such as a car repair or the out-of-pocket cost for a medical emergency. Individuals have a 30-day time span to come up with €2,000 and note that the questions allow for different resources and methods people could resort to in case of need. The exact wording of the question is as follows:
“How confident are you that you could come up with €2,000 if an unexpected need arose within the next month?”
-
(a) I am certain I could come up with €2,000
-
(b) I could probably come up with €2,000
-
(c) I could probably not come up with €2,000
-
(d) I am certain I could not come up with €2,000
-
(e) Do not know
As in Lusardi, Schneider, and Tufano (Reference Lusardi, Schneider and Tufano2011), respondents who report they certainly or probably could not come up with the amount in one month are defined as financially fragile. In our sample, 25.7% of individuals can be classified as financially fragile. Using US data, Hasler, Lusardi, and Oggero (Reference Hasler, Lusardi and Oggero2018) showed that financial fragility is both an indicator of lack of assets and high levels of debt.
The second measure of subjective well-being we use is related to respondents’ perception of their level of indebtedness. It was originally designed by Lusardi and Tufano (Reference Lusardi and Tufano2015), and it represents a good proxy for financial distress. The exact wording of the question is as follows:
“How strongly do you agree or disagree with the following statement: ‘My household has too much debt right now.’ Please give your answer from a scale from 0 to 5, where 0 = we do not have any debt, 1 = strongly disagree, 3 = neither agree nor disagree, and 5 = strongly agree.”
In our case, respondents are classified as overindebted if they agreed/strongly agreed or neither agreed or disagreed that there might be a problem with debt.Footnote 4 We notice that in the Italian context, 34.6% of individuals report excessive debt.
We turn next to the relationship between financial literacy and financial fragility and overindebtedness. First, in Table 4, we report a simple classification of the answers to the Big Three questions across these measures of financial well-being. The first two columns of Table 4 show that those who are more financially literate are less likely to be financially fragile. The percentage of financially literate individuals is almost double among the nonfinancially fragile individuals (52% compared to 27%). The results are similar if we compare respondents who stated they are overindebted versus those who are not, as shown in the last two columns of Table 4. The percentage of correct answers is lower among the individuals who agreed/strongly agreed they have too much debt or neither agree nor disagree with the statement. Finally, only 35% of overindebted respondents correctly answered the Big Three questions, compared to 50% of the rest of the sample.
Financial literacy of financially fragile, not financially fragile, overindebted, and not overindebted respondents (%)

Note: All figures are weighted. DK indicates respondents who do not know the answer. Respondents are classified as financially fragile if they answered they certainly or probably could not come up with €2,000, in response to the question: “How confident are you that you could come up with €2,000 if an unexpected need arose within the next month?” Not financially fragile individuals are those who reported they certainly or probably could not come up with €2,000. Those who answered “I do not know” to the financial fragility question are excluded from the first two columns. Respondents are classified as overindebted if they answered 3, 4, or 5 to the question: “How strongly do you agree or disagree with the following statement: ‘My household has too much debt right now,’” where 0 means “we do not have any debt,” 1 means “strongly disagree,” 3 means “neither agree nor disagree,” and 5 means “strongly agree.”
To better explore financial literacy and whether it matters for financial well-being, we perform multivariate analyses. In particular, we investigate whether financial literacy continues to be associated with financial fragility and perceived overindebtedness, even after controlling for many sociodemographic characteristics. The three measures of financial literacy we use are (1) a dummy that takes the value 1 if the respondent answers all the Big Three questions correctly, (2) the number of correct answers to the financial literacy questions, and (3) dummies for each correct answer to the financial literacy questions. Following Lusardi and Mitchell (Reference Lusardi and Mitchell2011), we use a set of demographic controls, including age, gender, educational attainment, income quartiles (based on income classes), employment status, and the presence of children in the household. Moreover, we control for home ownership, income shock – which is measured by having experienced a decrease in income since the beginning of the pandemic – and for macro-regions, given the wide differences mentioned earlier.
Table 5a reports the OLS estimates of a linear probability model for financial fragility. The dependent variable is a dummy taking the value 1 for those who reported they could probably or certainly not come up with €2000, and 0 for those who said they could probably or certainly do so. In all the three specifications, the coefficients on financial knowledge are negative and statistically significant. Even accounting for many determinants of financial fragility, financial literacy matters. The first column shows that those who correctly answered the Big Three questions are 13 percentage points less likely to be financially fragile. The second column shows that one additional correct answer is associated with a 6-percentage-point lower probability of being fragile. Finally, what seems more relevant for this indicator of financial well-being is knowledge of interest rate and risk diversification.
OLS estimates of financial fragility on financial literacy

Note: Estimates use sample weights. The dependent variable is a dummy variable taking value 1 if the respondents answered they certainly or probably could not come up with €2,000, in response to the question: “How confident are you that you could come up with €2,000 if an unexpected need arose within the next month?” The variable takes value 0 for those who reported they certainly or probably could not come up with €2,000. Those who answered “I do not know” are excluded from the sample. Mean value of the dependent variable financial fragility is .257. The reference categories are male, <high school, income 1st quartile, and employee. Robust standard errors in parentheses. *** p < .01, ** p < .05, * p < .1.
Other factors that decrease the probability of financial fragility are higher income and home ownership. Instead, having children and experiencing income shocks increase financial vulnerability. Also, women and the unemployed are more likely to be financially fragile. We highlight that financial literacy is statistically significant even after controlling for education, meaning that financial knowledge has additional explanatory power above and beyond general education. Notably, in all specification we control for macro-area as we showed, in Section 2.4, that macro-area differences in financial literacy scores are huge. These macro-area variables turn out not to be statistically significant in all specification, but their inclusion decreases the effect of financial literacy scores on financial fragility by 2.2–2.5 percentage point depending on the score considered.Footnote 5
Estimation results for perceived overindebtedness are reported in Table 5b. The dependent variable is a dummy variable taking the value 1 when individuals declare that they agree, strongly agree, or neither agree nor disagree with the statement “My household has too much debt right now,” and 0 means no debt or that individuals disagree/strongly disagree with that statement. The three columns show that financial literacy is negatively related to reports of excessive debt. In particular, those who know the Big Three are 10 percentage points less likely to be overindebted, and one additional correct answer is associated with a 5-percentage-point lower likelihood of reporting excessive debt. Finally, Table 5b shows that respondents are more likely to report having too much debt if they have experienced a drop in income and have kids. Interestingly, age matters and we notice a non-linear relationship between age and having excessive debt: the probability of having excess debt increases with age but at a slower pace. Highly educated and home owner have a lower probability of overindebtedness. Additionally, what column three shows is that, when it comes overindebtedness, knowledge of interest rate is what matters most.Footnote 6 Finally, macro-area fixed effects are not statistically significant in all specifications, but their inclusion decreases the effect of financial literacy on overindebtedness by 2–3 percentage points depending on the score considered.
OLS estimates of overindebtedness on financial literacy

Note: Estimates use sample weights. The dependent variable is a dummy variable taking value 1 if the respondents answered 3, 4, or 5 to the question: “How strongly do you agree or disagree with the following statement: ‘My household has too much debt right now,’” where 0 means “we do not have any debt,” 1 means “strongly disagree,” 3 means “neither agree nor disagree,” and 5 means “strongly agree.” Mean value of the dependent variable overindebtedness is .346. The reference categories are male, <high school, income 1st quartile, and employee. Robust standard errors in parentheses. *** p < .01, ** p < .05, * p < .1
Robustness
As many authors have noted, financial literacy might be a choice variable, for example, people may invest in financial literacy to avoid being financially fragile or having problems with debt. Moreover, financial literacy could be measured with errors (see the discussion in Lusardi and Mitchell, Reference Lusardi and Mitchell2011, Reference Lusardi and Mitchell2014). To tackle these issues, we perform instrumental variables estimation. Unfortunately, valid instruments are difficult to find in our dataset. In the absence of traditional instruments, we address these issues using an approach developed by Lewbel (Reference Lewbel2012)Footnote 7 that exploits heteroskedasticity in mismeasured or endogenous explanatory variables to construct instrumental variables. Essentially, Lewbel’s IV strategy uses the heteroskedasticity of the first-stage regression and all or a subset of the exogenous regressors to construct instruments variablesFootnote 8 . Lewbel estimator replaces traditional exclusion restrictions with assumptions about the covariance of the exogenous variables with the error terms. These assumptions can be tested using familiar first-stage F-statistics which we report in the tables, together with the Hansen J-tests that do not reject the validity of using the full set of exogenous variables to construct instruments in the equations for financial literacy and overindebtedness. We use fewer instruments in the equation for financial literacy and financial fragility, by excluding measures of individuals’ income and home ownership as the Hansen J-test tends to reject the validity of the instruments when using the full set of exogenous variables.
While the OLS estimates always suffer from potential critique and problems, even in the instrumental variables estimation, the negative impact of financial literacy on both financial fragility and overindebtedness is confirmed. We also note that the IV estimates reported in Table 6 are always larger than the OLS estimates reported in Table 5a and 5b, as it is the case in many other studies (see Lusardi and Mitchell, Reference Lusardi and Mitchell2014). Thus, basic financial knowledge decreases, and potentially quite substantially, the probability that individuals are financially fragile or overburdened by debt.
IV estimates of financial fragility and overindebtedness on financial literacy (measured by all three correct and total number correct)

Note: Estimates use sample weights. In the first two columns, the dependent variable is a dummy variable taking value 1 if the respondents answered they certainly or probably could not come up with €2,000, in response to the question: “How confident are you that you could come up with €2,000 if an unexpected need arose within the next month?” The variable takes value 0 for those who reported they certainly or probably could not come up with €2,000. Those who answered “I do not know” are excluded from the sample. Mean value of the dependent variable Financial Fragility is .257. In the last two columns, the dependent variable is a dummy variable taking value 1 if the respondents answered 3, 4, or 5 to the question: “How strongly do you agree or disagree with the following statement: ‘My household has too much debt right now,’” where 0 means “we do not have any debt,” 1 means “strongly disagree,” 3 means “neither agree nor disagree,” and 5 means “strongly agree.” Mean value of the dependent variable overindebtedness is .346. The reference categories are male, <high school, income 1st quartile, and employee. Robust standard errors in parentheses. *** p < .01, ** p < .05, * p < .1.
In Tables A2a, A2b and A3 in the Appendix, we provide both OLS and IV estimates for individuals aged 25–65 years. The main results do not change.
Finally, we check whether financial literacy still matters when we adopt the stricter definition of overindebtedness of Lusardi and Tufano (Reference Lusardi and Tufano2015). Hence, we reclassify our respondents as overindebted if they agreed/strongly agreed that there might have a problem with debt. In this case only 11.1% of individuals reports excessive debt. However, when we look at the relationship between financial literacy and overindebtedness (Table 7), we do not find any statistically significant effect, even when we perform instrumental variable estimation. That is not surprising as, in Italy, the level of household indebtedness has always been particularly low by international standards.
OLS and IV estimates of an alternative measure of overindebtedness on financial literacy (measured by all three correct and total number correct)

Note: Estimates use sample weights. In the first two columns, the dependent variable is a dummy variable taking value 1 if the respondents answered 4 or 5 to the question: “How strongly do you agree or disagree with the following statement: ‘My household has too much debt right now,’” where 0 means “we do not have any debt,” 1 means “strongly disagree,” 3 means “neither agree nor disagree,” and 5 means “strongly agree.” Mean value of the dependent variable overindebtedness is .111. The reference categories are male, <high school, income 1st quartile, and employee. Robust standard errors in parentheses. *** p < .01, ** p < .05, * p < .1.
Discussion and Conclusions
In this paper, we rely on a new survey to study the current state of financial knowledge in Italy. We show that a large majority of Italians fail to grasp critical financial concepts, including interest rates, inflation, and risk diversification. Lack of knowledge is not only widespread but is particularly acute among less-educated, female, and younger individuals. Knowledge of inflation is particularly low among the young, and there is a wide gap in knowledge among the young and the old.
The data in 2022 confirm the large regional differences in financial knowledge found in the PISA financial literacy assessment among 15-year-old students in 2012 (OECD, 2014b) and findings from earlier surveys (Fornero and Monticone, Reference Fornero and Monticone2011), with individuals in Southern Italy and the Islands performing worse in each question and overall. Finally, we find that financial illiteracy can place great distress on families, as lack of financial knowledge is linked to the probability of being financially fragile and to over accumulate debt.
These results provide a further rationale for interventions to improve the level of financial literacy in the Italian population. As financial knowledge is particularly low among younger individuals and the less-educated, financial education should be provided at early ages during mandatory schooling, which is until age 16 in Italy. Moreover, financial education should be provided avoiding the use of jargon and complex terminology. Indeed, the language used in finance and in investing may help closing the gender gap, as research has shown that the lack of familiarity with the language of investor communication contributes to the gender gap in financial literacy in Italy (Boggio et al., Reference Boggio2017). Finally, since we documented wide regional differences in financial knowledge, financial education programs should be pursued at the national level, making sure to reach students and individuals in Southern Italy, who are those performing worse in each of the Big Three questions and overall. Hence, our findings call for programs to provide financial education, especially in schools and colleges.
Competing interests
The authors have no competing interest to declare that are relevant to the content of this article.
Appendix: Lewbel Instrumental Variable Approach
Our measure of financial literacy is endogenous and subject to a measurement error. The equations we want to estimate take the form
 $$Y = X{\beta _1} + FinLit\;{\beta _2} + \;{\varepsilon _1}$$
 $$FinLit = X{\gamma _1} + {\varepsilon _2}$$
where we assume that ${\varepsilon _{1\;\;\;}}{\rm{and}}\;{\varepsilon _2}$
are correlated with each other and that E(X ϵ1)=0.
${\varepsilon _{1\;\;\;}}{\rm{and}}\;{\varepsilon _2}$
are correlated with each other and that E(X ϵ1)=0.
Lewbel (Reference Lewbel2012) shows that heteroskedasticity in equation (A2) can be used to construct instruments for endogenous or mismeasured variable, allowing identification when the exclusion restrictions for available instruments are questionable, or traditional instruments are weak. The Lewbel estimator replaces traditional exclusion restrictions with two assumptions. Let Z denote a subvector of the exogenous variables X and $\overline {Z\;} $
their mean. Lewbel (Reference Lewbel2012) shows that (Z-
$\overline {Z\;} $
their mean. Lewbel (Reference Lewbel2012) shows that (Z- $\overline {Z)} \;\;{\hat \varepsilon _2}$
Footnote
9
are valid instruments for Finlit under two assumptions:
$\overline {Z)} \;\;{\hat \varepsilon _2}$
Footnote
9
are valid instruments for Finlit under two assumptions:
 $$Cov\left( {Z,\varepsilon _2^2} \right) \ne 0$$
 $$Cov\left( {Z,{\varepsilon _1}{\varepsilon _2}\;} \right) = 0$$
Additionally, for one of our measures of financial literacy, “All three correct,” that assumes value 1 when individuals answer all the three questions correctly, we also assume implicitly that $E\left( {{\varepsilon _2}|X} \right) = 0$
. This implies that E(FinLit|X)=Prob((FinLit=1)|X)=
$E\left( {{\varepsilon _2}|X} \right) = 0$
. This implies that E(FinLit|X)=Prob((FinLit=1)|X)= $X{\gamma _1}$
is a linear probability model. This additional assumption is violated if, for many observations,
$X{\gamma _1}$
is a linear probability model. This additional assumption is violated if, for many observations, $\;X\;{\gamma _{1\;\;}}$
>1 or
$\;X\;{\gamma _{1\;\;}}$
>1 or $X{\gamma _{1\;}}$
<0. We did not find any of the observations violating that condition. Assumptions (A3) and (A4) imply that Z is correlated with the heteroskedasticity in equation (A2), but uncorrelated with the covariance between the error terms in equations (A1) and (A2). We can then obtain a consistent estimate of β1 by means of 2SLS or GMM using (Z-
$X{\gamma _{1\;}}$
<0. We did not find any of the observations violating that condition. Assumptions (A3) and (A4) imply that Z is correlated with the heteroskedasticity in equation (A2), but uncorrelated with the covariance between the error terms in equations (A1) and (A2). We can then obtain a consistent estimate of β1 by means of 2SLS or GMM using (Z- $\overline {Z)} \;{\hat \varepsilon _2}\;$
as instruments for Finlit. Assumption (A3) is easily tested using a Breusch–Pagan tests for heteroskedasticity and is reflected in the F-statistic for (Z-
$\overline {Z)} \;{\hat \varepsilon _2}\;$
as instruments for Finlit. Assumption (A3) is easily tested using a Breusch–Pagan tests for heteroskedasticity and is reflected in the F-statistic for (Z- $\overline {Z}) \;{\hat \varepsilon _2}$
in first-stage regressions, that we report in the tables. Assumption (A4) ensures that the constructed instruments, (Z-
$\overline {Z}) \;{\hat \varepsilon _2}$
in first-stage regressions, that we report in the tables. Assumption (A4) ensures that the constructed instruments, (Z- $\overline {Z}) \;{\hat \varepsilon _2}$
, are uncorrelated with ε1 and are valid instruments. Fortunately, (A4) can be tested using standard tests of overidentifying assumptions.
$\overline {Z}) \;{\hat \varepsilon _2}$
, are uncorrelated with ε1 and are valid instruments. Fortunately, (A4) can be tested using standard tests of overidentifying assumptions.
Any exogenous variable can be included in our vector of Z variables, as long as it satisfies assumptions (A3) and (A4). Lewbel (Reference Lewbel2012) and many applications of his method include all available exogenous variables in Z. In our application, the exogenous variables include location characteristics, some of which might be suggested as traditional instruments, and individual characteristics like age and having of children.
As the first requirement for the use of Lewbel’s constructed IV is heteroskedasticity in the endogenous mismeasured variables, we perform a Breusch–Pagan tests for heteroskedasticity.
Heteroskedasticity is most pronounced for the number of questions answered correctly, “Total number correct,” with a χ2(1) statistics of 163.41 (p-value .0000) while the χ2(1) statistics is 10.95 (p-value .0009) for the variable “All three correct” that assumes value 1 when all questions are answered correctly.
Summary statistics

Note: All figures are weighted. N=5,000 for all the variables but “People financially fragile,” for which N=4,751.
OLS estimates of financial fragility on financial literacy

Note: The sample is restricted to respondents in the age group 25–65. Estimates use sample weights. The dependent variable is a dummy variable taking value 1 if the respondents answered they certainly or probably could not come up with €2,000, in response to the question: “How confident are you that you could come up with €2,000 if an unexpected need arose within the next month?” The variable takes value 0 for those who reported they certainly or probably could not come up with €2,000. Those who answered “I do not know” are excluded from the sample. Mean value of the dependent variable financial fragility is .241. The reference categories are male, <high school, income 1st quartile, and employee. Robust standard errors in parentheses. *** p < .01, ** p < .05, * p < .1.
OLS estimates of overindebtedness on financial literacy

Note: The sample is restricted to respondents in the age group 25–65. Estimates use sample weights. The dependent variable is a dummy variable taking value 1 if the respondents answered 3, 4, or 5 to the question: “How strongly do you agree or disagree with the following statement: ‘My household has too much debt right now,’” where 0 means “we do not have any debt,” 1 means “strongly disagree,” 3 means “neither agree nor disagree,” and 5 means “strongly agree.” Mean value of the dependent variable overindebtedness is .360. The reference categories are male, <high school, income 1st quartile, and employee. Robust standard errors in parentheses. *** p < .01, ** p < .05, * p < .1
IV estimates of financial fragility and overindebtedness on financial literacy (measured by all three correct and total number correct)

Note: The sample is restricted to respondents in the age group 25–65. Estimates use sample weights. In the first two columns, the dependent variable is a dummy variable taking value 1 if the respondents answered they certainly or probably could not come up with €2,000, in response to the question: “How confident are you that you could come up with €2,000 if an unexpected need arose within the next month?” The variable takes value 0 for those who reported they certainly or probably could not come up with €2,000. Those who answered “I do not know” are excluded from the sample. Mean value of the dependent variable Financial Fragility is .241. In the last two columns, the dependent variable is a dummy variable taking value 1 if the respondents answered 3, 4, or 5 to the question: “How strongly do you agree or disagree with the following statement: ‘My household has too much debt right now,’” where 0 means “we do not have any debt,” 1 means “strongly disagree,” 3 means “neither agree nor disagree,” and 5 means “strongly agree.” Mean value of the dependent variable Overindebtedness is .360. The reference categories are male, <high school, income 1st quartile, and employee. Robust standard errors in parentheses. *** p < .01, ** p < .05, * p < .1.


 Open access