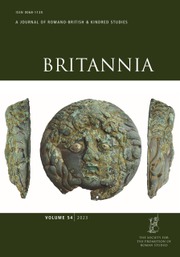


The famous enamelled bronze patera representing Hadrian's Wall was discovered at Amiens in 1949.Footnote 1 This exceptional piece is known to have been one of a small series of similar objects which had probably belonged to soldiers. Most were found far from the northern border of the empire.Footnote 2 What does this object now indicate for historians? Should it be seen as a simple ‘souvenir’, bought by a soldier nostalgic for his garrison duty in the Caledonian mists? A beautiful, prestigious object for religious use? Is it evidence of the fame acquired, as soon as it was built, by Hadrian's work, a true ‘wonder’ in the world of that time, comparable to the fabulous monuments of the past such as the lighthouse of Alexandria? All that might be true, but there is more to be said about its place of discovery. Amiens is situated on one of the main routes from Boulogne, a transit port for Britain and the main base of the classis Britannica. Two inscriptions from the city, which was the capital of the Ambiani, attest to the role it played in the movement of troops from Germany to Britain. First, there is the monument to a primus pilus of legio VI Victrix who was buried there.Footnote 3 Even more significant is the tombstone of a legionary belonging to XXII Primigenia pia fidelis at Mainz, dedicated by vexillarii of the same legion on the way to Britain, ‘euntes/[ad] expedi(tionem) Britan(n)icam’, undoubtedly under Septimius Severus.Footnote 4
Crossings between Britain and the continent were, however, not confined to the Pas-de-Calais strait, and it is well known that direct links existed between the mouths of the Scheldt and the Thames estuary. However, people were not transported like amphoras or barrels; one must ask which itineraries were followed by people and which by goods, and whether different routes were used for the transport of various types of merchandise. Three related topics will therefore be tackled here: navigation and the ports; military supply to Hadrian's Wall and the movement of goods between the continent and Britain; and finally, more specifically, samian ware (terra sigillata), modern study of which offers new lines of investigation into the great commercial circuits in the north-western parts of the empire.Footnote 5 The discussion that follows will endeavour to show, as far as is possible within the confines of a short article, that the building of Hadrian's Wall took place against a background of pre-existing economic relations with the continent, which were then influenced and modified by the needs of the army on the Wall. In this context, the analysis of trade between the northern frontier of Britain and Germany constitutes a key element in our understanding of the respective roles of the army and civilian merchant networks in Hadrian's time and in the years that followed.
SAILING CONDITIONS AND THE PORT SYSTEM
Cross-Channel traffic was long established and frequent. In addition to Strabo's well-known testimony,Footnote 6 the work of Cunliffe and de Jersey has illustrated the economic exchanges between Wessex and Britanny at the end of the Iron Age.Footnote 7 Nevertheless, winds and tidal currents cause various degrees of difficulty in crossings of the Channel and the North Sea from any points on their coasts.Footnote 8 Westerly winds, which are the most frequent, offer relatively easy sailing conditions when going from north to south or vice versa, especially in the western sector; this applies less in the Pas-de-Calais, where the sea is difficult because the wind strengthens in the narrower strait, and it is often choppy, or there are cross-seas when the current is against the wind. But the crossing is obviously shorter and can even be done by sight in good weather. The situation is even more complicated crossing to Britain from the Belgian or Dutch coast, because of the north-east/south-west orientation of the latter. As the current sailing instructions clearly indicate, the most frequent wind direction is from the west. Ships therefore have to sail upwind very often, which must have been particularly difficult for ancient vessels, whose rigging was poorly suited to this sailing trim. Late spring and the summer season fortunately offer more varied nautical possibilities, with a more diversified wind rose and better sailing conditions downwind.Footnote 9 The return route from the island to the mainland is, on the other hand, much easier.
Considering these factors, we can understand more clearly the passage in which Strabo, describing the crossing between the ‘Rhine region’ and Britain, states that departure was not from the mouths of the river, but from the territory of the Morini, where Caesar had established his naval base.Footnote 10 No doubt under the empire the situation had changed somewhat, as shown by the position of the two sanctuaries of Domburg and Walcheren, on the Oosterschelde, known for their many votive monuments to Nehalennia and their inscriptions thanking the goddess after successful navigation of dangerous seas.Footnote 11 To appreciate this point better, we have to consider what archaeology reveals about the ancient port system of these regions.
As far as Boulogne is concerned, we have long relied on information from the old excavations of C. Seillier. Recent research under the cathedral has now refined the chronology of the classis Britannica fort. Even if the remains of the port itself are inaccessible for the time being, it seems certain that the first military installation can be dated to the second half of the first century a.d., although its actual plan still eludes us. Reconstruction of the barracks probably took place under Hadrian, according to the ceramic evidence, although the chronology of the defences is not directly established by the new field research. The contexts of finds from the older excavations allow us to propose a date between Trajan and Hadrian.Footnote 12
According to Philp, the first fort of the fleet at Dover is dated to the beginning of the second century, but it was abandoned and then rebuilt from a.d. 119 onwards.Footnote 13 It can therefore be noted that the stratigraphic sequences of the two military ports installed on each side of the English Channel now seem very close, with reconstruction at the beginning of Hadrian's reign; the archaeological data do not, in this case, allow greater chronological precision.
It should not be forgotten that, from the time of Augustus, Boulogne was situated at the end of an important road network which put the port in direct contact with Amiens, Reims, Langres, Chalon-sur-Saône, Lyon in one direction and with Bavay, Tongeren, Cologne in the other, that is with inland Gaul and with the German frontier.Footnote 14 Dover was obviously directly linked to London. The importance of the Pas-de-Calais in contacts between Britain and the continent must not therefore be underestimated.
The construction by Corbulo in a.d. 47 of the canal that bears his name between the Rhine and the Meuse, to avoid the dangers of navigation at sea, gave the signal for the progressive development of this region.Footnote 15 Archaeology now makes it possible to locate the fossa between Leiden-Roomburg, on the Rhine, and De Lier-Leehove, at the mouth of the ancient Meuse. A road ran alongside the canal.Footnote 16 Without going into detail about the infrastructure, several important points should be noted. The capital of the Canninefates, Voorburg, developed on the banks of the fossa.Footnote 17 Originally a simple indigenous hamlet, it was granted the right to hold markets probably during Hadrian's visit, between a.d. 120 and 122, following which it took the name of Forum Hadriani. It developed into a small town with an area of 5.5 ha which was at first enclosed by timber defences. Just north of the outlet of the fossa Corbulonis, the presence at Naaldwijk of an inscribed bronze plaque, unfortunately fragmentary, is of interest. If we follow the restoration of the text by T. Derks, it would represent the dedication of an honorary monument, probably an imperial statue, by a detachment of the classis Augusta Germanica pia fidelis, dating to the reign of Hadrian, around a.d. 130–131.Footnote 18 The fort, thought to be nearby, has unfortunately not been identified, but the presence of numerous tiles stamped by the German fleet is significant. The map also shows an extension of the distribution as far south as Walcheren (fig. 1). This is possibly evidence of the activity of a military fleet protecting the estuaries against piracy by the Chauci,Footnote 19 or a sign of the increasing importance of this route by sea, river and land which was used to supply the troops of Lower Germany.Footnote 20
Distribution of c(lassis) G(ermanica) p(ia) f(idelis) stamps (after de Bruin Reference de Bruin2012, fig. 11).

The termination of this route on the Oosterschelde was also the starting point of the commercial crossings to Britain, as attested by the inscriptions at the sanctuaries of Nehalennia, and both were the long-term results of Corbulo's initiative. The different naval undertakings, surveillance of Germanic piracy, military logistics and protection of trade, were by no means mutually exclusive. The use of an inland waterway, sheltered by barrier beaches along at least part of its route, also shows that the ships of that time sought to sail as far south as possible to shorten the crossing to Britain. On the Rhine itself, the importance of the inland waterways for supplying the Lower German army is clear.Footnote 21 During the Batavian revolt, the rebels intercepted ships bringing wheat needed by the Roman troops on the Rhine. The wheat came from inland Gaul.Footnote 22 It is indeed very likely that Picardy and Wallonia, the agricultural regions closest to the limes, used the sea or the Scheldt or Meuse rivers, depending on their point of departure, to supply the garrisons. At Nijmegen, for example, there is a votive inscription of a Nervian negotiator frumentarius, an unmistakable sign of economic relations between the limes and its hinterland.Footnote 23
These triangular patterns of transport routes between inner Gaul and Germany on the one hand and Britain on the other, but also between the latter and Germany, show the development of inter-provincial connections under the empire. However, should it be assumed that military units and goods travelled in the same way?
As evidence of naval activity around the island of Britain, one can of course first of all cite the famous testimony of Tacitus. During the Agricolan campaigns, the fleet caught the Caledonians off guard by disembarking naval soldiers from the sea.Footnote 24 The passage is too well known to need a long commentary. Nevertheless, it should be noted that this was a coastal navigation, carried out by naves longae (warships), as shown by the episode of the Germanic recruits seizing three liburnae before wandering along the coast and finally reaching the Suebi.Footnote 25 Did this type of ship cross the ocean on the high seas from the coast of Germany to bring reinforcements to Hadrian's Wall, in a sort of endless naval noria or bucket chain combining convoys of the classis Britannica and the classis Germanica, as suggested by Konen?Footnote 26
We certainly know through epigraphy of frequent troop transports between the two frontiers. A few examples will suffice in addition to those already mentioned in connection with Amiens. A vexillatio Britannica, undoubtedly predating Hadrian, is attested at Nijmegen by stamped tiles discovered on the Hunerberg.Footnote 27 An inscription records the career of T. Pontius Sabinus, who led a group of three thousand-strong vexillations of the legions VII Gemina of Spain and VIII and XXII of Upper Germany to Britain under Hadrian.Footnote 28 Finally, mention should be made of M. Pontius Laelianus Larcius Sabinus, tribune of the VI Victrix, ‘cum qua ex Germania in Britanniam transiit’, when construction of the Wall began.Footnote 29 Are we to think that these units had come directly from Germany by sea to the Wall, notwithstanding the considerable risk they would have taken in case of storms?
Some clues might suggest such direct navigation. These include the possible existence, on the southern bank of the Tyne estuary, of a wreck from which came, among other things, the shield of a soldier of legio VIII from Strasbourg, a bronze patera dedicated to a deity known in northern Gaul, Apollo Anextiomarus, and numerous denarii, the latest of which were issued in a.d. 176–180. These objects could have belonged to a reinforcement that arrived by sea, around a.d. 180, but which was shipwrecked when it reached the port.Footnote 30 Nothing, however, necessarily indicates a direct crossing, and coastal navigation from the south is just as conceivable. In the same way, the presence in Newcastle of two altars dedicated respectively to Neptune and Oceanus by legio VI does not necessarily imply a direct transit on the high seas from Germany.Footnote 31 On the contrary, we have already observed that this legion probably transited via Amiens, therefore via Boulogne and Dover, a less dangerous route than the direct crossing from Germany. As regards legio VII Gemina, which came from Spain and was placed under the command of T. Pontius Sabinus, nothing prevents us from thinking that it reached Boulogne directly. Without excluding the possibility that troop movements between Britain and Germany sometimes followed the direct route, we can easily accept Rankov's proposal that the classis Britannica was basically composed of ships providing the indispensable crossings of the Pas-de-Calais for troops and official travellers.Footnote 32 The transport of goods involves different considerations.
MILITARY LOGISTICS AND ECONOMIC EXCHANGES
The recent survey of rural settlements in Roman Britain has confirmed the absence of a dense system of villas close to the northern frontier and capable of supplying the troops directly with the cereals they needed.Footnote 33 In this respect, the contrast with the density observed in the hinterland of Cologne, in Lower Germany, or just behind the limes of Upper Germany–Raetia, is very striking.Footnote 34 Moreover, archaeobotanical data, which are quite rare in the north of Roman Britain, show for the most part a clear dominance of barley and spelt, while free-threshing (bread/club) wheat is present in insignificant quantities.Footnote 35 In these circumstances, it must be assumed that the supply of cereals to the troops probably required imports. But was supply from the south of Britain or from further away?
Comparison of the distribution of exotics in the Early Roman phase to that of Haltern 70 and Camulodunum 189 ‘carrot’ amphorae (following Tyers Reference Tyers1996) and Early Roman forts (after Orengo and Livarda Reference Orengo and Livarda2016, fig. 5).

Excavation of the granaries at South Shields revealed the presence of a significant stock of spelt and bread/club wheat, in roughly similar quantities and dated to the late third or early fourth century. Van der Veen concluded that the bread/club wheat was probably imported from Gaul.Footnote 36 The conclusion is reasonable, but recent surveys make it possible to clarify to some extent its possible geographical origin, because intensive cultivation of free-threshing wheat on the continent in Roman times seems to have hardly extended north of Amiens. In Germany and Wallonia, its cultivation was always on an insignificant scale.Footnote 37 Exports from the Parisian basin were made via the Seine or the Somme.
The finds at South Shields remain exceptional on Hadrian's Wall: carbonised bread/club wheat has been found in various forts, but always in small quantities compared to hulled cereals. It is therefore difficult to envisage regular and large-scale importation of naked cereals from the continent; in normal times production of spelt wheat from the south and centre of Britain was probably sufficient (spelt is a hulled bread crop).Footnote 38 It should be noted in passing that the Vindolanda tablets only mention Gaul twice: the first in a roster (no. 154) and the second in a letter signalling the return of a soldier (no. 255), but never in the context of supplies.Footnote 39 As for meat, we can accept that it was supplied from Britain.Footnote 40
Imports from the continent to Britain are therefore limited to a composite but very broad list of foodstuffs less essential to human existence, although indispensable to the Roman way of life.Footnote 41 This is true, for example, of so-called exotic plants, a term applied to those which were not cultivated on the island, at least at the beginning of the Roman period. Van der Veen has drawn up a significant list which includes many fruits (fig, grape, mulberry, olive, peach, date, pear, cherry, etc.) and almost all condiments.Footnote 42 These Mediterranean products, it seems, were not transported on their own but accompanied bulkier cargos such as amphoras and barrels. In this connection, the distribution maps prepared by Orengo and Livarda are of particular interest (figs 2–3).Footnote 43 They show an evolution over time which is characterised by the growing role of the port of London, which became the real traffic hub in the second century, and illustrate the role of urban development in the import of these exotic products at that time. The importance of military sites in this diffusion is no greater than that of cities, as van der Veen had already pointed out. There was therefore no specific commercial circuit for the military, separate from the civilian market. However, it should also be noted that the distribution of these imported plants often went hand-in-hand, before the Hadrianic period, with that of ‘carrot’ and Haltern 7 amphoras, evidence of related commercial circuits.
Comparison of the distribution of exotics in the Middle Roman phase to that of Black Burnished 2 ware and its production sites (following Tyers Reference Tyers1996) (after Orengo and Livarda Reference Orengo and Livarda2016, fig. 6).

Alongside these cultivated plants, there were processed products which unfortunately leave few archaeological traces, except through possible containers whose precise function is often difficult to identify. This is the case, for example, with the vases tronconiques from northern Gaul, to which Swan had drawn attention.Footnote 44 The same applies to the amphoras made at Dourges in the Scheldt valley, exported to the Rhine but still largely unrecognised in Britain; what they contained remains a matter for debate.Footnote 45 F.M. Morris has produced a synthesis of the different ceramic productions from Northern Gaul exported to Britain, but this work, although valuable and useful, needs to be revisited because it is often based on old data.Footnote 46 Much remains to be done in the study of North Gaulish wares in Britain, as well as that of their possible contents.Footnote 47 In comparison with the scale of trade throughout the empire, the movements of these wares were undoubtedly of limited economic importance on the scale of the Empire, but they are nonetheless important for our understanding of relations between the two sides of the Channel.
The interest and number of the Domburg and Walcheren inscriptions cannot therefore be allowed to obscure the existence of other maritime relations.Footnote 48 The variety of trade routes is well documented by a small number of inscriptions. The discovery in London, in 2002, of a dedication to Mars Camulus by Tiberinius Celerianus from Gallia Belgica, ‘moritix Londiniensium’, reminds us of the links between Britain and the continent, this time via the Channel.Footnote 49 The term describing the dedicator, a moritix, is probably related to the Gallic word for sea, and occurs at Cologne, again in the context of trade with Britain.Footnote 50 At York, we find a tribesman of the Bituriges Cubi established in the city.Footnote 51 There is also the famous votive altar that M. Aurelius Lunaris, sevir augustalis of York and Lincoln, had erected in Bordeaux in honour of the goddess Boudig(a) to thank her for his successful crossing.Footnote 52 In the same city, imports of BB1 and BB2 pottery are known together with jet pins, some of which came from Yorkshire. In exchange, Bordeaux exported various products from the earliest days of the Empire. Pitch from Landes was found in the cargo of a wreck in Guernsey.Footnote 53 These examples illustrate the operation of an oceanic route. Of course, these exchanges were by no means limited to the sphere of military supplies and continued with modifications into the later empire. But it is now time to come to the flagship products of the trade with Britain: wine, oil and terra sigillata.Footnote 54
The study by E. Marlière and J. Torres Costa of amphoras and barrels at Vindolanda provides essential information on the consumption of wine on the northern frontier of the empire.Footnote 55 The authors have demonstrated a preponderance in the use of barrels as containers as compared with amphoras, which implies a much higher overall demand for wine rather than oil; hitherto, this was not fully appreciated because all the statistics show a clear numerical superiority of Dressel 20 oil amphoras over wine amphoras. The quantification of amphoras at Vindolanda showed that oil containers comprised 85.7 per cent of the total, while those for wine or defrutum did not exceed 11.5 per cent. In the latter category, Gaul accounted for 5.7 per cent, Italy 2.2 per cent, the Iberian Peninsula 1.5 per cent and the East 1.4 per cent. These proportions are completely reversed if we take into account the barrels found on the site. We can then estimate the share of Gaulish products at more than 77 per cent, in terms of volume, compared to 21 per cent for the Iberian Peninsula. As the barrels were probably made in the Lyon region, they clearly travelled along the Rhône/Saône axis, beyond which two routes were possible, one via the Seine valley, the other via the Moselle and the Rhine, with transhipment occurring in Burgundy in both cases. Finally, a sea crossing to Britain completed the routes. The Rhône and Saône nautes therefore played an essential role here, which is confirmed by the important epigraphic evidence relating to them (fig. 4).Footnote 56
Map of nautae inscriptions (white circles). Not all these nautae were necessarily engaged in trade with Britain, but their geographical distribution and the texts of the inscriptions demonstrate that there was highly developed commerce along the Rhône/Saône/Moselle/Rhine axis. The negotiatores mentioned in the inscriptions at the sanctuaries of Nehalennia at the mouth of the Scheldt are not shown on this map, although it is very probable that they were trading with Britain. Others which are known to have been concerned with this trade are shown by black dots. 1 = AE 1922, 116; 2 = RIB I, 678; 3 = AE 1975, 651; 4 = AE 2003, 1015; 5 = CIL 13.7300; 6 = BRGK 27, 1937, 99, no. 167; 7 = CIL 13.8164a; 8 = AE 1973, 370; 1983, 720–722; 9 = AE 1969–1970, 436 (for the full texts, see Supplementary Material, Appendix 1).

The amount of evidence of all kinds, epigraphic, iconographic and artefactual, is, however, much greater around the Rhine axis and seems to show that this route was by far the most important, although those along the Seine and Garonne should not be ignored. They were already important economic axes at the end of the Iron Age.Footnote 57 At the beginning of the empire, some Spanish wines were probably transported along the Atlantic route, as shown by F. Laubenheimer with regard to the Pascual 1 amphoras.Footnote 58 It is therefore possible that part of the supplies for the German army at the beginning of the empire came via the Atlantic, but the route must have changed with the development of the Provençal vineyards.Footnote 59
The evidence of the Baetican oil amphoras is more complex, and the data gathered from Britain by C. Carreras Montfort and P. Funari are not sufficient to determine the comparative importance of the Atlantic route and the river route via the Rhine.Footnote 60 However, the distribution map of Dressel 20 amphoras again shows a strong predominance of the Rhône/Rhine axis in all periods, apart, of course, from the sea route to Rome (fig. 5) Unfortunately, the important economic flow of oil from Baetica cannot be dated very closely except in exceptional cases,Footnote 61 unlike the samian ware, often datable decade by decade.
Distribution of amphora type Dressel 20. Map generated 2 November 2020 at Samian Research (https://www.rgzm.de/samian), using Ceipac data (https://romanopendata.eu/). Dot sizes are scaled log(10).

SAMIAN WARE (TERRA SIGILLATA)
At an early stage in the development of samian studies, it was apparent that the wide and prolific occurrences of the ware on sites in north-west Europe would allow instructive comparisons of its distribution in different Roman regions.Footnote 62 After Dragendorff's paper in 1895, it took until 1972 for the first methodological study related to samian distribution to appear, which concerned the delivery of samian to Britain.Footnote 63 For the first time in samian research, maps were generated to study chronological questions about Hadrian's Wall and the Antonine Wall. Two large datasets on samian and amphorae have become available online in the last few years.Footnote 64 The granular dataset of name-stamped samian allows very precise chronological and socio-economic analysis.
Methodologically, the consumption of goods traded over long distances, such as samian or amphoras, can only be studied usefully in relatively small regions like Hadrian's Wall (or even Britain) if one takes into account overall developments in the export dynamics of these goods throughout the north-western provinces of the empire. Goods coming to Britain from southern Gaul were apparently transported primarily via the Rivers Rhône, Saône and Rhine. The commercial and geographical advantages of these corridors automatically led to the appearance of large trading hubs.Footnote 65 As far as the trade in samian is concerned, there is no evidence for a trade route from the Mediterranean to the north via the Bay of Biscay during the first century a.d.Footnote 66 The economic importance of these transport corridors to the northern markets is underlined by the spectrum of forms which were sold along these trading routes: the percentage of the more expensive decorated samian forms is far higher in these areas than in the Gaulish hinterlands, for example (fig. 6).
Distribution of La Graufesenque (a.d. 20–120) samian and the proportions of decorated (green)/plain (red) vessels per site. Dot sizes are scaled log(10). Map generated 2 November 2020 at Samian Research (https://www.rgzm.de/samian).

An analysis of the quantities of samian at consumption sites in relation to the distance to their respective production centres demonstrates that the military-dominated consumption sites at the far end of the export trail – such as those in the zone later controlled by Hadrian's Wall – only formed a relatively small part of the total added value which the negotiatores cretariae would have been able to generate en route during the first century (fig. 7). Although at the end of the first century the military installations of the northern frontier played only a minor role in the export chain, this picture changed considerably after a.d. 120: sites like Carlisle and Corbridge now became major regional commercial centres within the supply chain (fig. 8). The large quantities recorded at mainly civil financial hubs en route (e.g. Narbonne, Lyon, Augst, London), where safety of capital could be assured, strongly suggest that private entrepreneurship was behind this trading model: most of the added value generated during at least the first half of the export distances was realised at civil sites en route.Footnote 67 This pattern apparently determined the character of the capital-intensive long-distance trade in samian during both the first and second centuries. There is nothing to show that the manufacture of sigillata in Italy, the Gauls and Germania Superior was in other than civilian hands. Nor does the wide variety of products in the military frontier zones such as Hadrian's Wall, originating from entirely different samian production centres in completely different Roman provinces, suggest a directed trade.Footnote 68 Negative evidence, of course, is not conclusive, but it is worth noting that neither the Egyptian military papyri/ostraca, nor inscriptions, nor juristic texts, nor the Vindolanda or London tablets document with even a single syllable any interest from the government in the ceramics trade.Footnote 69 Samian was marketed as pottery for financial gain, but amphoras were traded because of the staple goods they contained: wine, fish sauce or olive oil. Not even the trade in olive oil was a matter of government involvement.Footnote 70 This fits with the observation that a private wine dealer (vinarius) was living at house no. 13 within the military fortress at Vindonissa.Footnote 71
Export distances of samian produced at La Graufesenque and percentages of the total export per site. Relevant northern British sites are displayed in red. Graph generated 22 March 2021 at Samian Research. On the horizontal x-axis the distance in kilometres and on the vertical y-axis the export percentages are displayed (https://www.rgzm.de/samian).

Export distances of samian produced at Lezoux and percentages of the total export per site. Relevant northern British sites are displayed in red. Graph generated 22 March 2021 at Samian Research. On the horizontal x-axis the distance in kilometres and on the vertical y-axis the export percentages are displayed (https://www.rgzm.de/samian).

The civilian aspect of the samian industry and its marketing to the army are also essential to understanding the distribution of samian from Les Martres-de-Veyre in Britain: the sudden appearance of products in Britain and Germania Inferior from this Central Gaulish industry in c. a.d. 100–110 seems at first sight to coincide with the withdrawal of several legions from those two provinces in c. a.d. 104 (fig. 9).Footnote 72 However, these new imports of samian from Central Gaul to Britain appear shortly before this demilitarisation period and therefore can hardly have been a military-driven development. The simultaneous appearances of wares from Les Martres-de-Veyre in the lower Rhine estuary, which belonged to an entirely different administrative district, and in Britain are another strong argument that there was no government involvement in samian trade: the products of Les Martres-de-Veyre were evidently following the classic route via the Rhine to Britain, avoiding an obvious direct line through north-western Gaul and taking the advantage of this longer route to exploit markets along the way.Footnote 73
Distribution map of samian made at Les Martres-de-Veyre. Dot sizes are scaled log(10). Map generated 3 November 2020 at Samian Research (https://www.rgzm.de/samian).

Distribution map of samian made at Montans between a.d. 50 and 70. Dot sizes are scaled log(10). Map generated 7 November 2020 at Samian Research (https://www.rgzm.de/samian).

Besides the Rhône–Rhine transport axis, there were also other commercial routes through Gaul to Britain. The pre-Flavian products of the samian production centre of Montans were hardly reaching markets beyond Aquitania (fig. 10), and it seems difficult to imagine that there would have been a lively trade in amphoras across the Bay of Biscay in this pre-Flavian period.Footnote 74 However, the second-century Montans production was clearly connected to long-distance trade and served Britain as a regular market (fig. 11). The larger quantities which arrived at Chester and Wroxeter suggest direct trading from Aquitania towards the western parts of Britannia in the second century. This demonstrates that in at least one period there was more than one trade route from Gaul to Britain. The choice of which one to take seems not to have been based on governmental decisions, but predominantly on least-cost and market reasons.
Distribution map of samian made at Montans between a.d. 100 and 150. Dot sizes are scaled log(10). Map generated 7 November 2020 at Samian Research (https://www.rgzm.de/samian).

Inscriptions relating to the negotiatores cretarii, dating from the second century a.d. onwards, are only located north of Lyon. Their presence fits with the distribution of the contemporaneous samian products of Lezoux in Central Gaul, which by c. a.d. 120 were already abundantly available in Britain. It is interesting to note that those navicularii who profited in the second century or later from tax reductions in exchange for transports in favour of the government are never attested in the distribution area of second- and third-century Gaulish, Germanic and Raetian samian (fig. 12).
The geographical differences between state-connected trade represented by the navicularii (blue dots) and that of the non-state tied negotiatores cretarii compared to the contemporary distribution of samian produced at Lezoux between a.d. 120 and 260. Navicularii (after Schmidts Reference Schmidts2011, 49): Arles – Lyon – Nîmes – Ostia – Saint-Gabriel. Negotiatores cretarii: Augsburg (CIL 3.5833) – Bonn (AE 1931, 27) – Colijnsplaat (AE 1983, 370) – Domburg (AE 1983, 722; CIL 13.8793) – Cologne (CIL 13.8164a; 13.8350) – Lorch (CIL 13.6524) – Lyon (CIL 13.2033; 13.1906; 13.1978) – Mainz (CIL 13.7288) – Metz (CIL 13.4336) – Rottenburg (CIL 13.6366) – Trier (CIL 13.450; 13.3703) – Wiesbaden (CIL 13.7588). Dot sizes are scaled log(10). Map generated 5 November 2020 at Samian Research (https://www.rgzm.de/samian).

The Rhine was important for the trading of ceramic goods from the Mediterranean and Southern Gaul towards Britain because it was the least-cost route.Footnote 75 The importance of this trading axis is also reflected in the Domburg sanctuary inscriptions, dating to the second and third centuries, which mention negotiatores cretarii (merchants of ceramics, fig. 12). Although it is not explicitly stated with which subtype of earthenware these merchants were trading via the Scheldt/Meuse/Rhine river system to Britain, the possibilities are fairly limited. In a plot of the distribution of the contemporaneous samian ware from Rheinzabern, the overlapping between the commercial activities of the negotiatatores cretarii and the distribution of these Rheinzabern dining vessels is striking (fig. 13).
Distribution of samian made at Rheinzabern, datable between a.d. 150 and 260. Blue dots: Negotiatores cretarii: Augsburg (CIL 3.5833) – Bonn (AE 1931, 27) – Colijnsplaat (AE 1983, 370) – Domburg (AE 1983, 722; CIL 13.8793) – Köln (CIL 13.8164a; 13.8350) – Lorch (CIL 13.6524); Mainz (CIL 13.7288) – Metz (CIL 13.4336) – Rottenburg (CIL 13.6366) – Trier (CIL 13.450; CIL 13.3703) – Wiesbaden (CIL 13.7588). Dot sizes are scaled log(10). Map generated 5 November 2020 at Samian Research (https://www.rgzm.de/samian).

A general look at the statistics from first-century samian consumption sites throughout the north-western part of the Roman empire reveals that one of the preferences in Britain and the Rhineland seems to have been for dish-like shapes (fig. 14).Footnote 76 In theory, this might be explained by a somewhat different buying behaviour within these provinces because of a strong military presence and a stronger buying power resulting from that. This is also suggested by the dichotomy between the Rhineland statistics (with higher frequencies of dishes) and the Gaulish hinterland. However, a detailed look at the Rhenish frontier zone and Britain shows that in the first century there are also basically civilian towns like London with significant occurrences of dishes, whereas some predominantly military sites such as Vindonissa have fewer dishes than might be expected.
Distribution of dishes made in La Graufesenque in Britannia and Germania Inferior with statistical values. Red: more than expected; black dots: less than expected; grey dots: statistically irrelevant quantities. Dot sizes are scaled log(10). Map generated 2 November 2020 at Samian Research (https://www.rgzm.de/samian).

A straightforward conclusion based on the map (fig. 14) is that it would be meaningless to compare two different nearby sites, for example on Hadrian's Wall, in respect of their individual consumption patterns, because both were subject to the regional spectrum of an overall ‘tsunami’ of samian imports, resulting from long-distance trade. There was apparently considerable volatility in the quantities of vessels delivered to various places, making it next to impossible to detect military or civilian consumption patterns in adjacent sites.Footnote 77
Hadrian's Wall, the German limes and the Dutch coastal region were simultaneously supplied with products from La Graufesenque, and this material can be used not only for chronological studies based on comparisons of these different regions, but also for comparison with Hadrian's Wall itself as another dated site (fig. 15).Footnote 78 With the help of correspondence analysis, it is possible to establish whether there was a spectrum of potters’ stamps from La Graufesenque at the Hadrianic sites in northern Britain which differed from those at the other contemporaneous limes sections in Germania Inferior and Superior or the North Sea coastal region.Footnote 79 The two civil foundations within the coastal section, Forum Hadriani and Goedereede, were established in the Hadrianic period and played a pivotal role in the trade routes from the Rhine and Meuse to Britain.Footnote 80 The fort at Dover is regarded as part of this North Sea coastal section. The correspondence analysis compares the samian consumption profiles of different types (potters) in units (limes sections) and orders them according to their statistical closeness by preserving the chi-square distances.Footnote 81 The main difference within the data variety is displayed on the horizontal axis, the secondary variety is shown on the y-axis and the third ranked dimension of varieties is visible on the z-axis.Footnote 82 Analysis of the array of potters occurring in these groups of sites demonstrates that Hadrian's Wall has in general a spectrum of South Gaulish samian which is very close to the North Sea section and the Eastern Wetterau limes, which can all be related to Hadrian's activities.Footnote 83 A slight divergence from these contemporaneous series of sites may well be explained by the lower frequencies which occur on Hadrian's Wall, caused by the competition of the contemporaneous samian products from Les Martres-de-Veyre and Montans.Footnote 84 Because of the different marketing route of Montans products via Aquitania (figs 10–11), products of this kiln site did not reach the German limes sections. Both observations might explain why somewhat more La Graufesenque products can be found on the Germanic limes sections founded in Trajanic/Hadrianic times than on the Wall.
Correspondence analysis of La Graufesenque potters occurring on limes sections from Germania Superior, Germania Inferior, Hadrian's Wall and the North Sea coastal sites founded during Hadrian's reign. Limes sections with at least four connecting potters. The diagram displays a chronological order from left to right. Early Flavian limes sections are statistically grouped on the left, Trajanic–Hadrianic limes sections are classified towards the right. Full data list in Supplementary Material, Appendix 2. Generated 6 November 2020 from data available at https://www.rgzm.de/samian.

The distribution of samian in Britain and specifically within the military frontier zone of Hadrian's Wall can best be analysed by using network analysing techniques. The development of the northern frontier zone into an economically more powerful region can be demonstrated by comparison of the distribution of samian from Les Martres-de-Veyre (fig. 16) along the Stanegate road, appearing from c. a.d. 100, and samian from Lezoux, which came to Hadrian's Wall between a.d. 120 and 140 (fig. 17). In the Hadrianic period, some locations developed into real trade hubs (Corbridge and Carlisle), without changing the general trading patterns.
Distribution map of samian potters from Les Martres-de-Veyre with a date range between a.d. 100 and 110 along the Stanegate road (red square dots), before the construction of Hadrian's Wall. Map generated 31 March 2021 at Samian Research (https://www.rgzm.de/samian).

Distribution map of samian potters from Lezoux with a date range between a.d. 120 and 140 in the Hadrian's Wall zone. Map generated 31 March 2021 at Samian Research (https://www.rgzm.de/samian).

Percentages along Hadrian's Wall and the Antonine Wall demonstrate that the merchants sold astonishingly similar amounts of decorated and plain samian (fig. 18). This raises the question of how the samian vessels were actually marketed. There are basically two possible trading methods: if a merchant was driving with his loaded wagon from site to site, we would expect to find chain-like distributions of pots from the same potters. If the trade was based on hubs, the connections between sites would have radiated from central (regional) sites. By using a network analysis module, it is possible to visualise the connections between different sites based on the occurrences of individual potters.Footnote 85 Samian pottery was sold in stacks of pots assembled at the kiln site and usually kept together until they arrived at their consumption sites.Footnote 86 This explains why in some large assemblages of samian there are high frequencies of vessels made by a few individual potters.Footnote 87 Accordingly, it can be postulated that sites where the same individual potters are over-represented, compared to their normal distribution, were partly supplied in common by the same merchant. The distance between the sites involved is a crucial factor in this, since, in this instance, the geographical distance has a strong influence on the statistical evaluation of the frequency of the same potters’ stamp at a nearby site. If we look at the potter Cinnamus ii and at which sites on Hadrian's and the Antonine Wall his observed frequencies are considerably higher than expected, we can see that they correspond to the same hubs which are already discernible when the absolute frequencies alone are plotted (figs 19–20).Footnote 88 Therefore, it is difficult to avoid the conclusion that samian was traded on a hub-based system, where regional – military or civilian – centres played a major role.
Distribution of La Graufesenque samian and the proportions of decorated (green)/plain (red) vessels per site on the Antonine and Hadrian's Wall. Map generated 2 November 2020 at Samian Research (https://www.rgzm.de/samian).

Network analysis of sites with an observed number of pots greater than the expected value and a ‘Network Density Value’ of 0.5 are indicated with a red dot. A blue line is drawn between two significant sites. Hubs of samian trade with high correlations with adjacent sites comprising significant frequencies of vessels made by Cinnamus ii can be distinguished at Carlisle and Corbridge adjacent to Hadrian's Wall and at Camelon by the Antonine Wall. Sites with fewer than five occurrences are statistically ignored and displayed as grey dots. Map generated 4 November 2020 at Samian Research (https://www.rgzm.de/samian).

Network analysis of sites with an observed number of pots greater than the expected value and a ‘Network Density Value’ of 0.8 are indicated with a red dot. A blue line is drawn between two significant sites. Hubs of samian trade with high correlations with adjacent sites comprising significant frequencies of Cinnamus ii can be distinguished at Carlisle and Corbridge adjacent to Hadrian's Wall and Camelon by the Antonine Wall, and at Chester, Caerleon, London, Colchester, Richborough and Gloucester. Sites with fewer than five occurrences are statistically ignored and displayed as grey dots. Map generated 4 November 2020 at Samian Research (https://www.rgzm.de/samian).

This trading model is also recognisable if one considers the general situation in Britain: the extremely important position of London within the samian trading pattern supports the idea that most of the goods in Britain arrived either at the central hubs at London, York, Caerleon and Chester, or the sites at Carlisle and Corbridge in the Hadrian's Wall zone. A negotiator (britannicianus?) (see above) is known at York.Footnote 89 The existence of sub-hubs at Colchester and Richborough in the more developed areas of south-east Britain strongly suggests that we are in fact looking at almost post-industrial trading patterns.Footnote 90 The fact that within the area of Hadrian's Wall this kind of trade had developed to the same extent as in the essentially civilian town of London seems to confirm that the way these goods were distributed was not directly influenced by their military environment.
CONCLUSIONS
This rapid but broad survey has led us to examine a series of very diverse, sometimes highly controversial issues, and we must now return to Hadrian's Wall itself and its place in the system of interprovincial relations that we have just described. At the time of its construction, Roman Britain was already part of a vast economic complex linked to the continent in which the port of London, given its geographical position, played an essential role as a hub.Footnote 91 There is no evidence that the new northern frontier works of the empire, ordered by Hadrian, modified the existing supply routes; on the contrary, they continued in use and seem to have been strengthened.
The supply of cereals to the army, in a local environment not very favourable to their production and which was not marked by the presence of villas and large farms, probably depended on supplies from southern Britain, and there is no evidence of massive imports of free-threshing wheat from the continent. The same cannot be said for exotic plants, wine, oil, and the samian ware. It must be remembered that amongst this wide range of imports it was the heavy products, oil and wine, that made up the bulk of the cargoes, and that the remainder almost always accompanied these products as subsidiary cargoes. At least, that is what the wrecks excavated in the Mediterranean tell us.
If the distribution of exotic plants and its evolution over time (figs 2–3) is compared with the samian products of Cinnamus ii (fig. 17) or those of Martres-de-Veyre produced before a.d. 120 (fig. 9), or even of those from Rheinzabern after a.d. 150 (fig. 13), similar patterns can be discerned which imply the existence of hubs operating from south to north, from London to York and then Corbridge and Carlisle, and redistributing the products locally. At the same time, however, it can be seen that the cities participated in the same patterns of distribution and that the products were identical on the civilian and military markets, even though their different characters would perhaps result in quantitative differences in consumption. We may thus conclude that there was no separate supply system for the army and that the state did not direct this part of military logistics, at least in the period of interest to us. In our opinion, imports from the Mediterranean or Gaul were products of the free market.
These demands naturally favoured the development of other regions of the empire, and it is worth considering further the trade routes between the production zones and Britain. All the maps illustrating oil or samian trade tend to show a preponderance of consumption on the Rhône/Saône/Moselle/Rhine axis, with western Gaul being much less well supplied. This does not of course rule out the presence of other, more modest trade routes, as is shown by the distribution of Montans samian (figs 10–11), but these routes were already in use for the wine trade during the late pre-Roman and Augustan periods. In these instances, the great rivers of Gaul, the Garonne, the Loire and the Seine, also played a part. There was, of course, a direct Atlantic route to the west of Britain which was probably shorter for the transport of oil from Baetica, but there is nothing to indicate that it was preponderant in supply to Britain. Accordingly, the idea sometimes proposed that this product was imported to the German limes upstream from the mouth of the Rhine seems neither proven nor likely, even if the publication of the Nijmegen amphorae suggests that there may have been exceptions, particularly near to the sea in the delta area.Footnote 92 The distribution map of the Dressel 20 amphoras (fig. 5) suggests otherwise.
The importance of the Rhine route and the Flemish coast in trade with Britain, despite the difficulties of navigation and the risks involved, has been clear since the publication of the Walcheren inscriptions. The fortunes of L. Licinius Divixtus, the negotiator from Marbach on the Neckar, bear witness to these difficulties: the altar he erected is rare epigraphic testimony of a shipwreck, though he survived the loss of all his goods.Footnote 93 The essential question of what the return freight from Britain might have been is still to be answered, and what it included can only be a matter of speculation: perhaps tin, lead, iron, salt, fish products and clothing. But it is surely significant that the full development of this part of the North Sea coast began under Hadrian, building on the previous purely military initiatives of Corbulo under Claudius. This is at least what the legal promotion of Forum Hadriani and the date of the samian ware that subsequently reached this region on a massive scale suggest (fig. 8).
We shall end with the question of the route across the Channel in the Pas-de-Calais and the rebuilding, again under Hadrian, of the two naval bases at Boulogne and Dover. Although the epigraphic sources are few in number, they seem to us to be relatively explicit about the movements of army units, and it is precisely at the time of the construction of the Wall that military personnel appear in Amiens. This shorter and probably safer route explains why the empire maintained two naval bases in Boulogne and Dover, which protected the passage by sea. And it is precisely on this route that we find the famous patera with which we began this study.
ACKNOWLEDGEMENTS
Drs H. Orengo and A. Livarda are thanked for supplying copies of Figures 2 and 3 and for permission to reproduce them.
SUPPLEMENTARY MATERIAL
For supplementary material for this article, please visit <https://doi.org/10.1017/S0068113X22000216>.
The supplementary material comprises texts of the inscriptions noted on Figure 4 and a list of potters and sites represented on Figure 15.



