


In this update to previous research, we revisit high-profile media coverage of state supreme court decisions. We do so by using important new data for state supreme court decisions developed by Hall and Windett (Reference Hall and Windett2013) in combination with an updated version of existing case salience data (Vining and Wilhelm Reference Vining and Wilhelm2011). We also provide data beyond the current limits of the Hall and Windett data to facilitate compatibility with forthcoming updates. These updated data allow us to describe the set of state high court decisions that received front-page coverage from 1995 to 2019 and provide an overview of salient cases in the US states.
Media coverage of judicial decisions
Media coverage of state supreme court decisions is relatively scarce. Hale (Reference Hale2006, Reference Hale9) remarked that “[n]ewspapers will publish scores for all of the high school football games in their state, but they will not publish a brief item about every state supreme court decision.” Substantial empirical evidence supports Hale’s claim (Hale Reference Hale2006; Vining et al. Reference Vining, Wilhelm, Hiers and Marcin2010; Vining and Wilhelm Reference Vining and Wilhelm2011; Yanus Reference Yanus2009). The dearth of press interest in state court decisions is noteworthy given their importance in the lives of citizens. State courts process more than 99% of criminal and civil cases in the United States, and very few of their decisions are subjected to federal oversight (Solimine Reference Solimine2002).Footnote 1 Furthermore, most states have some electoral mechanism for selecting or retaining state high court judges to establish a direct connection between citizens and the bench. Still, most outputs from state high courts are ignored by the mass media.
The limited attention to courts is potentially important given the relationship between the press and public opinion (McCombs and Shaw Reference McCombs and Shaw1972). Public awareness and perceptions of state courts are influenced by press coverage, just as they are for other government institutions (Zaller Reference Zaller1992). When press attention is directed primarily toward controversial or unusual rulings, the public receives a specific framing of judicial institutions and the judges who fill the bench. This framing is meaningful given the need for institutional legitimacy of courts. In addition, press coverage of the judiciary can be significant for elected judges (Hughes Reference Hughes2020; Reference Hughes2022). Widespread reporting on a small number of judicial votes inconsistent with public opinion can lead to the end of judges’ careers on the bench (Pettys Reference Pettys2011; Reid Reference Reid1999; Wold and Culver Reference Wold and Culver1987).
While the obscurity of state court news may or may not be lamentable, it is reasonable that not every state supreme court case is newsworthy. Journalists must consider which cases merit recognition given the full range of news events competing for press attention and space in the news hole. This is not only true for decisions in state courts but for decisions at any court, including the Supreme Court of the United States (Collins and Cooper Reference Collins and Cooper2012; Denison et al. Reference Denison, Wedeking and Zilis2020; Epstein and Segal Reference Epstein and Segal2000; Strother Reference Strother2017; Vining and Marcin Reference Vining and Marcin2014).
Front-page coverage and case salience
While any media coverage of a court decision is significant given what we know about the scarcity of news about lower courts (Hughes Reference Hughes2020), high-profile coverage is particularly meaningful. Featured coverage indicates that journalists understand that a case is particularly important, interesting, or likely to attract news consumers. Moreover, if a case is given high-profile media coverage it is a signal that journalists recognize that the central issues in the case are more newsworthy than other possible subjects of featured news content. Issue salience is an important concept in political science, as it influences both the actions of political elites (Mayhew Reference Mayhew1974) and public evaluations of them (Edwards, Mitchell, and Welch Reference Edwards, Mitchell and Welch1995). Politicians give more attention to issues that are salient to their constituents (Sulkin Reference Sulkin2005) and political campaigns and elections may be framed by issues salient to the electorate (Abramowitz Reference Abramowitz1995; Petrocik Reference Petrocik1996).
Salient cases in the state high courts and data sources
In the last decade, research studying issue or case salience at state high courts has focused on the role of salience in elite and popular awareness of judicial institutions as well as the impact of salience on judicial outcomes and legitimacy. Much of this research follows the path established by Epstein and Segal’s (Reference Epstein and Segal2000) study of issue salience at the US Supreme Court. They identified the set of cases that received front-page coverage in The New York Times after their decisions were released, providing the groundwork for advances toward valid, reliable, and transportable measures of salience to follow (Clark et al. Reference Clark, Lax and Rice2015; Collins and Cooper Reference Collins and Cooper2012).
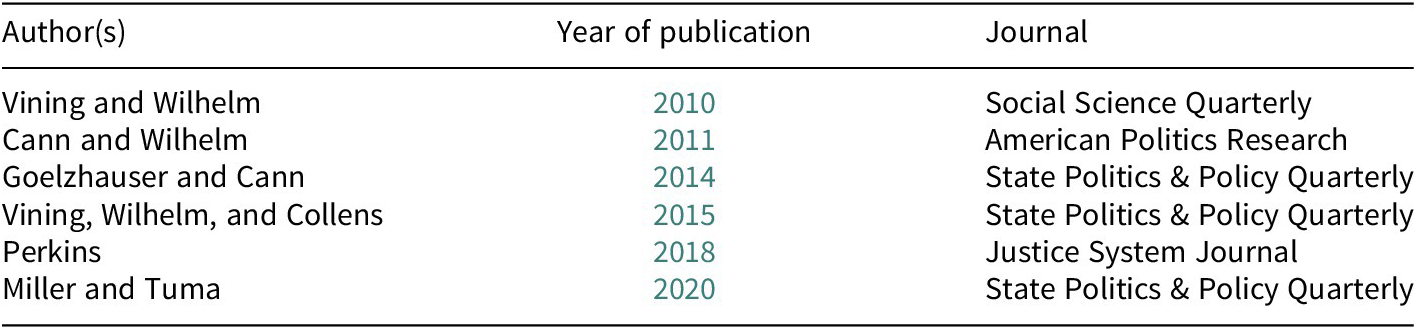
Vining and Wilhelm (Reference Vining and Wilhelm2010; Reference Vining and Wilhelm2011) introduced a media-based salience indicator for state high courts that reports whether a case decision was reported on the front page of the state’s most-circulated newspaper the day after the decision. Their analyses include all 50 states during the 1995 to 1998 period included in the State Supreme Court Data Project (Brace and Hall Reference Brace and Hall2002). Like Hale (Reference Hale2006) and Yanus (Reference Yanus2009), they find that salient cases are rare – only 1.46% of state supreme court case decisions received timely front-page coverage (Vining and Wilhelm Reference Vining and Wilhelm2011). Their results indicate that salient decisions disproportionally declare state laws unconstitutional, have amicus briefs filed, and/or include published dissenting opinions. The content of salient cases more often includes death penalty or privacy issues (Vining and Wilhelm Reference Vining, Wilhelm, Hiers and Marcin2010) than other subjects. This method of measuring salience has been used in several published studies. We provide a partial list of those research projects in Table 1.
Select publications using Vining and Wilhelm (Reference Vining and Wilhelm2011) case salience measure.

Research examining case salience at the state level generally agrees that coverage of state supreme court cases is uncommon and associated with dramatic, novel, and high-stakes issues or rulings. Constitutional and capital cases are reported disproportionately. Unfortunately, all of these studies are quite limited in terms of their sample of cases, the number of states examined, or their time frame. This is largely a result of limited access to news archives in electronic databases (Vining et al. Reference Vining, Wilhelm, Hiers and Marcin2010; Yanus Reference Yanus2009) or the limited availability of case-level data to match with the results of media searches (Vining and Wilhelm Reference Vining and Wilhelm2010; Reference Vining and Wilhelm2011; Vining, Wilhelm, and Collens Reference Vining, Wilhelm and Collens2015).
The utility of existing measures of case salience in the state supreme courts largely depended on compatibility with the State Supreme Court Data Project (SSCDP) assembled by Brace and Hall (Reference Brace and Hall2002). These data include a sample of over 28,000 state supreme court decisions from all 50 states during 1995 to 1998. The impact of this seminal data set on the study of state courts cannot be overstated. More recently, Hall and Windett (Reference Hall and Windett2013) introduced a new data set for state high court decisions from 1995 to 2010. Their data were collected with automated textual analysis that identified key characteristics of each case on the states’ dockets, and include more than 168,000 cases from all 50 states. The release of these data facilitates additional exploration of case salience and media coverage at state high courts and assists the assessment of trends in state supreme court news after the 1990s.
Salient case trends: an update
Like the original SSCDP-compatible measure of case salience released by Vining and Wilhelm (Reference Vining, Wilhelm, Hiers and Marcin2010; Reference Vining and Wilhelm2011), our updated measure uses front-page coverage in a state’s most circulated newspaper to indicate case salience. These newspapers are expected to influence the agenda of statewide media and therefore the news content that is transmitted to the states’ citizens (McCombs and Shaw Reference McCombs and Shaw1972). Our list of newspapers mirrors those used in the original data collection effort by Vining and Wilhelm (Reference Vining and Wilhelm2011).Footnote 2
Following Epstein and Segal (Reference Epstein and Segal2000) and Vining and Wilhelm (Reference Vining and Wilhelm2011), we review front-page newspaper coverage within one day of the court’s decision. Consistent with Strother’s (Reference Strother2019) criticism of post decision salience scores, we concede this is a conservative measure. That said, it is realistic to expect that a rather limited collection of state supreme court cases will attract substantial media coverage (Hale Reference Hale2006).Footnote 3
We compiled the updated list of front-page cases using electronic searches in online archives.Footnote 4 Data were collected for all 50 states during the period from 1999 to 2019, which included a total of 879 state high court cases that received front-page coverage.Footnote 5 Our new list of salient cases was then combined with the preexisting list released by Vining and Wilhelm (Reference Vining and Wilhelm2011) for a total of 1282 salient cases from 1995 to 2019.
Trends over time
In Figure 1, we display the volume of front-page coverage of state supreme court decisions over time. Each shaded bar represents the total number of salient cases in a year. It is evident from this information that front-page coverage of supreme court cases has declined steadily over time. The number of high-profile cases during the 1990s was often double (or more) the number of cases in other years. High-profile coverage of state supreme court cases was most frequent in 1998 (105 cases) and least frequent in 2019 (11 cases), while the mean in our sample is 50.1 cases in a given year. The overall trend shown here is consistent with the decline of the journalism industry since the 1990s, as staff cuts and reduced expertise resulted in less coverage of local government activities (Hayes and Lawless Reference Hayes and Lawless2018; Rubado and Jennings Reference Rubado and Jennings2020). The consequences of these trends for judicial institutions merit examination in future research – as does whether online news filled this coverage gap.
Number of salient cases by year, 1995–2019.

Trends across states
In Figure 2, we present trends in front-page coverage of state supreme court decisions across states. Each shaded bar represents the total number of salient cases in each state in our data. As the graph illustrates, front-page coverage varies widely across the states, with no obvious regional patterns. The mean number of cases with front-page coverage across all states is 25.9. New Hampshire had the most high-profile coverage of cases, with 99 salient cases in our data. Wisconsin, Vermont, and North Dakota tied for the least amount of coverage, with only 1 salient case in each of these states. The causes of this variation are ripe for analysis, with trends related to media ownership, editorial preferences, and market forces serving as potential explanations (Dunaway Reference Dunaway2008; Hamilton Reference Hamilton2004; Yan and Napoli Reference Yan and Napoli2006).
Number of salient cases by state, 1995–2019.

Trends across issue areas
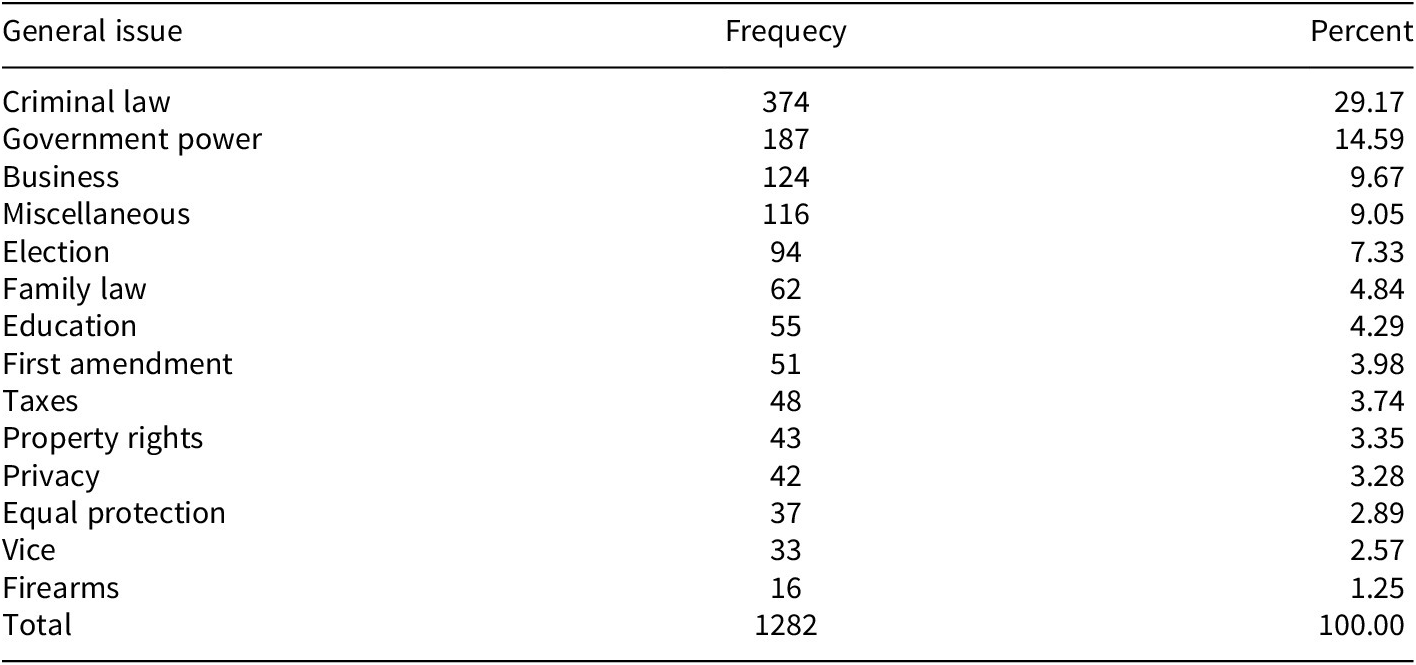
To examine the issues that motivate high-profile coverage of courts, we use case-level content analysis to identify the general issue areas present in each case from 1995 to 2019.Footnote 6 We present a summary of general issues areas for all salient cases in Table 2, and a graph illustrating each category’s prominence in Figure 3. These categories provide a nuanced understanding of the content of salient state supreme court decisions.
Salient cases by general issue area, 1995–2019.

Salient cases by general issue area, 1995–2019.

Nearly 3 in 10 (N = 374; 29.17%) cases featured on the front page were criminal appeals. This is consistent with Hamilton’s (Reference Hamilton2004) argument that criminal cases are likely to receive press attention because they are interesting to many news consumers. They include hard news and soft news as well as the drama, conflict, and novelty that stir interest among potential audience members. News content about criminal cases frequently addressed criminal procedure or the death penalty. This is consistent with media interest in individual rights and capital cases observed in earlier research (Vining and Wilhelm Reference Vining and Wilhelm2010; Vining, Wilhelm, and Collens Reference Vining, Wilhelm and Collens2015).
The next most frequent area of interest was government power, which accounts for 14.59% of cases (N = 187). These cases deal with governmental affairs and resolve controversies about the powers of governors, state legislatures, state government agencies, and local government bodies. State high court rulings on business matters (N = 126; 9.83%), election issues (N = 95; 7.40%), family law (N = 61; 4.76%), and education (N = 53; 4.13%) round out the 6 most common general issue areas. All these issue areas can stir interest among news consumers because of potential impact on their own lives and communities. They may also be easier for readers to understand given the drama, conflict, and geographic proximity of the relevant events (Graber and Dunaway Reference Graber and Dunaway2017; Hamilton Reference Hamilton2004). Familial relations and educational matters, for example, are often highlighted by journalists because they deal with contentious topics that attract readers such as divorce, custody battles, and education funding.
First Amendment issues (N = 52; 4.06%), taxes (N = 47; 3.67%), property rights (N = 43; 3.28%), and privacy (N = 42; 3.28%) are the next most common categories. Civil liberties, citizens’ tax burdens, and property disputes (both among citizens and between citizens and government) are relatable issues for potential readers. Not surprisingly, the property rights case Kelo v. New London 268 Conn. 1 (2004) received high-profile coverage at the state level before becoming a landmark US Supreme Court decision.
Equal Protection cases at the state level have reached newspapers’ front pages occasionally since 1995 (N = 38; 2.96%), with most coverage appearing after 2010. This primarily reflects national policy debates over gay rights and same-sex marriage, though related cases also addressed discrimination related to gender, race, age, immigration status, etc. Other featured general issue areas also invoked morality, liberty, or privacy issues. Controversies related to vice (N = 33; 2.57%) and firearms (N = 15; 1.17%) involved restriction or expansion of individual rights. These policies are often politically divisive, making them prime content for front-page news. “Miscellaneous” cases which were more idiosyncratic in their general issues make up 9.11% of the set of salient cases (N = 117).
Salient versus non-salient cases
In order to compare salient case trends with those that do not receive high-profile attention, we created a binary variable labeled as “salient case” within the Hall and Windett (Reference Hall and Windett2013) data set. While the larger database does not specify an issue area for all cases similar to the information presented above, it does indicate the legal area for all cases. Hall and Windett determined the legal area using the first Lexis Nexis headnote for each case. While they concede that the strategy is imprecise (p. 439–440), this category is useful for comparing trends within both salient and non-salient cases. The results are listed in Table 3.Footnote 7
Distribution of cases by legal area, salient and non-salient cases 1995-2019

Note. N = 168,581 (926 salient; 167,655 non-salient). Salient cases that do not appear in the Windett and Hall (2013) database are not included in these calculations.
In some ways, the frequency of legal areas in salient cases looks largely like that of non-salient cases. Civil procedure and criminal law cases occur most frequently in both sets of cases. They are approximately 44% of the salient cases (22.68% and 20.63%, respectively), and a similar proportion of the non-salient cases (23.27% and 19.87%, respectively). The rank ordering of legal area types also looks similar for salient and non-salient cases. After civil procedure and criminal cases, disputes involving governments, constitutional law, and administrative law are prominent for both categories. Thus, both sets of cases share their five most common legal areas.
While the ordering of legal areas by frequency is similar between salient and non-salient cases, their proportions offer some differences. For instance, cases involving governments are an outsized proportion of the salient cases relative to non-salient cases (14.58% salient, 3.48% non-salient). The same is true for cases involving constitutional law (10.80% salient, 3.02% non-salient) and administrative law (4.32% salient, 2.73% non-salient). These top 5 categories of legal areas comprise 73.01% of all salient cases, but only 55.39% of non-salient cases. This finding is consistent with studies of state supreme court news that found more prominent coverage of cases involving constitutional issues (Vining and Wilhelm Reference Vining and Wilhelm2011; Yanus Reference Yanus2009) and high-stakes legal controversies (Vining and Wilhelm Reference Vining, Wilhelm, Hiers and Marcin2010).
Discussion and conclusion
In this research update, we introduce an expanded data set to analyze the causes and consequences of case salience at the state level. Prior studies focused primarily on the period from 1995 to 1998 to match the limits of the State Supreme Court Data Project (Brace and Hall Reference Brace and Hall2002), but additional state supreme court data by Hall and Windett (Reference Hall and Windett2013) make it possible to conduct contemporary and longitudinal analyses. Our update extends data collection through 2019 to facilitate studies using a broader time period. We analyze the temporal and regional trends in these new data, as well as the general issue content of these cases. We also provide an analysis of the legal areas set forth by Hall and Windett to offer a limited comparison between salient and non-salient cases.
When state supreme court decisions are given front-page coverage, they often include elements that are controversial, sensational, or familiar to potential news consumers. These characteristics match those expected of news content by scholars from multiple theoretical schools. Press attention to court decisions has consequences for judges who depend on public goodwill for institutional legitimacy and, in many cases, job security.
We hope this extension of earlier data (Vining and Wilhelm Reference Vining and Wilhelm2011) will facilitate additional studies of case salience, public awareness, popular perceptions, judicial behavior, and electoral outcomes. Research on the US Supreme Court has far outpaced state courts research on several of these topics. Here we provide a tool to narrow these gaps.
Data availability statement
Replication materials are available on SPPQ Dataverse at https://doi.org/10.15139/S3/NUYYZG (Vining, Wilhelm, and Hendricks-Benton Reference Vining, Wilhelm and Hendricks-Benton2024).
Financial support
The authors received no financial support for the research, authorship, and/or publication of this article.
Competing interest
The authors declared no potential conflicts of interest with respect to the research, authorship, and/or publication of this article.
Author biographies
Richard L. Vining, Jr., is a Professor in the Department of Political Science at the University of Georgia. His research examines federal and state courts, interbranch relations, and how courts and judges interact with the public and media. He can be reached at rvining@uga.edu.
Teena Wilhelm is an Associate Professor in the Department of Political Science at the University of Georgia. Her research examines judicial institutions, state politics, and public land policy. She can be reached at twilhelm@uga.edu.
Alyson Hendricks-Benton is a PhD candidate in the Department of Political Science at the University of Georgia. Her research focuses on gender and race in the state and federal courts and the impact of media on political processes. She can be reached at alyson.hendricks@uga.edu.


 Open access