

1. Introduction
Nuclear magnetic resonance (NMR) spectroscopy is one of the most powerful tools available for structural biology. Rapid progress in the development of NMR hardware and software has made it into a mature technique, which is reflected in the fact that much modern NMR research focuses on its applications in the study of complex systems such as biological macromolecules. In such investigations, NMR is frequently used in an integrated fashion together with other analytical and computational techniques. This review focuses on the use of solution-state NMR spectroscopy to quantitatively characterize protein dynamics, and the insights into protein function that can be gleaned from such experiments. NMR is uniquely suitable for quantifying protein dynamics because (i) it can be used to quantify dynamics over a wide range of time scales, from picoseconds to hours; (ii) dynamics can be quantified under equilibrium conditions, with no need for external perturbations such as changes of temperature or pressure; (iii) dynamics can be quantified using many probes simultaneously, with atomic resolution; and (iv) a large set of orthogonal experimental approaches for quantifying dynamics have been developed. The fact that protein flexibility is an innate and crucial property of enzymes has been appreciated since the introduction of the induced fit theory (Bennett & Steitz, Reference Bennett and Steitz1978; Koshland, Reference Koshland1958), which builds on Emil Fischer's lock-and-key model (Fischer, Reference Fischer1894). Conformational changes in protein structures caused by substrate binding have historically been identified from x-ray crystallography, and it has become evident that subtle structural changes can have profound effects on enzyme performance. For instance, sub-angstrom changes in the positions of amino acid residues in the active site of isocitrate dehydrogenase can change its kinetic parameters by several orders of magnitude (Mesecar et al. Reference Mesecar, Stoddard and Koshland1997). An expansion of the induced fit model is the conformational selection or population shift model, which builds on the Monod, Wyman and Changeux (MWC) model of cooperativity (Monod et al. Reference Monod, Wyman and Changeux1965). This model predicts the existence of functional high-energy states of proteins that are sampled in the absence of a substrate or binding partner. NMR is uniquely suited for the detection and structural description of these high-energy states, as discussed in detail below. It is now textbook knowledge (Williamson, Reference Williamson2012) that proteins are dynamic and that structural states should be treated as ensembles that fluctuate around energy minima. This behavior is described by the energy landscape theory (Frauenfelder et al. Reference Frauenfelder, Sligar and Wolynes1991), which can be applied to protein dynamics using the principle of minimal frustration (Ferreiro et al. Reference Ferreiro, Hegler, Komives and Wolynes2007, Reference Ferreiro, Komives and Wolynes2014; Jenik et al. Reference Jenik, Gonzalo Parra, Radusky, Turjanski, Wolynes and Ferreiro2012). NMR spectroscopy has developed in parallel with the energy landscape theory, and the two research fields are now converging to provide an unprecedented understanding of protein function.
Because NMR spectroscopy has been used to study the dynamics of many kinds of biological macromolecules, it would be impossible to present a comprehensive list of its use for this purpose in this review. We therefore do not discuss the use of NMR to study nucleic acid dynamics (Kimsey et al. Reference Kimsey, Petzold, Sathyamoorthy, Stein and Al-Hashimi2015) and structure (Keane et al. Reference Keane, Heng, Lu, Kharytonchyk, Ramakrishnan, Carter, Barton, Hosic, Florwick, Santos, Bolden, Mccowin, Case, Johnson, Salemi, Telesnitsky and Summers2015), or quantitative analysis of protein dynamics using solid state NMR spectroscopy (Lewandowski, Reference Lewandowski2013; Ullrich & Glaubitz, Reference Ullrich and Glaubitz2013). We also do not cover the use of NMR to study protein folding (Dyson & Wright, Reference Dyson and Wright2004) or intrinsically disordered proteins (Dyson & Wright, Reference Dyson and Wright2005; Wright & Dyson, Reference Wright and Dyson2015), although it is important to note that both fields are relevant to protein function. Furthermore, we do not attempt to provide a comprehensive list of important discoveries about protein function that have been made using solution state NMR experiments; our aim is to highlight the most important contributions from our perspective.
2. Development of NMR spectroscopy for quantification of protein dynamics
In the first part of this review we will discuss how modern high-resolution NMR spectroscopy has evolved into an exceptionally well-developed technique of great value in structural biology (Fig. 1). Based on the fundamental observations of Zeeman (Reference Zeeman1897) and Gerlach & Stern (Reference Gerlach and Stern1922), Isaac Rabi discovered the magnetic properties of nuclei in 1936 and developed a resonance method for their detection. Bloch (Reference Bloch1946) and Purcell et al. (Reference Purcell, Torrey and Pound1946) independently discovered the magnetic resonance of nuclei and the ‘Bloch equations’ were formulated. Later on, Gutowsky et al. (Reference Gutowsky, Mccall and Slichter1953) and McConnell (Reference Mcconnell1958) revised the Bloch equations to account for exchange effects between different sites in a molecule. Luz & Meiboom (Reference Luz and Meiboom1963) published the first analytical solution for two-site exchange for any given set of experimental parameters valid in the fast exchange limit.
Development of solution state NMR for quantification of protein dynamics. The curved arrow describes key developments and findings that constitutes the basis for quantification of protein dynamics from high-resolution solution state NMR spectroscopy. Basic discoveries are shown in red and are followed in order of prismatic colors by increasingly specific findings, which have led to the experimental setups used presently.
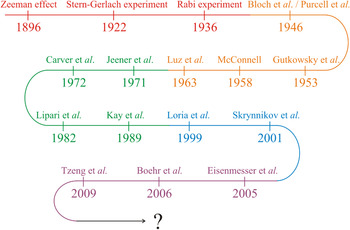
An important milestone in the development of multi-dimensional NMR spectroscopy was the introduction of two-dimensional (2D) experiments by Jeener et al. (Reference Jeener, Meier, Bachmann and Ernst1979). This was followed by the development of the model-free approach for quantifying protein motion, which was presented by Lipari & Szabo (Reference Lipari and Szabo1982a) and is important in the study of dynamics by NMR. The Lipari and Szabo theory applies in the Redfield limit of the Bloch-Wangsness-Redfield theory (Redfield, Reference Redfield1957, Reference Redfield and John1965; Wangsness & Bloch, Reference Wangsness and Bloch1953). A subsequent fundamental contribution was made by Kay et al. (Reference Kay, Torchia and Bax1989) with the development of inverse detected heteronuclear pulse sequences for determining the longitudinal and transversal relaxation rates (R 1 and R 2, respectively) as well as the heteronuclear nuclear Overhauser effect (hNOE). Protein motions on the μs-to-ms time scale have become widely experimentally accessible because of the relaxation-compensated Carr-Purcell-Meiboom-Gill (CPMG) pulse sequence introduced by Loria et al. (Reference Loria, Rance and Palmer1999). It was later shown that the time required for these experiments can be significantly reduced by applying a constant time relaxation period (Skrynnikov et al. Reference Skrynnikov, Mulder, Hon, Dahlquist and Kay2001).
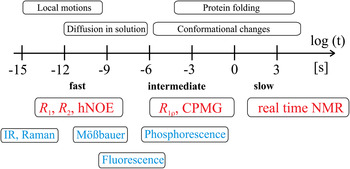
Together, these contributions provide a robust theoretical and experimental basis for understanding the connections between protein dynamics and protein function (Boehr et al. Reference Boehr, Dyson and Wright2006a; Eisenmesser et al. Reference Eisenmesser, Millet, Labeikovsky, Korzhnev, Wolf-Watz, Bosco, Skalicky, Kay and Kern2005; Tzeng & Kalodimos, Reference Tzeng and Kalodimos2009). Among methods for studying protein dynamics, solution state NMR spectroscopy is unique in its ability to provide quantitative information on dynamics at atomic resolutions (i) under equilibrium conditions with no external perturbations based on the addition of co-solvents or changes in the experimental conditions (temperature, pressure, pH), (ii) using multiple atomic probes in a single protein, and (iii) on time scales ranging over 18 orders of magnitude (Fig. 2) (Kempf & Loria, Reference Kempf and Loria2003). While NMR research formerly suffered from size limitations that restricted its applicability in the analysis of larger systems, these have largely been abolished by the introduction of transverse relaxation optimized spectroscopy (TROSY)-based experiments (Pervushin et al. Reference Pervushin, Riek, Wider and Wuthrich1997; Tugarinov et al. Reference Tugarinov, Hwang, Ollerenshaw and Kay2003), new coherence transfer approaches (Fiaux et al. Reference Fiaux, Bertelsen, Horwich and Wuthrich2002; Riek et al. Reference Riek, Fiaux, Bertelsen, Horwich and Wüthrich2002) and the sensitivity improvements made possible by the widespread availability of cryogenic probes and high field magnets (Fiaux et al. Reference Fiaux, Bertelsen, Horwich and Wuthrich2002; Gelis et al. Reference Gelis, Bonvin, Keramisanou, Koukaki, Gouridis, Karamanou, Economou and Kalodimos2007; Mainz et al. Reference Mainz, Religa, Sprangers, Linser, Kay and Reif2013; Rudiger et al. Reference Rudiger, Freund, Veprintsev and Fersht2002; Saio et al. Reference Saio, Guan, Rossi, Economou and Kalodimos2014; Sprangers et al. Reference Sprangers, Gribun, Hwang, Houry and Kay2005, Reference Sprangers, Velyvis and Kay2007; Sprangers & Kay, Reference Sprangers and Kay2007; Tugarinov et al. Reference Tugarinov, Hwang and Kay2004).
Time scale of protein events and corresponding NMR techniques. The time scale available for detection of motional events in proteins by solution state NMR spectroscopy comprises more than 18 orders of magnitude as indicated with the logarithmic scale below the arrow. Dynamics can be divided into slow (k ex ≪ Δω), intermediate (k ex ~ Δω), and fast (k ex ≫ Δω) events on the NMR time scale, where k ex corresponds to the exchange rate constant of a dynamic process (k ex = k forward + k reverse) and Δω is the difference in chemical shifts for a two-site exchange model. Typical events occurring in proteins at these time scales are listed above the arrow. NMR experiments suitable for quantification of dynamics in a specific regime are colored in red and complementary techniques suitable for quantification of protein dynamics are colored in blue.
3. Integration of NMR with other analytical methods
A consequence of the maturity of NMR methods is that many NMR laboratories now focus their efforts on biological questions. Since most aspects of proteins’ biological functions are complex, it is often necessary to investigate them using multiple orthogonal experimental techniques in order to obtain robust conclusions. Consequently, NMR is often one tool among many that are used in an integrated fashion in a given research project. This section of the review highlights some notable cases in which NMR was successfully combined with other experimental techniques to study protein dynamics. In addition many of the specific findings described in Section 5 were obtained through such integrated research efforts. NMR spin relaxation is a powerful tool for exploring protein dynamics, often providing important kinetic parameters such as microscopic rate constants or residence times in different states. However, to relate these kinetic parameters to structures, these NMR data must often be complemented with 3D structural information obtained using techniques such as x-ray crystallography, separate NMR experiments, electron microscopy, small angle x-ray scattering (SAXS), or wide angle x-ray scattering (WAXS). Experiments using these methods are sometimes performed under different conditions to those used in solution-state NMR experiments; they may require the presence (or absence) of specific ligands or binding partners, or particular temperatures, pH values, or pressures. Nevertheless, the structures obtained using these methods are often used as models for the structural states observed by solution-state NMR. Many enzymes have been crystallized with and without ligands, resulting in the identification of multiple different conformations (Müller et al. Reference Müller, Schlauderer, Reinstein and Schulz1996; Müller & Schulz, Reference Müller and Schulz1992; Sawaya & Kraut, Reference Sawaya and Kraut1997). In such cases, data from dynamic experiments can be interpreted in terms of interconversions between these states. Mutations of single amino acids that stabilize minor conformations predicted by dynamics can be used to draw conclusions regarding the conformation of these states (Fraser et al. Reference Fraser, Clarkson, Degnan, Erion, Kern and Alber2009; Nikolova et al. Reference Nikolova, Kim, Wise, O'BRIEN, Andricioaei and Al-Hashimi2011). Structures of stabilized minor states can potentially be determined by NMR or x-ray crystallography (Fraser et al. Reference Fraser, Clarkson, Degnan, Erion, Kern and Alber2009), or their chemical shifts can be compared with relaxation dispersion data (Bouvignies et al. Reference Bouvignies, Vallurupalli, Hansen, Correia, Lange, Bah, Vernon, Dahlquist, Baker and Kay2011; Grey et al. Reference Grey, Wang and Palmer2003; Korzhnev et al. Reference Korzhnev, Religa, Banachewicz, Fersht and Kay2010; Nikolova et al. Reference Nikolova, Kim, Wise, O'BRIEN, Andricioaei and Al-Hashimi2011).
Computer based molecular dynamics simulations provide information that can be used in conjunction with dynamic data from NMR. In particular, simulations can provide the amplitudes of dynamic modes (Palmer, Reference Palmer2015), which generally cannot be determined from NMR spin relaxation experiments. The dependency is mutual since protein dynamics observed by NMR can be used to validate and develop the force fields used in molecular dynamics (MD) simulations. Limitations in computer performance and force field capabilities have previously restricted the use of MD simulations to interpret fast motions. However, it is now possible to perform simulations that extend into the ms regime (Lindorff-Larsen et al. Reference Lindorff-Larsen, Piana, Dror and Shaw2011; Vanatta et al. Reference Vanatta, Shukla, Lawrenz and Pande2015). The underlying spectral density function, which can be seen in simpler terms as the generalized order parameter based on the model-free formalism (Lipari & Szabo, Reference Lipari and Szabo1982a, Reference Lipari and Szabob), can be calculated directly from MD simulations (Levy et al. Reference Levy, Karplus and Wolynes1981; Stafford et al. Reference Stafford, Robustelli and Palmer2013). The order parameters obtained from MD simulations can then be compared with experimentally obtained spin relaxation parameters from NMR (R 1, R 2 and hNOE), which are determined by analysis using the model-free formalism (Lipari & Szabo, Reference Lipari and Szabo1982a, Reference Lipari and Szabob). This approach is exemplified by a recent study on cyclophilin A in which NMR experiments and simulations were used in tandem, suggesting that this enzyme catalyzes proline isomerization via an electrostatic handle mechanism (Camilloni et al. Reference Camilloni, Sahakyan, Holliday, Isern, Zhang, Eisenmesser and Vendruscolo2014).
SAXS experiments can be a valuable complement to NMR data for studying dynamics. For example, time-resolved SAXS (trSAXS) was combined with relaxation dispersion data by Phillips et al. (Reference Phillips, Schoeffler, Matsui, Weiss, Blankenship, Zobel, Giannetti, Dueber and Fairbrother2014) in order to explore the relationship between internal motions and the activation of cellular inhibitor of apoptosis 1 (cIAP1). trSAXS was used to describe global conformational changes on a time scale of seconds while R 2-relaxation dispersion experiments were used to characterize dynamics on the millisecond time scale. The potential of combining SAXS with NMR (along with a range of other techniques) is also demonstrated by the work of the van Thor group on the photoactive yellow protein (Ramachandran et al. Reference Ramachandran, Lovett, Carl, Cammarata, Lee, Jung, Ihee, Timmel and Van Thor2011).
SAXS and NMR can also provide complementary information on highly dynamic intrinsically disordered proteins (IDPs). NMR observables such as paramagnetic relaxation enhancements (PREs), residual dipolar couplings (RDCs) and NOEs can be combined with SAXS data to calculate an ensemble of structures representing the dynamic behavior of the IDP (Sibille & Bernado, Reference Sibille and Bernado2012). The same approach can also be used to study proteins with domains that are connected by flexible linkers.
Electron paramagnetic resonance (EPR) techniques like double electron-electron resonance spectroscopy (DEER) can be used to measure the distance between two spin labels attached to a protein (Hubbell et al. Reference Hubbell, Cafiso and Altenbach2000). In one notable example, DEER experiments using spin-labeled frozen samples (T = 60 K) of the photoactive yellow protein showed that the distance distribution of the labels changed on exposure of the photoreceptor to light (Ramachandran et al. Reference Ramachandran, Lovett, Carl, Cammarata, Lee, Jung, Ihee, Timmel and Van Thor2011). In the same study, time-resolved pump-probe x-ray scattering (TR-SAXS/WAXS) (Cammarata et al. Reference Cammarata, Levantino, Schotte, Anfinrud, Ewald, Choi, Cupane, Wulff and Ihee2008) was used to demonstrate that the radius of gyration and particle size both increased when the protein was exposed to light (Ramachandran et al. Reference Ramachandran, Lovett, Carl, Cammarata, Lee, Jung, Ihee, Timmel and Van Thor2011). Chemical shift perturbations and classical NOE data were combined with TR-SAXS/WAXS and DEER data to produce a model of the protein's dynamic light-exposed state (Ramachandran et al. Reference Ramachandran, Lovett, Carl, Cammarata, Lee, Jung, Ihee, Timmel and Van Thor2011).
Complementary functional data are also essential when interpreting dynamic processes and attempting to determine their biological relevance. Kinetic rate measurements can be performed to correlate dynamic rate constants to overall activity levels. For example, a study on the protein dehydrofolate reductase showed that the rate of loop opening to release the substrate/product was 11 s−1 (McElheny et al. Reference Mcelheny, Schnell, Lansing, Dyson and Wright2005), which is about 20 times slower than the hydride transfer catalyzed by this enzyme as determined by a fluorescence based assay (Fierke et al. Reference Fierke, Johnson and Benkovic1987). Similarly, the production of adenosine diphosphate (ADP) from adenosine monophosphate (AMP) and adenosine triphosphate (ATP) by Adenylate kinase (Adk) is monitored by a reduced nicotinamide adenine dinucleotide (NADH) absorption based coupled assay (Rhoads & Lowenstein, Reference Rhoads and Lowenstein1968) and has been used to correlate overall catalytic rates with dynamic processes in the protein (Wolf-Watz et al. Reference Wolf-Watz, Thai, Henzler-Wildman, Hadjipavlou, Eisenmesser and Kern2004). The examples listed in this section clearly show that combining NMR spectroscopy with other experimental techniques is a powerful way of addressing mechanistic questions in protein science.
4. Methods for quantifying dynamics by NMR spectroscopy
There exist many approaches for studying dynamics on different time scales using NMR spectroscopy. In this section we briefly summarize various methods that have proven to be useful for quantifying dynamics and relating them to protein function.
4.1 R 1 and R 2 relaxation and hNOE
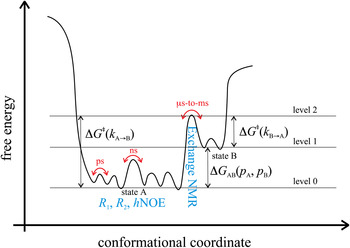
The longitudinal and transversal relaxation rates of proton-bound 13C or 15N nuclei are sensitive to protein motions on the ps-to-ns time scale, as are the associated heteronuclear NOEs (Figs 2 and 3). The values of these parameters can be determined using established methods (Kay et al. Reference Kay, Torchia and Bax1989; Nirmala & Wagner, Reference Nirmala and Wagner1988, Reference Nirmala and Wagner1989; Palmer et al. Reference Palmer, Rance and Wright1991), and the resulting relaxation data can be analysed using the model-free approach introduced by Lipari & Szabo (Reference Lipari and Szabo1982a) and extended by Clore et al. (Reference Clore, Szabo, Bax, Kay, Driscoll and Gronenborn1990). Several key parameters can be quantified via their relationship with spectral density functions (Abragam, Reference Abragam1961), including the rigidity of the bond vector under investigation, which is expressed by the parameter S 2; the time scales of intramolecular motions, expressed by the correlation time τ e; the overall level of molecular tumbling, expressed by the correlation time τ c; and the contributions to chemical exchange, R ex. Notably, the order parameter S 2 is important in methods for quantifying entropic contributions to phenomena such as ligand binding to enzymes, as discussed in Section 5.4.5 (Diehl et al. Reference Diehl, Genheden, Modig, Ryde and Akke2009; Marlow et al. Reference Marlow, Dogan, Frederick, Valentine and Wand2010; Seewald et al. Reference Seewald, Pichumani, Stowell, Tibbals, Regan and Stone2000; Trbovic et al. Reference Trbovic, Cho, Abel, Friesner, Rance and Palmer2009; Veglia & Cembran, Reference Veglia and Cembran2013); for a lengthier discussion, see the review by Wand (Reference Wand2013). Numerous relaxation studies have been conducted with the aim of relating inherent dynamic features on the ps-to-ns time scale to proteins’ functional properties (Fenwick et al. Reference Fenwick, Van Den Bedem, Fraser and Wright2014; Jankowski et al. Reference Jankowski, Saleh, Pai, Sriram, Birge and Kalodimos2012; Keramisanou et al. Reference Keramisanou, Biris, Gelis, Sianidis, Karamanou, Economou and Kalodimos2006; Kovermann et al. Reference Kovermann, Zierold, Haupt, Low and Balbach2011; Lu et al. Reference Lu, Cistola and Li2006; Miletti et al. Reference Miletti, Farber and Mittermaier2011; Zeeb et al. Reference Zeeb, Jacob, Schindler and Balbach2003). This fast time scale spin relaxation methodology has also been successfully applied to larger protein systems such as Arginine Kinase (Davulcu et al. Reference Davulcu, Flynn, Chapman and Skalicky2009). An elegant integrated approach for this purpose that combines room-temperature x-ray crystallography and NMR spectroscopy was presented by Wright and co-workers (Fenwick et al. Reference Fenwick, Van Den Bedem, Fraser and Wright2014). Two important reviews of this field have been published (Sapienza & Lee, Reference Sapienza and Lee2010; Wand, Reference Wand2001), which together provide a comprehensive overview of methods for studying fast time scale dynamics in proteins.
Energy landscape visualizing dynamic motions on different time scales. State A (energy level 0) corresponds to the most stable ground state of a protein that can be studied with for instance x-ray crystallography. State B (energy level 1) corresponds to a high-energy state that may be of functional importance and that can be studied with for instance, relaxation dispersion experiments. High-energy protein states are discussed extensively in Section 5. The transition state separating states A and B is indicated with energy level 2. NMR experiments that are suitable to observe ns-to-ps motions within one conformational state as well as μs-to-ms motions for the transition between conformational states are depicted in blue.
4.2 Relaxation dispersion
Many biological processes such as protein folding and conformational changes occur on the slow μs-to-ms time scale and as such proteins dynamics in this motional window are of general interest for understanding protein function (Figs 2 and 3). Dynamics on the μs-to-ms time scale can be characterized in terms of an exchange contribution, R
ex, to the observed transverse relaxation rate, $R_2^{{\rm obs}} $
, using the following expression:
$R_2^{{\rm obs}} $
, using the following expression:
 $$R_2^{{\rm obs}} = {R_{{\rm ex}}} + R_2^0 $$
where $R_2^0 $
is the intrinsic relaxation rate of the nuclei under investigation. For a two-site exchange R
ex depends on the population of the states (p
a, p
b), the difference in chemical shifts (Δω), the exchange rate constant (k
ex = k
f + k
r, where k
f and k
r are the forward and reverse rate constants, respectively) and the pulse repetition rate (τ
cp). Under free precession conditions, the time-dependent evolution of the magnetization can be described by the McConnell equations (McConnell, Reference Mcconnell1958). Sequences of 180° radiofrequency pulses executed with a frequency ν
cp = 1/4τcp are known as CPMG pulse trains (Carr & Purcell, Reference Carr and Purcell1954; Meiboom & Gill, Reference Meiboom and Gill1958) and enable detection of dynamic processes occurring on the μs-to-ms time scale. Luz & Meiboom (Reference Luz and Meiboom1963) presented a solution for a two-site exchange process assuming fast exchange ((k
ex/Δω) → ∞) between site a and b:
$R_2^0 $
is the intrinsic relaxation rate of the nuclei under investigation. For a two-site exchange R
ex depends on the population of the states (p
a, p
b), the difference in chemical shifts (Δω), the exchange rate constant (k
ex = k
f + k
r, where k
f and k
r are the forward and reverse rate constants, respectively) and the pulse repetition rate (τ
cp). Under free precession conditions, the time-dependent evolution of the magnetization can be described by the McConnell equations (McConnell, Reference Mcconnell1958). Sequences of 180° radiofrequency pulses executed with a frequency ν
cp = 1/4τcp are known as CPMG pulse trains (Carr & Purcell, Reference Carr and Purcell1954; Meiboom & Gill, Reference Meiboom and Gill1958) and enable detection of dynamic processes occurring on the μs-to-ms time scale. Luz & Meiboom (Reference Luz and Meiboom1963) presented a solution for a two-site exchange process assuming fast exchange ((k
ex/Δω) → ∞) between site a and b:
 $${R_2} = {R_{20}} + \displaystyle{{{\,p_{\rm a}}{\,p_{\rm b}}{\rm \Delta} {\omega ^2}} \over {{k_{{\rm ex}}}}}\left( {1 - \displaystyle{{4{\nu _{{\rm cp}}}} \over {{k_{{\rm ex}}}}}\tanh \left\{ {\displaystyle{{{k_{{\rm ex}}}} \over {4{\nu _{{\rm cp}}}}}} \right\}} \right)$$
with:
 $$R_{20}^{\rm a} = R_{20}^{\rm b} = {R_{20}}.$$
A general solution for a two-site exchanging system was introduced by Carver & Richards (Reference Carver and Richards1972) and further refined by Davis et al. (Reference Davis, Perlman and London1994):
 $$\eqalign{& {R_{2{\rm, eff}}}({\tau _{{\rm cp}}}) = 0.5\left( {{R_{{\rm 2a}}} + {R_{{\rm 2b}}} + {k_{{\rm ex}}} - \displaystyle{1 \over {{\tau _{{\rm cp}}}}}{\rm cos}{{\rm h}^{ - 1}}\left\{ {{D_ +} {\rm cosh}{\eta _ +} - {D_ -} {\rm cos}{\eta _ -}} \right\}} \right)} $$
with:
 $${D_ \pm} = 0.5\left( {\displaystyle{{\psi + 2{\rm \Delta} {\omega ^2}} \over {\sqrt {{\psi ^2} + {{\rm \varphi} ^2}}}} \pm 1} \right)$$
 $${\eta _ \pm} = \displaystyle{{{\tau _{{\rm cp}}}} \over {\sqrt 2}} \sqrt {\sqrt {{\psi ^2} + {{\rm \varphi} ^2}} \pm \psi} $$
 $$\psi = {\left( {{R_{{\rm 2a}}} - {R_{{\rm 2b}}} - {\,p_{\rm a}}{k_{{\rm ex}}} + {\,p_{\rm b}}{k_{{\rm ex}}}} \right)^2} - {\rm \Delta} {\omega ^2} + 4{\,p_{\rm a}}{\,p_{\rm b}}{k_{{\rm ex}}}^2 $$
 $${\rm \varphi} = 2{\rm \Delta} \omega \left( {{R_{{\rm 2a}}} - {R_{{\rm 2b}}} - {p_{\rm a}}{k_{{\rm ex}}} + {p_{\rm b}}{k_{{\rm ex}}}} \right)$$
 $${\rm \Delta} \omega = 2\pi {\rm \Delta} \nu. $$
It should be noted that even though Eq. (3) is a general solution for a two-site exchanging system, a linear correction must be applied to obtain an exact analytical solution (Baldwin, Reference Baldwin2014).
A robust experimental technique in which a relaxation-compensated CPMG pulse sequence is used to monitor chemical exchange processes with time constants of between 0·5 and 5 ms was introduced by Loria et al. (Reference Loria, Rance and Palmer1999). Time limitations for data acquisition were overcome by implementing a constant relaxation delay (Skrynnikov et al. Reference Skrynnikov, Mulder, Hon, Dahlquist and Kay2001). In parallel, Tollinger et al. (Reference Tollinger, Skrynnikov, Mulder, Forman-Kay and Kay2001) developed an approach that is applicable in the slow exchange limit, k ex/Δω → 0:
 $$R_{2{\rm a}}^{{\rm eff}} = R_{2{\rm a}}^0 = {k_{\rm a}} - {k_{\rm a}}\displaystyle{{\sin ({\rm \Delta} \omega /\{ 4{\nu _{{\rm cp}}}\} )} \over {{\rm \Delta} \omega /\{ 4{\nu _{{\rm cp}}}\}}} $$
with: $\left\vert {R_{2{\rm a}}^0 - R_{2{\rm b}}^0} \right\vert \ll {k_{\rm a}},\; {k_{\rm b}} \ll 4{\nu _{{\rm cp}}}$
and ν
cp as the inverse of τ
cp.
$\left\vert {R_{2{\rm a}}^0 - R_{2{\rm b}}^0} \right\vert \ll {k_{\rm a}},\; {k_{\rm b}} \ll 4{\nu _{{\rm cp}}}$
and ν
cp as the inverse of τ
cp.
The theoretical and experimental framework outlined above has been used extensively to detect motions on the μs-to-ms time scale within proteins and understand their function (Beach et al. Reference Beach, Cole, Gill and Loria2005; Bhabha et al. Reference Bhabha, Lee, Ekiert, Gam, Wilson, Dyson, Benkovic and Wright2011; Boehr et al. Reference Boehr, Mcelheny, Dyson and Wright2006b; Eisenmesser et al. Reference Eisenmesser, Millet, Labeikovsky, Korzhnev, Wolf-Watz, Bosco, Skalicky, Kay and Kern2005; Farber & Mittermaier, Reference Farber and Mittermaier2011; Farber et al. Reference Farber, Slager and Mittermaier2012; Korzhnev et al. Reference Korzhnev, Religa, Banachewicz, Fersht and Kay2010, Reference Korzhnev, Salvatella, Vendruscolo, Di Nardo, Davidson, Dobson and Kay2004; Kovermann & Balbach, Reference Kovermann and Balbach2013; Mulder et al. Reference Mulder, Mittermaier, Hon, Dahlquist and Kay2001a; Saio et al. Reference Saio, Guan, Rossi, Economou and Kalodimos2014; Sugase et al. Reference Sugase, Dyson and Wright2007; Tzeng & Kalodimos, Reference Tzeng and Kalodimos2009, Reference Tzeng and Kalodimos2013; Whittier et al. Reference Whittier, Hengge and Loria2013; Zeeb & Balbach, Reference Zeeb and Balbach2005). Some notable examples of its use are discussed in detail in Section 5.
4.2.1 Exchange regimes
The window in which exchange parameters can be accurately quantified from relaxation dispersion data is defined by exchange rate constants (k ex) of around 100–2000 s−1. However, by combining 15N and 1HN CPMG profiles with major state-induced 15N chemical shift changes (Vallurupalli et al. Reference Vallurupalli, Bouvignies and Kay2011), it is possible to increase the upper limit of this window to 4000–6000 s−1 (Sanchez-Medina et al. Reference Sanchez-Medina, Sekhar, Vallurupalli, Cerminara, Munoz and Kay2014). It is essential to establish the exchange regime for the process under investigation, which can be done quantitatively by analyzing the static field dependency of the exchange contribution (R ex) to the observed transverse relaxation rate, the so-called α-value (Millet et al. Reference Millet, Loria, Kroenke, Pons and Palmer2000). The α-value is defined according to; α = dln(Rex)/dln(Δω). An estimation of α (α′) can be calculated using:
 $$\alpha ^{\prime} = \displaystyle{{({B_{02}} + {B_{01}})} \over {({B_{02}} - {B_{01}})}}\displaystyle{{({R_{{\rm ex2}}} - {R_{{\rm ex1}}})} \over {({R_{{\rm ex2}}} + {R_{{\rm ex1}}})}}$$
where B 0 is the static magnetic field and R ex is the exchange contribution under different static fields with no applied CPMG field (i.e. ν CP equals zero). The subscript ‘n’ denotes the different static magnetic fields (n = 1, 2). It has been shown that for slow exchange 0 ⩽ α ⩽ 1, for intermediate exchange α = 1, and for fast exchange 1 ⩽ α ⩽ 2. Since the extraction of relevant parameters is most effective under an intermediate exchange regime, it can be useful to manipulate the time scale of exchange such that the exchange process occurs within this window. The most convenient way to accomplish this is by varying the temperature (modulation of k ex) or the static magnetic field (modulation of Δω). In order to retrieve parameters with high-precision when fitting relaxation data to the Carver–Richards equation, it is useful to repeat a relaxation dispersion experiment at two different static magnetic field strengths. This approach significantly reduces any co-variation of fitted parameters that could otherwise preclude accurate quantification of protein dynamics (Kovrigin et al. Reference Kovrigin, Kempf, Grey and Loria2006).
4.2.2 Determining the signs of chemical shifts from relaxation dispersion experiments
An inherent problem with chemical shift differences between major and minor states determined by fitting from relaxation dispersion experiments is that they are obtained as absolute values. This precludes their use as constraints when calculating the structures of minor states or as quantitative measures of protein activation. This problem was resolved when it was discovered that comparisons of chemical shifts in the indirect dimensions in either a pair of heteronuclear single quantum coherence spectroscopy (HSQC) spectra acquired at different magnetic fields or HSQC and heteronuclear multiple quantum coherence spectroscopy (HMQC) spectra acquired at a single field provide the sign of the chemical shift difference (Skrynnikov et al. Reference Skrynnikov, Dahlquist and Kay2002). This finding significantly expands the usefulness of chemical shifts determined by fitting from relaxation dispersion experiments.
4.2.3 Exchange models
As noted above, relaxation dispersion experiments enable the extraction of kinetic (rate constants), thermodynamic (populations), and structural (chemical shifts) parameters for a system undergoing exchange on the μs-to-ms time scale. These parameters are quantified by fitting analytical or numerical solutions of the Bloch-McConnell equations to the observed data. The most commonly used exchange model is the two-state model, which has been demonstrated (typically by means of statistical tests such as F-tests) to account for the observed CPMG field-dependent modulation of R 2,eff. It is however obvious that in most cases a two-state model will represent a significant simplification of a system undergoing exchange. On the other hand the two-state assumption is very important and its use has enabled many major discoveries. Expansions to three-state models require data of outstanding quality (Sugase et al. Reference Sugase, Dyson and Wright2007) and complexity, such as results from experiments conducted at multiple static magnetic field strengths or temperatures. In very favorable cases a three state model can be used without additional constraints such as addition of ligands or change of temperature (Meinhold & Wright, Reference Meinhold and Wright2011). There exist a few cases in which three-state models have successfully been applied to proteins undergoing exchange, such as the study by Grey et al. (Reference Grey, Wang and Palmer2003) on the multiple states induced by disulfide bond isomerization in the basic pancreatic trypsin inhibitor, and the calculation of structural ensembles of folding intermediates for two Fyn SH3 domain variants reported by Korzhnev et al. (Reference Korzhnev, Salvatella, Vendruscolo, Di Nardo, Davidson, Dobson and Kay2004). It should be noted that the three-state model in Korzhnev et al. (Reference Korzhnev, Salvatella, Vendruscolo, Di Nardo, Davidson, Dobson and Kay2004), was applied under the assumption that (i) the chemical shift differences between exchanging states are temperature-independent, and (ii) the temperature dependence of the rate constants obeys standard transition-state theory (Fersht, Reference Fersht2000). Analyses based on a three-state model have also shown that a C-terminal extension in the PBX homeodomain with an unfolded main ground state also populates two states in which it is either folded or misfolded (Farber et al. Reference Farber, Slager and Mittermaier2012). The three-state model was applied by incorporating additional information (in this case, ligand-induced chemical shift changes) in the fitting procedure, and the paper includes a description of a grid-based search procedure that can be used to extract dynamic parameters based on a three-state model.
4.2.4 Data clustering to increase precision of fitted parameters
Slow protein fluctuations such as conformational changes involve concerted movements of large groups of atoms. Hence when such processes are studied with relaxation dispersion methodology it can be expected that individual probes (nuclei) should share k ex values and populations of major and minor states. Global or cluster fits (assuming shared k ex values and populations) of groups of nuclei are therefore justified on physical grounds. Global fits have the advantage of increasing the precision with which exchange parameters are estimated (Demers & Mittermaier, Reference Demers and Mittermaier2009) but care must be taken with respect to how grouping is performed. Grouping can be performed by simply grouping nuclei, which yields exchange parameters similar to those obtained when nuclei are treated individually. Alternatively a structure-based approach can be used in which grouping is performed on the basis of secondary or tertiary structure elements and their arrangement. Regardless of the chosen approach, it is important to apply statistical tests such as those outlined by Ishima & Torchia (Reference Ishima and Torchia2005) to avoid over-fitting and/or incorrect grouping.
4.2.5 Properties/structures of minor states
As noted above, relaxation dispersion experiments can be performed to identify the exchange of major protein ground states and high-energy minor states. Accurate evaluation of the properties and functional relevance of these minor states is essential for understanding the influence of dynamics on protein function. When characterizing minor states it is generally informative to compare fitted chemical shifts to observations obtained by independent measurements. The following sections describe both direct and indirect methods for defining the properties of minor states.
4.2.6 Correlation between fitted and measured chemical shift differences
In an extensive study on the thermodynamics and kinetics of ligand binding to the Fyn SH3 domain, fitted and calculated chemical shifts were used to confirm that the binding event can be accurately described with a two-state model. Hansen et al. (Reference Hansen, Vallurupalli, Lundström, Neudecker and Kay2008) showed convincingly that the chemical shifts obtained from relaxation dispersion experiments were robust by comparing chemical shifts determined directly from NMR spectra to shifts determined from fits to dispersion data. In 15N relaxation dispersion experiments using a sample with a ligand:protein ratio of around 1·5, the fitted chemical shifts obtained by regression of the CPMG data show an one-to-one agreement with chemical shifts obtained by direct measurement in NMR spectra (Demers & Mittermaier, Reference Demers and Mittermaier2009). This correlation of the chemical shifts unambiguously demonstrated that the minor state corresponded to a ligand-bound protein structure. This example, which features tight experimental control over the major and minor states, demonstrates the validity of using fitted chemical shifts to identify the properties of minor states observed in CPMG experiments. Correlations between fitted chemical shift differences and experimentally determined chemical shifts for adjacent complexes in the catalytic cycle were also exploited in a study where the free energy landscape of dihydrofolate reductase was defined on the basis of CPMG experiments (Boehr et al. Reference Boehr, Mcelheny, Dyson and Wright2006b).
4.2.7 Structure determination of minor states from fitted chemical shifts
A more involved way of obtaining detailed structural information on minor states is to use chemical shifts obtained from CPMG experiments for structure calculations. This approach has been used to compute the structures of folding intermediates that are populated in two Fyn SH3 domain variants (Korzhnev et al. Reference Korzhnev, Religa, Banachewicz, Fersht and Kay2010, Reference Korzhnev, Salvatella, Vendruscolo, Di Nardo, Davidson, Dobson and Kay2004) and to determine a minor state structure of a Lysozyme variant (Bouvignies et al. Reference Bouvignies, Vallurupalli, Hansen, Correia, Lange, Bah, Vernon, Dahlquist, Baker and Kay2011). In the latter case, the structure calculation was performed by using chemical shifts for several nuclei from CPMG experiments to guide Rosetta loop building and refinement (Wang et al. Reference Wang, Bradley and Baker2007).
4.3 R 1ρ rotating frame relaxation
R 1ρ relaxation experiments measure NMR spin relaxation in the rotating frame (Palmer & Massi, Reference Palmer and Massi2006) and can be used to monitor transverse relaxation rate constants on a μs-to-ms time scale. They are closely related to the CPMG experiments described in Section 4.2 (Ishima & Torchia, Reference Ishima and Torchia1999), but R 1ρ experiments enable the observation of protein dynamics on a time scale that is around one order of magnitude faster time than is possible with CPMG-based experiments because they permit the use of higher refocusing frequencies and do not exceed the duty cycle of the CPMG pulse train. R 1ρ experiments use either near-resonant (Szyperski et al. Reference Szyperski, Luginbühl, Otting, Güntert and Wüthrich1993) or off-resonant (Akke & Palmer, Reference Akke and Palmer1996; Zinn-Justin et al. Reference Zinn-Justin, Berthault, Guenneugues and Desvaux1997) radiofrequency pulses to lock the magnetization along the direction of the effective field, ω e, in the rotating frame. The relaxation rate constant along the direction of the effective field, R 1ρ , depends on (i) the amplitude of the applied radiofrequency field, ω a; (ii) the frequency offset from the applied spin lock field, ∑; and (iii) the amplitude of the effective field, ω e = (∑2 + ω a 2)0·5.
The R 1ρ technique has been used to examine the dynamic interplay between mesophilic and thermophilic ribonuclease H variants (Butterwick & Palmer, Reference Butterwick and Palmer2006), to probe the conformational exchange of an oxidative folding intermediate (Gross et al. Reference Gross, Gallopin, Vandame, Couprie, Stura, Zinn-Justin and Drevet2010) or understand the function of a potassium channel ligand (Sher et al. Reference Sher, Chang, Li, Chhabra, Palmer, Norton and Chill2014). In analogy to relaxation dispersion measurements, both the magnitude and the sign of the chemical shift difference Δω of the exchanging species can be obtained from R 1ρ experiments (Trott & Palmer, Reference Trott and Palmer2002).
4.4 ZZ-exchange
Farrow et al. (Reference Farrow, Zhang, Forman-Kay and Kay1994a) introduced a pulse-sequence for the simultaneous determination of 15N longitudinal relaxation and chemical exchange on time scales of ms to s (Farrow et al. Reference Farrow, Zhang, Forman-Kay and Kay1994a). The so-called ZZ-exchange experiment is similar to an approach developed previously (Montelione & Wagner, Reference Montelione and Wagner1989) and has been used to investigate the slow folding and unfolding processes of an SH3 domain. The basic methodology (Farrow et al. Reference Farrow, Zhang, Forman-Kay and Kay1994a; Montelione & Wagner, Reference Montelione and Wagner1989) was further refined by the incorporation of TROSY (Li & Palmer, Reference Li and Palmer2009), which was made possible by the adoption of a strategy for excluding differential line-broadening effects (Kloiber et al. Reference Kloiber, Spitzer, Grutsch, Kreutz and Tollinger2011) and by using a composite intensity ratio with quadratic time dependence for data analysis (Miloushev et al. Reference Miloushev, Bahna, Ciatto, Ahlsen, Honig, Shapiro and Palmer Iii2008):
 $$I(t) = \displaystyle{{{a_{{\rm \alpha \beta}}} (t){a_{{\rm \beta \alpha}}} (t)} \over {{a_{{\rm \alpha \alpha}}} (t){a_{{\rm \beta \beta}}} (t) - {a_{{\rm \alpha \beta}}} (t){a_{{\rm \beta \alpha}}} (t)}} \cong \gamma {t^2}$$
where a αβ (t) is the peak amplitude of state β detected on state α using a mixing period t and γ = k 1 k −1 in which k 1 k −1 are the forward (k 1) and pseudo-first-order reverse (k −1) rate constants for the two-site exchange between α and β.
The usefulness of the ZZ-exchange methodology has been established by its application to a wide range of macromolecules such as dihydrofolate reductase (DHFR) (Morgan et al. Reference Morgan, Birdsall, Nieto, Gargaro and Feeney1999), ubiquitin conjugated enzymes Mms2-Ubc13 (Markin et al. Reference Markin, Saltibus, Kean, Mckay, Xiao and Spyracopoulos2010), an SH3 domain (Demers & Mittermaier, Reference Demers and Mittermaier2009), RNA (Latham et al. Reference Latham, Zimmermann and Pardi2009), a protein kinase (Stewart & Igumenova, Reference Stewart and Igumenova2012), chemokine (Tyler et al. Reference Tyler, Wieting, Peterson and Volkman2012), and a multidrug transporter (Morrison et al. Reference Morrison, Dekoster, Dutta, Vafabakhsh, Clarkson, Bahl, Kern, Ha and Henzler-Wildman2012).
4.5 Chemical- and dark-state- exchange saturation transfer
Chemical Exchange Saturation Transfer (CEST) (Bouvignies & Kay, Reference Bouvignies and Kay2012a, Reference Bouvignies and Kayb; Vallurupalli et al. Reference Vallurupalli, Bouvignies and Kay2012; Vallurupalli & Kay, Reference Vallurupalli and Kay2013) and Dark-state Exchange Saturation Transfer (DEST) (Fawzi et al. Reference Fawzi, Ying, Ghirlando, Torchia and Clore2011, Reference Fawzi, Ying, Torchia and Clore2010, Reference Fawzi, Ying, Torchia and Clore2012, Reference Fawzi, Libich, Ying, Tugarinov and Clore2014; Libich et al. Reference Libich, Fawzi, Ying and Clore2013) both rely on saturation transfer (Forsen & Hoffman, Reference Forsen and Hoffman1963) to provide information on invisible states in chemical exchange with visible states. In a saturation transfer experiment it must be possible to saturate the invisible state without saturating the visible state (Anthis & Clore, Reference Anthis and Clore2015). CEST and DEST experiments differ in the way they satisfy this prerequisite: CEST exploits a difference in resonance frequency between the two states whereas DEST exploits differences in line width. Both methods apply a saturation field with an offset from the visible state frequency if the invisible state is saturated, and the saturation will be transferred by chemical exchange to the visible state, leading to a decrease in the intensity of the latter. Plotting the intensity of the visible state against the offset of the saturation field will produce a saturation profile that can be analyzed using the McConnell equations (McConnell, Reference Mcconnell1958), giving the populations of the states and the kinetic parameters for the exchange. In addition, the invisible state's chemical shift (in CEST) or the R 2 relaxation rate (in DEST) will be obtained.
CEST can detect minor states that are in slow exchange (k ex between 10 and 500 s−1) provided that they are populated to at least 1%. Faster exchange (k ex > 500 s−1) approaches the intermediate exchange regime in which the two states do not have different chemical shifts. The sensitivity for the lower state is dependent on the applied saturation field. However, the chemical shift difference between the two states limits the field strength between 20 and 30 Hz (Vallurupalli et al. Reference Vallurupalli, Bouvignies and Kay2012), which limits the size of populations and speed of exchange that can be measured in this way. No such limitations on the maximum usable field strength apply in DEST experiments (in which the saturation field strength is >100 s−1), allowing smaller populations to be detected. DEST is effective at approximately the same time scale as CEST (k ex between 10 and 100 s−1), but in certain favorable cases its range can be extended to both slower (k ex < 10 s−1) and faster time scales (k ex > 1000 s−1) (Anthis & Clore, Reference Anthis and Clore2015).
4.6 Chemical shifts
The chemical shift is the most readily obtained NMR parameter and is always quantified for various nuclei in NMR spectroscopy. Since the chemical shift is extremely sensitive to the local magnetic environment it is also sensitive to the conformational state of a biomolecule. In the event of fast exchange between the two structural states (a and b), the observed chemical shift (ω OBS) is given by the following simple but very useful equation:
 $${\omega _{{\rm OBS}}} = {\,p_{\rm a}}{\omega _{\rm a}} + {\,p_{\rm b}}{\omega _{\rm b}}$$
where p a and p b are the statistical weights (or populations) of states a and b, and ω a and ω b are the corresponding chemical shifts. If the chemical shifts of the two exchanging states can be measured in independent experiments, it is possible to compute the free energy difference between these two states for any condition where the states are in fast exchange according to:
 $${\rm \Delta} G^0 = - RTln(p_{\rm a}/p_{\rm b})$$
where R is the gas constant and T the absolute temperature.
The analysis of chemical shifts in this way clearly reveals the equilibrium distribution between the exchanging structural states. The biggest challenge in analyzing chemical shifts is to quantify the chemical shifts of the ‘pure’ a and b states. For enzymes, one option is to approximate the chemical shifts of states a and b from apo and inhibitor-bound states, respectively. While this approach is useful, it is important to recall that both of these reference states can also be involved in various exchange processes that may complicate the analysis. Nevertheless, analyses of chemical shifts have provided significant insights into several systems and chemical shifts are often used as a measure of a reaction coordinate between the active and inactive states of proteins (Ådén et al. Reference Ådén, Verma, Schug and Wolf-Watz2012; Ådén & Wolf-Watz, Reference Ådén and Wolf-Watz2007; Li et al. Reference Li, Martins, Amarasinghe and Rosen2008; Masterson et al. Reference Masterson, Cheng, Yu, Tonelli, Kornev, Taylor and Veglia2010, Reference Masterson, Yu, Shi, Wang, Gustavsson, Mueller and Veglia2011b; Olsson & Wolf-Watz, Reference Olsson and Wolf-Watz2010; Volkman et al. Reference Volkman, Lipson, Wemmer and Kern2001). An alternative approach for quantification of chemical shifts is the projection analysis (Selvaratnam et al. Reference Selvaratnam, Vanschouwen, Fogolari, Mazhab-Jafari, Das and Melacini2012). In this approach, the chemical shift difference between states a and b is described as a vector (AB) and the chemical shift of a state under investigation is projected onto the AB vector. The resulting angle (cosθ) and activation vectors (defined by the magnitude of the projection onto AB) are useful tools in judging the global nature of an activation process, as illustrated for the cAMP-dependent guanine nucleotide exchange factor EPAC (Selvaratnam et al. Reference Selvaratnam, Vanschouwen, Fogolari, Mazhab-Jafari, Das and Melacini2012).
4.7 Paramagnetic relaxation enhancement
The paramagnetic relaxation enhancement (PRE) effect was firstly described by Solomon (Reference Solomon1955). It arises from magnetic dipolar interactions between a nucleus and the unpaired electrons of a spin label, which lead to an increased rate of relaxation. The large magnetic moment of the unpaired electron in the paramagnetic metal ion or nitroxide label enables the PRE to be detected at large distances – up to 35 Å (Clore & Iwahara, Reference Clore and Iwahara2009; Gillespie & Shortle, Reference Gillespie and Shortle1997a, Reference Gillespie and Shortleb). PRE experiments can thus be used to define long-range restraints for computing the structures of proteins bearing appropriate spin labels. Experiments of this sort have been used to study the structures of metal-binding proteins that already contain a paramagnetic ion or can readily be induced to bind to one (Bertini et al. Reference Bertini, Luchinat, Piccioli, Thomas, James and Uli2001). In addition, they can be used with proteins that have been labeled with probes based on nitroxides (Kosen, Reference Kosen1989) or metals (Gaponenko et al. Reference Gaponenko, Howarth, Columbus, Gasmi-Seabrook, Yuan, Hubbell and Rosevear2000). PRE rate constants are measured as the difference between the relaxation rates of paramagnetic and diamagnetic samples. The diamagnetic sample is normally obtained by either reducing the nitroxide tag or exchanging the bound paramagnetic metal ion with a diamagnetic one. A summary of pulse sequences for PRE rate constants measurements of different nuclei was presented by Clore & Iwahara (Reference Clore and Iwahara2009).
PREs can be used to obtain information about dynamic processes on a fast time scale. The exchange rate constant, k ex, must be much bigger than the difference between the relaxation rates of the two states; in practical terms, this means that k ex must be on the order of 1000 s−1 (Anthis & Clore, Reference Anthis and Clore2015). The magnitude of the experimentally determined PRE varies with the inverse sixth power of the distance, r, between the paramagnetic center and the studied nucleus:
 $${\rm \Gamma} _2^{{\rm HN}} = \displaystyle{1 \over {{r^6}}}\left\{ {\displaystyle{1 \over {15}}{{\left( {\displaystyle{{{\mu _{\rm 0}}} \over {4\pi}}} \right)}^2}\gamma _{\rm H}^2 {g^2}\mu _{\rm B}^2 S(S + 1)\left( {4{\tau _{\rm c}}\displaystyle{{3{\tau _c}} \over {1 + \omega _{\rm H}^2 \tau _c^2}}} \right)} \right\}$$
where r is the distance between the paramagnetic center and the observed nucleus, μ 0 is the permeability of vacuum, γ H is the gyromagnetic ratio, g is the electron g-factor (‘Landé-factor’), μ B is the electron Bohr magneton, S is the electron spin quantum number, τ c is the PRE correlation time, and ω H/(2π) is the nuclear Larmor frequency (Bloembergen & Morgan, Reference Bloembergen and Morgan1961; Solomon, Reference Solomon1955).
Due to the r −6 dependency, a three-fold decrease in distance will yield almost a thousand-fold increase in the PRE. Moreover, since the apparent PRE (Γ2,app) is the population weighted average between the PREs for two states a and b, even a 1% population of the minor state can have a large effect on the Γapp if k ex ≫ (Γ2,A–Γ2,B) (Iwahara & Clore, Reference Iwahara and Clore2006). In such cases, minor states can be identified on the basis of a mismatch between measured PREs and PREs calculated on the basis of a structure of the major state a. An ensemble approach can then be used to fit the PRE data more accurately, revealing the presence of the minor state or states (Tang et al. Reference Tang, Iwahara and Clore2006).
4.8 Residual dipolar couplings
In liquid state NMR spectroscopy, dipolar couplings (DC) (see Eq. (10)) average to zero due to the isotropic tumbling of molecules, and this effect simplifies recorded NMR spectra. However, since DC carry structural information on both local and global scales (Esteban-Martin et al. Reference Esteban-Martin, Fenwick, Aden, Cossins, Bertoncini, Guallar, Wolf-Watz and Salvatella2014) it can be useful to reintroduce a small amount of the dipolar coupling (on the order of 1%) (Bax, Reference Bax2003). This can be accomplished by partial alignment of molecules through the use of anisotropic media such as liquid crystalline media (Tjandra & Bax, Reference Tjandra and Bax1997), stretched polyacrylamide gels (Sass et al. Reference Sass, Musco, Stahl, Wingfield and Grzesiek2000; Tycko et al. Reference Tycko, Blanco and Ishii2000), or pf1 phages (Hansen et al. Reference Hansen, Mueller and Pardi1998). The resulting DC is called residual dipolar coupling (RDC) (Gayathri et al. Reference Gayathri, Bothner-By, Van Zijl and Maclean1982; Tolman et al. Reference Tolman, Flanagan, Kennedy and Prestegard1995), or RDC, and can be accurately quantified for covalently bonded nuclei such as the backbone 1H-15N correlation (Ottiger et al. Reference Ottiger, Delaglio and Bax1998; Tjandra et al. Reference Tjandra, Grzesiek and Bax1996). Today RDCs are routinely used in liquid NMR-based structure determination protocols and can increase the precision of structures significantly (Clore & Gronenborn, Reference Clore and Gronenborn1998; Clore & Schwieters, Reference Clore and Schwieters2006; Tjandra et al. Reference Tjandra, Omichinski, Gronenborn, Clore and Bax1997).
 $${\rm DC} = {D_{\rm a}}\left( {3{\rm co}{{\rm s}^2} - 1 + \displaystyle{3 \over 2}R{\rm si}{{\rm n}^2}\theta {\rm cos}2{\rm\phi}} \right)\; $$
The DC between two nuclei connected by an internuclear vector with an orientation, Ω, in the eigenframe of the alignment tensor, D, is dependent on the polar angles (θ, ϕ). D has eigenvalues D xx, D yy and D zz (Clore et al. Reference Clore, Gronenborn and Bax1998). The axial component of D corresponds to D a = D zz/2 and the rhombicity of D is given by R = 2/3((D xx − D yy)/D zz).
There are multiple ways of using RDCs to study the dynamics of proteins. They are well-suited for comparing the structural state of a protein in solution to structures obtained from x-ray crystallography (Bernado & Blackledge, Reference Bernado and Blackledge2004; Bouvignies et al. Reference Bouvignies, Bernado, Meier, Cho, Grzesiek, Bruschweiler and Blackledge2005, Reference Bouvignies, Markwick, Bruscheweiler and Blackledge2006; Clore & Schwieters, Reference Clore and Schwieters2004b; Salvatella et al. Reference Salvatella, Richter and Vendruscolo2008), as shown elegantly for various states of the HIV-1 protease (Roche et al. Reference Roche, Louis and Bax2015) and arginine kinase (Niu et al. Reference Niu, Bruschweiler-Li, Davulcu, Skalicky, Brüschweiler and Chapman2011). As an extension of this approach, it is also possible to determine the distribution of structural states in proteins by using ensemble methods (Esteban-Martin et al. Reference Esteban-Martin, Fenwick and Salvatella2010, Reference Esteban-Martin, Fenwick, Aden, Cossins, Bertoncini, Guallar, Wolf-Watz and Salvatella2014; Fenwick et al. Reference Fenwick, Esteban-Martin and Salvatella2010; Maciejewski et al. Reference Maciejewski, Tjandra and Barlow2011; Vammi et al. Reference Vammi, Lin and Song2014) in which an ensemble of conformers is generated and RDCs computed from this ensemble are compared with experimental values. This technique depends on the calculation of alignment tensors using tools such as prediction of alignment from structure (PALES) (Zweckstetter & Bax, Reference Zweckstetter and Bax2000) or ALMOND programs (Almond & Axelsen, Reference Almond and Axelsen2002), grouping of conformers into clusters, and careful analysis to avoid over-fitting of data. Direct refinement of structures against experimental RDCs has also been performed to compute a structural ensemble of ubiquitin that reflects motions occurring on time scales up to the ms range (Lange et al. Reference Lange, Lakomek, Fares, Schroder, Walter, Becker, Meiler, Grubmuller, Griesinger and De Groot2008). RDCs can also be used as experimental input in MD simulations (Schwieters & Clore, Reference Schwieters and Clore2001). Under favorable conditions, the RDCs of such minor states can be quantified on the basis of relaxation dispersion experiments performed in anisotropic media (Vallurupalli et al. Reference Vallurupalli, Hansen, Stollar, Meirovitch and Kay2007); these measurements can then provide structural details of minor states. Another way of retrieving dynamical information from RDCs is by using them to compute order parameters (Lakomek et al. Reference Lakomek, Walter, Fares, Lange, De Groot, Grubmueller, Brueschweiler, Munk, Becker, Meiler and Griesinger2008a; Peti et al. Reference Peti, Meiler, Bruschweiler and Griesinger2002). RDCs are sensitive to motions that are either faster or slower than the protein's rotational correlation time (τ m), so order parameters derived from RDCs are sensitive to motions occurring over time scales ranging from ps to ms. This was demonstrated in a study on ubiquitin in which RDC-derived order parameters (Meiler et al. Reference Meiler, Prompers, Peti, Griesinger and Bruschweiler2001) were consistently found to be smaller than the corresponding Lipari-Szabo order parameters (Lakomek et al. Reference Lakomek, Fares, Becker, Carlomagno, Meiler and Griesinger2005). RDCs have provided particularly important results in studies on IDPs. (Bernado et al. Reference Bernado, Bertoncini, Griesinger, Zweckstetter and Blackledge2005; Jensen et al. Reference Jensen, Ruigrok and Blackledge2013; Ulmer et al. Reference Ulmer, Bax, Cole and Nussbaum2005).
4.9 H/D-exchange
The basic principles of H/D exchange experiments were presented by Linderstrøm-Lang in the 1950s and are summarized in Eqs. (11) and (12) and (Hvidt & Nielsen, Reference Hvidt and Nielsen1966). Suppose that a state that is unavailable for exchange, for example due to hydrogen bonding (NHclosed), is in equilibrium with a state that is capable of hydrogen exchange (NHopen). The rate constant of the hydrogen exchange step, k rc, can be approximated as the intrinsic exchange rate constant for a random coil (Bai et al. Reference Bai, Milne, Mayne and Englander1993), which depends on the amino acid sequence, temperature, and pH value (Bai et al. Reference Bai, Milne, Mayne and Englander1993). The observed exchange rate constant, k obs, depends on three different rate constants as described in Eq. (12) (Wildes & Marqusee, Reference Wildes and Marqusee2004). Depending on the ratio between k cl and k rc two different limiting cases can occur: EX1 where k rc ≫ k cl, and EX2 where k rc ≪ k cl. During EX1 all opening events will lead to an exchange, simplifying Eq. (12) to: k obs = k op, consequently this rate constant corresponds directly to the rate of the opening event. Under EX2, which is more commonly observed in practice than EX1, only a fraction of all opening events will lead to exchange. In this case Eq. (12) is reduced to k obs = (k op/k cl)k rc or k obs = K op k rc, where K op = (k op/k cl) is the equilibrium constant for the process that makes the proton available for exchange; this could be the disruption of one or more hydrogen bonds (Wildes & Marqusee, Reference Wildes and Marqusee2004). Based on this equilibrium, local stabilities can be calculated using the equation of Englander & Kallenbach (Reference Englander and Kallenbach1983). The nature of the events leading to the exchange can also be studied, distinguishing between full unfolding and local fluctuations (Skinner et al. Reference Skinner, Lim, Bédard, Black and Englander2012a). Rate constants of exchange can be correlated to the solvent exposure of specific hydrogens, although these correlations only hold for hydrogens on the surface that are not involved in any hydrogen bonding within the protein; surface hydrogens of the latter sort exchange like hydrogens in the center of the protein (Skinner et al. Reference Skinner, Lim, Bédard, Black and Englander2012b).
H/D-exchange experiments measure slow dynamics occurring over time scales of seconds or longer. Measurements of H/D exchange on such time scales are generally performed by dissolving the protein in a fully deuterated solvent and then monitoring the disappearance of amide proton signals over time by acquiring a series of spectra, typically 1H-15N-HSQCs. Faster methods of acquiring ‘HSQC-like’ spectra such as SOFAST-NMR (Schanda & Brutscher, Reference Schanda and Brutscher2005; Schanda et al. Reference Schanda, Kupce and Brutscher2005), Ultra SOFAST (Gal et al. Reference Gal, Schanda, Brutscher and Frydman2007), and Band-Selective Short Transient (BEST) (Rennella et al. Reference Rennella, Solyom and Brutscher2014) have been suggested as ways of increasing the achievable time resolution and enabling the study of faster exchange processes that occur over tens of seconds rather than minutes. Faster exchange processes can also be studied by using techniques where magnetization is transferred by exchange between water and amide protons, like MEXICO (Gemmecker et al. Reference Gemmecker, Jahnke and Kessler1993) and refined variants of these techniques (Koide et al. Reference Koide, Jahnke and Wright1995). Other experiments that use magnetization transfer to study hydrogen exchange between proteins and solvents have been developed to reduce artifacts introduced by alternative magnetization transfer mechanisms. Examples of such experiments are phase-modulated clean chemical exchange (CLEANEX-PM) (Hwang et al. Reference Hwang, Van Zijl and Mori1998) and solvent exchange spectroscopy (SOLEXY) (Chevelkov et al. Reference Chevelkov, Xue, Krishna Rao, Forman-Kay and Skrynnikov2010). These techniques have made it possible to study hydrogen exchange processes on the millisecond time scale. In the limit of slow exchange it is even possible to obtain hydrogen exchange rate constants for minor states using an NMR experiment designed to detect chemical exchange saturation transfer – 15N-based TROSY CEST (Long et al. Reference Long, Bouvignies and Kay2014).
 $$N{H_{{\rm closed}}}\matrix{ {{k_{{\rm op}}}} \cr \rightleftharpoons \cr {{k_{{\rm cl}}}} \cr} N{H_{{\rm open}}}\mathop \to \limits^{{k_{{\rm rc}}}} ND$$
 $${k_{{\rm obs}}} = \displaystyle{{{k_{{\rm op}}}{k_{{\rm rc}}}} \over {{k_{{\rm cl}}} + {k_{{\rm rc}}}}}$$
4.10 Real-time NMR
For very slow processes (i.e. processes occurring over time scales longer than seconds) it is possible to follow dynamics in real-time with NMR (Kumar & Balbach, Reference Kumar and Balbach2015). This approach requires a perturbation of the system in order to get an experimentally observable signal. The perturbation may be the addition of a binding partner or denaturant, or a change of temperature. Real-time NMR has been used in a number of seminal studies on cytochrome C (Roder et al. Reference Roder, Elove and Englander1988), ribonuclease A (Udgaonkar & Baldwin, Reference Udgaonkar and Baldwin1990), and also other proteins (Balbach et al. Reference Balbach, Forge, Van Nuland, Winder, Hore and Dobson1995; Harper et al. Reference Harper, Neil, Day, Hore and Gardner2004; Haupt et al. Reference Haupt, Patzschke, Weininger, Gröger, Kovermann and Balbach2011; Hoeltzli & Frieden, Reference Hoeltzli and Frieden1995; Udgaonkar & Baldwin, Reference Udgaonkar and Baldwin1990) and RNA (Cao et al. Reference Cao, Fürtig, Schwalbe and Chen2010; Wenter et al. Reference Wenter, Fürtig, Hainard, Schwalbe and Pitsch2005). A direct approach based on using NMR to assess slow dynamics of binding and folding was reported by Binolfi et al. (Reference Binolfi, Fernandez, Sica, Delfino and Santos2012), that followed the binding and folding of a truncated version of thioredoxin (residues 1–93, TRX1-93) upon addition of a peptide containing the C-terminal region of the full protein (residues 94–108, TRX94-108). The rate constant of protein folding induced by the interaction between the two parts was measured in a real-time NMR experiment in which a series of 1H-15N HET-SOFAST-HMQC spectra were acquired over the course of the folding reaction. This made it possible to follow the development of peaks corresponding to the folded thioredoxin. An overall folding rate constant of 0·016 min−1 was determined, corresponding to a folding half-life of 42 min (Binolfi et al. Reference Binolfi, Fernandez, Sica, Delfino and Santos2012). A temperature-based perturbation was applied in a study conducted by the Wolf-Watz group on the dissociation kinetics of the ‘hetero-dimeric’ Yersinia protein YscUC, in which a series of 1D 1H NMR experiments were acquired at a temperature of 37 °C (Frost et al. Reference Frost, Ho, Login, Weise, Wolf-Watz and Wolf-Watz2012). It was shown that dissociation paralleled the secretion of effector proteins, which is a prerequisite for Yersinia infectivity. In addition, a real-time 31P NMR approach was recently developed by Wolf-Watz and co-workers to quantify Adk activity (Rogne et al. Reference Rogne, Sparrman, Anugwom, Mikkola and Wolf-Watz2015). The strength of this assay is that k cat can be determined in the absence of coupling enzymes and activity can therefore readily be studied in solutions containing co-solvents. This is important because the assay was developed to enable quantification of Adk activity in a switchable ionic liquid (Rogne et al. Reference Rogne, Sparrman, Anugwom, Mikkola and Wolf-Watz2015).
4.11 Ensemble approaches for analyzing protein dynamics
One of the limitations of NMR spectroscopy is that it is inherently difficult to quantify the amplitude of motions, whether they occur on fast (ps-to-ns) or slow (μs-to-ms) time scales. One way of solving this problem is by studying structural ensembles (Clore & Schwieters, Reference Clore and Schwieters2004a, Reference Clore and Schwietersb; Iwahara et al. Reference Iwahara, Schwieters and Clore2004) that are refined against experimental data that are sensitive to protein motions. Multiple implementations of this idea have been proposed but they all have several common steps: (1) generation of structural ensembles, (2) refinement against experimental data, (3) selection of a minimal structural ensemble that satisfactorily explains the experimental data, (4) cross-validation to reduce over-fitting, and (5) analysis of the structural ensemble in a functional or biophysical context.
Here we will briefly summarize the approach to these points described by Lindorff-Larsen et al. (Reference Lindorff-Larsen, Best, Depristo, Dobson and Vendruscolo2005), who developed a method called dynamic ensemble refinement (DER) and used it to obtain a structural ensemble of ubiquitin that is consistent with 15N order parameters (S 2) reflective of motions on the ps-to-ns time scale. Ensemble refinement against both NOEs and order parameters was achieved using biased molecular dynamics (Paci & Karplus, Reference Paci and Karplus1999) and a simulated annealing protocol starting from an x-ray structure of ubiquitin (Vijay-Kumar et al. Reference Vijay-Kumar, Bugg and Cook1987). Cross-validation of the ensemble was performed by comparing values computed from the ensemble to experimental RDCs and 3J couplings that were excluded from the ensemble refinement process. It was found that both the scalar couplings and RDCs predicted on the basis of the DER ensemble were more accurate than those predicted on the basis of x-ray structures or an NMR ensemble derived from NOEs alone. Analysis of the DER ensemble provided new biophysical insights, suggesting that while the protein's core is tightly packed, it nevertheless exhibits appreciable fluid-like character. Another ubiquitin ensemble that was constructed by refinement against RDCs and is sensitive to motions on a ps-to-ms time scale is described in some detail in Section 4 (Lange et al. Reference Lange, Lakomek, Fares, Schroder, Walter, Becker, Meiler, Grubmuller, Griesinger and De Groot2008). Ensemble approaches have also been used to visualize transient encounter complexes (Bashir et al. Reference Bashir, Volkov, Ullmann and Ubbink2010; Tang et al. Reference Tang, Iwahara and Clore2006), quantify enzyme dynamics (Esteban-Martin et al. Reference Esteban-Martin, Fenwick, Aden, Cossins, Bertoncini, Guallar, Wolf-Watz and Salvatella2014), describe the solution structures of intrinsically disordered proteins (Jensen et al. Reference Jensen, Ruigrok and Blackledge2013, Reference Jensen, Zweckstetter, Huang and Blackledge2014; Silvestre-Ryan et al. Reference Silvestre-Ryan, Bertoncini, Fenwick, Esteban-Martin and Salvatella2013), and probe correlated motions in proteins (Bouvignies et al. Reference Bouvignies, Bernado, Meier, Cho, Grzesiek, Bruschweiler and Blackledge2005; Bryn Fenwick et al. Reference Bryn Fenwick, Orellana, Esteban-Martin, Orozco and Salvatella2014; Clore & Schwieters, Reference Clore and Schwieters2004a; Fenwick et al. Reference Fenwick, Esteban-Martin, Richter, Lee, Walter, Milovanovic, Becker, Lakomek, Griesinger and Salvatella2011).
5. NMR-based breakthroughs in protein science (case studies)
The ongoing development of solution state NMR methods has been accompanied by numerous significant contributions to the mechanistic understanding of protein function. Although not covered here, one of the biggest contributions has arguably been the development and application of NMR methods for determining the structures of biological macromolecules (Härd et al. Reference Härd, Kellenbach, Boelens, Maler, Dahlman, Freedman, Carlstedtduke, Yamamoto, Gustafsson and Kaptein1990; Ikura et al. Reference Ikura, Clore, Gronenborn, Zhu, Klee and Bax1992; Keane et al. Reference Keane, Heng, Lu, Kharytonchyk, Ramakrishnan, Carter, Barton, Hosic, Florwick, Santos, Bolden, Mccowin, Case, Johnson, Salemi, Telesnitsky and Summers2015; Nagata et al. Reference Nagata, Gupta, Sorce, Kim, Sali, Chait, Shigesada, Ito and Werner1999; Wuthrich, Reference Wuthrich2001; Zhou et al. Reference Zhou, Sun, Dotsch, Wagner and Verdine1998). It is becoming evident that major breakthroughs in understanding protein function will increasingly be made by multidisciplinary teams capable of applying several different analytical and computational techniques, and that NMR spectroscopy can be a central component of such efforts but will have to be integrated with other methods such as isothermal titration calorimetry (ITC), x-ray crystallography, SAXS, single molecule fluorescence resonance energy transfer (smFRET) and functional assays (see Section 2). This section thus focuses on breakthrough findings that have been accomplished at least in part with spin relaxation experiments. We must stress that we have made no effort to be comprehensive, and that the works chosen for inclusion merely reflect our perspective on the field; there are certainly many other important discoveries that could have been included in the following sections.
5.1 Detection of functional high-energy protein states
It is becoming increasingly evident that the induced fit model is not sufficient to explain the complexity of macromolecular interactions. The energy landscape theory of protein structure and dynamics predicts that a protein samples different conformations in dynamic equilibrium (Ferreiro et al. Reference Ferreiro, Komives and Wolynes2014; Frauenfelder et al. Reference Frauenfelder, Sligar and Wolynes1991; Jenik et al. Reference Jenik, Gonzalo Parra, Radusky, Turjanski, Wolynes and Ferreiro2012; Miyashita et al. Reference Miyashita, Wolynes and Onuchic2005). The relative weights of the different conformations follow statistical thermodynamic distributions, with the time scales of conformational exchange being determined by the heights of the corresponding energy barriers. In cases where the barrier heights are low relative to the Boltzmann energy (k B T), thermally driven fluctuations can lead to an appreciable population of different conformations. It should be noted that the concept of conformational sampling was introduced as long ago as 1965 with the MWC model for cooperativity, which assumes that a substrate-free oligomeric enzyme can populate tense (T) and relaxed (R) states (Monod et al. Reference Monod, Wyman and Changeux1965). In the conformational selection or population shift model, a ligand selectively binds to one of the conformations or sub-states that are sampled in solution (Boehr et al. Reference Boehr, Nussinov and Wright2009; Bosshard, Reference Bosshard2001; Csermely et al. Reference Csermely, Palotai and Nussinov2010; Foote & Milstein, Reference Foote and Milstein1994; Leder et al. Reference Leder, Berger, Bornhauser, Wendt, Ackermann, Jelesarov and Bosshard1995; Lindley et al. Reference Lindley, Bajaj, Evans, Garratt, Hasnain, Jhoti, Kuser, Neu, Patel, Sarra, Strange and Walton1993; Michielssens et al. Reference Michielssens, De Groot and Grubmueller2015; Oh et al. Reference Oh, Pandit, Kang, Nikaido, Gokcen, Ames and Kim1993). Hence, the ligand does not induce a structural change but instead acts to redistribute the statistical weights of sub-states that are sampled even in the substrate's absence. The model can, in fact, be described as a one-site (i.e. n = 1) MWC model. As is made clear in the following sections, NMR has provided convincing evidence that many proteins populate active conformations under substrate- or target-free conditions. Consequently the energy landscape (Frauenfelder et al. Reference Frauenfelder, Sligar and Wolynes1991) of some proteins innately permits the sampling of active-like conformations (Miloushev et al. Reference Miloushev, Bahna, Ciatto, Ahlsen, Honig, Shapiro and Palmer Iii2008). However, this discovery does not mean that a specific ligand binding mechanism is best described with a conformational selection model. Flux analyses have shown that ligand and protein concentrations are central in determining whether conformational selection or induced fit pathways dominate. It is in fact possible for a conformational selection model to dominate at low substrate concentrations but to be replaced by induced-fit binding at higher substrate concentrations, as was demonstrated to be the case for DHFR (Hammes et al. Reference Hammes, Chang and Oas2009). A generic problem with the conformational selection model is that active states of enzymes may be unavailable to substrates due to steric occlusion (Sullivan & Holyoak, Reference Sullivan and Holyoak2008). Therefore, to firmly establish that conformational selection is the dominating pathway it is necessary to study the observed rate constant for binding over a wide range of concentrations for both interacting species (Gianni et al. Reference Gianni, Dogan and Jemth2014; Vogt & Di Cera, Reference Vogt and Di Cera2012). However, experiments of this sort are far from trivial to perform for most binding reactions. Another possibility is to combine results from kinetic experiments obtained using a stopped-flow setup with lineshape analysis of NMR signals as described in a contribution from the Kern laboratory, which showed that differences in a cancer drug's binding affinity to Abl and Src kinases are dependent on the equilibrium constant of an induced-fit step (Agafonov et al. Reference Agafonov, Wilson, Otten, Buosi and Kern2014). The sections below discuss selected NMR studies that have contributed significantly to unraveling the functional importance of high-energy protein states. We have also highlighted some of the technical aspects that have enabled the quantification of dynamics in different model systems.
5.1.1 Nitrogen regulatory protein C (NtrC)
Two component signaling systems are crucial for signal transduction in bacteria. As the name suggests, they have two evolutionarily conserved components: a histidine kinase and a response regulator, the latter of which has receiver and output domains (Parkinson & Kofoid, Reference Parkinson and Kofoid1992). These systems handle various signaling tasks relating to processes such as chemotaxis and metabolic adaption to changes in carbon and nitrogen availability; for a more extensive overview, please see the work of Parkinson & Kofoid (Reference Parkinson and Kofoid1992). Phosphorylation of an aspartate residue in the receiver domain of NtrC (NtrCr) stimulates oligomerization of the dimeric output domain and thus down-stream activation. To understand the structural consequences of NtrCr phosphorylation, the Wemmer laboratory developed a protocol to study this inherently unstable species (Kern et al. Reference Kern, Volkman, Luginbuhl, Nohaile, Kustu and Wemmer1999). NMR samples of phosphorylated NtrCr were prepared by adding a large excess of carbomylphosphate together with Mg2+. Under these conditions the samples remained stably phosphorylated for 36 h. To enable acquisition of 3D datasets of sufficient quality, the authors co-added multiple data-sets (more effective stabilization was subsequently achieved by mimicking phosphorylation with BeF3 − (Gardino et al. Reference Gardino, Villali, Kivenson, Lei, Liu, Steindel, Eisenmesser, Labeikovsky, Wolf-Watz, Clarkson and Kern2009; Hastings et al. Reference Hastings, Lee, Cho, Yan, Kustu and Wemmer2003)). The NMR structure of phosphorylated NtrCr (Kern et al. Reference Kern, Volkman, Luginbuhl, Nohaile, Kustu and Wemmer1999) exhibits significant structural changes relative to the un-phosphorylated state (Volkman et al. Reference Volkman, Nohaile, Amy, Kustu and Wemmer1995). These changes are confined to one face (denoted the ‘3445-face’) of the molecule and extend over the region between α–helix 3 and β–strand-5 (Fig. 4). An NMR structure of BeF3 −-NtrCr confirmed the overall features of the conformational change, although some differences with respect to the orientations of some segments were identified (Hastings et al. Reference Hastings, Lee, Cho, Yan, Kustu and Wemmer2003). In a subsequent study, the authors designed experiments that ultimately showed that the structural change depends on the redistribution of already existing structural states (Volkman et al. Reference Volkman, Lipson, Wemmer and Kern2001). That is, the un-phosphorylated species samples the active conformation, and in this state the key aspartate residue is primed for phosphorylation. This conclusion was primarily drawn on the basis of ‘Model-free’ driven deconvolution (Clore et al. Reference Clore, Szabo, Bax, Kay, Driscoll and Gronenborn1990; Lipari & Szabo, Reference Lipari and Szabo1982a) of R ex contributions to observed R 2 relaxation rates. The R ex contributions of the phosphorylated species are quenched in comparison with both the wild type and a constitutively active mutant. These relaxation data were interpreted to mean that the phosphorylated species is ‘locked’ into the active conformation, leading to a quenching of R ex, but the R ex contribution of the mutant and un-phosphorylated forms remains strong due to the sampling of both active and inactive conformations. This interpretation was buttressed by the observation of linear chemical shift perturbations for NtrCr variants with varying activity. Overall, this study elegantly describes MWC-like two-state allosteric behavior in a single domain protein. The findings related to NtrC were based on the assumption of a two-state model with exchange between inactive and active species. This assumption both explained the experimental data and enabled the development of a new concept for the activation of a single-domain protein. Two more recent studies on this protein have identified the molecular transition pathways between active and inactive NtrC states (Pontiggia et al. Reference Pontiggia, Pachov, Clarkson, Villali, Hagan, Pande and Kern2015; Vanatta et al. Reference Vanatta, Shukla, Lawrenz and Pande2015).
Two state allosteric behavior of NtrC. Shown is a structural superimposition of phosphorylated NtrC (orange) and non-phosphorylated NtrC (blue) indicating the structural difference between active and inactive states, respectively. This figure was adapted from reference Kern et al. (Reference Kern, Volkman, Luginbuhl, Nohaile, Kustu and Wemmer1999).

5.1.2 DHFR
DHFR is an enzyme found in all organisms that catalyzes the reduction of 7, 8-dihydrofolate (DHF) to 5, 6, 7, 8-tetrahydrofolate (THF) with hydride transfer from the cofactor NADPH (Schnell et al. Reference Schnell, Dyson and Wright2004). THF is essential for purine and thymidylate synthesis and thus for cell growth and proliferation. The reaction catalyzed by DHFR is dependent on five kinetic intermediates (Fierke et al. Reference Fierke, Johnson and Benkovic1987) for which structural models derived from x-ray crystallography are available (Sawaya & Kraut, Reference Sawaya and Kraut1997). These intermediates are known as E:NADPH, E:NADPH:DHF, E:NADP+:THF, E:THF and E:NADPH:THF where ‘E’ stands for the enzyme DHFR. In NMR experiments, the Michaelis complex corresponding to the E:NADPH:DHF intermediate has been mimicked using the ternary complex E:NADP+:folate. In a spin relaxation study of the five kinetic and structural intermediates during DHFR catalysis, Wright and co-workers established a firm coupling between DHFR function and conformational dynamics (Boehr et al. Reference Boehr, Dyson and Wright2006a; Schnell et al. Reference Schnell, Dyson and Wright2004). Under substrate-saturating conditions, these five intermediates collectively represent a full catalytic cycle in which either the cofactor and/or products or substrates are bound to the enzyme. Notably, under the conditions imposed during the NMR experiments, all of the observed relaxation effects could be attributed to conformational changes in the enzyme. This was also shown explicitly by conducting relaxation dispersion experiments at different NADP+ concentrations. Relaxation dispersion was acquired for 15N (Loria et al. Reference Loria, Rance and Palmer1999; Tollinger et al. Reference Tollinger, Skrynnikov, Mulder, Forman-Kay and Kay2001) and 1HN (Ishima & Torchia, Reference Ishima and Torchia2003) nuclei at two static magnetic field strengths. The five different intermediates exhibited specific kinetic behavior signatures that were obtained from their relaxation dispersion patterns. The authors propose a model where each of the different ground states (i.e. the five intermediates described above) is in exchange with the ground state that precedes it and the one that follows it in the catalytic cycle. Consequently, the enzyme is primed for the subsequent step in the cycle by sampling the corresponding structural state. In addition it was found that several of the microscopic steps connecting the five intermediates are rate limited by conformational transitions. These conclusions were drawn by comparing fitted chemical shifts from relaxation dispersion experiments to direct measurements in NMR spectra, which showed (among other things) that there is a striking linear dependency of chemical shifts between the E:THF and E:NADP+:THF states for residues that are sensitive to cofactor binding (Boehr et al. Reference Boehr, Mcelheny, Dyson and Wright2006b).
5.1.3 Ubiquitin
Posttranslational modification of proteins by ubiquitin is central in many cellular pathways, although the best understood function of ubiquitination is in proteasome-mediated proteolysis (Harper & Schulman, Reference Harper and Schulman2006). Ubiquitin binding domains bind non-covalently to ubiquitin and thereby control different cellular events (Hicke et al. Reference Hicke, Schubert and Hill2005). Interestingly, the ubiquitin components of complexes of ubiquitin with different target proteins exhibit a remarkable level of structural heterogeneity (Lange et al. Reference Lange, Lakomek, Fares, Schroder, Walter, Becker, Meiler, Grubmuller, Griesinger and De Groot2008). This suggests that ubiquitin's ability to bind to a very wide range of proteins is partly due to an appreciable degree of structural plasticity in its apo state. RDCs (Tjandra & Bax, Reference Tjandra and Bax1997; Tolman et al. Reference Tolman, Flanagan, Kennedy and Prestegard1995) are sensitive to motions that occur over ps to ms (Meiler et al. Reference Meiler, Prompers, Peti, Griesinger and Bruschweiler2001, Reference Tolman, Al-Hashimi, Kay and Prestegard2001, Reference Tolman, Flanagan, Kennedy and Prestegard1997; Peti et al. Reference Peti, Meiler, Bruschweiler and Griesinger2002) and thus fill a gap between the time windows that can be studied using Lipari-Szabo order parameters (Lipari & Szabo, Reference Lipari and Szabo1982a, Reference Lipari and Szabob) (sub-τ c motion) and relaxation dispersion experiments (Loria et al. Reference Loria, Rance and Palmer1999; Tollinger et al. Reference Tollinger, Skrynnikov, Mulder, Forman-Kay and Kay2001) (between 50 µs and 100 ms). In an extensive RDC-based study, the laboratories of Griesinger and de Groot developed a method (denoted EROS) that enabled a precise determination of a structural ensemble of apo ubiquitin that is sensitive to motions in the ps- to ms- regime (Lakomek et al. Reference Lakomek, Fares, Becker, Carlomagno, Meiler and Griesinger2005, Reference Lakomek, Lange, Walter, Fares, Egger, Lunkenheimer, Meiler, Grubmuller, Becker, De Groot and Griesinger2008b); this regime is henceforth referred to as the supra-τ c regime. The ensemble refinement was performed by using 42 RDC datasets (Briggman & Tolman, Reference Briggman and Tolman2003; Ottiger & Bax, Reference Ottiger and Bax1998; Ruan & Tolman, Reference Ruan and Tolman2005). Notably, the EROS ensemble covers the complete range of ubiquitin conformations as observed in 46 different ubiquitin complexes (Lange et al. Reference Lange, Lakomek, Fares, Schroder, Walter, Becker, Meiler, Grubmuller, Griesinger and De Groot2008). In a recent combined computational and NMR study, the dynamics of ubiquitin were explored in more detail, showing that the binding selectivity for ubiquitin targets can be tuned by perturbing ubiquitin's pre-existing conformational equilibrium (Michielssens et al. Reference Michielssens, Peters, Ban, Pratihar, Seeliger, Sharma, Giller, Sabo, Becker, Lee, Griesinger and De Groot2014). For most residues, the order parameters derived from the EROS ensemble are lower compared with those predicted by Lipari-Szabo analysis (Chang & Tjandra, Reference Chang and Tjandra2005). Analysis of the supra-τ c regime thus reveals additional mobility, in good agreement with the structural heterogeneity observed in the EROS ensemble. In summary it is evident that ubiquitin has innate dynamic properties that enable engagement with target proteins through conformational selection mechanisms, i.e. a multitude of different structural states are sampled in absence of target proteins and the presence of a specific target can select a specific ubiquitin structure. Finally, it is important to note that while this section focused on EROS, several other approaches for interpreting dynamics on the basis of RDCs exist (Bouvignies et al. Reference Bouvignies, Markwick, Bruscheweiler and Blackledge2006, Reference Bouvignies, Markwick and Blackledge2007; Tolman, Reference Tolman2002; Tolman et al. Reference Tolman, Al-Hashimi, Kay and Prestegard2001; Ulmer et al. Reference Ulmer, Ramirez, Delaglio and Bax2003).
5.1.4 Adk
Adk catalyzes the magnesium-dependent reversible interconversion of AMP and ATP into two ADP molecules. Adk is vital for cellular energy-homeostasis and present in all organisms. The enzyme harbors two distinct nucleotide binding sub-domains that are denoted ATPlid and AMPbd, respectively. Adk undergoes a large conformational change in response to ligand binding that shuttles the protein into a closed and active conformation where phosphoryl transfer occurs (Rhoads & Lowenstein, Reference Rhoads and Lowenstein1968). Because of its favorable properties – specifically, its tendency to yield excellent NMR spectra (Ådén & Wolf-Watz, Reference Ådén and Wolf-Watz2007; Schrank et al. Reference Schrank, Bolen and Hilser2009), catalysis of a reversible reaction, and large conformational changes (Müller et al. Reference Müller, Schlauderer, Reinstein and Schulz1996; Müller & Schulz, Reference Müller and Schulz1992) – Adk has emerged as one of the principal model systems for analyzing the linkage between dynamics and enzymatic turnover (Arora & Brooks, Reference Arora and Brooks2007; Hanson et al. Reference Hanson, Duderstadt, Watkins, Bhattacharyya, Brokaw, Chu and Yang2007; Nagarajan et al. Reference Nagarajan, Amir, Grupi, Goldenberg, Minton and Haas2011; Schrank et al. Reference Schrank, Bolen and Hilser2009; Shapiro et al. Reference Shapiro, Kahana and Meirovitch2009, Reference Shapiro, Sinev, Sineva, Tugarinov and Meirovitch2000; Shapiro & Meirovitch, Reference Shapiro and Meirovitch2006). In an extensive multi-approach effort, the Kern laboratory has shown that substrate-free Adk from the hyperthermophilic bacterium Aquifex aeolicus samples ‘closed like’ structures (Henzler-Wildman et al. Reference Henzler-Wildman, Thai, Lei, Ott, Wolf-Watz, Fenn, Pozharski, Wilson, Petsko, Karplus, Hübner and Kern2007). This conclusion was drawn from (i) an x-ray structure containing three molecules in the asymmetric unit in which ATPlid and AMPbd adopted orientations that lay on a trajectory from open to closed structures, (ii) 15N relaxation dispersion measurements that detected motion on a time scale of 950 ± 150 s−1 at 10 °C in hinge regions and also in parts of both nucleotide binding sub-domains, (iii) paramagnetic relaxation enhancement experiments that showed enhanced relaxation in regions that are expected to be far apart in the open state but in close proximity in the closed state and (iv) single molecule FRET measurements that sampled opening/closing events with reaction kinetics of around 7000 s−1 at 20 °C. Taken together, these results suggest that apo Adk samples structural states that lie on a trajectory leading to the catalytically competent closed state. Hence the dynamics that are relevant for substrate binding are already present in the substrate-free enzyme and the enzyme exists in a conformational equilibrium before substrate addition (Henzler-Wildman et al. Reference Henzler-Wildman, Thai, Lei, Ott, Wolf-Watz, Fenn, Pozharski, Wilson, Petsko, Karplus, Hübner and Kern2007). This pre-equilibrium has also been observed in ensemble analyses of RDCs measured for apo Adk (Esteban-Martin et al. Reference Esteban-Martin, Fenwick, Aden, Cossins, Bertoncini, Guallar, Wolf-Watz and Salvatella2014). The pre-existing equilibrium can be perturbed in the directions of closure or opening by addition of the osmolyte TMAO or by removal of one inter-domain hydrogen bond, respectively. Notably, these changes in the equilibrium constant are mirrored by compensatory effects on k cat and K M such that the specificity constant (k cat/K M) remains invariant (Ådén et al. Reference Ådén, Verma, Schug and Wolf-Watz2012; Kovermann et al. Reference Kovermann, Aden, Grundstrom, Elisabeth Sauer-Eriksson, Sauer and Wolf-Watz2015). This effect, denoted ‘k cat versus K M’ compensation, stems from the fact that Adk is rate limited by conformational dynamics (see the section below), and is apparently evolutionarily robust against mutations that simultaneously affect k cat and K M values. A more intuitive variation in k cat/K M values, i.e. a direct scaling of k cat/K M versus the population of a high-energy state, has been observed for the phosphorylation of phospholamban (Masterson et al. Reference Masterson, Yu, Shi, Wang, Gustavsson, Mueller and Veglia2011b) and the Dbl homology domain of Vav1 (Li et al. Reference Li, Martins, Amarasinghe and Rosen2008). The compensatory effects on k cat and K M that have been observed in Adk are phenomenologically related to enthalpy-entropy compensation (Dunitz, Reference Dunitz1995; Leffler, Reference Leffler1955), which is well-known to be important for protein folding (Fersht, Reference Fersht2000) but has also been observed in bio-molecular interactions (Cooper et al. Reference Cooper, Johnson, Lakey and Nollmann2001). The catalytic model for Adk catalysis (Wolf-Watz et al. Reference Wolf-Watz, Thai, Henzler-Wildman, Hadjipavlou, Eisenmesser and Kern2004) contains an additional high-energy state corresponding to a substrate-bound open conformation. This state has now been directly observed by NMR spectroscopy (Kovermann et al. Reference Kovermann, Aden, Grundstrom, Elisabeth Sauer-Eriksson, Sauer and Wolf-Watz2015) and it was shown that the interconversion of this high-energy state with a ground state structure that has been characterized by x-ray crystallography is rate limiting for catalysis (as discussed further below).
5.1.5 RNase A
Quantification of enzyme dynamics that are relevant for substrate turnover is most readily performed for enzymes that catalyze reversible reactions (Eisenmesser et al. Reference Eisenmesser, Bosco, Akke and Kern2002; Wolf-Watz et al. Reference Wolf-Watz, Thai, Henzler-Wildman, Hadjipavlou, Eisenmesser and Kern2004). However, many enzymes such as proteases catalyze irreversible reactions. For these enzymes, alternative approaches must be used to mimic and characterize Michaelis complexes (Michaelis & Menten, Reference Michaelis and Menten1913). One option that was explored in a study on RNase A (Beach et al. Reference Beach, Cole, Gill and Loria2005) reported by the Loria laboratory was to use a small unreactive molecule that mimics the contacts that are expected in the Michaelis complex. RNase A primarily catalyzes the cleavage of single stranded RNA between purines and pyrimidines (Katoh et al. Reference Katoh, Yoshinaga, Yanagita, Ohgi, Irie, Beintema and Meinsma1986). Determination of a x-ray structure (at 2·0 Å) of a complex between RNase A and the dinucleotide 5′-phosphotymidine (3′−5′) pyrophosphate adenosine 3′-phosphate (pTppAp) (Russo & Shapiro, Reference Russo and Shapiro1999) established that this small molecule is a relevant mimic of the Michaelis complex for RNase A catalysis. An additional important aspect of pTppAp is that its K D for RNase A binding is sufficiently low – only 16 nM (Kovrigin et al. Reference Kovrigin, Cole and Loria2003) – that any contributions from ligand association and dissociation can be safely neglected in the analysis of relaxation dispersion experiments. Analysis of relaxation dispersion experiments (Loria et al. Reference Loria, Rance and Palmer1999; Mulder et al. Reference Mulder, Skrynnikov, Hon, Dahlquist and Kay2001b) showed that both apo and pTppAp bound RNase A contain a large set of residues with motions on the order of 1000 s−1 at T = 283 K. Notably, these residues cluster in the same regions in the two forms of the enzyme and given the K D value for pTppAP binding it was concluded that the dynamics observed in the presence of pTppAp are intra-molecular and independent of association and dissociation kinetics. Hence, the dynamics observed in the model Michaelis complex are already present in the apo enzyme. Based on a comparison of the exchanging states’ chemical shift signs as determined using a HSQC/HMQC approach (Skrynnikov et al. Reference Skrynnikov, Dahlquist and Kay2002), and a direct measurement of the difference between the apo and pTppAp states, the authors concluded that the minor state observed in the apo state resembles the substrate-bound enzyme while the minor state of the pTppAp-bound complex resembles the conformation of the apo state. Subsequent studies on RNase A have shown that its dynamic processes are orchestrated through networks that are operational over long distances within the enzyme (Doucet et al. Reference Doucet, Khirich, Kovrigin and Loria2011; Kovrigin & Loria, Reference Kovrigin and Loria2006; Watt et al. Reference Watt, Shimada, Kovrigin and Loria2007). For instance the global dynamic process observed in pTppAp-bound RNaseA can be disturbed by introducing the substitution D121A: even though position 121 is distant from the active site and does not influence the active site properties, the D121A substitution causes a 90% reduction in k cat. Consequently, the slow dynamics observed for the wild type enzyme in the Michaelis complex, which involve a concerted process occurring at 1900 s−1, are replaced by a sequence of two processes occurring at 2400 and 730 s−1, respectively (Kovrigin & Loria, Reference Kovrigin and Loria2006). Hence concerted dynamic processes in enzymes are dependent on a fine balance of interactions and can be highly sensitive to subtle changes.
5.1.6 Maltose binding protein (MBP)
MBP is responsible for maltose uptake (Boos & Shuman, Reference Boos and Shuman1998) and consists of two domains that are connected by three linker segments. Structures of apo (Sharff et al. Reference Sharff, Rodseth, Spurlino and Quiocho1992) and holo (Spurlino et al. Reference Spurlino, Lu and Quiocho1991) states determined by x-ray crystallography have revealed a hinge-bending motion within the linker region resulting in a 35° rigid body reorientation of the relative domain orientations (Sharff et al. Reference Sharff, Rodseth, Spurlino and Quiocho1992). MBP has been extensively characterized by NMR spectroscopy in both the apo and holo states, and RDC analysis showed that these two states predominantly populate the crystallographic structures in solution (Evenäs et al. Reference Evenäs, Tugarinov, Skrynnikov, Goto, Muhandiram and Kay2001). PRE can be utilized to detect minor states (Iwahara & Clore, Reference Iwahara and Clore2006; Tang et al. Reference Tang, Iwahara and Clore2006) that cannot be observed using methods based on RDCs, which are linear weighted averages of all species present in solution. (Tang et al. Reference Tang, Schwieters and Clore2007). Using PRE experiments, it was shown that the holo state in solution is well-described by the crystallographic holo structure. In contrast, the apo state was found to display PRE values that are inconsistent with either apo or holo structures. This discrepancy was attributed to a minor state in equilibrium with the major apo structure. The structure of the minor state was determined with a conjoined rigid-body/torsion-angle simulated annealing refinement (Clore & Bewley, Reference Clore and Bewley2002) and was found to correspond to a partially closed MBP structure. Hence, apo MBP samples high-energy structures that are probably on the trajectory towards the ‘bound’ conformation, but MBP appears to require interaction with substrate molecules before it can adopt the fully closed structure (Tang et al. Reference Tang, Schwieters and Clore2007).
5.1.7 Additional examples
There are several other cases in which NMR experiments have suggested transient populations of functionally important states. Notable examples include HIV protease (Ishima et al. Reference Ishima, Freedberg, Wang, Louis and Torchia1999), estrogen receptor DNA-binding domain (Wikström et al. Reference Wikström, Berglund, Hambraeus, Van Den Berg and Härd1999), the C-terminal domain of Sendai virus nucleoprotein (Jensen et al. Reference Jensen, Houben, Lescop, Blanchard, Ruigrok and Blackledge2008; Schneider et al. Reference Schneider, Maurin, Communie, Kragelj, Hansen, Ruigrok, Jensen and Blackledge2015), Abl and Src kinases (Agafonov et al. Reference Agafonov, Wilson, Otten, Buosi and Kern2014; Wilson et al. Reference Wilson, Agafonov, Hoemberger, Kutter, Zorba, Halpin, Buosi, Otten, Waterman, Theobald and Kern2015), calmodulin (Gsponer et al. Reference Gsponer, Christodoulou, Cavalli, Bui, Richter, Dobson and Vendruscolo2008). In addition, it has been suggested that the GPCR β2AR uses a conformational selection mechanism (Deupi & Kobilka, Reference Deupi and Kobilka2010), clearly demonstrating that concepts arising from the application of NMR spectroscopy to established model systems are likely to be generally relevant to protein function.
5.2 Rate limitation in enzymatic catalysis
Many vital cellular chemical reactions are far too slow to be compatible with any given cellular process. Enzymes are extraordinary bio-catalysts that have evolved to shift the time scale of chemical reactions to a window that is compatible with cellular processes such as cell division. As an example, the enzymatic rate enhancement of orotidine 5′-phosphate decarboxylase is estimated to be an astonishing 1017 fold (Radzicka & Wolfenden, Reference Radzicka and Wolfenden1995). To catalyze chemical reactions, enzymes must accomplish several complex tasks during the reaction (Radzicka & Wolfenden, Reference Radzicka and Wolfenden1995), including having a moderate binding affinity for substrates and products to avoid kinetic traps, (Fersht, Reference Fersht2000) extremely tight binding to the transition state compound(s), (Rundqvist et al. Reference Rundqvist, Ådén, Sparrman, Wallgren, Olsson and Wolf-Watz2009) activation of functional groups on the substrate(s), (Wolf-Watz et al. Reference Wolf-Watz, Thai, Henzler-Wildman, Hadjipavlou, Eisenmesser and Kern2004) dehydration of active sites to reduce non-productive side-reactions, and (Rhoads & Lowenstein, Reference Rhoads and Lowenstein1968) optimal alignment of substrates to facilitate the chemical transformation into products. In fact all of these steps can be linked to conformational dynamics with differing time scales and amplitudes on the enzyme itself. There are many enzymes whose activity is diffusion limited, i.e. enzymes that are close to perfect (Fersht, Reference Fersht2000). On the other side of the spectrum there are also enzymes with much lower levels of activity, whose catalytic rate constants are far below the limits imposed by diffusion and Brownian motion. In a few such cases, NMR experiments have shown that conformational dynamics constitute the rate limiting step during the enzymatic reaction cycle. For these enzymes, the rate constants for the chemical transformations must be significantly faster than those for the preceding or subsequent conformational changes. Below we will briefly discuss some relevant examples together with the experimental approaches that enabled identification of the rate limiting conformational dynamics.
5.2.1 Adk
Adk catalyzes the magnesium-dependent interconversion of AMP and ATP into two ADP molecules. The reaction is fully reversible and the equilibrium constant in the direction of ADP formation is 2·8 in the absence of magnesium (Rundqvist et al. Reference Rundqvist, Ådén, Sparrman, Wallgren, Olsson and Wolf-Watz2009). Since the reaction catalyzed by Adk is reversible, it is possible to study the dynamics of the enzyme during turnover conditions using endogenous substrates. In a study from the Kern laboratory, the dynamics of mesophilic (Escherichia coli) and hyperthermophilic (Aquifex aeolicus) Adk were studied by means of 15N relaxation dispersion measurements (Wolf-Watz et al. Reference Wolf-Watz, Thai, Henzler-Wildman, Hadjipavlou, Eisenmesser and Kern2004). The substrate concentrations used (20 mM) were well above the K M values of the enzymes, thus ensuring that the quantified slow motions were of intramolecular nature. Due to the catalytic action of the enzymes, the substrate mixtures for which the dynamics were quantified corresponded to equilibrium mixtures (i.e. AMP, ATP and ADP were all present simultaneously). The process that produced the observed dispersion profiles was identified by showing that the dynamics of the hyperthermophilic variant in the presence of the equilibrium mixture were very similar to those observed in a mixture containing AMP and the non-hydrolysable analogue AMPPNP. It was thus concluded that the detected motion corresponded to opening and closing dynamics in the presence of the bound substrate. It was further found that the microscopic rate constants for domain opening closely matched the catalytic turnover numbers obtained from a coupled ATPase assay (Rhoads & Lowenstein, Reference Rhoads and Lowenstein1968). In conclusion, on the basis of converging rate constants between catalytic turnover and conformational dynamics it was inferred that these two Adk variants are rate limited by conformational dynamics (Wolf-Watz et al. Reference Wolf-Watz, Thai, Henzler-Wildman, Hadjipavlou, Eisenmesser and Kern2004). The finding also resolved the question of why thermophilic enzymes often display lower activities than their mesophilic counterparts at ambient temperatures (Zavodszky et al. Reference Zavodszky, Kardos, Svingor and Petsko1998). In the case of Adk, the entire activity difference between the hyperthermophilic and mesophilic variants at ambient temperatures is explained by the rate constants of conformational dynamics, which are significantly slower in the hyperthermophile (Wolf-Watz et al. Reference Wolf-Watz, Thai, Henzler-Wildman, Hadjipavlou, Eisenmesser and Kern2004). In a recent paper from the same laboratory it was shown that the rate constant of the chemical transformation is indeed significantly faster than that of conformational dynamics in Adk (Kerns et al. Reference Kerns, Agafonov, Cho, Pontiggia, Otten, Pachov, Kutter, Phung, Murphy, Thai, Alber, Hagan and Kern2015). As a final note, the use of enzymes from different organisms with different catalytic properties in comparative studies is a powerful way of addressing functional questions while avoiding epistasis (as discussed in more detail below). While it is also possible to investigate functional questions by using point mutations, this carries the risk of changing both the targeted property and additional important properties of the protein.
5.2.2 RNase A
Since RNase A catalyzes an irreversible reaction it is not possible to quantify its dynamics during catalytic turnover as was done for Adk. Therefore, the Loria group used a different approach to investigate the motions of RNase A that are relevant to its turnover (Beach et al. Reference Beach, Cole, Gill and Loria2005). In short, a molecule denoted pTppAp was carefully analyzed and a crystallographic structure of this molecule in complex with RNase A revealed that the specific base and phosphate interactions satisfy the established criteria for a realistic substrate-mimic. Using the approaches discussed above, it was found that the dynamics of a pTppAp:RNase A complex as revealed by relaxation dispersion experiments corresponded to the interconversion of RNase A structures resembling the substrate-free and substrate-bound states. As discussed in the paper (Beach et al. Reference Beach, Cole, Gill and Loria2005) the rate constant of conformational interconversion of RNase A in the presence of pTppAp is similar to the k cat value measured for real substrates. Therefore, it was suggested that conformational dynamics are the rate limiting step for RNase A catalysis.
5.2.3 DHFR
As discussed above DHFR catalyzes the reduction of DHF to THF through a number of populated intermediates. Quantitative analysis of conformational exchange rate constants from relaxation dispersion profiles provided new insight into the influence of dynamics on the catalytic efficiency of DHFR (Boehr et al. Reference Boehr, Mcelheny, Dyson and Wright2006b). It was found that the first-order rate constant for the rate determining release of THF from the E:NADPH:THF complex (12·5 s−1) matched that of the conformational transition between the ground state (E:NADPH:THF) and a high-energy state resembling the E:NADPH complex. This observation has the interesting implication that product release probably occurs from the high-energy state, which is important not just in the context of dynamics but for enzymology in general: it clearly shows that studying ground state structures alone is not always sufficient to understand enzymes’ catalytic power. It was also found that the rate constant for hydride transfer was very similar to that for the conformational transition between the ground state of the E:NADP+:THF and an excited state resembling the E:NADP+:folate complex (which was used as a model for the Michaelis complex corresponding to E:NADPH:DHF). Taken together, these results clearly show that the rate constants for conformational dynamics have profound effects on the overall catalytic efficiency of DHFR (Boehr et al. Reference Boehr, Mcelheny, Dyson and Wright2006b).
5.2.4 Tyrosine phosphatases
Protein tyrosine phosphatases (PTPs) catalyze the cleavage of the tyrosine phosphate monoester (pY) of their protein substrates followed by subsequent hydrolysis of the phosphoenzyme intermediate. Thus, the overall turnover of these enzymes is dictated by the two rate constants k cleavage and k hydrolysis. In a comparative study (Whittier et al. Reference Whittier, Hengge and Loria2013), the dynamics associated with the cleavage reaction were quantified for YopH, a virulence factor from Yersinia (Brubaker, Reference Brubaker1991), and for PTP1B, a human phosphatase involved in regulating leptin, insulin and epidermal growth factor signaling (Zhang, Reference Zhang2001). Although the two enzymes’ substrate interactions are very similar, their k cat values differ significantly: 700–100 s−1 for YopH and 15–30 s−1 for PTP1B at T = 293 K (Zhang et al. Reference Zhang, Thieme-Sefler, Maclean, Mcnamara, Dobrusin, Sawyer and Dixon1993). The enzymes harbor a ten residue segment known as the WPD loop that contains an aspartic acid which serves as the general acid that protonates the leaving group. The WPD loop undergoes a substantial displacement on going from the open (inactive) to the closed (active) state, which places the general acid in close proximity to the oxygen of the leaving group of the substrate. By using both relaxation dispersion and 1H-15N-TROSY Hahn-echo experiments (Wang et al. Reference Wang, Rance and Palmer2003) it was found that the rate constant of WPD loop closure in each enzyme closely matched their rate constants in the presence and absence of a peptide substrate mimic. Thus it appears that the cleavage reaction supported by the action of the general acid is rate limited by the closing motion of the WPD loop (Whittier et al. Reference Whittier, Hengge and Loria2013). The actual chemical reaction, i.e. bond breaking and bond making in the transition state, is much faster (occurring on a femtosecond time scale) than the loop motions that were detected by NMR.
5.3 Intrinsic motions
As discussed earlier in this review, an enzyme's ability to catalyze a chemical reaction can be dependent on conformational dynamics and the exchange between stable ground states and high-energy states. As such, it is fundamental to determine whether the time scale and nature of the motions that are relevant for catalysis are determined by substrate binding or are intrinsic properties of the enzyme. Solid state deuterium NMR experiments reported in 1995 showed that that an important loop in triose-phosphate isomerase (TIM) displays an identical frequency of motions in the absence and presence of a substrate analogue (Williams & McDermott, Reference Williams and Mcdermott1995). Moreover, for CypA it has been shown that the motions that occur during catalysis also occur in the apo enzyme in the absence of any substrate (Eisenmesser et al. Reference Eisenmesser, Millet, Labeikovsky, Korzhnev, Wolf-Watz, Bosco, Skalicky, Kay and Kern2005). Moreover, the frequencies of motions in the presence and absence of substrate molecules correlate with the frequencies associated with catalytic turnover rate constants. These observations suggest that the enzyme motions that are required for catalysis are intrinsic to the enzyme and are ‘harvested’ to enable productive turnover when the substrate is bound. A similar inference has been made based on the observed motions of RNase A in the absence and presence of the substrate mimic pTppAp (Beach et al. Reference Beach, Cole, Gill and Loria2005). For protein kinase A (PKA), it has been observed that dynamics enable the sampling of active and inactive states in the absence of substrate but that the time scale of the motions in the apo state does not match with catalysis (Masterson et al. Reference Masterson, Shi, Metcalfe, Gao, Taylor and Veglia2011a). Overall it appears that the time scale of motions in apo enzymes may or may not be synchronized with that of catalytic turnover. Nevertheless, all of the enzymes mentioned above clearly sample active conformations in the absence of substrate, and it appears that this is the case for most enzymes.
5.4 Molecular recognition
Molecular recognition is a fundamental cornerstone of biology and the large number of ways that proteins can interact with other biological macromolecules or small organic molecules probably reflects its importance. In some cases the interaction interfaces between proteins are sculpted by the interaction energy (as assumed by the induced fit model) and in other cases the interfaces are more or less invariant to association (as assumed by the lock and key model). A wealth of information regarding the structure and energetics of biological interactions is available from x-ray crystallography (Lindgren et al. Reference Lindgren, Karlberg, Thorsell, Hesse, Spjut, Ekblad, Andersson, Pinto, Weigelt, Hottiger, Linusson, Elofsson and Schüler2013) and ITC (Kabiri & Unsworth, Reference Kabiri and Unsworth2014). Usually there is an optimal shape and charge complementarity for interaction interfaces (Buckle et al. Reference Buckle, Schreiber and Fersht1994) and the formation of stable complexes requires extensive burial of solvent-exposed surfaces. For instance, the average burial of surface area in protein–protein complexes is 800 Å2/protein, yielding a total burial of 1600 Å2 (Hwang et al. Reference Hwang, Pierce, Mintseris, Janin and Weng2008; Janin et al. Reference Janin, Bahadur and Chakrabarti2008). Although the basic principles of complex formation in terms of structure and energetics are well-described, there are several mechanistic aspects of molecular recognition that are most readily addressed using solution state NMR spectroscopy. In some instances NMR is the only technique that allows quantitative analysis, such as when quantifying the contribution of conformational entropy to binding affinities (Bingham et al. Reference Bingham, Findlay, Hsieh, Kalverda, Kjeliberg, Perazzolo, Phillips, Seshadri, Trinh, Turnbull, Bodenhausen and Homans2004; Bracken et al. Reference Bracken, Carr, Cavanagh and Palmer1999; Diehl et al. Reference Diehl, Engstrom, Delaine, Hakansson, Genheden, Modig, Leffler, Ryde, Nilsson and Akke2010; Gagne et al. Reference Gagne, Tsuda, Spyracopoulos, Kay and Sykes1998; Homans, Reference Homans2005; Stone, Reference Stone2001; Zidek et al. Reference Zidek, Novotny and Stone1999). Of note is that NMR spectroscopy is uniquely suitable for determining weak binding affinities (i.e. those associated with K D values that approach the mM concentration range) such as those between some enzymes and their substrates (Fersht, Reference Fersht2000). In this section we highlight aspects of molecular recognition in which NMR spectroscopy has provided fundamental mechanistic insights.
5.4.1 Coupled folding/binding
Coupled folding and binding pathways directly link protein folding and biological function; in such cases, the folding and functional energy landscapes overlap (Olsson & Wolf-Watz, Reference Olsson and Wolf-Watz2010). Proteins that are unfolded in solution in vitro are often found to be folded in their functional context (i.e. under cellular conditions) because they fully or partially fold on binding to another molecule, which may be another protein, a nucleic acid, a membrane, or a small molecule. Two major pathways for coupled binding and folding have been proposed: folding after binding (which corresponds to an induced fit) and conformational selection. In the folding after binding pathway, the unfolded protein binds to the target and then folds into the final structure, thus utilizing the target molecule as a folding template (Sugase et al. Reference Sugase, Dyson and Wright2007). On the other hand, in the conformational selection pathway a small fraction of the protein is folded when unbound and binding selects the folded form. Intermediate pathways between these two extremes also exist where a small amount of preformed structure might be required for the initial encounter complex. In the following sections we highlight cases where NMR has been used to describe coupled folding and binding processes between proteins and different target molecules such as proteins, lipids, small molecules and nucleic acids.
5.4.1.1 Phosphorylated kinase inducible activation domain (pKID)-KIX
One protein that follows the folding after binding pathway is the pKID of the transcription factor CREB. pKID exists as an unfolded protein in solution in vitro (Radhakrishnan et al. Reference Radhakrishnan, Perez-Alvarado, Parker, Dyson, Montminy and Wright1997) but folds upon binding to the KIX domain of the CREB binding protein (Parker et al. Reference Parker, Ferreri, Nakajima, Morte, Evans, Koerber, Hoeger and Montminy1996). The structure of the pKID-KIX complex has been solved by NMR (Radhakrishnan et al. Reference Radhakrishnan, Perez-Alvarado, Parker, Dyson, Montminy and Wright1997), revealing that the pKID forms two helices and that the C-terminal helix in particular is very well-defined, interacting specifically with KIX (Fig. 5). The binding process was studied using a combination of 15N-relaxation dispersion and chemical shift analysis of the pKID-KIX complex (Sugase et al. Reference Sugase, Dyson and Wright2007). An analysis of chemical shifts of pKID as a function of the relative concentration of KIX showed that most of its amino acid residues experience slow exchange (Sugase et al. Reference Sugase, Dyson and Wright2007) while a subset of residues experience fast exchange at sub stoichiometric KIX concentrations. Relaxation dispersion experiments showed that the protein was present in three different conformations: free protein, an intermediate, and the fully folded complex. This three-state model was chosen instead of a two-state model even though the latter yielded an estimated K D value that agreed well with ITC data (Zor et al. Reference Zor, De Guzman, Dyson and Wright2004). These observations led to the conclusion that an encounter complex is in fast exchange with unbound pKID leading to a folding process that occurs via an intermediate state and in which KIX serves as a folding template (Sugase et al. Reference Sugase, Dyson and Wright2007).
Coupled folding and binding illustrated with the NMR solution structure of the pKID:KIX complex. The structure of KIX is colored in gray, whereas the two helices of pKID are colored in light- and bright orange, respectively. The location of the phosphorylation site Serine 133 is shown in blue in a side chain representation. This figure was adapted from reference Radhakrishnan et al. (Reference Radhakrishnan, Perez-Alvarado, Parker, Dyson, Montminy and Wright1997).

5.4.1.2 Virion protein 16 (VP16)-hTAPII31
The C-terminal (410–490) part of Herpes simplex virion protein 16 (VP16C) contains two transcription activation domains that interact with large proteins in the RNA polymerase II transcription machinery (Jonker et al. Reference Jonker, Wechselberger, Boelens, Folkers and Kaptein2005). VP16C is unstructured in solution but adopts an alpha-helical conformation upon interaction. This was demonstrated by the appearance of alpha helix-specific NOEs following the addition of a substoichiometric amount of the receptor hTAFII31 (Uesugi et al. Reference Uesugi, Nyanguile, Lu, Levine and Verdine1997).
5.4.1.3 SycE-YopE
The effector protein YopE, a protein exported from Yesinia as part of its virulence, interacts specifically with the chaperone SycE. This interaction involves a coupled binding and folding event that is localized to the chaperone binding domain (CBD) region of YopE (Birtalan et al. Reference Birtalan, Phillips and Ghosh2002; Rodgers et al. Reference Rodgers, Gamez, Riek and Ghosh2008). The C-terminal catalytic RhoGAP domain is already folded in the absence of SycE and does not undergo any discernible resculpting upon binding to the chaperone. On the other hand, the CBD region shows chemical shifts typical for a random coil when not bound to SycE. The 15N-hNOE values for the entire CBD region were all between 0 and 0·5, which suggests a flexible but not fully random coil structure (Rodgers et al. Reference Rodgers, Gamez, Riek and Ghosh2008). When YopE binds to SycE, its chemical shifts change in a way that suggests, at least some parts of the CBD-region become alpha-helical. 15N-hNOE data show that the CBD-region becomes more rigid upon interaction, which can be attributed both to the formation of secondary structure elements and to the binding of this specific region on the surface of SycE (Rodgers et al. Reference Rodgers, Gamez, Riek and Ghosh2008).
5.4.1.4 Zspa−1-staphylococcal protein A
A coupled folding and binding event has also been identified in an interaction between an engineered protein and its target molecule. The engineered 58 amino acid long protein Zspa−1, a so called affibody, binds to the original affibody Z (Wahlberg et al. Reference Wahlberg, Lendel, Helgstrand, Allard, Dincbas-Renqvist, Hedqvist, Berglund, Nygren and Härd2003). This binding event induces a transition from a molten globule state to a well-folded three helix bundle (Wahlberg et al. Reference Wahlberg, Lendel, Helgstrand, Allard, Dincbas-Renqvist, Hedqvist, Berglund, Nygren and Härd2003) similar to the structure of the affibody Z. The 1H-15N-HSQC spectrum of free Zspa−1 shows amide proton resonances between 7·5 and 8·5 ppm, indicating a flexible structure. In addition, Zspa−1 binds to ANS, and subsequent fluorescence experiments also indicated a molten globule state. However, the dispersion of its amide proton signals increased significantly in the presence of the affibody Z, in parallel with a significant reduction in 1-anilinonaphthalene-8-sulfonate (ANS) fluorescence. Both of these results are consistent with the formation of a folded structure upon interaction (Wahlberg et al. Reference Wahlberg, Lendel, Helgstrand, Allard, Dincbas-Renqvist, Hedqvist, Berglund, Nygren and Härd2003).
5.4.1.5 Protein-small molecule interactions
Specific segments in proteins can fold upon interaction with small molecules as shown for the interaction between the Trp RNA-binding attenuation protein (TRAP) and tryptophan. TRAP is an undecameric protein that binds to RNA and contributes to the expression control of tryptophan synthesis in many species of bacillus. The binding of TRAP to RNA is regulated by the binding of tryptophan to TRAP. Results from the Forster laboratory (McElroy et al. Reference Mcelroy, Manfredo, Wendt, Gollnick and Foster2002, Reference Mcelroy, Manfredo, Gollnick and Foster2006) have shown that the binding of tryptophan induces the formation of defined structural elements in TRAP. This was demonstrated by quantifying chemical shift changes and line-broadening caused by the addition of tryptophan to TRAP (McElroy et al. Reference Mcelroy, Manfredo, Wendt, Gollnick and Foster2002). The affected amino acid residues are not just those in the vicinity of the tryptophan binding site, indicating a general increase in rigidity upon binding (McElroy et al. Reference Mcelroy, Manfredo, Wendt, Gollnick and Foster2002). In keeping with this conclusion, H/D exchange experiments revealed a region of the protein with increased resistance to exchange following tryptophan exposure, again indicating the formation of a more stable structure (McElroy et al. Reference Mcelroy, Manfredo, Gollnick and Foster2006). Among the amino acid residues with increased solvent protection were two acidic residues (Asp37 and Glu40) that have been shown to be involved in RNA recognition (McElroy et al. Reference Mcelroy, Manfredo, Gollnick and Foster2006). Studies on the binding of tryptophan to TRAP using ITC and fluorescence showed that all 11 sites of interaction were independent. Moreover, when the Spolar and Record (Spolar & Record, Reference Spolar and Record1994) method for computing the number of amino acid residues involved in coupled folding and binding based on measured ΔC p values was applied to the TRAP/tryptophan system, the number obtained was very similar to the number of residues exhibiting significant line-broadening in the NMR experiments (McElroy et al. Reference Mcelroy, Manfredo, Gollnick and Foster2006).
5.4.1.6 Protein–DNA interactions
Proteins can fold upon recognition of nucleic acids as was shown for the N-terminal 175 amino acid residues in the DNA binding domain of the Brinker protein (Brk). A 1H-15N HSQC spectrum showed that this protein is unstructured in solution. However, upon binding to DNA about 50% of the 1H-15N-HSQC signals exhibit dispersion behavior consistent with that expected for a folded protein (Cordier et al. Reference Cordier, Hartmann, Rogowski, Affolter and Grzesiek2006). Subsequent assignment showed that the dispersed signals belonged to the C-terminal half of the domain, and the corresponding 15N-hNOE values indicated a significant gain of order in the same region (Cordier et al. Reference Cordier, Hartmann, Rogowski, Affolter and Grzesiek2006). MD simulations of the binding of Brinker to DNA suggest that this occurs via an induced fit reaction (Qin et al. Reference Qin, Jiang, Chen, Wu, Yan, Ye, Li, Zhang and Chen2011).
5.4.1.7 Protein–lipid interactions
A recent example of an interaction between a protein and a lipid membrane is the interaction between a domain of YscU, one of the proteins that constitutes the type three secretion system in Yersinia-bacterial, and a lipid bilayer. YscU is a membrane protein consisting of two domains, a membrane integral domain (YscUN) and a soluble domain (YscUC). The linker between the domains is unstructured in solution. However, it incorporates a motif with positively charged amino acids separated by two or three other amino acids, so if it were to form an alpha-helix it would have a strongly positively charged face (Weise et al. Reference Weise, Login, Ho, Grobner, Wolf-Watz and Wolf-Watz2014). 13C chemical shift perturbations observed at binding of the linker to SDS-micelles and 3JHNHA-couplings both suggested that the linker forms an alpha-helix when in contact with negatively charged lipids. The folding event was also confirmed in more realistic membrane models by CD spectroscopy. Point mutations that caused some of these positively charged amino acids to be replaced with alanine strongly reduced membrane interaction and also adversely affected effector protein secretion (Weise et al. Reference Weise, Login, Ho, Grobner, Wolf-Watz and Wolf-Watz2014) thus confirming the biological role of the protein–membrane interaction.
5.4.2 Cracking or ‘order-disorder-order’ transitions
It has been postulated that one way of increasing the rate constants of functional transitions in proteins is by ‘cracking’, i.e. the unfolding of localized polypeptide segments in the transition state structure (Hyeon & Onuchic, Reference Hyeon and Onuchic2007; Miyashita et al. Reference Miyashita, Onuchic and Wolynes2003). This postulate builds on a notion from energy landscape theory (Frauenfelder et al. Reference Frauenfelder, Sligar and Wolynes1991, Reference Frauenfelder, Chen, Berendzen, Fenimore, Jansson, Mcmahon, Stroe, Swenson and Young2009; Onuchic & Wolynes, Reference Onuchic and Wolynes1993) that proteins constantly fluctuate between states in a stochastic way. During a functional transition, a protein may build up strain that is released through partial unfolding once it has exceeded a certain threshold. This unfolding event may then cause a gain in conformational entropy that can reduce the free energy barrier for the transition (Whitford, Reference Whitford2013). In essence the idea is that a protein that populates two different and completely folded structural states in inactive and active conformations can transiently populate a partially disordered state in the transition state. In analogy to such ‘disorder-order’ transitions, cracking models can be formulated in terms of an ‘order-disorder-order’ event (Olsson & Wolf-Watz, Reference Olsson and Wolf-Watz2010). Cracking is inherently difficult to probe experimentally but there are cases when its occurrence has been inferred from simulations. Proteins suggested to undergo cracking include Adk (Whitford et al. Reference Whitford, Miyashita, Levy and Onuchic2007, Reference Whitford, Onuchic and Wolynes2008), epidermal growth factor receptor (Shan et al. Reference Shan, Arkhipov, Kim, Pan and Shaw2013), calmodulin (Tripathi & Portman, Reference Tripathi and Portman2009) and influenza hemagglutinin (Lin et al. Reference Lin, Eddy, Noel, Whitford, Wang, Ma and Onuchic2014). Here we will briefly summarize the computational results for Adk and cracking in relation to a reaction coordinate linking open (inactive) and closed (active) states. Cracking was inferred from simulations in which the system was allowed to follow low frequency collective modes (Miyashita et al. Reference Miyashita, Onuchic and Wolynes2003) and from coarse grained simulations using structure-based potentials (Taketomi et al. Reference Taketomi, Ueda and Go1975; Whitford et al. Reference Whitford, Miyashita, Levy and Onuchic2007). A converging picture emerged from these studies which suggested that, segments in which cracking were likely could be found in both of the nucleotide-binding domains of Adk. A fundamental requirement for cracking to occur is that the local stabilities of the relevant polypeptide sequences must be low enough to allow strain release via local unfolding. This appears to be the case for Adk, for which NMR-based H/D exchange experiments have clearly demonstrated that the flexible nucleotide binding domains are significantly less stable than the protein is globally (Rundqvist et al. Reference Rundqvist, Ådén, Sparrman, Wallgren, Olsson and Wolf-Watz2009). Thus, the underlying energetics required to enable cracking are present in Adk. In an experimental approach designed to test the cracking model (Olsson & Wolf-Watz, Reference Olsson and Wolf-Watz2010) point mutations in Adk were designed to destabilize a segment of the ATPlid that was suggested to crack during the enzyme's functional transition. NMR monitoring revealed that the mutants were folded and adopted the correct structural motifs at the extremes of the reaction coordinate (i.e. in the open and closed states). However, the equilibrium constant for the folding/unfolding reaction was shifted more towards the unfolded state in the mutated variants. The mutants’ functionality was evaluated and benchmarked against the wild type in two experiments: (i) an ATP binding affinity assay probed by ITC, and (ii) an enzymatic activity assay probed using a coupled ATPase assay (Rhoads & Lowenstein, Reference Rhoads and Lowenstein1968). Notably the mutated and destabilized Adk variants displayed a fifty fold improved ATP binding affinity (K D values decreased from 50 to 1 µM). This is a remarkable result since in general destabilization of a protein is expected to impair functionality. The result is fully consistent with the idea that the mutations act to push the enzyme along the free energy surface in a way that is coupled to conformational change, and that the transition state structure is more disordered than the stable ground states. A related increase in binding affinity in response to a perturbation of native contacts has been observed for the binding of a peptide to the fibronectin extradomain B via a local unfolding mechanism (Yu et al. Reference Yu, Shin, Kim, Kim, Ryu, Cheong, Ahn, Jon and Suh2014). Since Adk is rate limited by the opening of its substrate binding domains, these mutations should in fact reduce the enzyme's catalytic efficiency (with the assumption that the free energy surfaces are robust to the mutations). This matches experimental observations: the variants retain only approximately 3% of wild type activity. Taken together, the experimental observations are fully consistent with the cracking model but do not provide definite evidence of its validity.
5.4.3 Coupled unfolding/binding
As discussed above, coupled folding and binding appears to be a fundamental concept in molecular recognition. Having established this model, it is not farfetched to assume that coupled unfolding and binding reactions may also be relevant in biological recognition processes. This has indeed recently been shown in an elegant paper by Suh and co-workers (Yu et al. Reference Yu, Shin, Kim, Kim, Ryu, Cheong, Ahn, Jon and Suh2014). The authors show in a very convincing manner that a β-strand in the fibronectin extra domain B (EDB) detaches from the core of the protein structure upon binding of a class of high-affinity peptides called aptides (Kim et al. Reference Kim, Kim, Jung, Lee, Kim, Suh and Jon2012). In the bound complex, the detached β-strand is replaced with a strand from the aptide. The work rests on a firm structural basis and the structures of both ligand-free EDB and a complex between EDB and an aptide were solved by NMR spectroscopy. Perhaps the most notable result is that the fast ps-to-ns mobility is significantly increased in the complex with the detached β-strand. The mechanism put forward by the authors thus involves a coupled local unfolding and binding event. The final result, i.e. a β-strand donation from the ligand to the protein, is fundamentally related to the ‘donor strand complementation’ model that was discovered for chaperone-adhesin complexes in bacterial pili (Choudhury et al. Reference Choudhury, Thompson, Stojanoff, Langermann, Pinkner, Hultgren and Knight1999; Sauer et al. Reference Sauer, Futterer, Pinkner, Dodson, Hultgren and Waksman1999). In a broader sense, it seems that cooperative folding reactions are fundamental in molecular recognition and that several flavors of folding are utilized, as exemplified by systems making use of ‘coupled folding-binding’, ‘coupled unfolding-binding’ and ‘cracking’ mechanisms for recognition of their respective targets. Since the cooperative folding reaction is evolutionarily robust, it comes as no surprise that it is used to add functionality to proteins.
5.4.4 Folding by phosphorylation
Most binding events leading to folding are driven by binding energetics arising from non-covalent interactions. The intrinsically disordered protein 4E-BP2 represents a notable exception in that its folding is induced by phosphorylation. The phosphorylation-driven folding of 4E-BP2 was detected on the basis of differences in 15N-hNOEs and the dispersion of chemical shifts observed in a 1H-15N-HSQC spectrum for phosphorylated and non-phosphorylated versions of the protein (Bah et al. Reference Bah, Vernon, Siddiqui, Krzeminski, Muhandiram, Zhao, Sonenberg, Kay and Forman-Kay2015). Since the protein's role is to bind to eIF4E in order to suppress cap-dependent translational initiation, the strength of the interaction between 4E-BP2 and eIF4E was evaluated using ITC. These titration experiments showed a significant decrease in binding affinity for the phosphorylated form, with K D increasing from 3 to 12 320 nM. This suggests that the phosphorylation event suppresses binding and thereby activates cap-dependent translation (Bah et al. Reference Bah, Vernon, Siddiqui, Krzeminski, Muhandiram, Zhao, Sonenberg, Kay and Forman-Kay2015).
5.4.5 Conformational entropy
The energetics underlying molecular recognition are described by the standard Gibbs free energy, ΔG° = ΔH°-TΔS°, and the relationship between the standard free energy and the equilibrium constant, ΔG° = −RTlnK D. Both the enthalpic (ΔH°) and entropic (ΔS°) components can be obtained from ITC experiments. However, these components reflect total changes in the energetics of the protein, the ligand and the solvent (including any co-solvents such as ions). Thus a fundamental problem in understanding energetics data obtained by ITC is the difficulty of deconvoluting the individual components of the system of interest. The entropic component is of particular interest and since the overall entropy contains a large desolvation term it is challenging to quantify the contribution from protein conformational entropy to a binding event. However, there are NMR approaches that can be used to estimate changes in a protein's conformational entropy based on analyses of order parameters (Akke et al. Reference Akke, Brüschweiler and Palmer1993a; Li & Bruschweiler, Reference Li and Bruschweiler2009; Wand, Reference Wand2001; Yang & Kay, Reference Yang and Kay1996). In the following section we describe some cases where estimates of protein conformational entropy provided new insight into molecular recognition.
5.4.5.1 Ligand binding
In a study on the energetics of carbohydrate binding to the carbohydrate recognition domain of Galectin-3, Akke and co-workers made the surprising discovery that protein conformational fluctuations on the ps-to-ns time scale, probed with 15N (Akke et al. Reference Akke, Skelton, Kordel, Palmer and Chazin1993b; Farrow et al. Reference Farrow, Muhandiram, Singer, Pascal, Kay, Gish, Shoelson, Pawson, Forman-Kay and Kay1994b; Hansen et al. Reference Hansen, Yang, Feng, Zhou, Wiesner, Bai and Kay2007, Reference Hansen, Feng, Zhou, Bai and Kay2009) and 2H spin relaxation (Millet et al. Reference Millet, Muhandiram, Skrynnikov and Kay2002), are amplified in the ligand bound state relative to unbound states (Akke, Reference Akke2012; Diehl et al. Reference Diehl, Engstrom, Delaine, Hakansson, Genheden, Modig, Leffler, Ryde, Nilsson and Akke2010). This finding is at large with the, perhaps more intuitive, quenching of fast time scale motions in protein-ligand complexes as observed for instance for Adk (Shapiro et al. Reference Shapiro, Sinev, Sineva, Tugarinov and Meirovitch2000). The changes in the fast dynamics of Galectin-3 were translated into relative changes in protein conformational entropy driven by ligand binding by using a previously developed formalism (Akke et al. Reference Akke, Brüschweiler and Palmer1993a; Li & Bruschweiler, Reference Li and Bruschweiler2009). Notably the changes in conformational entropy strongly favor carbohydrate binding and the magnitude of this term is comparable with the enthalpic component derived from ITC. This surprising result illustrates that fundamental aspects of the entropic contribution to binding remain to be explored and clarified. The analysis here is based on the assumption that fluctuations of individual residues are uncorrelated (Akke et al. Reference Akke, Brüschweiler and Palmer1993a) and therefore the results represents an upper limit on the entropy for the degrees of freedom that are probed (it should be noted that correlated motions on slower time scales can be studied using NMR (Bouvignies et al. Reference Bouvignies, Bernado, Meier, Cho, Grzesiek, Bruschweiler and Blackledge2005; Lundström et al. Reference Lundström, Mulder and Akke2005)). The contributions of conformational entropy to ligand binding have also been evaluated for a number of other proteins including calmodulin (Frederick et al. Reference Frederick, Marlow, Valentine and Wand2007; Marlow et al. Reference Marlow, Dogan, Frederick, Valentine and Wand2010), protein kinase A (Masterson et al. Reference Masterson, Cheng, Yu, Tonelli, Kornev, Taylor and Veglia2010), and mouse major urinary protein (Zidek et al. Reference Zidek, Novotny and Stone1999).
5.4.5.2 Negative binding cooperativity
Negative binding cooperativity cannot be explained with the MWC model (Monod et al. Reference Monod, Wyman and Changeux1965), but the sequential or Koshland-Nemethy-Filmer model can account for this effect (Koshland et al. Reference Koshland, Nemethy and Filmer1966). As an alternative it was proposed in 1984 (Cooper & Dryden, Reference Cooper and Dryden1984) that entropic contributions (manifested as protein dynamics) may represent another way in which negative binding cooperativity has evolved. Estimates of changes to conformational entropy following ligand binding to glycerol-3-phosphate:CTP transferase (GCT) (Stevens et al. Reference Stevens, Sanker, Kent and Zuiderweg2001) and the catabolite activator protein (CAP) (Popovych et al. Reference Popovych, Sun, Ebright and Kalodimos2006) have now confirmed this early prediction. Here we describe the CAP example in some detail. CAP is a symmetric homodimer with each monomer having 209 amino acid residues. Its DNA binding affinity is modulated by binding of two molecules of cAMP (Harman, Reference Harman2001). Binding of cAMP to CAP causes negative cooperativity and the binding constants for the first and second equivalent of cAMP are 0·04 and 4 µM, respectively (Popovych et al. Reference Popovych, Sun, Ebright and Kalodimos2006). From a structural standpoint system is well-characterized and the structures of apo CAP (Popovych et al. Reference Popovych, Tzeng, Tonelli, Ebright and Kalodimos2009), CAP-cAMP2 loaded (Passner et al. Reference Passner, Schultz and Steitz2000), and CAP-cAMP2 –DNA (Schultz et al. Reference Schultz, Shields and Steitz1991) have been reported. Briefly, the DNA recognition helices adopt a DNA binding incompetent state in the apo protein; upon cAMP binding, the orientation of these helices changes and they become poised for DNA binding. In a study from the Kalodimos laboratory it was found that the negative binding cooperativity observed for successive cAMP binding events to CAP is, at least in part, entropic in origin (Popovych et al. Reference Popovych, Sun, Ebright and Kalodimos2006). This conclusion was drawn after having quantified ps-to-ns motions in the protein by analyzing the spectral density function in three different states: (i) apo CAP, (ii) CAP-cAMP and (iii) CAP-cAMP2. It was possible to selectively populate the cAMP and cAMP2 bound states since the binding affinities for the binding of the first and second cAMP equivalent differ by two orders of magnitude. Notably, the ps-to-ns motions are very similar in the apo and cAMP bound states. However, upon binding of the second cAMP molecule there is a drastic reduction of these motions across the entire dimer. These effects were further quantified by evaluating the backbone order parameters, S 2, and using them to estimate the associated changes in conformational entropy. In summary, at least a part of the negative binding cooperativity observed for cAMP binding to CAP is explained by a decrease in conformational entropy that is exclusively associated with the binding of the second cAMP equivalent. As a final note, it appears that conformational entropy can also be relevant for positive binding cooperativity since it has been observed that successive binding of Ca2+ to calbindin D9k is associated with significant changes in fast time scale motions (Mäler et al. Reference Mäler, Blankenship, Rance and Chazin2000).
5.4.6 Encounter complexes
The rapid and specific association of protein complexes is a central component of many biological processes. For diffusion-controlled binding, the basal association rate constants are restricted by diffusion and the geometric constraints of binding surfaces. The binding process can be further slowed down through isomerization reactions on the protein (such as conformational changes) that occur after the initial encounter (Schreiber, Reference Schreiber2002). A minimal reaction for the association between two proteins, A and B, is then:
 $$A + B_{\mathop \leftarrow \limits_{{k_{ - 1}}}} ^{\mathop \to \limits^{{k_1}}} A{B^{\rm *}}{}_{\mathop \leftarrow \limits_{{k_{ - 2}}}} ^{\mathop \to \limits^{{k_2}}} A{B^{{\rm **}}}{}_{\mathop \leftarrow \limits_{{k_{ - 3}}}} ^{\mathop \to \limits^{{k_3}}} AB$$
where AB* is an encounter complex, AB** is an intermediate that is obtained following the isomerization of AB*, and AB is the stereospecific complex. Typical association rate constants (k 1 in the above equation) are in the range of 105–109 M−1 s−1 and the absolute value can be strongly dependent on electrostatic interactions and ionic strength (Schreiber & Fersht, Reference Schreiber and Fersht1996). When a non-specific encounter complex has been formed, a protein can engage in a 2D diffusion process that will eventually lead to the formation of the stereospecific complex. Since encounter complexes consist of several transient and weakly bound conformations, they are silent to many structural biology techniques. However, they can be studied using NMR because weak binding (K D values on the order of mM) are readily detected. A fundamental question relates to the structure of the encounter complex (AB*); as expected, it is most adequately described as an ensemble of conformers. Below we briefly review two cases in which NMR has been used to obtain detailed information on encounter complexes.
5.4.6.1 The N-terminal domain of enzyme I (EIN) and phosphocarrier protein
In a PRE-based study (Clore, Reference Clore2008), Clore and co-workers characterized an encounter complex ensemble (AB* in Eq. (13)) between EIN and the phosphocarrier protein (HPr). This was done by assuming that the binding reaction involves fast exchange such that observed PRE values are population weighted averages. Three sites outside the EIN interaction surface on HPr were individually replaced with cysteines and these sites were conjugated to EDTA through a disulfide linkage to yield a cysteaminyl-EDTA-Cys adduct. The adducts were then chelated with Mn2+ or Ca2+ to obtain paramagnetic and diamagnetic states, respectively. A comparison of the observed intramolecular PRE rates of the backbone amides (1HN-Γ2) of EIN with rate constants back-calculated from the stereospecific EIN-HPr (Garrett et al. Reference Garrett, Seok, Peterkofsky, Gronenborn and Clore1999) complex revealed regions with large discrepancies. These discrepancies were interpreted as evidence of a sparsely populated minor species that exists in rapid exchange with the final stereospecific complex. A structural ensemble of the minor states was generated with restrained rigid-body simulated annealing refinement (Schwieters et al. Reference Schwieters, Kuszewski and Clore2006) using 1HN-Γ2 relaxation rates from three HPr variants simultaneously. After cross-validation, it was concluded that the optimal ensemble size was 10–20 conformers with a population of minor species below approximately 10%. The distribution of non-specifically bound HPr molecules on the surface of EIN was found to be non-uniform and qualitatively correlated with the latter protein's negative electrostatic potential isosurface. Moreover, HPr predominantly uses its positively charged regions to interact with the negative EIN surface, highlighting the importance of charge–charge interactions for encounter complex formation (Schreiber & Fersht, Reference Schreiber and Fersht1996).
5.4.6.2 Cytochrome c (Cc) and cytochrome c peroxidase (CcP)
Electron transport complexes require the generation of stereo-specific complexes to facilitate electron transfer, but these complexes must be sufficiently weak and transient to allow high turnover rate constants (Bashir et al. Reference Bashir, Scanu and Ubbink2011). Yeast iso-1-Cc and yeast CcP are arguably the paradigm systems for studies on intermolecular electron transfer (Volkov et al. Reference Volkov, Worrall, Holtzmann and Ubbink2006). The crystallographic structure of the stereospecific complex has been solved (Pelletier & Kraut, Reference Pelletier and Kraut1992) and there are indications that the complex is dynamic (Jeng et al. Reference Jeng, Englander, Pardue, Rogalskyj and Mclendon1994; Northrup et al. Reference Northrup, Boles and Reynolds1988). In two contributions from the Ubbink laboratory, the surface probed by Cc in the encounter complex with Ccp was defined using PREs (Bashir et al. Reference Bashir, Volkov, Ullmann and Ubbink2010; Volkov et al. Reference Volkov, Worrall, Holtzmann and Ubbink2006). Paramagnetic spin labels were introduced on CcP through attachment of S-(1-oxyl-2,2,5,5-tetramethyl-2,5-dihydro-1H-pyrrol-3-yl)methyl methanesulfonothioate (MTSL) to engineered cysteines, and the PRE enhancements on Cc were converted into distance restraints (Gillespie & Shortle, Reference Gillespie and Shortle1997a). The measured PREs were analyzed in light of the stereospecific complex (Pelletier & Kraut, Reference Pelletier and Kraut1992) and an encounter-complex ensemble generated from Monte Carlo simulations (Bashir et al. Reference Bashir, Volkov, Ullmann and Ubbink2010) and it was found that both these structural descriptions were required to yield a satisfactory account of the experimental data. However, as noted by the authors, sampling encounter complexes in this way arguably reflects a poor formulation of the originally posed question and can only yield truly conclusive results in cases where no interaction occurs at all (Schilder et al. Reference Schilder, Lohr, Schwalbe and Ubbink2014). Nevertheless, it was found that the stereospecific complex and encounter complexes were occupied for 70 and 30% of the complex's total lifetime, respectively. Moreover, in the encounter complexes Cc samples about 15% of the surface area of CcP surrounding the stereo-specific binding site (Bashir et al. Reference Bashir, Volkov, Ullmann and Ubbink2010). In agreement with the EIN-HPr study, it was found that, electrostatics are the most important forces in the formation of encounter complexes.
5.5 Chaperonins
5.5.1 GroEL
Chaperonins, a sub-class of the larger group of molecular chaperones, are assembled into cylindrical, stacked ring structures with large internal cavities that can encapsulate substrate or client proteins (Braig et al. Reference Braig, Otwinowski, Hegde, Boisvert, Joachimiak, Horwich and Sigler1994). These proteins are found in all cell types in all organisms where they facilitate folding, assembly and transport. The most extensively studied chaperonin, both structurally and mechanistically, is the GroEL-GroES machinery (Horwich & Fenton, Reference Horwich and Fenton2009). GroEL is a 780-kDA assembly consisting of two stacked cylindrical units, each of which is built up from seven identical 56-kDa subunits. Encapsulation and release of substrate proteins is accomplished through a series of ATP-driven conformational changes to GroEL together with recruitment of the co-chaperone GroES (Horwich & Fenton, Reference Horwich and Fenton2009). Questions under considerable debate in the scientific literature are: (1) how GroEL interacts with substrate proteins and (2) the mechanism of GroEL-mediated protein folding. As discussed below, NMR has provided important insights into these challenging questions.
5.5.1.1 Substrate binding
In a study from the Gierasch laboratory based on transferred nuclear Overhauser effects it was found that a 13 amino acid residue peptide derived from the N-terminus of rhodanase, although disordered in solution, adopted an amphiphatic alpha-helical conformation when bound to GroEL (Landry & Gierasch, Reference Landry and Gierasch1991). The choice of the peptide was based on the fact that GroEL facilitates in vitro refolding of rhodanase (Mendoza et al. Reference Mendoza, Rogers, Lorimer and Horowitz1991). In a follow-up study from the same laboratory a larger set of peptides with varying sequence motifs were investigated and it was found that peptides can adopt other conformations than alpha helical (such as β-conformations) while bound to GroEL. It was further found that an important determinant for GroEL binding is presence of a hydrophobic surface (Wang et al. Reference Wang, Feng, Landry, Maxwell and Gierasch1999). As a comparison, well-ordered β-hairpin (Chen & Sigler, Reference Chen and Sigler1999) and extended conformations (Buckle et al. Reference Buckle, Zahn and Fersht1997) have been found from x-ray crystallography but the relative proportions of these bound conformations cannot be judged from analyses of protein crystals. In a comprehensive relaxation-based study of the interaction between the polypeptide amyloid β (Aβ40) and GroEL it was found that Aβ40 remains dynamically and structurally disordered while bound to the chaperonin (Libich et al. Reference Libich, Fawzi, Ying and Clore2013). The primary sites of interaction were found to be in two hydrophobic segments that overlap with a predicted GroEL consensus sequence (Stan et al. Reference Stan, Brooks, Lorimer and Thirumalai2006). It was further suggested that Aβ40 exchanges between several sites within the GroEl cavity and that its binding is of multivalent nature. The methodological arsenal applied in this study consisted of: (1) lifetime line-broadening analysis (Fawzi et al. Reference Fawzi, Ying, Torchia and Clore2010), (2) DEST (Fawzi et al. Reference Fawzi, Ying, Ghirlando, Torchia and Clore2011, Reference Fawzi, Ying, Torchia and Clore2012), (3) relaxation dispersion experiments (Loria et al. Reference Loria, Rance and Palmer1999; Tollinger et al. Reference Tollinger, Skrynnikov, Mulder, Forman-Kay and Kay2001) and (4) quantitative analysis of exchange-induced chemical shifts (Skrynnikov et al. Reference Skrynnikov, Dahlquist and Kay2002). It is undeniably relevant to address the properties of intact proteins while bound to GroES and such efforts require specialized NMR techniques that permit studies of very large systems. A bound complex between initially chemically denatured DHFR and GroEL has been characterized with NMR (Horst et al. Reference Horst, Bertelsen, Fiaux, Wider, Horwich and Wüthrich2005). In order to enable studies of these large assemblies, the authors acquired 2D [1H, 15N]-TROSY, 2D [1H, 15N]-CRIPT-TROSY and 2D [1H, 15N]-CRINEPT-HMQC-[1H]-TROSY experiments (Fiaux et al. Reference Fiaux, Bertelsen, Horwich and Wuthrich2002; Pervushin et al. Reference Pervushin, Riek, Wider and Wuthrich1997; Riek et al. Reference Riek, Fiaux, Bertelsen, Horwich and Wüthrich2002). Build-up of magnetization experiments using insensitive nuclei enhanced by polarization transfer (INEPT) or cross-correlated relaxation-induced polarization transfer (CRIPT) transfer elements indicated that bound DHFR exhibits internal mobility on both the ps-to-ns and the μs-to-ms time scales. In conclusion it was suggested that bound DHFR lacks stable tertiary contacts and may best be described as a dynamic ensemble of disordered conformers. Observations of the interaction between Hsp90 and the DNA binding domain of p53 suggest that the dynamic and multivalent interaction observed between chaperonins and full length proteins is also general to the larger family of molecular chaperones (Bukau & Walker, Reference Bukau and Walker1989; Bukau et al. Reference Bukau, Weissman and Horwich2006; Ellis, Reference Ellis1996; Miller et al. Reference Miller, Mogk and Bukau2015; Richter & Buchner, Reference Richter and Buchner2001). This inference is made on the basis of hydrogen-exchange measurements and line-broadening, which suggest that the DNA binding domain of p53 adopts an ensemble of conformers (possibly a molten globule state) in complex with Hsp90 (Park et al. Reference Park, Borin, Martinez-Yamout and Dyson2011).
5.5.1.2 GroEl mediated protein folding
There exist different models that can explain the catalytic folding of proteins by GroEL. Here we discuss the results from two benchmark publications that reported hydrogen/deuterium NMR exchange experiments which provided support for the hypothesis that GroEL acts according to the ‘annealing’ (Zahn et al. Reference Zahn, Perrett, Stenberg and Fersht1996) or ‘Anfinsen cage’ (Horst et al. Reference Horst, Fenton, Englander, Wüthrich and Horwich2007) models. It should be stressed that these models are not mutually exclusive but merely describe two distinct aspects of GroEL-stimulated protein folding.
Bacillus amyloliquefaciens ribonuclease (barnase) is a protein that has been thoroughly characterized with respect to amide protein exchange and thus serves as a suitable model for studying the influence of GroEL on these exchange processes. If GroEL functions by catalyzing unfolding (in order to allow and promote subsequent correct refolding) it can be postulated that the rate constants for amide protons whose exchange is dominated by global unfolding should increase. The amide proton exchange processes of barnase can be clustered into two sets; 16 amide protons exchange predominantly through local fluctuations whereas 15 exchange only from the fully unfolded state (i.e. via global unfolding) (Clarke et al. Reference Clarke, Hounslow, Bycroft and Fersht1993). In presence of catalytic amounts of GroEL there is a notable change to the amide-protein exchange pattern where the most prominent feature is that the time scale for residues exchanging through global unfolding is increased by at least one order of magnitude (Zahn et al. Reference Zahn, Perrett, Stenberg and Fersht1996). Moreover, the measured rate constants approach a unified and limiting value, indicating a switch from the EX2 to the EX1 limit of the exchange process in the presence of GroEL. In the EX1 limit, the exchange is given by the rate constant for formation of an unprotected state (here unprotected means ‘in the absence of hydrogen bonds’). This rate constant can then be interpreted as the unfolding rate constant. In contrast, the rate constants for residues that exchange through local fluctuations are similar regardless of GroEL's presence or absence. In summary, these experiments support an ‘annealing’ mechanism in which GroEL would have the potential to correct the misfolding of proteins by catalyzing their unfolding. The data are also fully consistent with the ‘Anfinsen cage’ model where the folding process is promoted in the cavity formed by GroEL. In the ‘Anfinsen cage’ model the sole determinant of the folding process is the primary sequence of the polypeptide (Ellis, Reference Ellis2003).
Strong support for the description of the folding chamber in GroEL as an ‘Anfinsen cage’ was obtained in an extensive study on the folding of human DHFR (hDHFR) (Horst et al. Reference Horst, Fenton, Englander, Wüthrich and Horwich2007). In the presence of ATP and methotrexate (Mtx), the temporal evolution of resistance to H/D exchange was virtually identical for hDHFR free in solution and inside the GroEL cavity (Horst et al. Reference Horst, Fenton, Englander, Wüthrich and Horwich2007). In brief, the experimental protocol used to monitor H/D exchange over time involved (1) denaturation of 15N-labelled hDHFR with guanidine hydrochloride, (2) dilution into buffer with GroEL, (3) addition of GroES, ATP and Mtx (at the start of the experiment), (4) a variable time delay, (5) the addition of ten volumes of D2O, (7) incubation until the reaction was completed, (8) acquisition of 2D 1H-15N-HSQC spectra and (9) evaluation of the build-up of NMR peak intensities. The experimental design with a variable time delay is favorable and in contrast to more traditional approaches (where protonated protein is diluted directly into D2O) it is not dependent on the acquisition time of the read-out experiments; the dead time is limited to about 15 s.
6. Outlook
NMR spectroscopy has developed into a mature technique that is being used to make important contributions to our understanding of complex biochemical and biophysical research questions. Although the initial and arguably most notable contribution in the application of NMR to protein chemistry was the development of techniques for protein structure determination (Wuthrich, Reference Wuthrich2001), today NMR is the most important tool for quantification of protein dynamics at atomic resolution (Boehr et al. Reference Boehr, Dyson and Wright2006a; Ishima & Torchia, Reference Ishima and Torchia2000; Kay, Reference Kay1998; Kern et al. Reference Kern, Eisenmesser, Wolf-Watz and James2005; Palmer, Reference Palmer2004; Palmer et al. Reference Palmer, Kroenke and Loria2001). As described earlier in this review, it has been of outstanding importance in many groundbreaking discoveries in protein chemistry. It is thus interesting to consider what directions NMR research might move in to ensure that this technique remains a cornerstone of contemporary protein research. It is already evident that NMR often is used together with other techniques in an integrated fashion to solve demanding research questions. One development with great potential is the integration of NMR studies with genetic approaches to reveal fundamentally new aspects of protein function. This has already been accomplished in a few cases (Lee et al. Reference Lee, Pullen, Virgii, Castaneda, Abeykoon, Bolon and Fushman2014), for example in the discovery of a coupling between an irreversible dynamic event (i.e. protein ‘homo dimer’ dissociation) and effector secretion linked to Yersinia pathogenicity (Frost et al. Reference Frost, Ho, Login, Weise, Wolf-Watz and Wolf-Watz2012). One fundamental advantage of genetic approaches is that new aspects of protein function can be found in a ‘model-independent’ manner that requires no prior hypothesis as long as the experimental setup is well-conditioned.
Comparative studies on related proteins originating from different organisms (Bhabha et al. Reference Bhabha, Ekiert, Jennewein, Zmasek, Tuttle, Kroon, Dyson, Godzik, Wilson and Wright2013; Holliday et al. Reference Holliday, Camilloni, Armstrong, Isern, Zhang, Vendruscolo and Eisenmesser2015; Robic et al. Reference Robic, Guzman-Casado, Sanchez-Ruiz and Marqusee2003) are powerful tools for addressing research questions related to specific protein properties such as enzymatic k cat values. The strength of the approach is that the sequences can be treated as mutations that are designed by evolution and properties such as 3D structure and stability can be similar such that a property of interest can be addressed exclusively. This approach was used successfully in a comparative study of mesophilic and hyperthermophilic Adk that focused on the linkage between dynamics and enzymatic k cat values (Wolf-Watz et al. Reference Wolf-Watz, Thai, Henzler-Wildman, Hadjipavlou, Eisenmesser and Kern2004). A related approach that holds promise for future studies involves the application of ancestral reconstruction while posing mechanistic questions. An important benefit of this approach is that it avoids problems associated with epistasis (i.e. the effect of surrounding amino acid residues on protein properties), enabling a property of interest to be addressed exclusively (Dellus-Gur et al. Reference Dellus-Gur, Elias, Caselli, Prati, Salverda, De Visser, Fraser and Tawfik2015). For instance it was shown with this approach that the cancer drug Gleevec binds more strongly to Abl than to Src kinases due to the magnitude of the equilibrium constant of an induced fit conformational rearrangement (Wilson et al. Reference Wilson, Agafonov, Hoemberger, Kutter, Zorba, Halpin, Buosi, Otten, Waterman, Theobald and Kern2015).
There is increasing interest among biophysicists in studying proteins in their real context, i.e. inside living cells. ‘In-cell’ and ‘in-lysate’ NMR spectroscopy (Danielsson et al. Reference Danielsson, Inomata, Murayama, Tochio, Lang, Shirakawa and Oliveberg2013, Reference Danielsson, Mu, Lang, Wang, Binolfi, Theillet, Bekei, Logan, Selenko, Wennerström and Oliveberg2015; Serber et al. Reference Serber, Corsini, Durst, Dotsch and James2005, Reference Serber, Selenko, Hansel, Reckel, Lohr, Ferrell, Wagner and Dotsch2007; Smith et al. Reference Smith, Sarkar, Young and Pielak2013) have developed to a point where new aspects of protein function can be revealed (Banci et al. Reference Banci, Barbieri, Bertini, Luchinat, Secci, Zhao and Aricescu2013). For instance in a recent study Selenko and co-workers developed an NMR-based methodology that enables quantification of the temporal phosphorylation and de-phosphorylation of short protein segments in cell lysates (Thongwichian et al. Reference Thongwichian, Kosten, Benary, Rose, Stuiver, Theillet, Dose, Koch, Yokoyama, Schwarzer, Wolf and Selenko2015). With this approach the efficacy of kinase drugs can be studied for many kinase targets simultaneously and also under near-cellular conditions. It is more than likely that ‘in-cell’ NMR will continue to develop such that new insights into protein function in a cellular context will be revealed. Perhaps the greatest challenge to overcome in such studies will be the design of robust experiments that enable conclusions to be drawn even in the presence of the complicated conditions represented by cells or lysates.
There has been significant progress in development of structure calculation protocols that take chemical shifts as input (Cavalli et al. Reference Cavalli, Salvatella, Dobson and Vendruscolo2007; Sgourakis et al. Reference Sgourakis, Lange, Dimaio, André, Fitzkee, Rossi, Montelione, Bax and Baker2011; Shen & Bax, Reference Shen and Bax2015; Shen et al. Reference Shen, Bryan, He, Orban, Baker and Bax2010; Wishart et al. Reference Wishart, Arndt, Berjanskii, Guo, Shi, Shrivastava, Zhou, Zhou and Lin2008). Together with the further development of spin relaxation techniques and isotope labeling strategies it is likely that protein dynamics will also be possible to study from chemical shifts. There has been development in this direction (Lehtivarjo et al. Reference Lehtivarjo, Tuppurainen, Hassinen, Laatikainen and Peräkylä2012; Li & Brüschweiler, Reference Li and Brüschweiler2011; Markwick et al. Reference Markwick, Cervantes, Abel, Komives, Blackledge and Mccammon2010; Robustelli et al. Reference Robustelli, Stafford and Palmer2012) and the time averaging of chemical shifts in these methods is based on molecular dynamics simulations, which means that fast time scale motions can be addressed. As an example, Vendruscolo and co-workers developed a methodology that enabled characterization of a conformational equilibrium in Rnase A by including chemical shifts as restraints in molecular dynamics simulations (Camilloni et al. Reference Camilloni, Robustelli, Simone, Cavalli and Vendruscolo2012, Reference Camilloni, Cavalli and Vendruscolo2013). Since most NMR projects generate chemical shift assignments, further development will enable quantification of dynamics in increasingly large and complex systems.
The introduction of polarization techniques (Riek et al. Reference Riek, Fiaux, Bertelsen, Horwich and Wüthrich2002) and TROSY (Pervushin et al. Reference Pervushin, Riek, Wider and Wuthrich1997) spectroscopy (Tugarinov et al. Reference Tugarinov, Hwang, Ollerenshaw and Kay2003) has made it possible to study the structure and dynamics of very large proteins and protein assemblies by NMR (Fiaux et al. Reference Fiaux, Bertelsen, Horwich and Wuthrich2002; Gelis et al. Reference Gelis, Bonvin, Keramisanou, Koukaki, Gouridis, Karamanou, Economou and Kalodimos2007; Mainz et al. Reference Mainz, Religa, Sprangers, Linser, Kay and Reif2013; Rudiger et al. Reference Rudiger, Freund, Veprintsev and Fersht2002; Saio et al. Reference Saio, Guan, Rossi, Economou and Kalodimos2014; Sprangers et al. Reference Sprangers, Gribun, Hwang, Houry and Kay2005, Reference Sprangers, Velyvis and Kay2007; Sprangers & Kay, Reference Sprangers and Kay2007; Tugarinov et al. Reference Tugarinov, Hwang and Kay2004). Ongoing development in these areas will undoubtedly enable the investigation of still larger and more complex systems, ensuring that NMR is no longer limited to smaller proteins and assemblies.
And finally, although not covered in this review, there have been tremendous developments in solid state NMR spectroscopy both with respect to protein structure determination (Colvin et al. Reference Colvin, Silvers, Frohm, Su, Linse and Griffin2015; Lendel et al. Reference Lendel, Bjerring, Dubnovitsky, Kelly, Filippov, Antzutkin, Nielsen and Härd2014; Marchanka et al. Reference Marchanka, Simon, Althoff-Ospelt and Carlomagno2015; Park et al. Reference Park, Das, Casagrande, Tian, Nothnagel, Chu, Kiefer, Maier, De Angelis, Marassi and Opella2012; Radoicic et al. Reference Radoicic, Lu and Opella2014) and the quantification of protein dynamics (Lewandowski, Reference Lewandowski2013; Ullrich & Glaubitz, Reference Ullrich and Glaubitz2013). In summary, we conclude that the future prospects for NMR-driven protein research are bright and we can expect many breakthrough discoveries based on this versatile and powerful technique.
Acknowledgements
This work was financially supported by the Swedish Research Council to M. W.-W, and a postdoctoral fellowship from the Deutsche Forschungsgemeinschaft to M. K. (KO4687/1-1).


