

1. INTRODUCTION
In the Canadian Arctic Archipelago (CAA), the northern coast of Ellesmere Island is unique for having a coastline characterized by tidewater glaciers that include floating glacier tongues (hereafter referred to as ice tongues) and ice shelves, typically fringed by multi-year landfast sea ice (MLSI). The ice shelves are remnants of a 500 km long ice shelf (unofficially named the Ellesmere Ice Shelf) that fringed the northern coast of Ellesmere Island at the start of the 20th century, which initially formed through the thickening of MLSI and sometimes glacial input (Vincent and others, Reference Vincent, Gibson and Jeffries2001). Since 2005, the coastline has undergone rapid and extensive changes in its floating ice cover, including nearly complete loss of the Ayles, Markham and Serson ice shelves, and the complete loss of >70 year old MLSI from Yelverton Bay, Yelverton Inlet and Kulutingwak Fiord (Copland and others, Reference Copland, Mueller and Weir2007; Mueller and others, Reference Mueller, Copland, Hamilton and Stern2008, Reference Mueller, Copland, Jeffries, Copland and Mueller2017; Pope and others, Reference Pope, Copland and Mueller2012; White and others, Reference White, Copland, Mueller and Van Wychen2015). In a recent study that quantified glacier area changes across Northern Ellesmere Island, White and Copland (Reference White and Copland2018) reported the loss of 19 out of 27 ice tongues between ~1999 and ~2015, located predominantly in the Yelverton Bay region. While numerous studies have been undertaken to analyze changes and identify the factors leading to ice shelf reductions (Copland and others, Reference Copland, Mueller and Weir2007, Reference Copland, Mortimer, White, Richer McCallum, Mueller, Copland and Mueller2017; White and others, Reference White, Copland, Mueller and Van Wychen2015; Mueller and others, Reference Dowdeswell, Jeffries, Copland and Mueller2017) and MLSI loss (Pope and others, Reference Pope, Copland and Mueller2012, Reference Pope, Copland, Alt, Copland and Mueller2017) on Northern Ellesmere Island, there has never been a systematic analysis of how or why ice tongues in this region have responded to the dramatic changes in the marine ice environment.
Numerous studies from Greenland and Antarctica have highlighted several key controls on the dynamics, stability, and retreat of floating glaciers, including increasing air temperatures, increasing ocean temperatures and the weakening or removal of fast ice or mélange (a conglomeration of icebergs and sea ice) from the glacier terminus. Warmer air temperatures increase surface melt, which can enhance water penetration into crevasses and drive their vertical expansion through floating termini via hydrofracturing (Sohn and others, Reference Sohn, Jezek and van der Veen1998; van der Veen, Reference van der Veen1998), or strengthen subglacial plumes that enhance submarine melt (Jenkins, Reference Jenkins2011). Warmer ocean temperatures can lead to grounding line retreat, thinning and undercutting of the calving front through submarine melting (Vieli and Nick, Reference Vieli and Nick2011; Nick and others, Reference Nick2012). Warming air and ocean temperatures can both melt sea ice and mélange, which have been shown to suppress calving through mechanical buttressing (Sohn and others, Reference Sohn, Jezek and van der Veen1998; Reeh and others, Reference Reeh, Thomsen, Higgins and Weidick2001; Massom, Reference Massom2003; Amundson and others, Reference Amundson2010; Walter and others, Reference Walter2012).
Given the rapid recent loss of floating glacier tongues on Northern Ellesmere Island reported by White and Copland (Reference White and Copland2018), this study examines controls on the long-term stability of 13 ice tongues in the Yelverton Bay region in relation to sea ice, atmospheric forcing and oceanographic forcing between 1959 and 2017. The results contribute to the growing body of research regarding the mechanisms driving ice tongue disintegration, in a location not previously studied.
2. STUDY SITE
Yelverton Bay (82°23′ N, 83°18′ W) is situated on the northern coast of Ellesmere Island between Alert Point and Hansen Point, ~300 km west of Alert (Fig. 1). Yelverton Bay is ~40 km wide at its widest point and is typically filled with MLSI (Jeffries and Serson, Reference Jeffries and Serson1986; Pope and others, Reference Pope, Copland and Mueller2012). Yelverton Inlet and Kulutingwak Fiord are adjacent waterways divided by Mitchell Point at the southern end of Yelverton Bay, which has historically contained an extensive MLSI cover (Fig. 1; Pope and others, Reference Pope, Copland and Mueller2012). These interconnected waterways, collectively referred to as the ‘Yelverton Bay region’ in this study, were selected for analysis because they contain the largest concentration of tidewater glaciers with ice tongues in the CAA, in a region that has experienced widespread glacier, ice shelf and sea ice changes in the recent past (Pope and others, Reference Pope, Copland and Mueller2012; Mueller and others, Reference Dowdeswell, Jeffries, Copland and Mueller2017; White and Copland, Reference White and Copland2018). The 13 outlet glaciers that terminate in the ocean in this region ranged in basin size from 5.51 km2 (Glacier C) to 852.37 km2 (De Vries Glacier) in 2015 (Table 1; White and Copland, Reference White and Copland2018). Yelverton Glacier has become the dominant source of ice discharge to the ocean on Northern Ellesmere since 2010, with a mean discharge of 0.1118 Gt a−1 between 2000 and 2015 (Table 1; Millan and others, Reference Millan, Mouginot and Rignot2017).
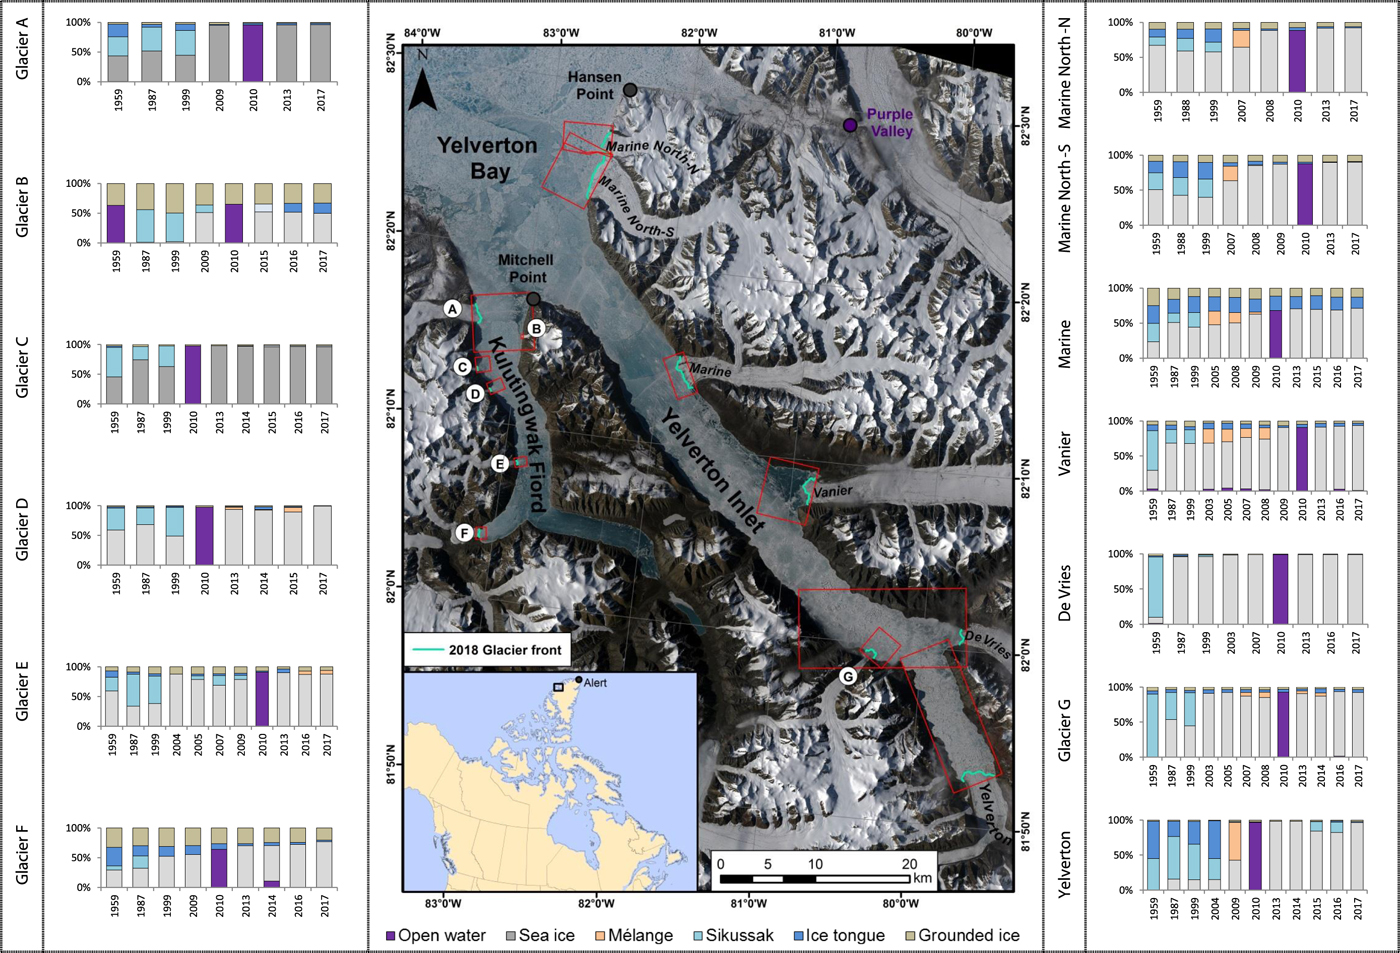
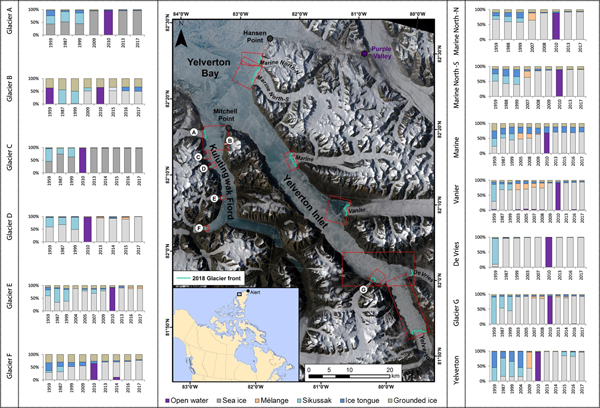
Fig. 1. Change in the proportion of each ice type (in summer) at the terminus of 13 marine-terminating glaciers in the Yelverton Bay region between 1959 and 2017 (note the different scales on the x-axes). Boxes used for area measurements shown in red. Base image: Landsat-8, 29 June 2018.
Table 1. Key data on the 13 tidewater glaciers described in this study.

a White and Copland (Reference White and Copland2018).
b Copland and others (Reference Copland, Sharp and Dowdeswell2003).
c Van Wychen and others (Reference Van Wychen2015).
d Surveyed ice discharge values from Millan and others (Reference Millan, Mouginot and Rignot2017).
The only glacier with an official name in the study region, as defined by the Canadian Geographical Names Data Base (http://www4.rncan.gc.ca/search-place-names/search), is De Vries Glacier, but several glaciers have been unofficially named on maps and in past research (e.g. Van Wychen and others, Reference Van Wychen2015; Mueller and others, Reference Dowdeswell, Jeffries, Copland and Mueller2017). To ease identification we use unofficial names from previous studies where available, and for those glaciers without names, we have named them A through G from north to south (Fig. 1; Table 1). The Global Land Ice Measurements from Space (GLIMS) ID (from White and Copland, Reference White and Copland2018) has also been included for each glacier in Table 1.
3. METHODS
3.1 Imagery and ice type measurements
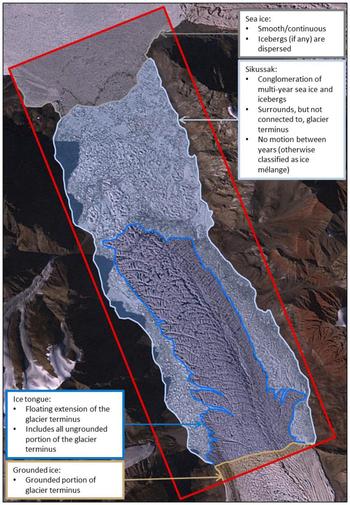
To map changes in ice tongues and sea-ice conditions over time, we delineated their ice extents using cloud-free, summer imagery from the period 1959 to 2017 (Table 2). To measure the change in the proportion of each ice type a box was delineated around the terminus of each glacier, extending beyond the maximum extent and width of the sikussak/mélange or ice tongue, and up-glacier beyond the glacier grounding line (Figs 1, 2). For each glacier, the surrounding sea ice, open water, sikussak, mélange, ice tongue and grounded glacier ice were outlined. The different floating ice types are defined as follows (and shown in Fig. 2):
(a) Ice tongues comprise the floating extension of single valley glaciers over the ocean (Mueller and others, Reference Dowdeswell, Jeffries, Copland and Mueller2017), including all floating glacier ice downglacier of the grounding line.

Fig. 2. Landsat-7 (24 June 1999) of Yelverton Glacier (see Fig. 1 for location), illustrating the difference between ice types delineated in this study.
Table 2. List of imagery used to delineate the different ice types measured in this study.
a The product identifier for aerial photography includes the film roll number and ID number.
b Master image against which all aerial photographs and SPOT imagery was georeferenced.
(b) Sikussak is a Greenlandic term (also spelled Sikussaq) used to describe ‘ice which resembles the ocean-ice’ (Rasmussen, Reference Rasmussen1921, p. 331; Koch, Reference Koch1926, p. 100) and is comprised of a combination of MLSI and icebergs (Dowdeswell and Jeffries, Reference Dowdeswell, Jeffries, Copland and Mueller2017). If sikussak becomes thicker than 20 m through surface accumulation and basal accretion, it would be termed a composite ice shelf (Dowdeswell and Jeffries, Reference Dowdeswell, Jeffries, Copland and Mueller2017). In this study, sikussak is defined as a multi-year conglomeration of multi-year ice, brash ice, icebergs and/or ice islands that remains in position for more than one year.
(c) Ice mélange refers to a mix of sea-ice floes and icebergs that forms and breaks out seasonally (Amundson and others, Reference Amundson2010; Dowdeswell and Jeffries, Reference Dowdeswell, Jeffries, Copland and Mueller2017). If ice mélange remains for more than one year, it would be termed sikussak.
(d) Sea ice refers to any form of ice at sea which has formed from freezing water. If the sea ice has survived for at least two summers, it is referred to as MLSI, whereas first-year sea ice (FYI) refers to sea ice from one winter's growth (Canadian Ice Service, 2005). While MLSI and FYI are used to describe overall changes in the Yelverton Bay region, these types are not distinguished in the changing proportions of ice types for each glacier front (i.e. Tables 3, 4).
Table 3. Area of each ice type for seven glaciers in Yelverton Bay and Inlet between 1959 and 2017
Table 4. Area of each ice type for six glaciers in Kulutingwak Fiord between 1959 and 2017


The grounding line and grounded vs ungrounded portions of a glacier were distinguished based on:
(a) the presence of longitudinal fractures in the ungrounded part, where floating glacier ice begins to spread in a digitate pattern,
(b) occurrence of tidal cracks at the grounding line, perpendicular to the glacier flow direction,
(c) the presence of transverse crevasses, supraglacial streams and surface slopes on the grounded portion.
The earliest extent of each ice type (i.e. sea ice, sikussak, mélange and ice tongue) was mapped using stereo aerial photographs from 1959, collected by the Royal Canadian Air Force and acquired from the National Air Photo Library (Natural Resources Canada), Ottawa, Canada. Satellite Pour l'Observation de la Terre (SPOT) satellite imagery was used to delineate ice types in 1987/88. Annual measurements were made from 1999 to 2017 (with the exception of 2006) using the Landsat Tier 1 collection, obtained from the United States Geological Survey Earth Explorer (https://earthexplorer.usgs.gov/), which consists of a level-1 precision and terrain corrected satellite image product that is consistently georegistered within tolerances of ⩽12 m radial root mean square error (RMSE; U.S. Geological Survey, 2016). Aerial photographs and SPOT imagery were georeferenced to a 15 m pansharpened Landsat-8 image from 24 July 2017 with complete coverage of the study area, using a minimum of 20 ground control points (GCPs) and a first order polynomial transformation, resulting in a RMSE of <15 m. In some instances, a third order polynomial transformation was used where warp was necessary.
3.2 Open water analysis
To examine the spatial distribution and interannual frequency of open water events throughout the study area, Moderate Resolution Imaging Spectroradiometer (MODIS) Terra/Aqua satellite imagery (corrected reflectance, true color), with 250 m resolution was used for summer (01 June to 30 September) observations from 2000 to 2017. The images were downloaded from NASA WorldView (https://worldview.earthdata.nasa.gov/). Although MODIS data are acquired daily, observations were limited to mostly cloud-free imagery, which typically occurred at least once per week. Open water was only recorded when it extended across an inlet or fiord. The Yelverton Bay region was divided into sub-regions for the open water analysis to enable understanding of connections to individual glacier changes (Fig. 3a).
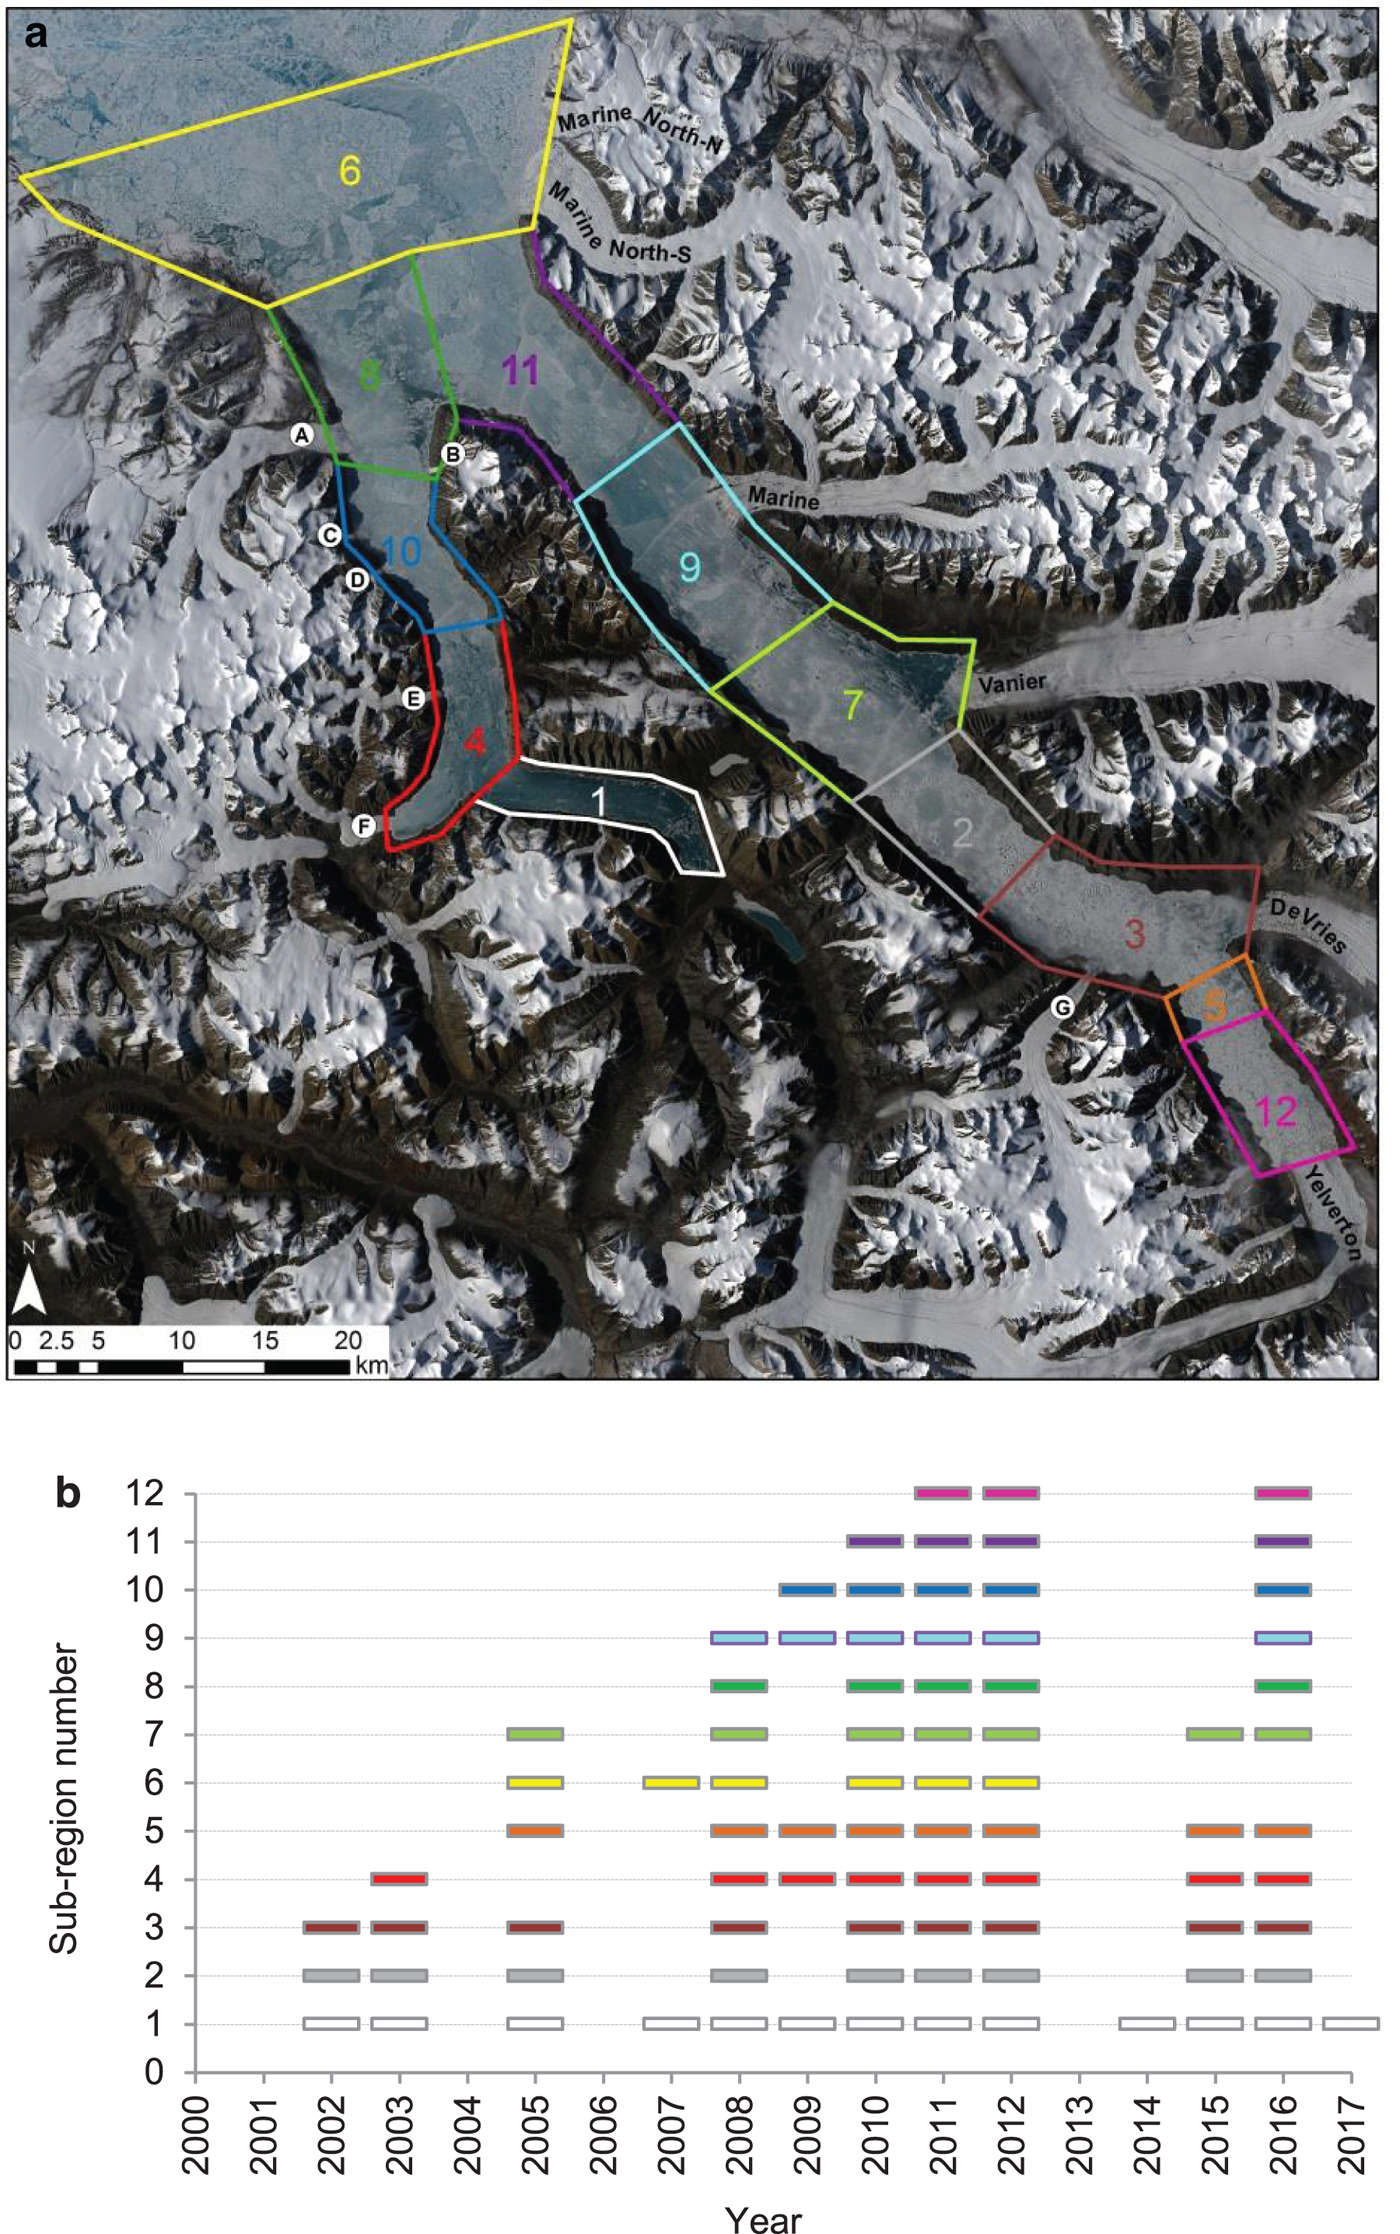
Fig. 3. Summer open water years between 2000 and 2017 determined from MODIS imagery: (a) Sub-regions used to track open water areas, labelled by the order in which each region became ice-free (base image: Landsat-8, 29 June 2018); (b) summers with open water for sub-regions identified in part a. Note: the sub-regions in part (a) contain the location of the open water but do not necessarily represent the total extent of the open water.
3.3 Air temperature data
Due to the lack of long-term meteorological stations in the study area, we used the 2.5° NCEP/NCAR Reanalysis dataset (Kalnay and others, Reference Kalnay1996; https://www.esrl.noaa.gov/psd/cgi-bin/data/timeseries/timeseries1.pl) to calculate mean summer (June, July and August) surface (1000 mb) air temperatures since 1948. For this study, the air temperature data were downloaded for the gridpoint nearest to the Yelverton Bay region, at 82.5° N, 82.5° W. Recent studies have compared the NCEP/NCAR Reanalysis dataset with surface temperatures recorded since 2008 at an automatic weather station in Purple Valley, ~30 km east of Yelverton Bay (Fig. 1), and found that although the reanalysis data have a positive bias in some winters the dataset is sufficient for understanding trends and variability in surface air temperature (White and others, Reference White, Copland, Mueller and Van Wychen2015; White and Copland, Reference White and Copland2018). A linear regression between the reanalyzed and the observed temperature is highly significant (R 2 = 0.98, p < 0.0001), with an RMSE of 3.97°C (White and others, Reference White, Copland, Mueller and Van Wychen2015).
3.4 Ocean temperature data
In the absence of oceanographic measurements in the study region, we used the TOPAZ4 Arctic Ocean Reanalysis dataset, generated by the Copernicus Marine Environment Monitoring Service (CMEMS; http://marine.copernicus.eu/), to calculate mean monthly temperatures from 1999 to 2016. This dataset was derived from a 12.5 km resolution gridded dataset, based on in situ and satellite measurements, and assimilated using the HYCOM model. We downloaded the mean monthly product (ARCTIC_REANALYSIS_PHYS_002_003) from 1999 to 2016, at standard depths of 50, 100 and 200 m. From these data, we extracted the mean annual temperature at each depth for the gridcell (82°33.032′ N, 83°46.856′ W) nearest to the study region, in Yelverton Bay. The RMSE for ocean temperatures is stated as being between 0.34 and 0.92°C for ocean depths of 0, 100, 300, 800 and 2000 m (http://cmems-resources.cls.fr/documents/QUID/CMEMS-ARC-QUID-002-003.pdf). There are no local measurements available to verify the TOPAZ4 outputs, so it is difficult to use them to reconstruct detailed ocean temperatures for specific dates. However, it is the best available data for this region, and we expect it to provide a reasonable measure of long-term changes.
4. RESULTS
4.1 Changes in ice type
Analysis of the proportion of each ice type at the front of the 13 glaciers in the Yelverton Bay region between 1959 and 2017 revealed a marked change in floating ice conditions (Figs 1, 4; Tables 3, 4). Sikussak fringed the front of 12 glaciers in 1959, but reduced in area in the early 2000s and had lost 86.24 km2 (58.7%) of its area by 2003 (Fig. 1). From 2003 onward ice-free, open water conditions began to develop seasonally at the south end of both Yelverton Inlet and Kulutingwak Fiord, and eventually spread throughout the entire study area in summer 2010 (Fig. 3). As individual glacier fronts became exposed to open water in one summer, the following summer would typically reveal the loss of sikussak and ice tongue area. Since 2010 sea ice now occurs almost exclusively at the fronts of the glaciers, with little of the other ice types left (Fig. 4).
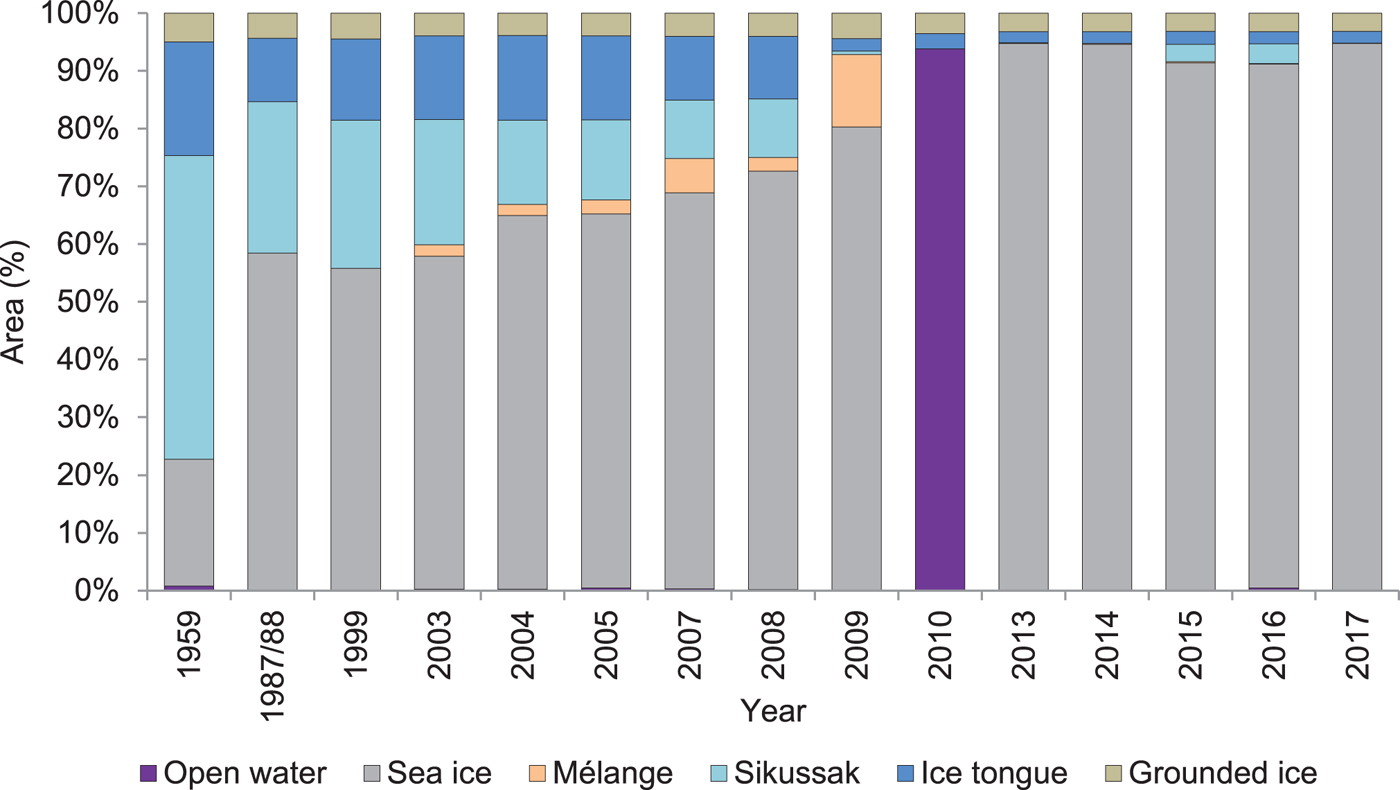
Fig. 4. Total change in the relative proportion of each ice type (in summer) for all 13 marine-terminating outlet glaciers in the Yelverton Bay region from 1959 to 2017. Boxes used for area measurements are shown in red in Figure 1.
Despite the overall pattern of losses described above, there are several important variations based on location and/or initial morphology of the terminal environment. The first unique behavior is shown by De Vries Glacier, which had the most extensive concentration of sikussak (70.4 km2) adjacent to a relatively short (~600 m long) ice tongue in 1959 (Fig. 5a). Unlike all other glaciers in the study, almost all of this sikussak was lost by 1987 (Figs 1, 5b). In the years following, the small amount of remaining sikussak (1.68 km2 in July 1999; Figs 5c, d) was lost and replaced by sea ice, and the ice tongue lost 0.46 km2 (72.5%) between 1999 and 2007 (Fig. 5d). By 2010, during an open water event, a tidal fracture formed ~240 m up-glacier, suggesting that the grounding line had retreated (Fig. 5e). After 2010 the ice tongue was quasi-stationary, expanding slightly (0.06 km2) between 2010 and 2013, then decreasing slightly (0.03 km2) by 2017 (Fig. 5f).
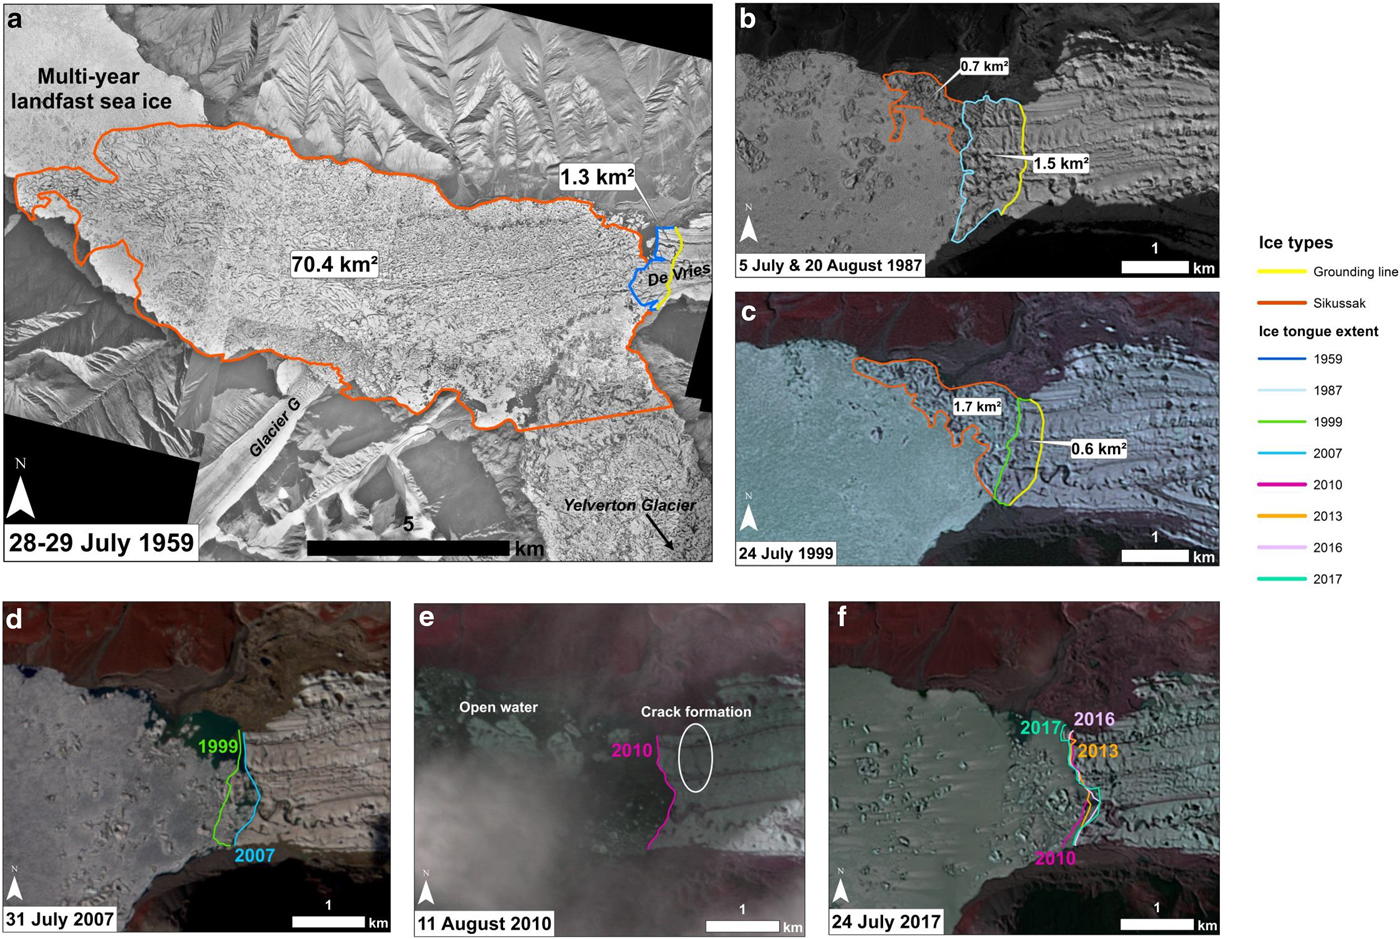
Fig. 5. Imagery of De Vries Glacier showing: (a, b, c) ice type changes between 1959 and 1999; (d, e, f) changes in the glacier front position between 1999 and 2017. See Table 2 for image details.
Another location which saw dramatic changes in the floating ice cover occurred at Yelverton Glacier which, in 1959, had an ice tongue ~23 km long, surrounded by sikussak which merged with the sikussak from neighboring De Vries Glacier (Figs 5a, 6a). Between 1959 and 1987 the ice tongue reduced in area by 19.67 km2 (58.5%), thus contributing to the surrounding sikussak. By 1999 the ice tongue had advanced by ~3.8 km along its centerline since 1987, increasing in area by 6.6 km2 (47.4%), where it remained stable until 2004; however, the surrounding sikussak decreased by 19.26 km2 (60%) between 1999 and 2004. Between 2008 and 2009 the once large ice tongue (20.96 km2 in 2004; Fig. 6d) underwent a dramatic collapse, losing 9.3 km of its centerline length, and became a 34.17 km2 area of ice mélange (Fig. 6e). The small ice tongue expanded 0.26 km2 between 2009 and 2010 (Figs 6e, f). The changes observed in 2009 and 2010 were preceded by open water in 2008 and 2009 (Figs 3, 7e, f). By 2013, Yelverton Glacier terminated at the grounding line and remained in this position through 2014. By 2015 the terminus had advanced by ~220 m along its centerline and developed an ice tongue surrounded by calved icebergs bounded in sea ice (sikussak; Fig. 6g). Further advance by 2016 caused the terminus to expand by 0.37 km2 and calve icebergs into the surrounding sikussak, resulting in its expansion by 1.00 km2 (Fig. 6h). By 2017 all sikussak had drifted away from the glacier front, but the ice tongue had increased again by 0.54 km2 after open water in 2016 occurred in the fiord in front of Yelverton Glacier (Figs 3, 6i).
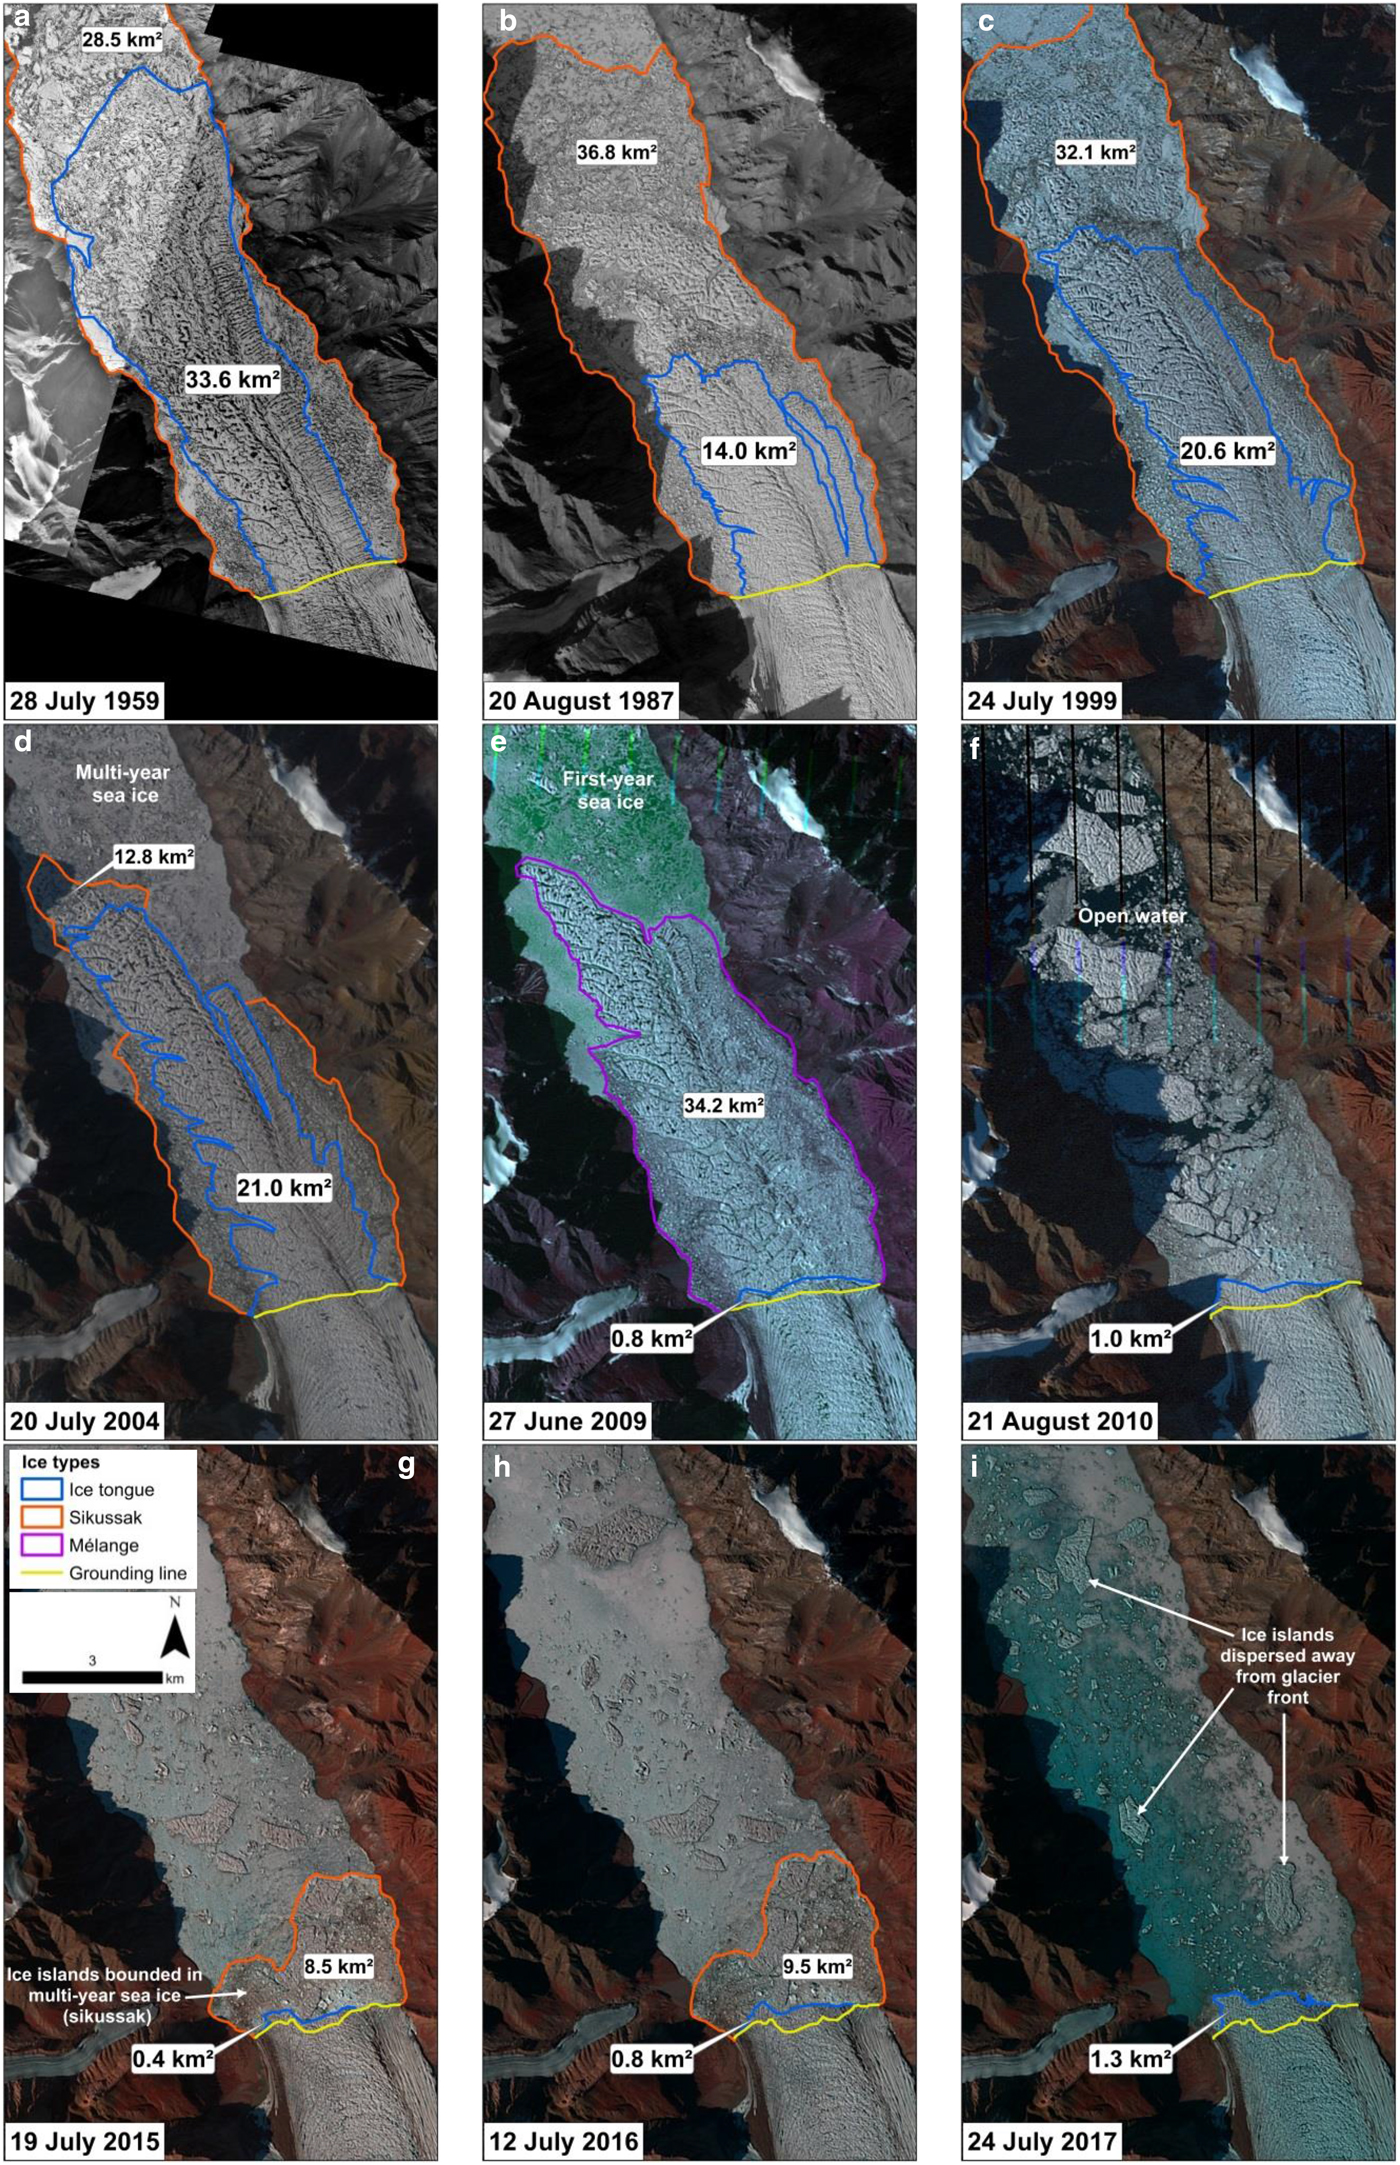
Fig. 6. Progression of ice tongue loss at Yelverton Glacier between 1959 and 2017. See Table 2 for image details.
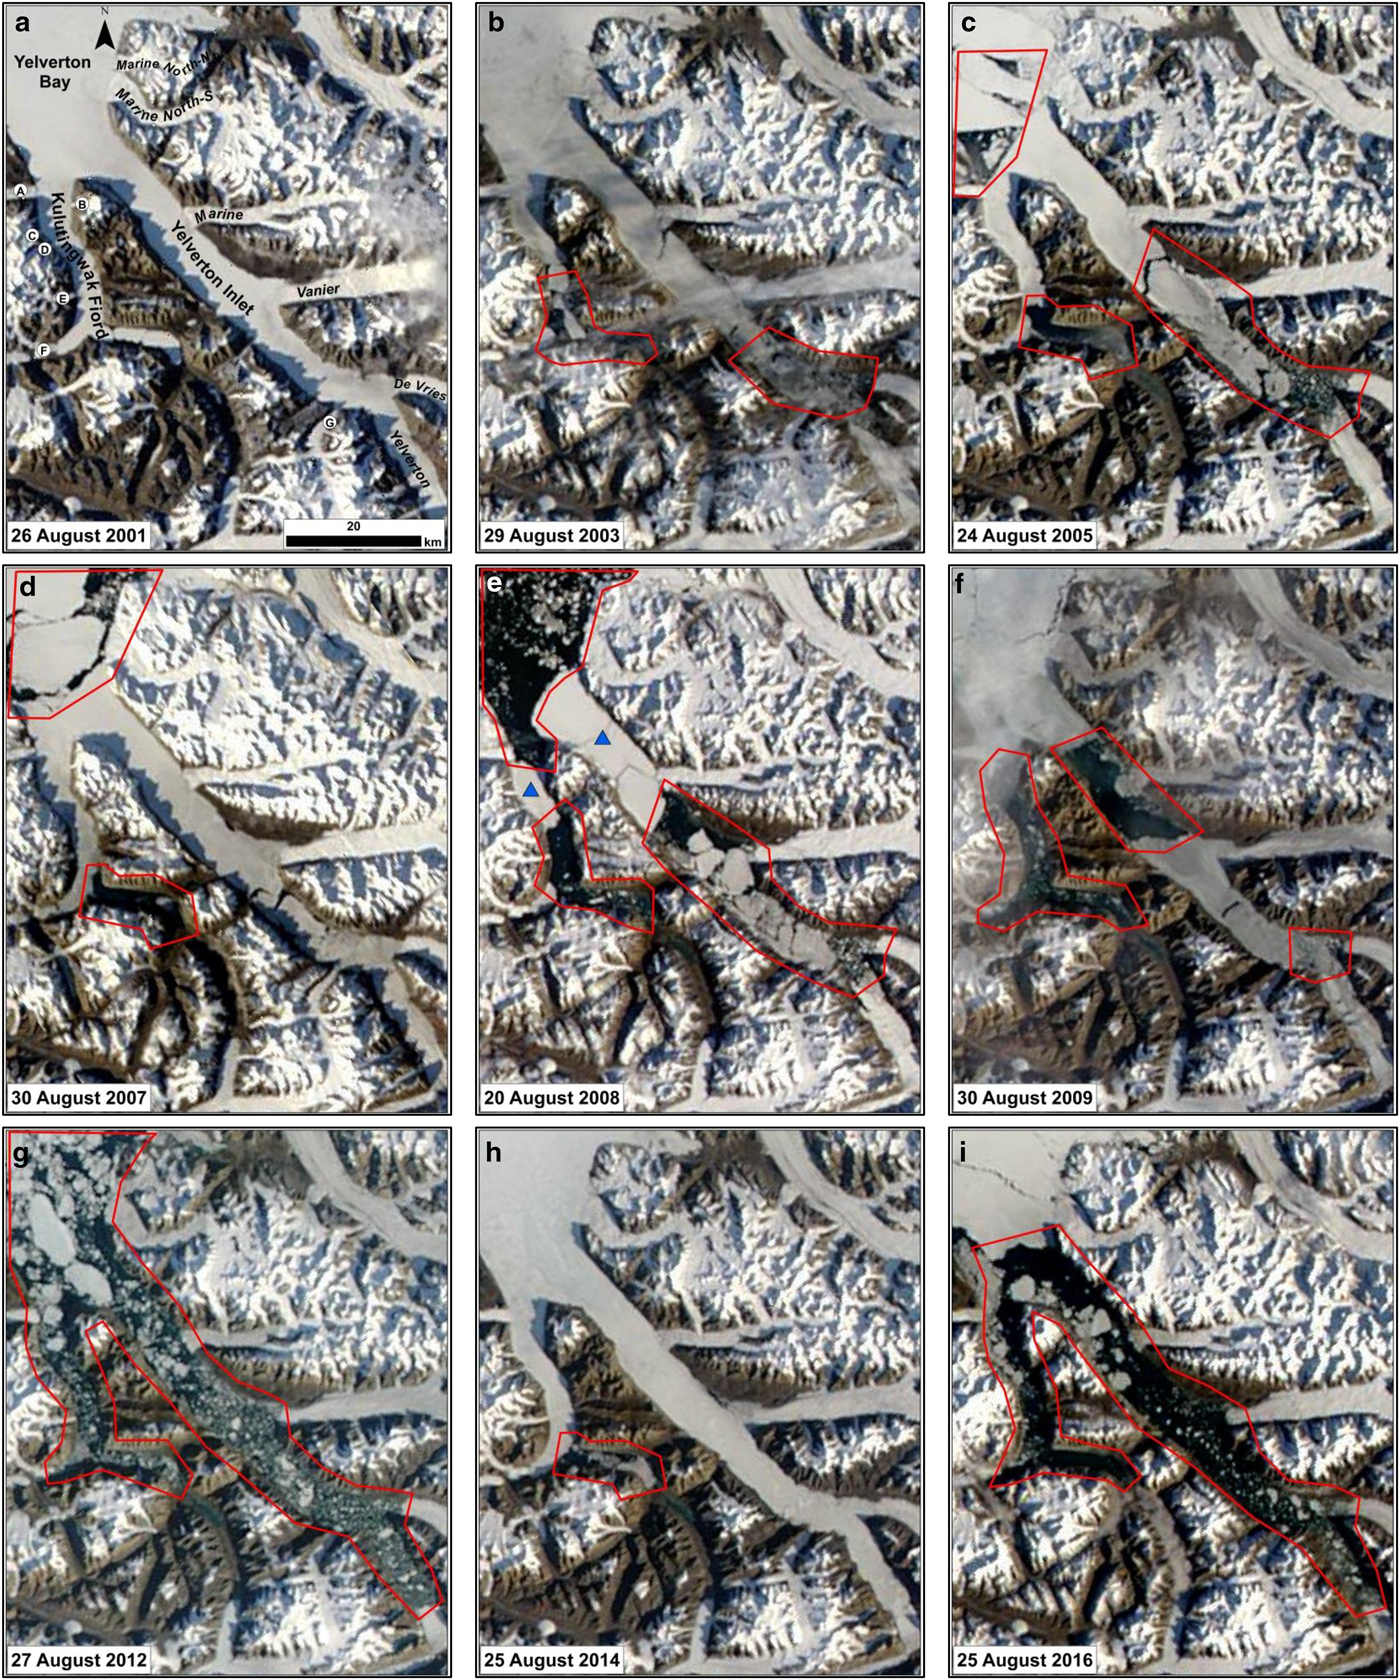
Fig. 7. Late summer MODIS Terra imagery of the Yelverton Bay region for selected years between 2001 and 2016, illustrating the distribution of open water. Red polygons indicate regions of open water and blue triangles in (e) show ice plugs that remained in 2008, but broke out in subsequent years. Place names indicated in panel (a).
4.2 Open water events
The summer MODIS imagery provides information concerning the progression of open water events in the Yelverton Bay region from 2000 to 2017 (Figs 3, 7). From 2000 to 2001, there was no evidence for open water throughout any part of the study region (Figs 3, 7a). However, in 2002 sea ice was replaced by open water at the back (SE arm) of Kulutingwak Fiord and the back of Yelverton Inlet (Fig. 3). By 2003, the areas of open water in the previous year again occurred in similar locations, with the addition of the area in the south-west of Kulutingwak Fiord (Fig. 7b). There was no open water in any of the cloud-free MODIS imagery in 2004, but in 2005 open water was shared across the entire southern half of Yelverton Inlet, the southeast arm at the back of Kulutingwak Fiord and Yelverton Bay (Fig. 7c). In 2006 and 2007 there was generally little open water, except for the southeast arm at the back of Kulutingwak Fiord and Yelverton Bay in 2007 (Fig. 7d).
Summer 2008 marked the first year of widespread open water in the MODIS record, with the only sea ice that remained during this season occurring in the northern half of Kulutingwak Fiord and Yelverton Inlet (Fig. 7e). The sea ice that remained in 2008 appeared to act as a plug, preventing ice from escaping from these waterways into Yelverton Bay. There were some limited areas of open water in 2009 (Figs 3, 7f), but from 2010 to 2012 open water was extensive and penetrated further toward Yelverton Glacier, replacing areas once occupied by the ice tongue (Fig. 7g). Between 2013 and 2017 most open water was restricted to the southerly parts of Kulutingwak Fiord and Yelverton Inlet, except for 2016 when there was widespread open water in areas outside of Yelverton Bay (Figs 7h, i). Overall, there was far more extensive open water over the past decade than in the years before it, with widespread open water in 2008, 2010, 2011, 2012 and 2016 (Fig. 3).
4.3 Links between sea-ice loss and glacier calving
Analysis of changes to ice types and frequency of open water between 1999 and 2017 reveals a strong link between the breakout of sea ice (open water events) and the loss of sikussak/mélange and ice tongues. The timing and nature of this relationship differed somewhat between regions, so each region is described separately below.
4.3.1 Yelverton Bay
In Yelverton Bay, Marine Glacier North-N and Marine Glacier North-S both had ice tongues extending 1.5 and 2.4 km (along their centerlines) away from their grounding lines in 1959, with a total combined area of 7.23 km2 (Figs 1, 8a; Table 3). These ice tongues were both surrounded by sikussak which was bounded by MLSI. In August 2005 open water occurred across Yelverton Bay (Fig. 7c), which likely caused the ice tongues to collapse and the sikussak to be replaced with mélange, as seen by 2007 (Fig. 8d). This collapse resulted in Marine Glacier North-N and Marine Glacier North-S losing 87.7% (2.80 km2) and 79.2% (6.08 km2) of their 1999 ice tongue areas. From 30 August 2007 to about 12 September 2007, open water occurred in Yelverton Bay which allowed the mélange to drift away from the glaciers and become replaced by sea ice. By August 2008 the glaciers had retreated to their grounding line, where they have remained in a quasi-stable position up to the present day, typically varying by <0.7 km2 between years (Figs 8e, f; Table 3).
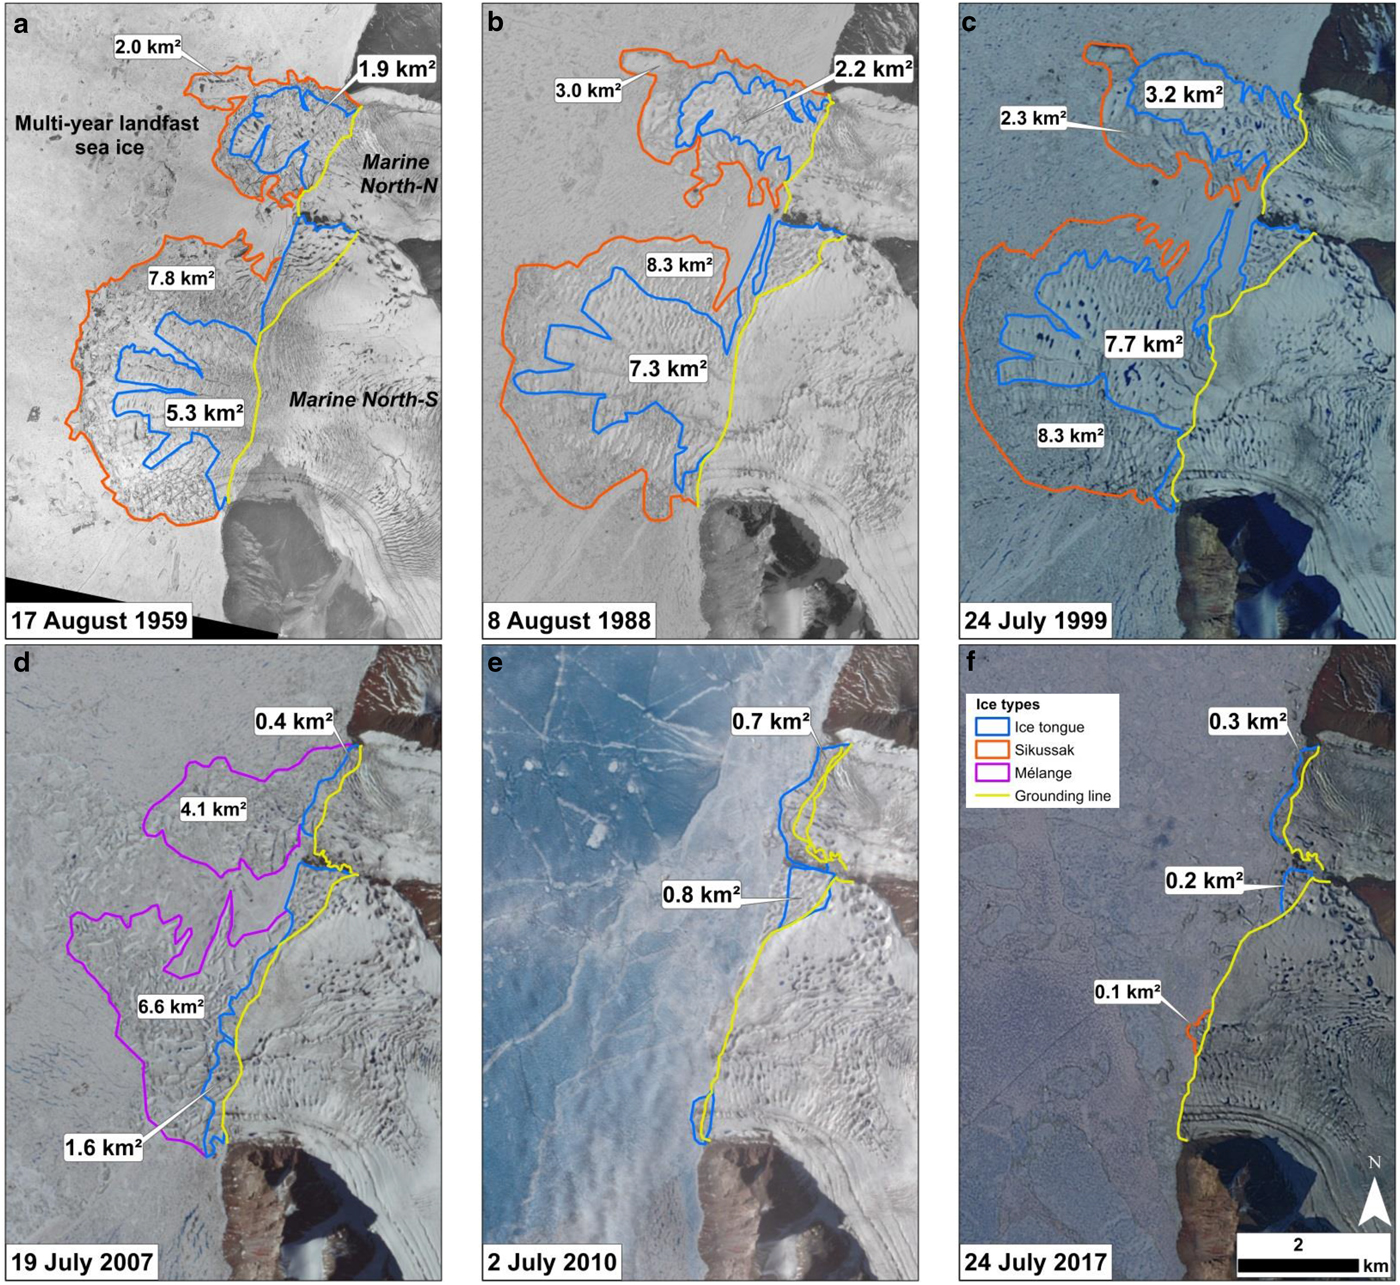
Fig. 8. (a, b, c) Progression of ice tongue loss at Marine Glacier North-N and Marine Glacier North-S between 1959 and 1999 when the floating ice tongues were intact and abutted by sikussak and multi-year sea ice; (d) ice tongues break apart from both glaciers in 2007 and a mélange forms at the ice fronts; (e) both glaciers are stable in 2010 and (f) both glaciers have retreated by 2017. See Table 2 for image details.
4.3.2 Yelverton Inlet
The loss of sea ice from Yelverton Inlet occurred in stages. While Marine and Vanier glaciers are both located in the central part of Yelverton Inlet, the loss of sea ice surrounding their sikussak zones occurred at different times (Fig. 1). In 2005, the sea ice broke apart at the front of Vanier Glacier, which was followed by a 1.45 km2 (29.6%) decrease in the extent of the mélange and a 0.42 km2 (18.9%) loss in ice tongue area by 2007 (Fig. 1; Table 3). In 2008 open water occurred across the majority of Yelverton Inlet, causing Marine Glacier to lose 81% of its surrounding mélange, and Vanier Glacier to lose all of its remaining mélange (Figs 3, 7e). From 2008 to 2017 neither glacier experienced an ice tongue area change of >0.71 km2 at Vanier Glacier or >0.30 km2 at Marine Glacier, likely due to their lack of extension into the inlet and pinning by surrounding valley walls (Fig. 1).
In south Yelverton Inlet, the sea ice broke up in 2002, creating an open water environment at the front of De Vries Glacier and Glacier G (Fig. 3). This open water led to the complete loss of sikussak at both glaciers by 2003 (Fig. 1). In the years that followed, some mélange (0.36–0.64 km2) was recorded at the front of Glacier G in 2007, 2008, 2013 and 2014, but was removed in 2010 and 2016 when open water allowed it to drift away (Fig. 7i). Following open water conditions at De Vries Glacier in 2005, the ice tongue retreated, losing 0.43 km2 in area by 2007 (Figs 5d, 7c).
4.3.3 Kulutingwak Fiord
In 2008 the sea ice broke up at the front of Glacier A and Glacier B (Figs 3, 7e). By 2009 all sikussak and the majority of the ice tongue at Glacier A was lost (−2.85 km2; Fig. 1). Although there was already no ice tongue at Glacier B, the sikussak at the ice front reduced by 0.04 km2 between 2008 and 2009. In August 2010, when open water surrounded both termini, the remaining sikussak at the front of Glacier B drifted away, while the ice tongue at the front of Glacier A expanded slightly (by 0.29 km2) and remained stable through 2017 (Figs 1, 3; Table 4).
The break-up of sea ice occurred in south Kulutingwak Fiord in two stages; first at the back of the fiord in 2003, followed by the central portion of the fiord in 2009 (Figs 3, 7b, f). The open water in 2003 led to the complete loss of all sikussak (−0.52 km2) and the entire ice tongue (−0.05 km2) of Glacier E in 2004 (Fig. 7b). This open water event had little effect on Glacier F, which had undergone the greatest losses to its ice tongue and sikussak before 1999 (Fig. 1). Following the open water in the central portion of the fiord in 2009, Glacier C and Glacier D both lost 100% of their surrounding sikussak by 2010 (Fig. 1). The small ice tongue at the front of Glacier D in 1999 (0.03 km2) had shrunk back to its grounding line by 2010. Between 2013 and 2015, an ice tongue began to expand at Glacier D and contribute to the surrounding mélange, although this tongue disappeared again by 2017 (Fig. 1).
4.4 Ocean temperatures
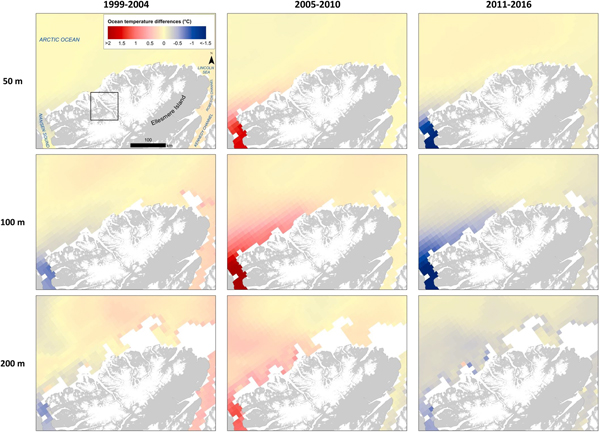
The TOPAZ4 Arctic Ocean Reanalysis data from the gridcell in the center of Yelverton Bay showed distinct patterns at 50, 100 and 200 m depths (Figs 9, 10b). Ocean temperatures at all three depths peaked in 2007, 2008 and 2009, with the mean annual temperature at 100 and 200 m depths reaching above 0°C. The highest increase occurred at 100 m depth, with an increase in mean temperature from −0.68°C between 1999 and 2005 to 1.07°C between 2006 and 2010. At 200 m depth, the mean temperature was 0.10°C between 1999 and 2005, which increased to 0.95°C between 2006 and 2010. The lowest increases occurred at 50 m depth, where mean annual ocean temperatures exceeded −1°C in 2008 and 2009. From 2011 to 2016, however, mean annual ocean temperatures for all depths combined dropped to −0.95°C, 0.28 °C cooler than the 1999–2005 levels.

Fig. 9. Difference in mean annual ocean temperature (from TOPAZ4 Arctic Ocean Reanalysis supplied by CMEMS) for the periods 1999–2004, 2005–2010 and 2011–2016, relative to the long-term mean (1999–2016), at standard depths of 50, 100 and 200 m. Study region is indicated by a black box in the first panel.

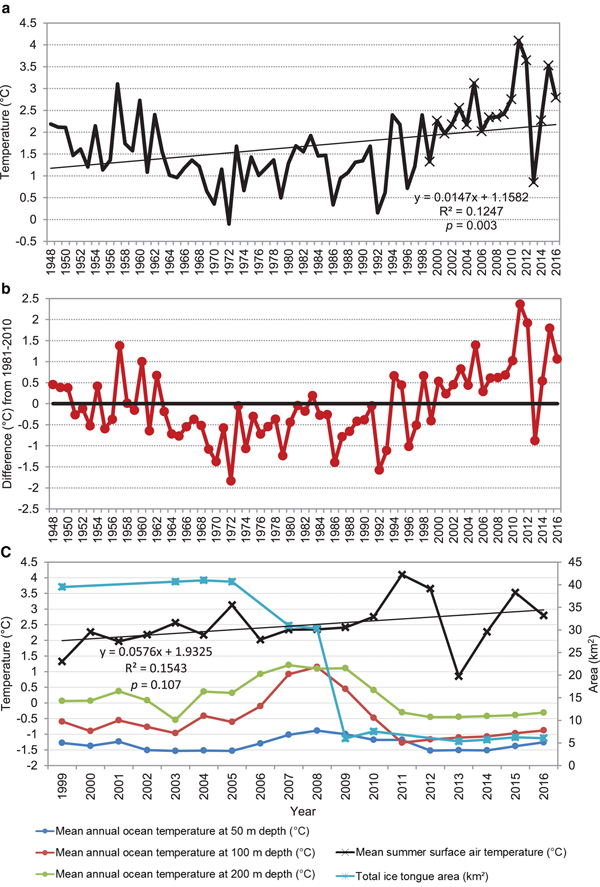
Fig. 10. (a) Time series of mean summer (June, July, August) surface air temperatures (1948–2017) derived from NCEP/NCAR Reanalysis. Markers represent the mean summer surface air temperatures plotted from 1999 to 2016 in panel (c); (b) air temperature anomalies (relative to 1981–2010 climatology) and (c) time series of mean summer surface air temperatures, sub-surface ocean temperatures at 50, 100 and 200 m depths (left axis), and total area of floating glacier tongues (right axis) within the Yelverton Bay region from 1999 to 2016. Ocean temperatures derived from TOPAZ4 Arctic Ocean Reanalysis supplied by CMEMS.
4.5 Air temperatures
NCEP/NCAR reanalysis shows that mean annual summer surface air temperatures in the study region increased by ~1.0°C (0.15°C decade−1) between 1948 and 2016 (R 2 = 0.1247, p = 0.003; Fig. 10a). The warmest summer on record occurred in 2011 when mean summer surface temperatures reached 4.10°C, followed by 3.65°C in 2012 and 3.52°C in 2015. Since the year 2000, mean summer surface temperatures have exceeded the long-term (1948–2017) mean of 1.68°C every year, except for 2013. In summer 2013 the mean temperature was 0.85°C, making it the 10th coldest summer on record.
5. DISCUSSION
Over the study period, we observed nearly the complete loss of ice tongues (>85% loss) from eight glaciers, with most losses occurring since the start of the 21st century. Between 1959 and 1999 the ice tongues saw generally mixed changes in extent (up to ±65%), with sikussak remaining present around most of them (Fig. 1). The main exceptions were Glacier C which lost all of its small tongue (0.06 km2), and De Vries Glacier, which lost an extensive area of sikussak (~70 km2) between 1959 and 1987 (Figs 1, 5a, b), which could have been produced during a historical surge event as Copland and others (Reference Copland, Sharp and Dowdeswell2003) classified it as a possible surge-type glacier due to the presence of looped moraines. Between 1999 and 2003, marine ice losses were dominated by decreases in the area of sikussak, by a total of 11.02 km2 along the front of several glaciers, where sikussak either disappeared or broke apart into a mélange (total mélange: 5.50 km2; Fig. 4; Table 3). From 2005 to 2010, sikussak losses accelerated (38.97 km2), and the entire ice tongue area decreased by 33.13 km2, including >90% of the ice tongue from Yelverton Glacier and Glacier D, and ≳80% of the ice tongue area from Marine North N, Marine North S and Glacier A (Fig. 4). The loss of sikussak, mélange and ice tongues from 2002 to 2010 occurred in tandem with open water events, which began to appear in isolated regions in 2002, became more common in 2005, and were widespread each summer from 2008 to 2012 (except for 2009; Fig. 3).
From 2010 to 2017 there was a limited recovery in total ice tongue area for some glaciers due to terminus advance, although these gains were more than offset by ice tongue losses at other glaciers, resulting in a net decrease in area of 1.75 km2 (Fig. 4; Tables 3, 4). These temporary gains could be linked to the unusually cold summer in 2013, when the mean summer temperature (−0.85°C) was 0.88°C below the 1981–2010 climatological mean (Fig. 10), resulting in a lack of open water and the presence of supportive sea ice adjacent to the glaciers in summers 2013 and 2014 (Figs 3, 7h).
From these observations, it is apparent that the majority of ice tongue losses occurred in tandem with the loss of adjacent sea ice, resulting in the loss of buttressing of glacier termini. Without the backpressure of sea ice, sikussak/mélange breaks-up, causing the ice tongue to destabilize and calve. When sea ice is replaced by open water, the sikussak or mélange can destabilize and cause the ice tongue to collapse in place, becoming a new mélange at the glacier front. If offshore winds accompany the open water, the free-floating icebergs and ice islands produced from the destabilized sikussak/mélange and ice tongue can move away from the glacier front, leaving behind sea ice with dispersed icebergs the following summer. For instance, in 2008, sea ice was replaced by open water near Yelverton Glacier causing the sikussak and majority of the ice tongue to collapse, forming a new mélange visible in summer 2009 that later dispersed following open water in August 2010 (Figs 6e, f). While this sea-ice buttressing mechanism has been widely documented for ice shelves and ice tongues in Greenland (Joughin and others, Reference Joughin2008; Amundson and others, Reference Amundson2010; Carr and others, Reference Carr, Stokes and Vieli2013; Reference Carr, Stokes and Vieli2017), Russia (Carr and others, Reference Carr, Stokes and Vieli2014) and Antarctica (Massom and others, Reference Massom2010; Miles and others, Reference Miles, Stokes and Jamieson2016; Reference Miles, Stokes and Jamieson2017), it has only previously been described for ice shelves on northern Ellesmere Island (Copland and others, Reference Copland, Mueller and Weir2007; White and others, Reference White, Copland, Mueller and Van Wychen2015).
5.1 Controls on MLSI stability in the Yelverton Bay region
Given the strong connection between the stability of ice tongues and surrounding MLSI in the Yelverton Bay region, the question remains of what has been the driver for MLSI losses there? The MLSI in Yelverton Bay originally formed in the 1950s, following the removal of a large ice shelf that occupied this area in the early 1900s (Koenig and others, Reference Koenig, Greenaway, Dunbar and Hattersley-Smith1952; Jeffries Reference Jeffries1987). Pope and others (Reference Pope, Copland and Mueller2012) report that the main region of MLSI in Yelverton Bay remained stable between 1950 and 2005 based on analyses of ice cores, ice thicknesses and the presence of matching features (e.g. large cracks, ice islands) from imagery over this period. The only variation in MLSI extent occurred along the seaward edge (advancing ~3–5 km into the Arctic Ocean), and at the far southern end of Yelverton Inlet and Kulutingwak Fiord where the sikussak in front of De Vries Glacier was lost between 1959 and 1987 (Fig. 5), and where open water was observed as early as 2002 and 2003 in the MODIS time series (e.g. Fig. 7b).
Starting in 2005 the MLSI broke-up in two stages which began with the removal of the youngest and thinnest ice at the back of Yelverton Inlet and Kulutingwak Fiord, followed by the older and thicker ice in Yelverton Bay. In the first week of August 2005, 330 km2 of the newer MLSI broke away from the outer portion of Yelverton Bay (Copland and others, Reference Copland, Mueller and Weir2007; Pope and others, Reference Pope, Copland and Mueller2012). This was followed by the loss of 690 km2 of the older MLSI in Yelverton Bay, together with ~8 km2 from the margin of the Petersen Ice Shelf and ~8 km2 from the margin of the Wootton Peninsula Ice Shelf, the two remaining ice shelves which flowed into Yelverton Bay at this time (Copland and others, Reference Copland, Mueller and Weir2007; Pope and others, Reference Pope, Copland and Mueller2012; White and others, Reference White, Copland, Mueller and Van Wychen2015). In spring 2008, ice core and thickness measurements confirmed the presence of FYI at the back of Yelverton Inlet and the last remaining old MLSI at the head of Yelverton Inlet and Kulutingwak Fiord (Pope and others, Reference Pope, Copland and Mueller2012). The remaining old MLSI in Kulutingwak Fiord broke out in August 2009, while the remaining old MLSI broke out of Yelverton Inlet in August 2010 (Pope and others, Reference Pope, Copland and Mueller2012).
The timing and patterns of these MLSI losses, together with losses from associated ice tongues, can provide insight into factors controlling these changes, with several potential factors at play. These are discussed further below.
5.1.1 Air temperatures
From 1948 to 2016 mean summer air temperatures increased by 0.15°C decade−1 (R 2 = 0.1247, p = 0.003) (Fig. 10a), but this rate may have accelerated to 0.58°C decade−1 (R 2 = 0.1543, p = 0.107) since 1999 (Fig. 10c). Over the 68 years there have been two periods (late 1940s to early 1960s, and late-1990s to 2016) of anomalously warm temperatures, with a particular cluster over the past decade (Fig. 10b). These periods of anomalously warm summer air temperatures and the overall warming from 1948 to 2016 likely contributed to the weakening of ice tongues (e.g. through thinning and potentially hydrofracturing) and MLSI in the Yelverton Bay region. There are no long-term mass balance measurements in our study region to confirm this directly, but modeling by Noël and others (Reference Noël2017) indicates that the average rate of mass loss across the northern CAA more than doubled between 1958–1996 (11.9 Gt a−1) and 1996–2015 (28.2 ± 11.5 Gt a−1). The recent period of anomalously high summer air temperatures in the Yelverton Bay region was punctuated by record-breaking conditions in 2005, when mean summer air temperatures reached 3.1°C (1.4°C above the climatological mean). This resulted in the widespread occurrence of surface meltwater pools visible in July Landsat imagery, and when combined with long-term thinning caused by long-term warming, likely had a crucial role in the largest break-out of MLSI from the Yelverton Bay region ever recorded (1020 km2; Pope and others, Reference Pope, Copland and Mueller2012).
Regarding the occurrence of open water observed at the back of Yelverton Inlet and Kulutingwak Fiord in some years before 2005 (e.g. Fig. 7b), this likely relates to local microclimatology. Field and remote sensing observations indicate that ocean-derived fog and associated cooler air temperatures are common at the seaward margin of Yelverton Bay (similar to the parallel Milne Fiord to the east; White, Reference White2019), with Pope and others (Reference Pope, Copland and Mueller2012) describing a trend of greater snow accumulation at the mouth of Yelverton Inlet due to its proximity to the Arctic Ocean which acts as a moisture source. This is reflected in spatial gradients in sea-ice thickness, which ranged from 3.71 m at the mouth of Yelverton Inlet to 1.19 m at the central (inland) part of Yelverton Inlet in spring 2008 (Pope and others, Reference Pope, Copland and Mueller2012). The thinner ice with less snow cover at the back of Yelverton Inlet, together with warmer air temperatures, could, therefore, be lost more quickly due to atmospheric forcing. The open water may also be linked to subglacial discharge from the glaciers within this area (i.e. Yelverton and De Vries), which provides a source of buoyancy that drives convective motion at the glacier front that can break-up sea ice and move it away from the glacier termini (Jenkins, Reference Jenkins2011). While there is limited data regarding subglacial processes in this region, field observations during a helicopter survey in July 2015 showed extensive upwelling of sediment-laden water from the front of Yelverton Glacier.
5.1.2 Sea-ice convergence/divergence
The most negative glacier mass balance years between 2005 and 2012, including each summer between 2007 and 2012, have been characterized by frequent summer anticyclonic circulation over the CAA and West Greenland (Bezeau and others, Reference Bezeau, Sharp and Gascon2015). Described by Alt (Reference Alt1979, Reference Alt1987) as synoptic type III (termed Island Circulation), this pattern brings clear, warm weather coupled with southerly wind flow, resulting in more melting degree days and divergence of sea ice from the northern coast of the CAA. Furthermore, well-developed mid-latitude frontal systems lead to strong winds in the Queen Elizabeth Islands and rapid wind reversals (Pope and others, Reference Pope, Copland, Alt, Copland and Mueller2017). Kwok (Reference Kwok2015) also reported divergence across the Arctic Ocean in 2011 and negligible convergence in summer 2012, which would have increased the amount of open water along the northern coast of Ellesmere Island. This combination of high air temperatures and strong winds played an important role in repeatedly destabilizing the Nansen and Sverdrup Ice Plugs (Pope and others, Reference Pope, Copland, Alt, Copland and Mueller2017), and most likely facilitated the breakup of the MLSI and recovering landfast ice in the Yelverton Bay region between 2005 and 2012. For instance, Copland and others (Reference Copland, Mueller and Weir2007) reported that unusually persistent and strong offshore winds (up to 90 km h−1) in the first two weeks of August 2005 resulted in a large offshore lead and the associated removal of MLSI and the Ayles Ice Shelf from the northern coast of Ellesmere Island. The role of winds on MLSI removal has also been observed in the past, when persistent offshore winds (lasting four days) with speeds up to 10 m s−1 led to the detachment of the Milne Re-Entrant in February 1988 (Sackinger and others, Reference Sackinger, Jeffries, Li and Lu1991).
5.1.3 Oceanic forcing
It is unlikely that change in mid-depth ocean temperatures will affect sea ice, but glacier termini with deep grounding lines are susceptible to melt. The degree of oceanic control on glacier retreat will depend on the ice thickness, water depth and thermal forcing along the glacier terminus. NASA Operation IceBridge measured ice thicknesses across the termini of six glaciers in the Yelverton Bay region on 01 April 2014, using the airborne Multichannel Coherent Radar Depth Sounder (MCoRDS; Leuschen and others, Reference Leuschen, Gogineni, Rodriguez-Morales, Paden and Allen2010). These were verified against single point measurements at the center of the terminus of Marine, Vanier, De Vries and Yelverton glaciers, made with a 10 MHz ground penetrating radar system during a field campaign on 18 July 2014. Together, these measurements reveal centerline near-terminus thicknesses of up to ~150 m at Marine and Marine North-N glaciers, ~200 m at Marine North-S, Vanier and De Vries Glaciers and ~250 m at Yelverton Glacier. Based on these ice thicknesses, the increase in mean ocean temperatures to depths of 200 m from 2006 to 2010 are likely to have impacted the stability of these ice tongues. For example, when 20–60 m ocean temperatures at the front of four glaciers in Svalbard reached >0°C, there was a strong and linear relationship between increasing ocean temperature and frontal ablation (Luckman and others, Reference Luckman2015). The warmer ocean temperatures are thought to encourage submarine melt, leading to undercutting and eventual collapse.
Recent studies also suggest that oceanic warming has been a primary driver of thinning and mass loss at floating tongues such as Jakobshavn Isbrae in west Greenland (Thomas and others, Reference Thomas, Abdalati, Frederick and Krabill2003; Holland and others, Reference Holland, Thomas, De Young, Ribergaard and Lyberth2008; Motyka and others, Reference Motyka2011). Thinning due to submarine melting averaged 228 ± 49 m a−1 between 1984 and 1985, due to the circulation of warm seawater with a thermal forcing up to 4.2°C (Motyka and others, Reference Motyka2011). The rate of basal melt along its 15 km long floating tongue later increased by ~25%, following a 1.1°C warming of ocean water in the fiord after 1997, which is thought to have led to its destabilization (Motyka and others, Reference Motyka2011). According to the TOPAZ4 dataset, only 100 and 200 m ocean depths had mean annual temperatures of >0°C between ~2004 and 2010, but most of the larger glaciers in the Yelverton Bay region would have felt these changes due to the ice thicknesses at their grounding lines of up to 250 m, resulting in their increased basal melt and undercutting. Assuming a salinity of 32 psu (measured from 2011 to 2015 in nearby Milne Fiord; Hamilton, Reference Hamilton2016) in Yelverton Inlet, the pressure melting point at the base of 150 to 250 m thick glaciers would be −1.85 to −1.92°C, respectively. The maximum thermal forcing would therefore be 3.0°C for 150 m thick glaciers in 2008 and 3.1°C for glaciers ⩾200 m thick in 2007 (>1°C less than the maximum thermal forcing linked to thinning at Jakobshavn Isbrae; Motyka and others, Reference Motyka2011).
6. SUMMARY AND CONCLUSIONS
The northern coast of Ellesmere Island is unique because it contains the only region with marine-terminating glaciers with ice tongues in the CAA, which drain a significant area of the Northern Ellesmere Icefield and a neighboring ice cap (White and Copland, Reference White and Copland2018). This study conducted the first detailed analysis of changes to these ice tongues in relation to proglacial conditions since 1959, oceanographic factors since 1999 and atmospheric factors since 1948. Overall, the ice tongues have dramatically shrunk and have retreated to their grounding lines recently, particularly since 2005 (Fig. 4). Except for surge-type De Vries Glacier, most ice tongues were relatively stable between 1959 and 1999, when the tongues and surrounding sikussak were held in place by MLSI that had been in place for decades (Pope and others, Reference Pope, Copland and Mueller2012). This semi-permanent configuration remained until ~2005 when MLSI began to breakout of Yelverton Bay, a catalyst for the rapid changes that followed. Anomalously high summer temperatures and strong, offshore winds led to the loss of MLSI (Pope and others, Reference Pope, Copland and Mueller2012). The loss of supporting MLSI from within our study region began a cascade of changes that led to the break-up of the sikussak and ice tongues. The replacement of MLSI throughout the Yelverton Bay region with FYI, in combination with longer melt seasons, resulted in sea ice that was more easily destabilized the following summer, facilitating a positive feedback loop that allowed open water to continue in later years (Howell and others, Reference Howell, Duguay and Markus2009; Figs 3, 9, 10b).
Unlike ice shelves that take hundreds of years to form, tidewater glaciers need only to advance to replenish their ice tongues (Mueller and others, Reference Dowdeswell, Jeffries, Copland and Mueller2017). However, it is unlikely that the ice tongues in the Yelverton Bay region will be able to recuperate in the future. The recovery and re-stabilization of these ice tongues are dependent on the sustained presence and back-stress provided by MLSI, which is unlikely to re-form as a long-term feature under current and future climate change. Further research is necessary to examine the role of sub-surface ocean temperatures along the bays and fiords in areas such as Northern Ellesmere Island, along with the resulting changes in glacier fronts and proglacial environments.
ACKNOWLEDGEMENTS
This work was funded by grants from the Natural Sciences and Engineering Research Council (NSERC) of Canada, Canada Foundation for Innovation, Ontario Research Fund, Polar Continental Shelf Program, the Royal Canadian Geographical Society, ArcticNet, a Network of Centres of Excellence of Canada and the University of Ottawa. We are grateful to the Geographic, Statistical and Government Information Centre at the University of Ottawa library for assistance with purchase of the SPOT imagery. Adrienne White was supported by graduate scholarships from NSERC, the Ontario Graduate Scholarship, the Association of Canadian Universities for Northern Studies, the W. Garfield Weston Foundation and awards from the Northern Scientific Training Program. We thank the Associate Chief Editor, Scientific Editor and two anonymous reviewers for comments which helped improve this work.


 Open access