

Introduction
Workplace exclusion – subtle acts like being left out of conversations, ignored in meetings, or overlooked for recognition – remains a widespread yet often invisible threat to employee well-being. While less overt than discrimination or harassment, exclusion is deeply damaging: recent reports indicate that 31% of US employees felt marginalized at work in the past 5 years, and 55% of them considered leaving as a result (Traliant, 2025). Globally, 75% of workers report having experienced exclusion (Noel, Reference Noel2024), contributing to disengagement, burnout, and attrition. The financial implications are staggering: US companies lose over $1 trillion annually due to turnover and lost productivity tied to non-inclusive cultures (Heinz, Reference Heinz2024; Kratz, Reference Kratz2023). These patterns reflect a growing consensus that subtle relational threats can disrupt employee motivation and retention just as powerfully as formal organizational injustice.
While prior research has focused on workplace ostracism and its link to turnover intention (TOI; Ferris, Brown, Berry, & Lian, Reference Ferris, Brown, Berry and Lian2008; Zimmerman, Carter-Sowell, & Xu, Reference Zimmerman, Carter-Sowell and Xu2016), theoretical frameworks like self-determination theory (SDT) help explain why exclusion is so damaging – namely, because it thwarts employees’ basic psychological needs for autonomy, competence, and relatedness (Deci & Ryan, Reference Deci and Ryan2000). Yet exclusion in modern workplaces often involves not only these needs, but also social evaluations of fairness, status, and uncertainty – dimensions not fully addressed in SDT. The SCARF model (Rock, Reference Rock2008) extends motivational theory by introducing five social domains – Status, Certainty, Autonomy, Relatedness, and Fairness – that influence perceived psychological safety. Despite its increasing popularity in leadership and coaching, empirical research on SCARF mechanisms in organizational contexts remains limited (Campbell et al., Reference Campbell, Walsh, Prior, Doherty, Bramble, Marlow and Maxwell2022). This gap leaves important questions unanswered about how exclusion disrupts motivation and triggers turnover in real-world work settings.
This study addresses that gap by integrating SCARF with SDT to explore how exclusionary behaviors (EBs) influence TOI through disruptions across the five SCARF domains. We test this model using a two-wave survey of full-time US employees (N = 277) and structural equation modeling. Our research question is: To what extent do SCARF-based psychological needs mediate the relationship between EBs and TOI among employees? In doing so, we make several contributions: (1) we provide one of the first empirical tests of SCARF as a motivational mechanism in workplace mistreatment; (2) we advance theory by demonstrating how psychological needs beyond autonomy, competence, and relatedness shape withdrawal; and (3) we offer practical guidance for building inclusive and psychologically safe workplaces by identifying which needs are most vulnerable to exclusion.
Literature review
Theoretical framework: social determination theory
SDT, developed by Deci and Ryan, is a widely applied macro theory of human motivation that explains how fulfilling three basic psychological needs – autonomy, competence, and relatedness – leads to optimal functioning, well-being, and sustained motivation (Deci, Olafsen, & Ryan, Reference Deci, Olafsen and Ryan2017). In workplace contexts, SDT offers a powerful framework for understanding how employee motivation and organizational outcomes are shaped by internal psychological states. By focusing on internal drivers rather than external rewards alone, SDT emphasizes the importance of nurturing environments that support intrinsic engagement.
Autonomy refers to the experience of volition and self-direction (Deci & Ryan, Reference Deci and Ryan2000). Employees feel autonomous when their work aligns with personal values and they have opportunities for choice and initiative (Deci et al., Reference Deci, Olafsen and Ryan2017). Autonomy-supportive environments – those that minimize control and encourage self-initiation – have consistently been linked to greater employee engagement, satisfaction, and psychological functioning (Deci & Ryan, Reference Deci and Ryan2008; Slemp, Kern, & Vella-Brodrick, Reference Slemp, Kern and Vella-Brodrick2015).
Competence involves the perception of effectiveness and mastery Deci and Ryan (Reference Deci and Ryan2000). Employees experience competence when they receive constructive feedback, opportunities for growth, and tasks that are appropriately challenging (Deci et al., Reference Deci, Olafsen and Ryan2017). When supported, this need enhances confidence, motivation, and task performance (Coccia, Reference Coccia and Farazmand2019).
Relatedness reflects the need to feel connected, supported, and valued by others (Deci & Ryan, Reference Deci and Ryan2000). In organizational settings, this need is fulfilled through positive coworker relationships, team cohesion, and alignment with shared goals (Deci et al., Reference Deci, Olafsen and Ryan2017). Satisfying relatedness fosters greater organizational commitment and contributes to emotional resilience at work (Autin, Herdt, Garcia, & Ezema, Reference Autin, Herdt, Garcia and Ezema2022).
SDT also links need satisfaction with perceptions of meaningful work. Employees who experience autonomy and relatedness tend to internalize their roles more deeply, enhancing engagement and retention (Autin et al., Reference Autin, Herdt, Garcia and Ezema2022). Furthermore, autonomy-supportive climates have been found to promote sustainable performance while reducing the likelihood of turnover (Deci et al., Reference Deci, Olafsen and Ryan2017; Slemp et al., Reference Slemp, Kern and Vella-Brodrick2015).
Exclusionary behaviors
EBs in the workplace are subtle yet damaging forms of interpersonal mistreatment that undermine employee well-being, motivation, and cohesion (Martin & Hine, Reference Martin and Hine2005). These behaviors are commonly conceptualized as workplace ostracism – experiences of being ignored, excluded, or dismissed in social and professional contexts (Harvey, Moeller, Kiessling, & Dabic, Reference Harvey, Moeller, Kiessling and Dabic2019). Unlike overt aggression, ostracism communicates rejection through silence, omission, or social avoidance. Even in its mildest forms – such as being left out of meetings or overlooked in conversations – it signals to employees that they are undervalued or unwelcome (Howard, Cogswell, & Smith, Reference Howard, Cogswell and Smith2020). Because these behaviors often lack clear intent or tangible evidence, they are difficult to confront or report, making them especially corrosive (Zimmerman et al., Reference Zimmerman, Carter-Sowell and Xu2016).
SDT helps illuminate why exclusion is so psychologically damaging: it frustrates the core needs of relatedness, competence, and autonomy (Deci & Ryan, Reference Deci and Ryan2000). When employees are excluded, they receive signals that they do not belong (relatedness), that their contributions lack value (competence), and that they have little control over their social environment (autonomy). As Wu et al. (Reference Wu, Qu, Zhang, Hao, Tang, Zhao and Si2019) found, newcomers who experienced ostracism reported lower satisfaction of all three needs, leading to suppressed voice behavior and diminished motivation. Similarly, Luo, Li, Gong, Zhang, and Wang (Reference Luo, Li, Gong, Zhang and Wang2022) demonstrated that exclusion-induced need frustration predicted deviant workplace behavior, consistent with SDT’s view that need thwarting leads to controlled, maladaptive motivation.
The downstream consequences of exclusion are profound. Studies have linked workplace ostracism to burnout, reduced job satisfaction, impaired performance, and increased TOI, especially in vulnerable populations such as early-career professionals, minority employees, and newcomers (Howard et al., Reference Howard, Cogswell and Smith2020; Sharma, Aplin-Houtz, Willey, & Merrit, Reference Sharma, Aplin-Houtz, Willey and Merrit2025). These findings underscore the motivational disruption caused by EB, which shifts employees from autonomous motivation – driven by volition and personal significance – to controlled motivation, characterized by compliance, emotional exhaustion, and withdrawal (Olafsen & Deci, Reference Olafsen and Deci2020).
Importantly, these outcomes are not inevitable. Environments that support autonomy, competence, and relatedness can buffer the psychological damage of exclusion and restore motivational resources. As McAnally and Hagger (Reference McAnally and Hagger2024) show, fulfillment of these needs is consistently associated with higher engagement, job satisfaction, and retention. Specifically, positive coworker relationships can mitigate the effects of exclusion by providing alternative sources of belonging and social validation (Spector, Reference Spector2022). Moreover, resilient employees may be better equipped to cope with social threats, reducing the downstream effects of exclusion on disengagement (Smith et al., Reference Smith, Dalen, Wiggins, Tooley, Christopher and Bernard2008). Therefore, understanding and mitigating the impact of EBs requires an SDT-informed approach prioritizing psychological sustainability through inclusive, need-supportive practices.
SCARF model as psychological need disruption
The SCARF model – Status, Certainty, Autonomy, Relatedness, and Fairness – identifies five social domains that activate reward or threat responses in the brain (Rock, Reference Rock2008). When these domains are supported, individuals experience psychological safety and engagement. When threatened – such as through EBs – they trigger stress responses and motivational disengagement. Although rooted in neuroscience, SCARF aligns closely with SDT, which emphasizes the core psychological needs of autonomy, competence, and relatedness (Deci & Ryan, Reference Deci and Ryan2000). Each SCARF domain maps onto these needs: Autonomy reflects autonomy; Status and Certainty map onto competence; Relatedness is directly shared; and Fairness supports all three (Aplin-Houtz, Munoz, Fergurson, Fleming, & Miller, Reference Aplin-Houtz, Munoz, Fergurson, Fleming and Miller2023; Javadizadeh, Aplin-Houtz, & Casile, Reference Javadizadeh, Aplin-Houtz and Casile2022).
Status
Status refers to the perception of one’s social value or importance within a group or organization and has been shown to be significantly affected by exclusionary experiences in the workplace, which reduce individuals’ perceived worth and professional identity (Hitlan, Cliffton, & DeSoto, Reference Hitlan, Cliffton and DeSoto2006). From a neuroscience lens, status is neurologically encoded as a primary reward signal – experiences of increased status activate brain regions associated with pleasure and motivation, whereas status threats activate threat detection systems, including the dorsal anterior cingulate cortex (Rock, Reference Rock2008). Status threats – defined as experiences that signal a diminished social standing or value within a group – elicit neurological stress responses and reduce motivation by activating systems linked to social pain and vigilance (Marlier, Reference Marlier2016). These mechanisms help explain why individuals in both educational and workplace contexts often respond to status threats with defensive behaviors such as withdrawal, overcompensation, or impression management, especially when exclusion or stereotyping signals devaluation (Hitlan et al., Reference Hitlan, Cliffton and DeSoto2006).
Within SDT, status aligns closely with the need for competence: the desire to feel effective and capable (Aplin-Houtz et al., Reference Aplin-Houtz, Munoz, Fergurson, Fleming and Miller2023; Javadizadeh et al., Reference Javadizadeh, Aplin-Houtz and Casile2022). EBs threaten perceived status – defined as an individual’s recognition and value within their social or organizational group – and, by extension, undermine the psychological need for competence by diminishing feelings of capability and effectiveness (Scott, Zagenczyk, Schippers, Purvis, & Cruz, Reference Scott, Zagenczyk, Schippers, Purvis and Cruz2014).
External affirmation – such as feedback, recognition, and peer validation – is often essential for recovering from status threats and restoring motivation (Ryan & Deci, Reference Ryan and Deci2000). Research from both educational and workplace settings supports this dynamic: affirming status boosts engagement and achievement, while status threats contribute to withdrawal, conflict, and reduced creativity (Aplin-Houtz et al., Reference Aplin-Houtz, Munoz, Fergurson, Fleming and Miller2023; Javadizadeh et al., Reference Javadizadeh, Aplin-Houtz and Casile2022; Manjaly, Francis, & Francis, Reference Manjaly, Francis and Francis2024).
Despite contextual differences, the underlying link between status and competence remains consistent across domains. Threats to perceived status undermine psychological safety and motivation, reinforcing the importance of inclusive practices that support employees’ social values and professional worth.
Hypothesis 1a: A high perception of EBs in the workplace will negatively relate to the perception of one’s status.
Certainty
Certainty refers to the perception of clarity, predictability, and stability in one’s environment (Javadizadeh et al., Reference Javadizadeh, Aplin-Houtz and Casile2022). Within SCARF, it reflects how much individuals can anticipate outcomes and understand how their behaviors will be evaluated (Rock, Reference Rock2008).
Under SDT, certainty most closely aligns with the psychological need for competence – the sense of efficacy and the ability to produce desired outcomes (Deci & Ryan, Reference Deci and Ryan1985; Javadizadeh et al., Reference Javadizadeh, Aplin-Houtz and Casile2022). Research also shows that unpredictable or opaque work environments undermine employee engagement, confidence, and performance (Manganelli, Thibault-Landry, Forest, & Carpentier, Reference Manganelli, Thibault-Landry, Forest and Carpentier2018). Such exclusionary practices – like withholding information, omitting individuals from meetings, or failing to communicate role expectations – diminish employees’ clarity and disrupt their motivational regulation (Manjaly et al., Reference Manjaly, Francis and Francis2024; Sharma et al., Reference Sharma, Aplin-Houtz, Willey and Merrit2025). In addition, organizational opacity regarding promotions, compensation, and decision-making procedures further compounds this issue (Hansen, Hansen, & Madsen, Reference Hansen, Hansen and Madsen2022).
Together, these findings suggest that EBs can erode certainty by impairing clarity, transparency, and feedback loops. Such disruptions undermine employees’ sense of mastery and perceived control, ultimately frustrating the need for competence and increasing disengagement.
Hypothesis 1b: A high perception of EBs in the workplace will negatively relate to the perception of one’s certainty.
Autonomy
Autonomy refers to the perception that one has control over their behavior, choices, and work environment (Deci & Ryan, Reference Deci and Ryan2000). It is a foundational component of SDT and is explicitly represented in the SCARF model (Deci & Ryan, Reference Deci and Ryan2017; Rock, Reference Rock2008). Neurologically, perceived autonomy is associated with the activation of reward-related brain regions and a reduction in threat responses, supporting psychological safety and intrinsic motivation (Rock, Reference Rock2008).
In the workplace, autonomy is threatened when employees are excluded from decision-making, denied input into task execution, or micromanaged. These EBs function as forms of interpersonal control, leading to perceived status threat and diminished volitional engagement (Trépanier, Boudrias, & Peterson, Reference Trépanier, Boudrias and Peterson2019). Exclusionary practices such as being left out of meetings, receiving top-down directives without consultation, or lacking flexibility in work methods have been shown to diminish autonomy and increase stress (Howard et al., Reference Howard, Cogswell and Smith2020) and motivation shifts from autonomous to controlled, reducing performance and increasing TOI (Manganelli et al., Reference Manganelli, Thibault-Landry, Forest and Carpentier2018).
Recent studies affirm that autonomy-supportive leadership protects against the detrimental effects of workplace exclusion (Howard et al., Reference Howard, Cogswell and Smith2020; Sharma et al., Reference Sharma, Aplin-Houtz, Willey and Merrit2025). Employees who retain a sense of control and self-direction are better equipped to regulate emotions, maintain purpose, and recover from exclusionary stressors (Deci et al., Reference Deci, Olafsen and Ryan2017).
Hypothesis 1c: A high perception of EBs in the workplace will negatively relate to the perception of one’s autonomy.
Relatedness
Relatedness reflects the fundamental human need to feel connected, cared for, and part of a social group (Deci & Ryan, Reference Deci and Ryan2017). Within both SCARF and SDT frameworks, this need is viewed as essential to motivation and psychological well-being (Deci & Ryan, Reference Deci and Ryan2000). In workplace contexts, EBs directly frustrate the need for relatedness, undermine employees’ emotional security, and reduce motivation, as individuals interpret exclusion as organizational rejection (Freedman, Reference Freedman2019; McGregor & Bergmann, Reference McGregor and Bergmann2022).
SDT maintains that relatedness satisfaction enhances internalization of organizational values and strengthens engagement (Deci & Ryan, Reference Deci and Ryan2000). When this need is unmet, employees are more likely to exhibit controlled forms of motivation or disengage altogether. Relatedness-supportive practices – such as peer mentorship, collaborative decision-making, and team-building rituals – help restore a sense of belonging and act as buffers against exclusion’s psychological toll (Freedman, Reference Freedman2019).
Hypothesis 1d: A high perception of EBs in the workplace will negatively relate to the perception of relatedness.
Fairness
Fairness, as conceptualized in the SCARF model, refers to the perception that social exchanges and organizational systems are impartial, just, and equitable (Rock, Reference Rock2008). Within SDT, fairness is not a separate psychological need but maps across the three foundational needs of autonomy, competence, and relatedness. Fairness is thought to support all three simultaneously by fostering conditions of trust, control, and respect. Aplin-Houtz et al. (Reference Aplin-Houtz, Munoz, Fergurson, Fleming and Miller2023) and Javadizadeh et al. (Reference Javadizadeh, Aplin-Houtz and Casile2022) argue that fairness acts as an overarching climate variable that sustains or frustrates basic psychological need satisfaction depending on its presence. For example, procedural fairness can reinforce autonomy (Chou, Nguyen, Ramser, & Chang, Reference Chou, Nguyen, Ramser and Chang2022), distributive fairness aligns with competence (Chou et al., Reference Chou, Nguyen, Ramser and Chang2022), and interpersonal fairness supports relatedness (Slemp, Lee, & Mossman, Reference Slemp, Lee and Mossman2021), making it a critical contextual moderator of motivational sustainability. Perceived injustice in any of these domains can erode motivation, reduce psychological safety, and compromise well-being (Ryan & Deci, Reference Ryan and Deci2000).
Although fairness is not a core psychological need in SDT, recent studies have framed it as indirectly relevant to motivation. For example, Aplin-Houtz et al. (Reference Aplin-Houtz, Munoz, Fergurson, Fleming and Miller2023) and Javadizadeh et al. (Reference Javadizadeh, Aplin-Houtz and Casile2022) both use SDT as a guiding lens and incorporate fairness as a component influencing need satisfaction and engagement. These studies support the conceptual alignment of SCARF and SDT, suggesting SCARF can be viewed as a complementary extension.
In the workplace, fairness is most often examined through the lens of organizational justice, which includes distributive (fairness of outcomes), procedural (fairness of decision-making processes), interpersonal (respectful treatment), and informational (transparency of communication) justice (Colquitt, Reference Colquitt2001).
Recent findings emphasize how exclusion amplifies perceptions of injustice. In particular, remote and hybrid workers who lack access to informal knowledge networks or timely managerial communication often report lower perceptions of informational justice, which in turn reduces engagement and trust (Lane & Aplin-Houtz, Reference Lane and Aplin-Houtz2023). In addition, when fairness is undermined, employees may disengage cognitively, emotionally, and behaviorally (Skarlicki, Lo, Rogo, Avolio, & DeHaas, Reference Skarlicki, Lo, Rogo, Avolio and DeHaas2023), and they may also experience a breakdown in trust and team cohesion, particularly when justice violations occur in high-stakes or evaluative settings (Abbas & Wu, Reference Abbas and Wu2018).
Hypothesis 1e: A high perception of EBs in the workplace will negatively relate to the perception of fairness.
Turnover intentions
TOI refers to an employee’s conscious plan or desire to leave their organization and seek alternative employment, and it is one of the most reliable predictors of actual turnover behavior (Bothma & Roodt, Reference Bothma and Roodt2013; Cohen, Blake, & Goodman, Reference Cohen, Blake and Goodman2016). High turnover has broad implications for organizational functioning, including reduced productivity, increased financial costs, lower service quality, and destabilized team cohesion (Shuck, Twyford, Reio, & Shuck, Reference Shuck, Twyford, Reio and Shuck2014). It also places emotional and workload burdens on remaining employees, contributing to a potential cycle of dissatisfaction and further attrition (Oreg, Bartunek, Lee, & Do, Reference Oreg, Bartunek, Lee and Do2018).
From an SDT perspective, TOI can be interpreted as a response to needs frustration. When employees feel micromanaged (undermining autonomy), lack opportunities for growth (threatening competence), or are socially excluded (frustrating relatedness), their psychological needs are thwarted. This shifts motivation from autonomous (value-driven) to controlled (pressure-driven), increasing burnout and TOI (Jungert, Caruana, Gillet, & Huyghebaert-Zouaghi, Reference Jungert, Caruana, Gillet and Huyghebaert-Zouaghi2024; Trépanier, Forest, Fernet, & Austin, Reference Trépanier, Forest, Fernet and Austin2015).
In addition to social factors, individual and contextual variables also influence employees’ likelihood of turnover. For example, intrinsic job satisfaction – particularly satisfaction with the work itself – has been shown to buffer against TOI, even when interpersonal stressors are present (Spector, Reference Spector2022). Similarly, job embeddedness, defined as the extent to which employees feel connected to their jobs and community, serves as a stabilizing force that reduces the likelihood of exit in stressful environments (Clinton, Knight, & Guest, Reference Clinton, Knight and Guest2012). Furthermore, demographic characteristics such as age, gender, and organizational tenure have demonstrated modest but consistent effects on both workplace perceptions and turnover decisions, supporting their use as standard control variables in withdrawal research (Ng & Feldman, Reference Ng and Feldman2013).
Linking SCARF, EBs, and TOI
Building on the previous literature, this study argues that the relationship between EB and TOI can be better understood through the psychological mechanisms captured by the SCARF framework. While prior research has established that need frustration contributes to withdrawal, less is known about how specific SCARF dimensions function as mediators in this process. Initial evidence suggests that perceived disruptions to domains such as status and fairness are particularly salient in explaining why excluded employees disengage and consider leaving (Jungert et al., Reference Jungert, Caruana, Gillet and Huyghebaert-Zouaghi2024; Olafsen, Niemiec, Halvari, Deci, & Williams, Reference Olafsen, Niemiec, Halvari, Deci and Williams2017).
This section develops hypotheses for each SCARF domain in two roles: first, as direct predictors of TOI, and second, as mediators of the relationship between EB and TOI. By testing these dual pathways, we aim to identify which psychological disruptions most strongly account for the motivational and behavioral consequences of exclusion in the workplace.
Status
As outlined earlier, EBs can undermine employees’ perceived status by signaling devaluation and social invisibility – triggers that have been shown to activate threat responses and erode the sense of competence (Hitlan et al., Reference Hitlan, Cliffton and DeSoto2006; Rock, Reference Rock2008). When individuals perceive that their social value is diminished, they are more likely to disengage and reevaluate their commitment to the organization. These status threats not only impair motivation but also predict intentions to leave, particularly when employees feel overlooked or bypassed in key interactions (Freedman, Reference Freedman2019).
Although relatively few studies have directly linked perceived status to TOI, available evidence supports its protective role. For instance, Heffernan and Rochford (Reference Heffernan and Rochford2017) found that social status significantly moderated the relationship between psychological contract breach and TOIs, such that individuals with higher perceived status demonstrated lower intentions to leave in response to breach. Similarly, Liu, Chen, He, and Huang (Reference Liu, Chen, He and Huang2019) reported that exclusionary leadership reduced perceived competence and status, indirectly contributing to withdrawal behavior. These findings reinforce the notion that social recognition serves as a stabilizing psychological force.
Hypothesis 2a: The higher perception of one’s status in the workplace will negatively relate to the intention to leave one’s job.
Hypothesis 3a: The perception of one’s status in the workplace will mediate the relationship between the perception of EBs and TOIs.
Certainty
As outlined earlier, certainty reflects the perception of clarity, predictability, and control over one’s work environment and is closely linked to the SDT need for competence. When individuals feel uncertain – due to inconsistent expectations, opaque decision-making, or lack of feedback – their ability to predict outcomes and regulate behavior is disrupted, undermining confidence and motivation (Deci & Ryan, Reference Deci and Ryan2000; Rock, Reference Rock2008).
Organizational studies underscore how uncertainty contributes to TOI. For example, Hansen et al. (Reference Hansen, Hansen and Madsen2022) found that during periods of organizational disruption, unclear communication reduced role clarity and increased attrition. Similarly, employees excluded from key communications or decision-making processes reported lower trust and greater intention to leave (Manjaly et al., Reference Manjaly, Francis and Francis2024). These findings affirm that perceived predictability, not just workplace content, drives retention.
Certainty may also mediate the relationship between EB and TOI. As shown in student samples, exclusion that limits feedback or guidance results in motivational disengagement and withdrawal (Javadizadeh et al., Reference Javadizadeh, Aplin-Houtz and Casile2022). By parallel, when employees lack access to expectations or decision criteria, they may interpret this ambiguity as a signal of exclusion, undermining competence and prompting exit behavior.
Hypothesis 2b: The higher perception of one’s certainty in the workplace will negatively relate to the intention to leave one’s job.
Hypothesis 3b: The perception of one’s certainty in the workplace will mediate the relationship between the perception of EBs and TOIs.
Autonomy
As discussed in earlier sections, EBs undermine autonomy by restricting voice, limiting participation, or enforcing rigid task structures. These threats impair intrinsic motivation and can result in a shift toward controlled motivation, characterized by compliance and disengagement (Ryan & Deci, Reference Ryan and Deci2000). Furthermore, workplace research demonstrates that job autonomy is consistently linked to lower TOI (Elrayah, Moustafa, Hamid, and Ahmed Reference Elrayah, Moustafa, Hamid and Ahmed2023). Vui-Yee and Yen-Hwa (Reference Vui-Yee and Yen-Hwa2019) similarly reported that job autonomy buffered the impact of ostracism on withdrawal, highlighting autonomy’s protective role. Moreover, Trépanier et al. (Reference Trépanier, Boudrias and Peterson2019) showed that suppressing employee voice led to autonomy frustration and predicted TOI.
Autonomy also serves a mediating role between EB and TOI. Woon, Tan, and Nasurdin (Reference Woon, Tan and Nasurdin2017) showed that psychological ownership – tied closely to autonomy – explained the pathway from low autonomy to TOI. When employees lose a sense of volition, they are more likely to detach, not only from tasks but from organizational goals and identity, a process driven by reduced intrinsic motivation and increased psychological strain (Deci et al., Reference Deci, Olafsen and Ryan2017; Howard et al., Reference Howard, Cogswell and Smith2020; Olafsen et al., Reference Olafsen, Niemiec, Halvari, Deci and Williams2017). Thus, autonomy plays both a direct and indirect role in shaping how EB affects TOI.
Hypothesis 2c: The higher perception of one’s autonomy in the workplace will negatively relate to the intention to leave one’s job.
Hypothesis 3c: The perception of one’s autonomy in the workplace will mediate the relationship between the perception of EBs and TOIs.
Relatedness
As noted earlier, relatedness reflects the fundamental need to feel socially connected and emotionally supported at work. When this need is unmet due to EBs, individuals experience social pain and psychological insecurity, which undermine motivation and increase withdrawal (Eisenberger & Lieberman, Reference Eisenberger and Lieberman2004).
A growing body of research highlights the direct relationship between relatedness and TOI. Freedman (Reference Freedman2019) found that EBs like poor interprofessional collaboration in healthcare settings increased emotional disengagement and exit cognition. Similarly, McGregor and Bergmann (Reference McGregor and Bergmann2022) reported that low interpersonal support predicted turnover, especially when perceived team trust was absent.
As a mediator, relatedness explains how exclusion leads to turnover. When social connection is severed – whether through being left out of meetings or ignored by supervisors – employees feel psychologically unsafe and seek alternative environments. Zhang, Xu, Yoon, Chen, and Parmenter (Reference Zhang, Xu, Yoon, Chen and Parmenter2024) demonstrated that support from organizational leaders predicted lower turnover via enhanced job satisfaction and relatedness. Relatedness is therefore both a protective and explanatory factor in the EB–TOI dynamic.
Hypothesis 2d: The higher perception of one’s relatedness in the workplace will negatively relate to the intention to leave one’s job.
Hypothesis 3d: The perception of one’s relatedness in the workplace will mediate the relationship between the perception of EBs and TOIs.
Fairness
As established in previous sections, fairness functions as a cross-cutting need within both SCARF and SDT frameworks. It supports autonomy, competence, and relatedness by ensuring individuals feel respected, included, and treated with consistency (Ryan & Deci, Reference Ryan and Deci2000).
Fairness is a robust predictor of TOI. In a study of IT professionals, McKnight, Phillips, and Hardgrave (Reference McKnight, Phillips and Hardgrave2009) found that fairness perceptions outperformed traditional job characteristics in forecasting employee retention. Lane and Aplin-Houtz (Reference Aplin-Houtz, Munoz, Fergurson, Fleming and Miller2023) demonstrated, particularly in remote contexts, lapses in informational and interpersonal justice predicted emotional disengagement and TOI.
As a mediating mechanism, fairness helps explain how EBs lead to TOI. Exclusion often manifests as procedural injustice (e.g., being left out of decisions), distributive injustice (e.g., unequal recognition), or interpersonal injustice (e.g., disrespect), each of which disrupts fairness perceptions. Huang and Lin (Reference Huang and Lin2019) showed that such justice violations contribute to emotional exhaustion, a known antecedent of TOI. Therefore, fairness serves not only as a direct predictor of TOI but also as an explanatory link between exclusion and withdrawal.
Hypothesis 2e: The higher perception of fairness in the workplace will negatively relate to the intention to leave one’s job.
Hypothesis 3e: The perception of fairness in the workplace will mediate the relationship between the perception of EBs and TOIs.
Method
Hypothesized model
To address the central research question – How do exclusionary workplace behaviors influence TOIs through the disruption of core psychological needs as outlined in Rock’s SCARF model? – we developed the model presented in Fig. 1.
Research model.

This model positions EBs as the independent variable, TOI as the outcome variable, and the five psychological needs in the SCARF model – status, certainty, autonomy, relatedness, and fairness – as mediators. It examines both the direct effects of EB on TOI and the indirect effects through psychological need frustration. Control variables include age, gender, organizational tenure, job satisfaction with coworkers and communication, resilience, and job embeddedness to account for potential confounds.
A primary challenge in testing social–psychological dynamics such as exclusion and need threat is establishing temporal or causal sequencing in field settings. As Spector (Reference Spector2019) notes, experimental designs often introduce artificiality that compromises ecological validity. Instead, pseudo-cross-sectional designs with repeated measures offer an effective alternative for exploratory research, particularly when mapping theoretical relationships and extending models. This recommendation is particularly relevant here, as this study explores the SCARF model in a general workforce sample rather than the student populations where it has primarily been tested. While SCARF’s relevance is established in educational stress contexts (Javadizadeh et al., Reference Javadizadeh, Aplin-Houtz and Casile2022), its application to workplace exclusion remains underexplored. Thus, this study represents an exploratory extension of SCARF into organizational behavior.
To strengthen reliability, a two-wave pseudo-cross-sectional design was used, enabling test–retest reliability checks across a 1-week interval. Although primary analyses relied on wave one, wave two confirmed temporal stability for key constructs, reinforcing measure robustness and informing future longitudinal designs (Rafilson, Reference Rafilson1989).
An a priori power analysis using G*Power (Faul, Erdfelder, Buchner, & Lang, Reference Faul, Erdfelder, Buchner and Lang2009) determined that a sample of 262 would be sufficient to detect a medium effect (f 2 = .07) at 0.80 power with 13 latent predictors, in line with Cohen’s (Reference Cohen1992) guidelines. The final sample of 277 participants met this threshold, supporting the adequacy of the data for testing the proposed model.
Participants and procedures
Participants were recruited via the third-party platform Prolific. Inclusion criteria required individuals to (a) be at least 18 years old, (b) be currently employed full-time in the USA, and (c) be enrolled in Prolific’s participant pool. The study received full approval from the Institutional Review Board (IRB) prior to data collection.
Prolific was selected for its high-quality, demographically diverse participant base and suitability for longitudinal research with low attrition. Internet panel-based sampling has demonstrated higher response integrity and more consistent demographic composition compared to non-panel-based methods (Smith, Roster, Golden, & Albaum, Reference Smith, Roster, Golden and Albaum2016).
A pre-screening survey was distributed to 5,719 Prolific users and capped at 1,000 responses. Of these, 374 participants met eligibility criteria and agreed to participate in a two-wave study with repeated measures. Screeners were compensated $0.25. Wave 1 (April 6–22, 2023) included demographics, focal model variables, and controls. Of the 374 eligible participants, 277 completed the survey (74.06% response rate). These individuals were invited to Wave 2, conducted at least 1 week later, with 271 valid completions. The surveys included three attention check items, all of which were passed by the final sample.
Sample characteristics
The final sample (N = 277) represented a diverse range of US full-time workers. Ages ranged from 21 to 81°years (M = 39.69, SD = 9.807), with 45.4% of respondents between the ages of 31 and 40°years. The sample was majority male (63.9%), followed by female (33.9%) and non-binary/third gender (2.2%). Most participants identified as White or Caucasian (76.5%), followed by Black or African American (8.3%), Asian (5.8%), Hispanic/Latino (6.5%), and multiracial or another race (2.9%). Educational attainment was diverse: 50.9% held an undergraduate degree, 24.5% had a graduate degree, 18.8% had completed high school or earned a GED, and 5.4% held a doctoral degree. With respect to income, 75.9% of the sample reported earning $50,000 or more annually, while 24.1% earned below $50,000. See Table 1 for more details.
Demographics

Measures
All focal variables and theoretically relevant constructs, with the exception of resilience and other control variables, were assessed at both Time 1 and Time 2 to evaluate temporal stability and directional relationships. The measures described below reflect finalized scales after item removal, as detailed in the Measurement Model section. Included are descriptive statistics (mean and SD), distributional characteristics (via Shapiro–Wilk test), internal consistency (Cronbach’s alpha), composite reliability (CR), average variance extracted (AVE), and test–retest reliability across waves for constructs measured at both time points.
Exclusionary behaviors
EBs were measured using a 7-item subscale of the Uncivil Work Behavior Questionnaire (Martin & Hine, Reference Martin and Hine2005), designed to assess perceptions of being socially excluded in the workplace. Participants responded using a 5-point Likert scale. The construct showed strong internal consistency (α = 0.892), CR (CR = 0.915), and AVE = 0.606. The distribution was non-normal (Shapiro–Wilk W = 0.962, p < .001). The mean was 2.23 (SD = 0.856). Test–retest reliability between Time 1 and Time 2 was strong (r = 0.812), indicating temporal consistency via test–retest reliability in perceived EB.
SCARF dimensions
The five dimensions of the SCARF model were assessed using a 16-item adapted scale based on Rock (Reference Rock2008). Status, Certainty, and Relatedness were measured with three items each; Fairness with four items; and Autonomy with four items, one of which was removed due to poor factor loading.
Cronbach’s alpha values indicated strong internal consistency: Status (α = 0.915), Certainty (α = 0.831), Autonomy (α = 0.740), Relatedness (α = 0.878), and Fairness (α = 0.917). CR ranged from 0.853 to 0.946, and AVE ranged from 0.662 to 0.885. All SCARF variables were non-normally distributed (p < .001), with W values ranging from 0.882 to 0.977.
Mean and SDs were as follows: Status (M = 4.96, SD = 0.999), Certainty (M = 4.83, SD = 0.909), Autonomy (M = 3.41, SD = 0.782), Relatedness (M = 4.64, SD = 1.11), and Fairness (M = 4.46, SD = 1.10).
Test–retest correlations were acceptable to strong for Status (r = 0.783), Certainty (r = 0.722), Autonomy (r = 0.771), Relatedness (r = 0.824), and Fairness (r = 0.837).
Turnover intention
TOI was measured using a 3-item scale developed by O’Driscoll and Beehr (Reference O’Driscoll and Beehr1994). Participants rated each item on a 5-point Likert scale. The measure demonstrated excellent internal consistency (α = 0.937), CR (CR = 0.960), and AVE = 0.889. The construct was non-normally distributed (W = 0.916, p < .001), with a mean of 2.83 and an SD of 1.50. The test–retest correlation between Time 1 and Time 2 was very strong (r = 0.895), indicating high temporal reliability.
Control variables
Control variables included age, gender, and organizational tenure. These demographic factors were included due to their established associations with TOI. Age and tenure are generally inversely related to turnover, while gender can moderate workplace experiences and withdrawal behavior (Hur, Reference Hur2025; Ng & Feldman, Reference Ng and Feldman2009).
In addition, job satisfaction with coworkers and job satisfaction with the work itself were included as control variables. These were measured using subscales from the Job Satisfaction Survey (JSS; Spector, Reference Spector1985, Spector, Reference Spector2022). The coworker satisfaction subscale showed acceptable internal consistency (α = 0.778), with a mean of 4.76 (SD = 1.25) and non-normal distribution (W = 0.977, p < .001). Satisfaction with the work itself demonstrated strong reliability (α = 0.902), with a mean of 4.68 (SD = 1.52) and W = 0.952 (p < .001). Coworker satisfaction was controlled in relation to EB because employees who are generally satisfied with their peers may be less likely to perceive exclusionary treatment, potentially confounding the effects of actual exclusion (Oosthuizen, Coetzee, & Munro, Reference Oosthuizen, Coetzee and Munro2019). Work satisfaction, meanwhile, helps isolate interpersonal exclusion effects from dissatisfaction with the job itself (Spector, Reference Spector2022).
Job embeddedness was assessed using a scale developed by Clinton et al. (Reference Clinton, Knight and Guest2012), which includes items assessing embeddedness to both one’s job and community. Five items with low factor loadings were removed. The refined scale retained strong internal consistency (α = 0.892), CR = 0.915, and AVE = 0.608. The distribution was non-normal (W = 0.927, p < .001), with a mean of 5.64 and an SD of 1.06. Job embeddedness was included because individuals with stronger workplace ties tend to have lower TOIs regardless of stressors (Li, Chen, & Wang, Reference Li, Chen and Wang2025).
Resilience was also used as a control, measured only at Time 1 using the Brief Resilience Scale (BRS; Smith et al., Reference Smith, Dalen, Wiggins, Tooley, Christopher and Bernard2008). This measure demonstrated excellent reliability (α = 0.917, CR = 0.935, AVE = 0.706), with a mean of 3.55 (SD = 1.05) and non-normal distribution (W = 0.948, p < .001) (Anasori, Bayighomog, De Vita, & Altınay, Reference Anasori, Bayighomog, De Vita and Altınay2021).
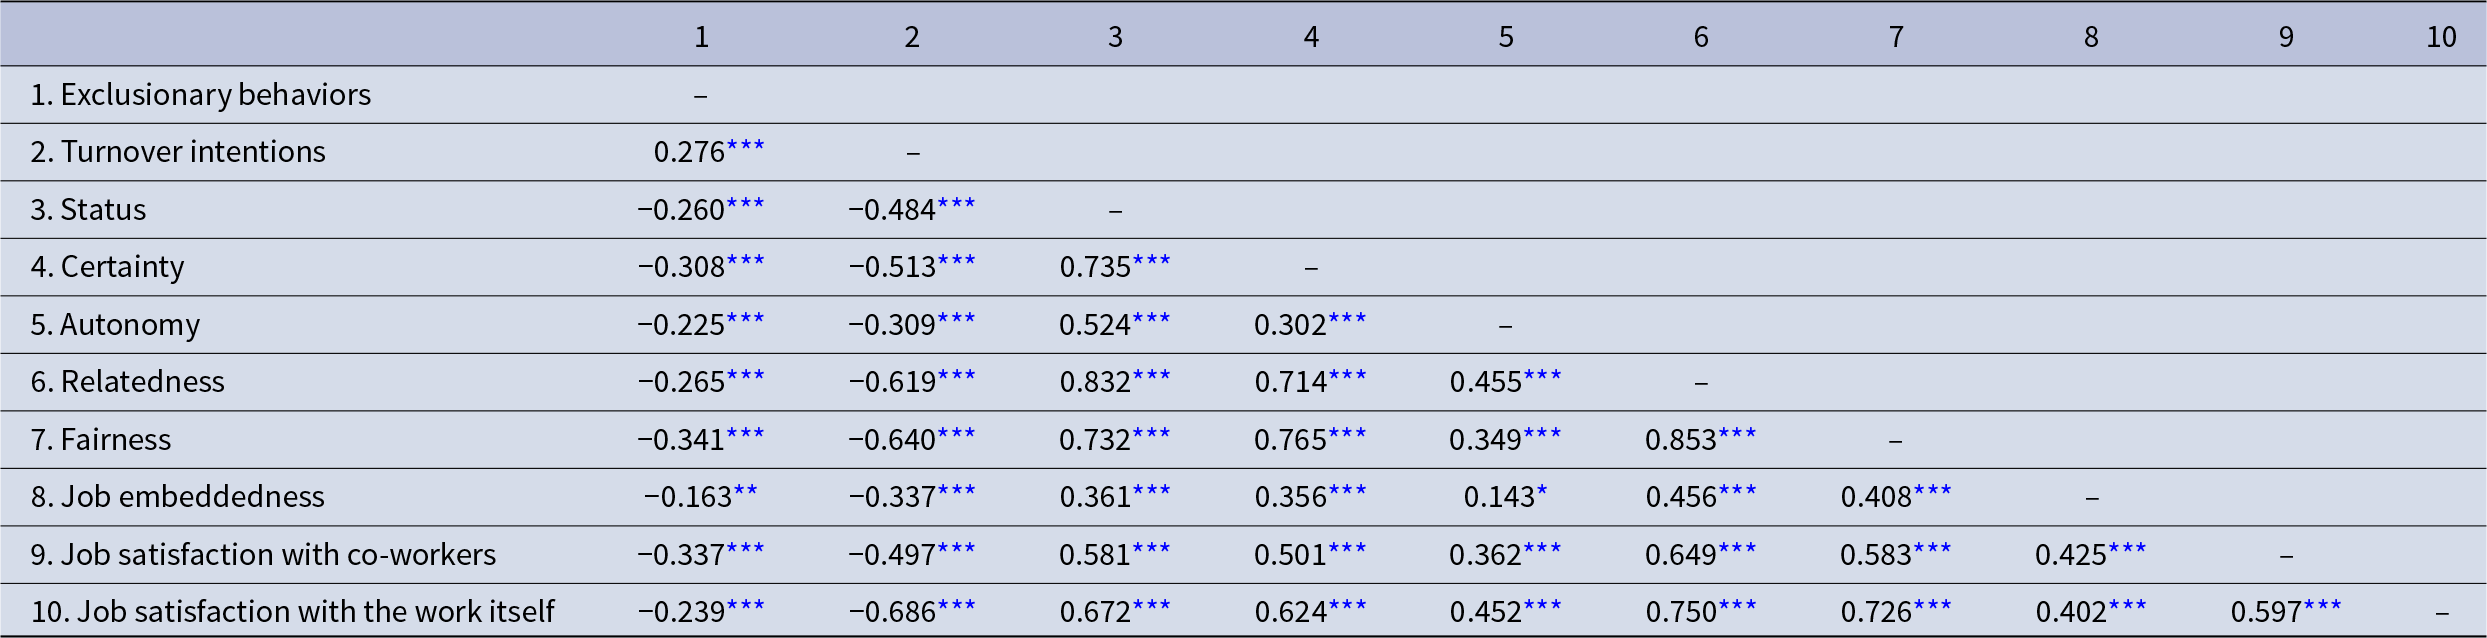
Correlation analysis
Pearson correlations revealed that EB were positively associated with TOI (r = .276, p < .001), and negatively associated with all five SCARF needs: Status (r = −.260), Certainty (r = −.308), Autonomy (r = −.225), Relatedness (r = −.265), and Fairness (r = −341), all at p < .001. TOI also showed significant negative correlations with each SCARF domain, strongest for Fairness (r = −.640), suggesting unmet psychological needs are linked to greater turnover risk.
SCARF variables were moderately to highly intercorrelated (r = .302 to .853), with the strongest link between Relatedness and Fairness. Despite high overlap, each construct is theoretically distinct and grounded in separate neurological and psychological mechanisms (Rock, Reference Rock2008), justifying inclusion as unique predictors. See Table 2 for more details.
Correlation analysis

* p < .05, **p < .01, ***p < .001.
Analysis of model
To examine our conceptual model, we employed partial least squares structural equation modeling (PLS-SEM) using SmartPLS 4.0. While PLS-SEM shares similarities with traditional covariance-based SEM such as AMOS, it was better suited for this study for several reasons. First, PLS-SEM excels in predictive-causal modeling, aligning with our goal of evaluating how antecedent variables – particularly EB – influence downstream psychological constructs and TOIs (Chin, Marcolin, & Newsted, Reference Chin, Marcolin and Newsted2003). Second, given the non-normality present in nearly all variables except for TOI, PLS-SEM was chosen for its robustness against non-normal data distributions, thereby avoiding violations common in traditional SEM techniques (Hair, Matthews, Matthews, & Sarstedt, Reference Hair, Matthews, Matthews and Sarstedt2017).
Measurement model analysis
We removed one item from the Autonomy construct and five items from the Job embeddedness construct due to low factor loadings (< 0.70), following established guidelines for construct validity (Gefen, Straub, & Boudreau, Reference Gefen, Straub and Boudreau2000; Hair, Black, Babin, & Anderson, Reference Hair, Black, Babin and Anderson2010). For the Job embeddedness construct, which includes two subdimensions – embeddedness to one’s job and to one’s community – we removed five items: one from the job subdimension and four from the community subdimension. These items had loadings ranging from 0.502 to 0.678, and their removal improved model clarity and internal consistency. The retained items continued to load strongly (>0.70) on their respective dimensions, preserving the theoretical and factorial structure (Mitchell et al., Reference Mitchell, Holtom, Lee, Sablynski and Erez2001).
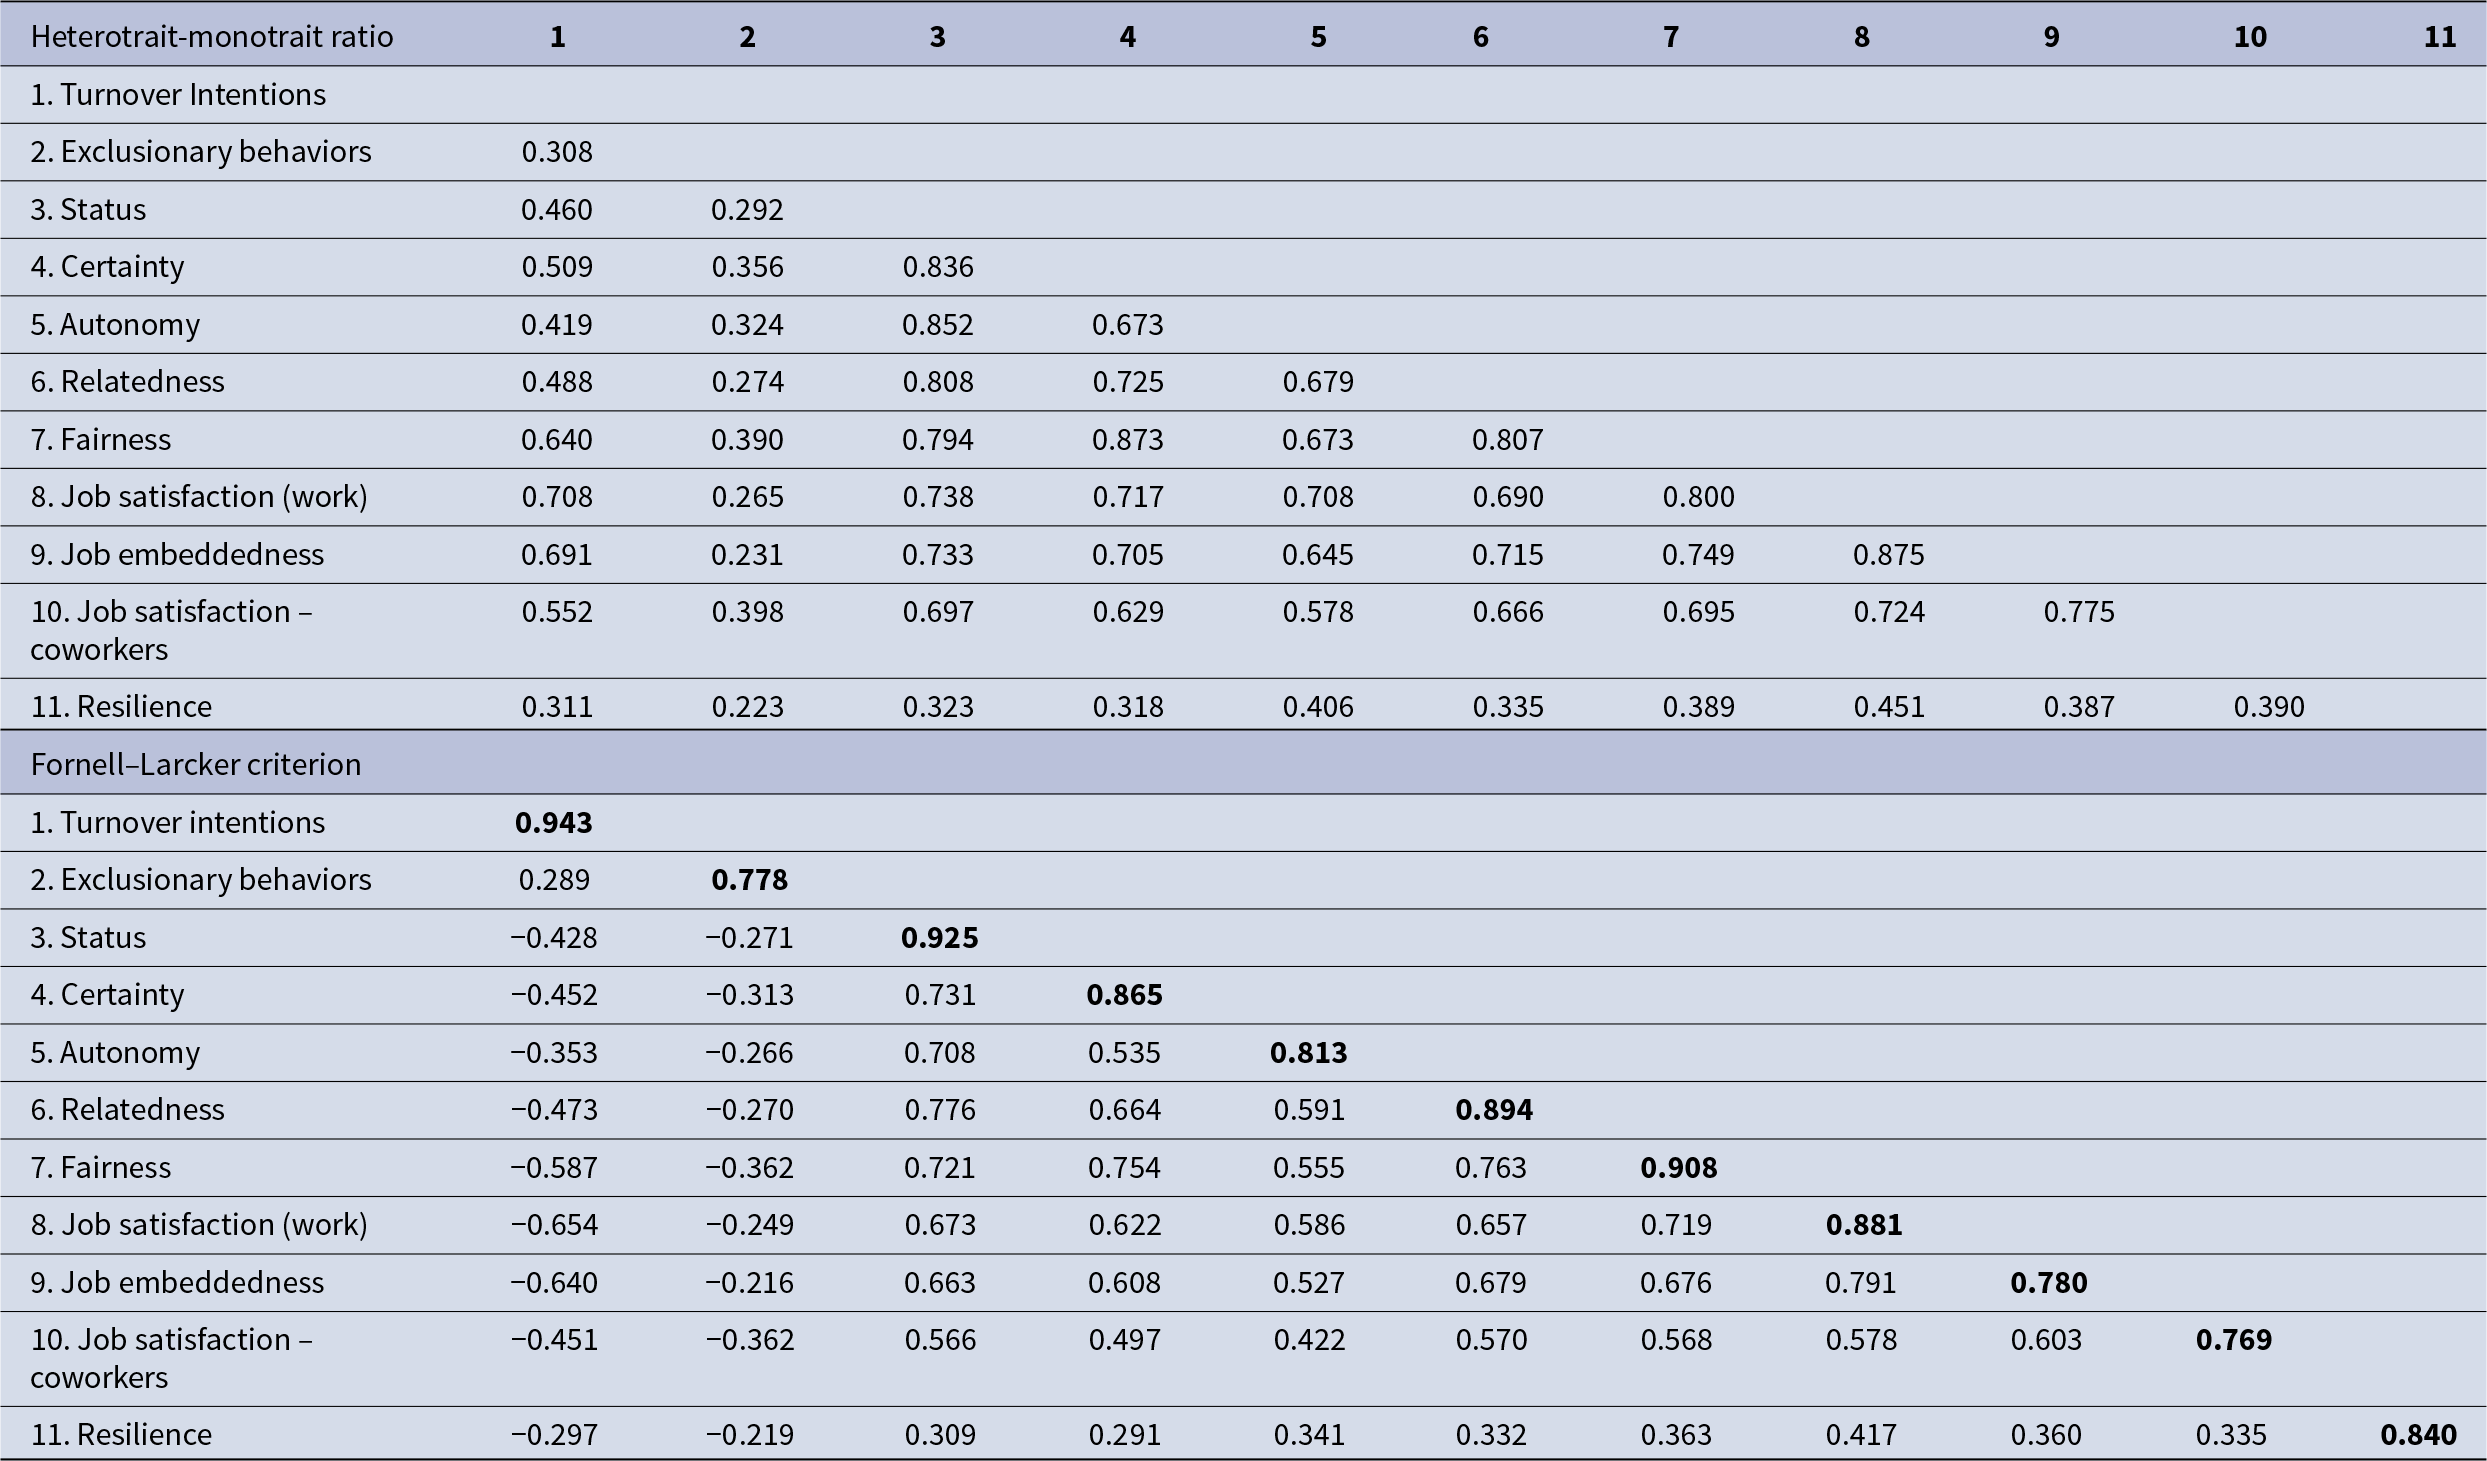
Construct reliability and convergent validity were well supported. Cronbach’s alpha values ranged from 0.740 (Autonomy) to 0.937 (TOI), and CR (ρ_c) values ranged from 0.853 to 0.960, exceeding the 0.70 threshold for internal consistency (Wasko & Faraj, Reference Wasko and Faraj2005). AVE values also exceeded the recommended 0.50 threshold, ranging from 0.591 (JS – Coworkers) to 0.889 (TOI), confirming convergent validity (Fornell & Larcker, Reference Fornell and Larcker1981). See Table 3 for more details.
Measurement model metrics

Bold indicates items with low factor loadings warranting removal
To assess discriminant validity, we applied the Fornell–Larcker criterion and heterotrait–monotrait (HTMT) ratios. According to Fornell and Larcker (Reference Fornell and Larcker1981), the square root of the AVE for each construct should exceed its correlations with all other constructs. We calculated AVEs and positioned their square roots on the diagonal of the Fornell-Larcker matrix. Each diagonal value surpassed the corresponding inter-construct correlations. For instance, the square root of AVE for Fairness was 0.908, exceeding its correlations with Relatedness (0.763), Certainty (0.754), and all other constructs. This confirmed that each construct shared more variance with its own items than with others, satisfying the Fornell–Larcker criterion.
We also used the HTMT ratio, a more rigorous test of discriminant validity in variance-based structural equation modeling (Henseler, Ringle, & Sarstedt, Reference Henseler, Ringle and Sarstedt2015). All HTMT values were below the 0.90 threshold. For example, Fairness and Relatedness yielded an HTMT of 0.807, and Fairness and Certainty had an HTMT of 0.873 – both within acceptable bounds. While conceptually related, these constructs reflect distinct motivational domains in the SCARF framework (Rock, Reference Rock2008): Fairness concerns perceived justice and equity, whereas Relatedness addresses social inclusion and connection. The combined Fornell–Larcker and HTMT results provide converging evidence for discriminant validity. See Table 4 for more details.
Discriminate validity assessment

Bold indicates the square root of the AVE for the construct
Multicollinearity was evaluated at both the inner and outer model levels to ensure the stability of path estimates and measurement validity. In the inner model, VIF values for structural paths ranged from 1.001 to 4.083, with most values below the conservative threshold of 3.3. A few paths exhibited moderate multicollinearity, including Status → TOI (VIF = 4.083), Fairness → TOI (VIF = 3.751), Relatedness → TOI (VIF = 3.373), Job satisfaction → TOI (VIF = 3.399), and Job embeddedness → TOI (VIF = 3.138). All values remained well under the exploratory threshold of 5.0, and far below the critical cutoff of 10, suggesting no serious multicollinearity concerns in the structural model (Hair et al., Reference Hair, Hult, Ringle, Sarstedt, Danks and Ray2021).
In the outer model, item-level VIFs across all constructs ranged from 1.0 to 4.45, with the highest observed for Resilience item 4 (VIF = 4.451) and Job satisfaction item 32 (VIF = 4.457). Despite a few values above 3.3, the overall pattern reflects acceptable collinearity across indicators. These results confirm that indicator multicollinearity is not distorting latent variable measurement or structural relationships. Taken together, VIF diagnostics support the robustness of both measurement and structural components of the model.
To further evaluate common method variance, the measured marker variable approach was used (Podsakoff, MacKenzie, Lee, & Podsakoff, Reference Podsakoff, MacKenzie, Lee and Podsakoff2003), with ‘Attitudes Toward Blue’ (Miller & Simmering, Reference Miller and Simmering2023) modeled as a theoretically unrelated construct. Direct paths were drawn from the marker to all endogenous variables. Inclusion of the marker caused only minor changes in R 2 values, including increases from 0.510 to 0.523 for TOI, 0.074 to 0.089 for Status, and 0.098 to 0.109 for Certainty. Key structural paths remained stable in magnitude and significance, such as Fairness → TOI (from β = −0.302, p = .001 to β = −0.273, p = .002) and Job embeddedness → TOI (from β = −0.337, p < .001 to β = −0.330, p < .001).
Importantly, the marker variable showed only one significant path, Blue → TOI (β = 0.117, p < .001). All other marker paths were nonsignificant, and no indirect effects involving Blue emerged. Additionally, VIF values for all paths from the marker were very low, ranging from 1.001 to 1.048, and all VIFs for the model constructs remained below 3.3.
Taken together, the results of the VIF assessment and marker variable test indicate that common method bias (CMB) is not a significant concern in the current study and does not appear to inflate or distort the observed relationships.
Structural model
To evaluate the hypothesized structural model, we used R 2, Q 2, and the significance of path coefficients. R 2 values for the SCARF dimensions (as outcomes of EBs) ranged from 0.071 to 0.126, indicating modest but meaningful explanatory power for this stage of theory testing. Although these values fall below the conventional 0.10 benchmark, they remain defensible in behavioral research, particularly when examining nuanced psychological states (Falk & Miller, Reference Falk and Miller1992; Hair et al., Reference Hair, Matthews, Matthews and Sarstedt2017). The R 2 for TOI was 0.507, suggesting strong predictive capability at the outcome level. Additionally, Q 2 values were all above zero, confirming the model’s predictive relevance. Model fit, as assessed by the standardized root mean square residual (SRMR), was acceptable: the estimated model yielded an SRMR of 0.073. This is below the .10 threshold (Hair et al., Reference Hair, Matthews, Matthews and Sarstedt2017).
Results
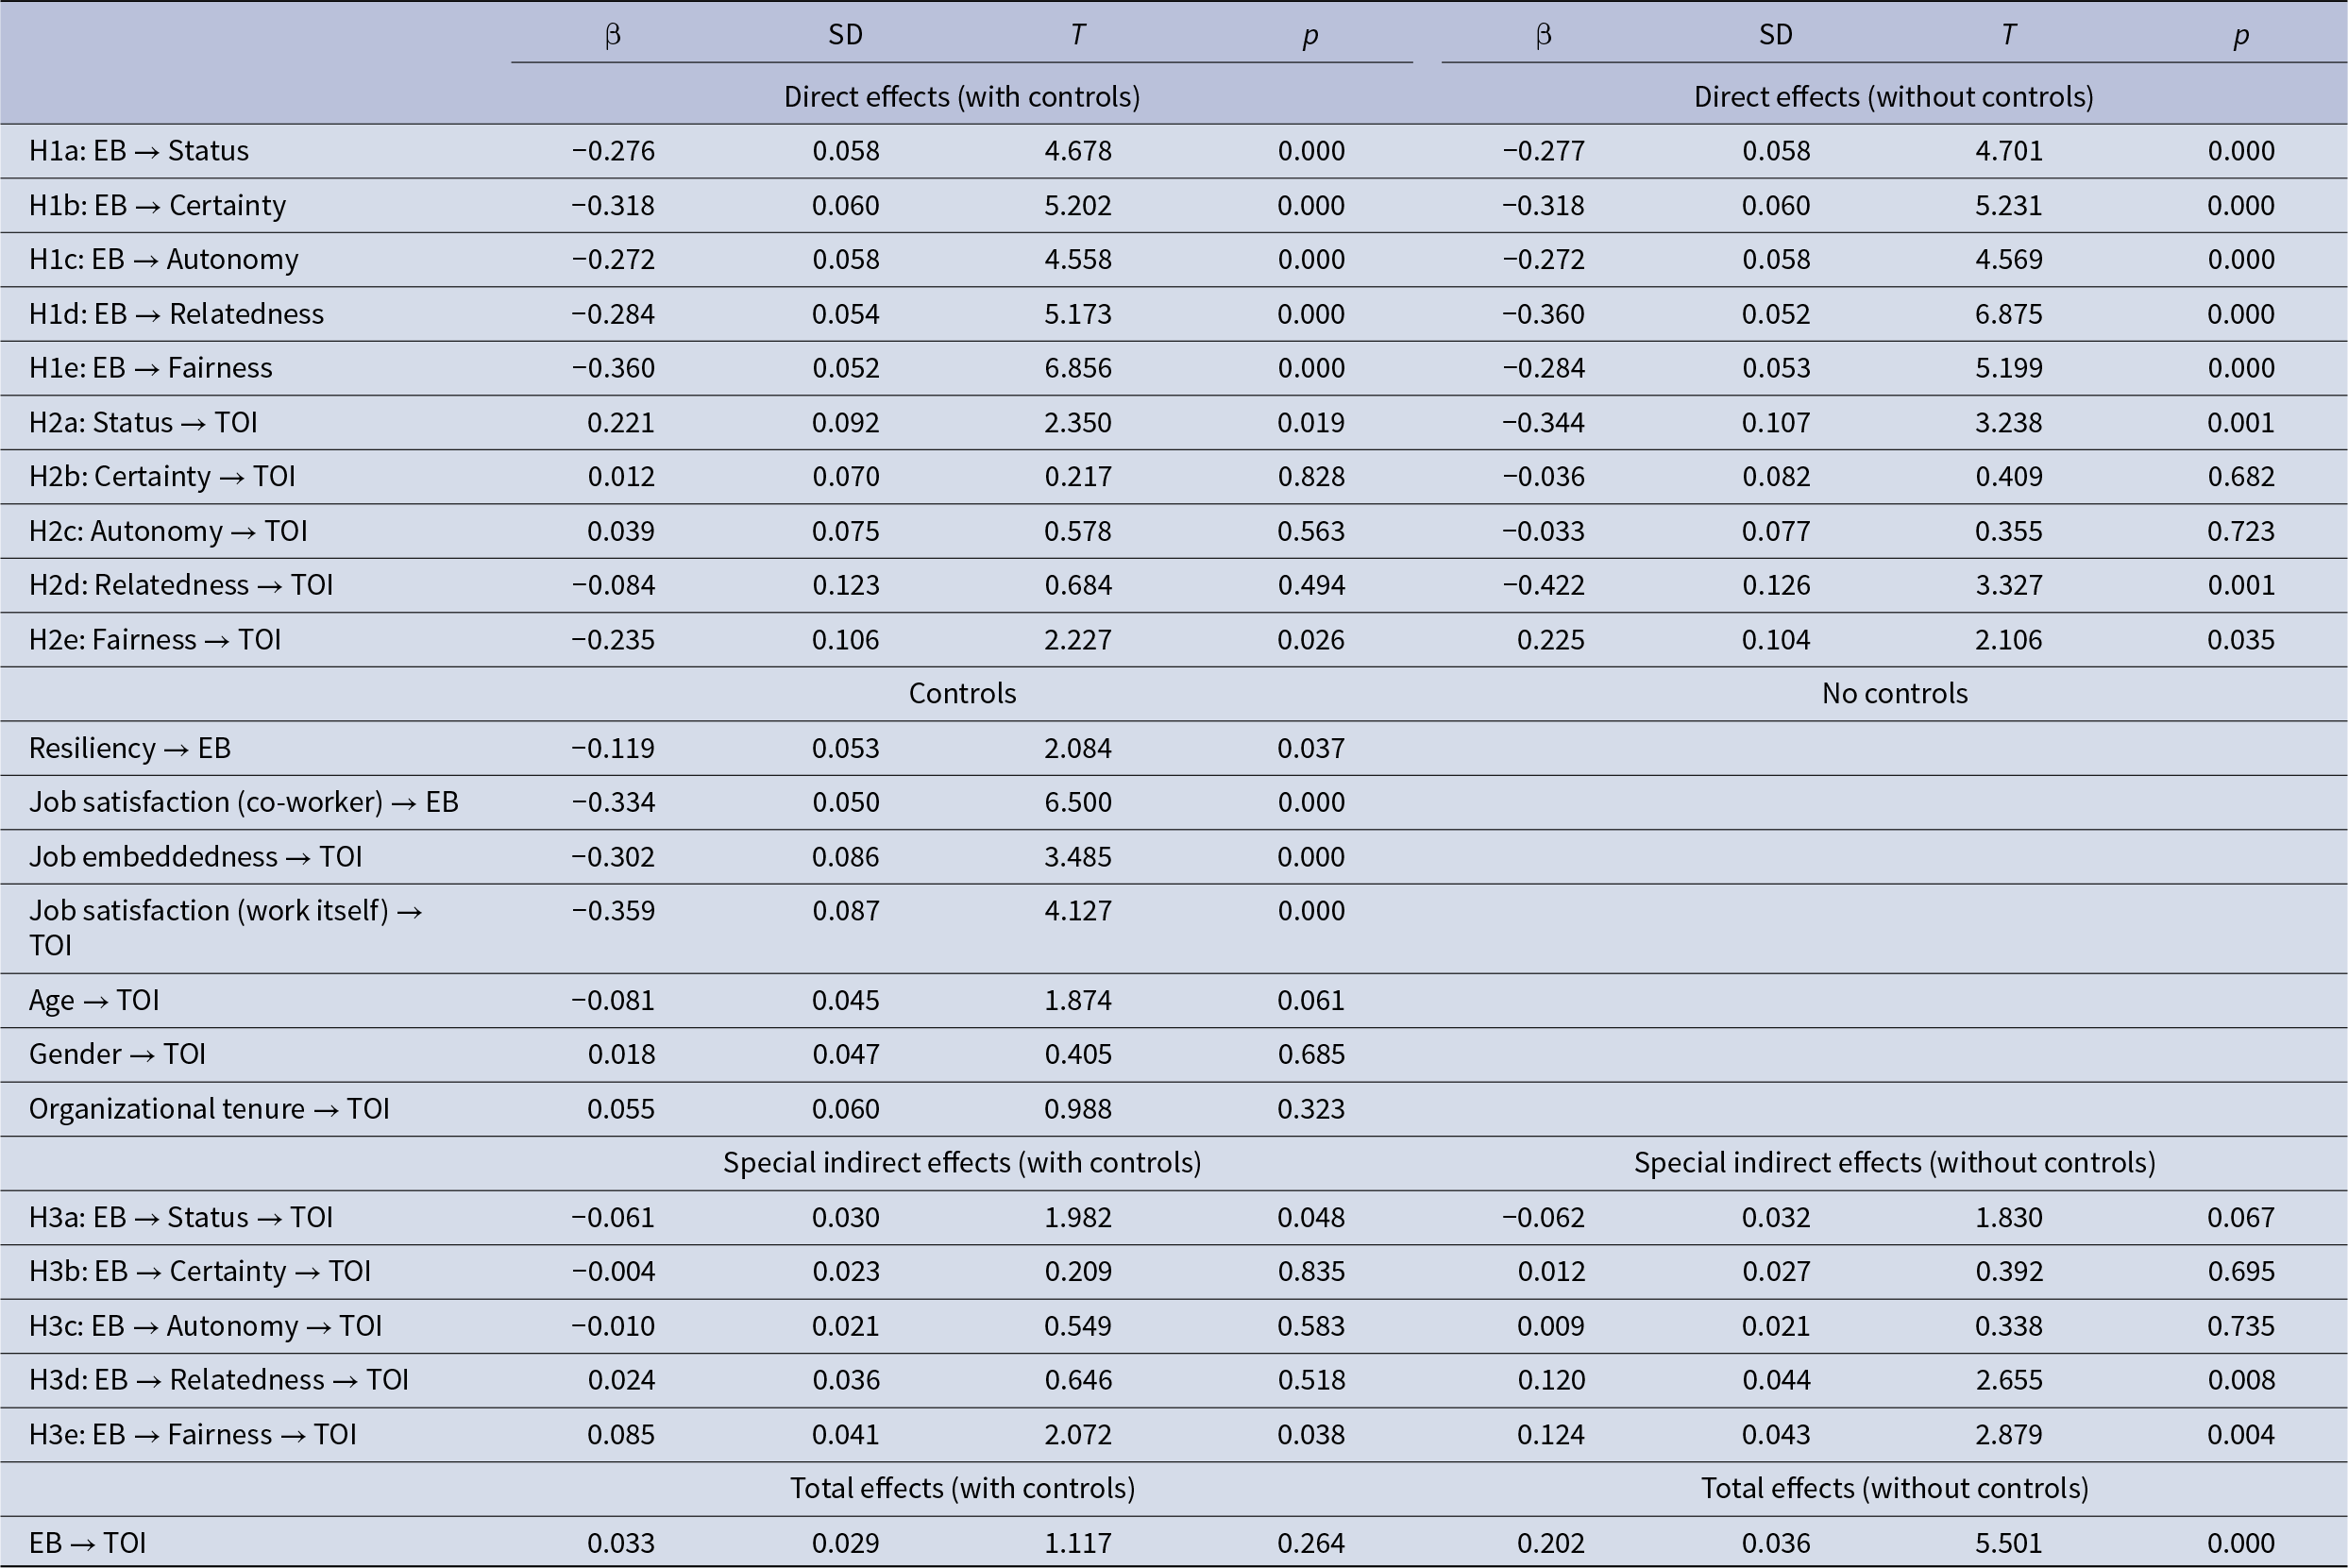
Higher perceptions of EBs were significantly associated with reduced satisfaction across all five SCARF domains: status (β = −0.276, p < .001), certainty (β = −0.318, p < .001), autonomy (β = −0.272, p < .001), relatedness (β = −0.284, p < .001), and fairness (β = −0.360, p < .001), supporting Hypotheses 1a–1e. These effects remained robust without controls.
Only status and fairness were significantly linked to TOI when controls were included. Status showed a positive association with TOI (β = 0.221, p = .019), contradicting Hypothesis 2a, while fairness was negatively associated (β = −0.235, p = .026), supporting Hypothesis 2e. Certainty (β = 0.012, p = .828), autonomy (β = 0.039, p = .563), and relatedness (β = −0.084, p = .494) were non-significant, providing no support for Hypotheses 2b–2d.
Mediation analyses revealed two significant indirect paths: EB influenced TOI through fairness (β = 0.085, p = .041) and status (β = −0.061, p = .030), supporting Hypotheses 3a and 3e. Indirect effects through certainty (β = −0.004, p = .835), autonomy (β = −0.010, p = .583), and relatedness (β = 0.024, p = .518) were not significant, failing to support Hypotheses 3b–3d. These results indicate that fairness and status are the primary psychological pathways linking EB to TOI.
The total effect of EB on TOI was non-significant in the controlled model (β = 0.033, p = .264), but significant in the uncontrolled model (β = 0.202, p < .001), highlighting the mediating roles of psychological needs and covariates.
Among control variables, coworker satisfaction (β = −0.334, p < .001) and work satisfaction (β = −0.359, p < .001) were negatively associated with EB and TOI, respectively, suggesting that general satisfaction buffers against exclusion’s effects. Job embeddedness negatively predicted TOI (β = −0.302, p < .001), consistent with its role as a retention factor. Resilience showed a modest negative relation with EB (β = −0.119, p = .037), indicating a possible protective effect. Age, gender, and tenure were not significantly related to TOI.
See Table 5 and Fig. 2 for all metrics of the analysis and a visual depiction of the model.
Significant and nonsignificant paths.

Path analysis for models with and without controls

EB = exclusory behaviors, TOI = turnover intentions.
Discussion
Our findings highlight the significant role that SCARF domains play in shaping how EB influence workplace TOI. Results strongly supported Hypotheses 1a–1e, confirming that perceptions of EB are negatively related to experiences of status, certainty, autonomy, relatedness, and fairness.These findings reinforce SDT, which posits that environments that thwart basic psychological needs – particularly those related to social connection, perceived competence, and control – lead to maladaptive outcomes such as withdrawal and disengagement (McAnally & Hagger, Reference McAnally and Hagger2024). These results also align with previous evidence that EBs reduce psychological need satisfaction, triggering stress responses and impairing motivational sustainability (Olafsen et al., Reference Olafsen, Niemiec, Halvari, Deci and Williams2017).
The results for Hypotheses 2a–2e both affirm and challenge existing theory. Perceived fairness emerged as the strongest and most consistent predictor of TOI, supporting Hypothesis 2e and reinforcing fairness as a central driver of psychological safety and retention (Jogi, Vashisth, Srivastava, Alturas, & Kumar, Reference Jogi, Vashisth, Srivastava, Alturas and Kumar2024). Fairness also mediated the relationship between EB and TOI (Hypothesis 3e), while status also served as a significant mediator (Hypothesis 3a), suggesting that threats to social standing can prompt withdrawal when individuals feel excluded (Srivastava & Singh, Reference Srivastava and Singh2021).
Unexpectedly, the direct effect of status on TOI was positive, contradicting Hypothesis 2a and challenging the assumption that status is inherently protective. One explanation is that employees who perceive themselves as high status may feel more confident in their ability to leave unsatisfying roles, interpreting mobility as a reflection of their value and marketability (Li et al., Reference Li, Chen and Wang2025). High-status individuals may also face increased expectations, role strain, or misalignment with organizational values – especially when fairness or recognition is lacking (Pratt, Dineen, & Wu, Reference Pratt, Dineen and Wu2021). Additionally, elevated status can bring greater exposure to demands, scrutiny, and leadership pressure, leading to burnout or disengagement, particularly when autonomy or fairness is absent (Olafsen et al., Reference Olafsen, Niemiec, Halvari, Deci and Williams2017). These findings suggest that status may act not only as a buffer but also as a resource that enables exit when the environment is perceived as inequitable or constraining.
By contrast, autonomy, certainty, and relatedness did not predict TOI or mediate the EB–TOI relationship, providing no support for Hypotheses 2b, 2c, and 2d. Although these needs are fundamental in SDT, they may become less influential under conditions of social threat, where fairness and status take precedence. Evidence indicates that threats to identity, respect, and social evaluation are often stronger predictors of withdrawal than general control-related needs (Renn, Allen, & Huning, Reference Renn, Allen and Huning2013) and that exclusion fosters TOI through mechanisms of perceived devaluation (Srivastava & Singh, Reference Srivastava and Singh2021). Autonomy may function more effectively as a moderator than a direct predictor; for example, one study found that low job autonomy intensified the impact of ostracism on stress and TOI (Vui-Yee & Yen-Hwa, Reference Vui-Yee and Yen-Hwa2019).
These null results may also reflect changing workplace dynamics, including remote work, individualized roles, or external sources of support (Aplin-Houtz, Lane, Rowesy, Schmidt, & Javadizadeh, Reference Aplin-Houtz, Lane, Rowesy, Schmidt and Javadizadeh2025; Lane & Aplin-Houtz, Reference Lane and Aplin-Houtz2023). In some cases, employees may prioritize fairness and respect over relatedness, particularly when relationships are viewed as inauthentic or politicized (Jogi et al., Reference Jogi, Vashisth, Srivastava, Alturas and Kumar2024).
Our analysis also revealed that the total effect of EB on TOI was not significant when controls were included, underscoring the need to account for psychological mediators like fairness and status. Without them, exclusion’s impact may remain obscured. The total effect was significant in the uncontrolled model, highlighting EB’s indirect influence on TOI (Dwiyanti, Hamzah, & Binti Abas, Reference Dwiyanti, Hamzah and Binti Abas2019). This contrast suggests that SCARF variables serve as suppressors, absorbing the psychological impact of exclusion and illuminating the pathways through which disengagement occurs.
Taken together, these findings advance the literature by demonstrating the distinct psychological mechanisms linking exclusion to turnover. Rather than treating need frustration as a uniform experience, the results support a differentiated model that emphasizes fairness and status as especially critical for motivational sustainability in the face of exclusion, while inviting further reflection on the role of autonomy, certainty, and relatedness in specific workplace contexts.
Limitations and future research
This study’s cross-sectional design limits causal inference between EB, SCARF domains, and TOI. While we introduced temporal separation of variables to reduce CMB, such procedural controls cannot replace longitudinal or experimental designs when testing directionality and mediation (Yao & Xu, Reference Yao and Xu2021). Future research should apply multi-wave or panel methods to evaluate causal pathways, especially those involving psychological needs and motivational shifts (Polas, Reference Polas2025).
The exclusive use of self-report data increases vulnerability to method bias. Although item redundancy was minimized and Harman’s single-factor test indicated no dominant factor, this technique is insufficient on its own (Durmaz, Dursun, & Kabadayi, Reference Durmaz, Dursun, Kabadayi, Baran and Jones2020). To provide a more rigorous assessment, we implemented the measured marker variable technique (Podsakoff et al., Reference Podsakoff, MacKenzie, Lee and Podsakoff2003), using ‘Attitudes Toward Blue’ as an unrelated construct (Miller & Simmering, Reference Miller and Simmering2023). Inclusion of the marker caused minimal changes in R 2 values (e.g., TOI increased from 0.510 to 0.523), and key paths such as Fairness → TOI and Job embeddedness → TOI remained stable. Only one marker path (Blue → TOI) was significant, and all VIF values were below 3.3, indicating no multicollinearity. These findings collectively suggest that CMB is not a major concern in this study and did not materially distort the results. Nonetheless, future research should employ multi-method designs, such as supervisor or peer ratings, to further validate these effects (Cooper et al., Reference Cooper, Eva, Fazlelahi, Newman, Lee and Obschonka2020; Zhu & Li, Reference Zhu and Li2019) Although SCARF has gained visibility in organizational literature, empirical validation of its mechanisms remains limited.
The non-significant mediations observed for autonomy and relatedness suggest that some SCARF dimensions may be contextually dependent in their predictive utility. This aligns with critiques that SCARF components may differ in salience depending on situational demands, job structures, or national culture (Olafsen, Halvari, & Frølund, Reference Olafsen, Halvari and Frølund2021). Future research should explore boundary conditions and moderators such as leadership climate, team structure, and cultural orientation.
Finally, generalizability is constrained by the sample, which was predominantly composed of US workers from education and service sectors. Exclusionary experiences and SCARF sensitivity may vary significantly across occupational groups and cultural environments. Scholars are encouraged to test the SCARF–SDT–TOI model in blue-collar, collectivist, or high power-distance contexts to evaluate the robustness of its psychological mechanisms across diverse work settings (Kaltsonoudi, Tsigilis, & Karteroliotis, Reference Kaltsonoudi, Tsigilis and Karteroliotis2021).
Managerial implications
The findings of this study provide actionable guidance for leaders aiming to reduce TOI and foster inclusive, psychologically sustainable workplaces. Central to this is recognizing that EBs – whether subtle or overt – disrupt employees’ core psychological needs. Drawing on SDT and framed by the SCARF model, these needs are essential for sustaining motivation, engagement, and commitment (Deci & Ryan, Reference Deci and Ryan2000).
Among the SCARF domains, fairness emerged as the most consistent and impactful predictor of TOI. It also significantly mediated the link between EBs and TOI, reinforcing its role in psychological safety. Fairness should be reflected in everyday practices such as transparent decision-making, equitable recognition, consistent evaluations, and clear communication. Even small violations – such as unequal feedback – can erode trust and encourage disengagement (Skarlicki et al., Reference Skarlicki, Lo, Rogo, Avolio and DeHaas2023).
Status also significantly mediated the EB–TOI relationship. Feeling overlooked or devalued can lead employees to question their organizational fit. Leaders should prioritize status-enhancing practices, including public recognition and meaningful project opportunities. Notably, high-status employees were more likely to report TOI, suggesting that empowered individuals may be more inclined to leave when values or expectations misalign.
Certainty, autonomy, and relatedness were not significant predictors of TOI in this context. While still relevant, these needs may play a secondary role under exclusionary conditions unless paired with fairness or recognition (Olafsen et al., Reference Olafsen, Niemiec, Halvari, Deci and Williams2017).
Overall, retention strategies should emphasize fulfilling employees’ psychological needs – especially fairness and status. SCARF-informed leadership, anonymous feedback systems, and structured development paths can help employees feel valued and supported. Addressing exclusion at this psychological level can foster more equitable, engaged, and enduring workplaces.
Conclusion
This study advances our understanding of how EBs in the workplace undermine employee retention by disrupting core psychological needs. Using the SCARF framework and SDT, we found that exclusion significantly reduced perceptions of status, fairness, autonomy, certainty, and relatedness. Of these, fairness and status were the strongest mediators linking exclusion to TOI, underscoring their importance in socially threatening contexts.
These findings demonstrate that psychological need frustration is not uniform. Fairness and status exert a stronger influence on withdrawal when exclusion is perceived, suggesting that inclusion strategies should be tailored to the specific needs most vulnerable to threat.
By integrating SCARF and SDT, this study offers both theoretical and practical contributions. It extends SDT by showing how socially evaluative threats – such as perceived unfairness or diminished status – disrupt motivation beyond the traditional focus on autonomy, competence, and relatedness. SCARF helps identify the specific interpersonal threats that interfere with need fulfillment, offering a nuanced explanation of how exclusion leads to disengagement. This integration bridges motivational theory and organizational practice, providing a structured approach to building more inclusive, sustainable workplaces.
Finally, this study highlights promising avenues for future research. Scholars should explore how contextual factors – such as leadership styles or job roles – influence which SCARF domains become most salient during exclusion. Likewise, individual differences such as personality traits or cultural background may shape how employees respond to threats to status or fairness. Identifying these moderators can sharpen our understanding of exclusion’s impact and guide more effective, equitable interventions.
Data availability statement
The data were collected after IRB approval at the University of Missouri – St. Louis: IRB #2094920 SL. The dataset used in this study is available upon reasonable request from the corresponding author.
Conflict of interest
The author has no conflicts of interest to declare and there is no financial interest to report.


 Open access