
46.1 Introduction
46.1.1 The Nature of Rhythm and Its Measurability
‘Rhythm’ in the study of spoken language is used in many different contexts – for example, as an aesthetic property, as a manifestation of a foreign accent, or as a feature of language typology (Hoeqvist, Reference Hoeqvist1983; Barry et al., Reference Barry, Andreeva and Koreman2009; Koreman et al., Reference Koreman, Van Dommelen, Sikveland, Andreeva and Barry2009). What is meant by ‘rhythm’ in these different contexts is primarily an auditory property.Footnote 1
Phonetic studies of rhythm have recently focused on measurable properties, more specifically, on the durational characteristics of speech (Low, Reference Low1998; Grabe et al., Reference Grabe, Post and Watson1999; Low and Grabe, Reference Low and Grabe1999; Deterding, Reference Deterding2001; Gibbon and Gut, Reference Gibbon and Gut2001; Low et al., Reference Low, Grabe and Nolan2001; Grabe, Reference Grabe, Low, Gussenhoven and Warner2002; Asu and Nolan, Reference Asu and Nolan2005; Russo and Barry, Reference Russo, Barry and Russo2010; see also Chapter 30). This is immediately understandable and plausible in the light of the early, auditory-based statements. Additionally, the concept of an acoustic foundation underpinning auditory language–rhythm discrimination further supports this idea, which reduced rhythmic differences between languages to syllable-timed – that is, with a claim of approximately equal syllabic intervals, or syllabic isochrony – and stress-timed – that is, with a claim of roughly equal foot intervals and reduced syllable durations between the accented syllables (Lloyd, Reference Lloyd1940; Abercrombie, Reference Abercrombie1965).
It is now generally accepted that none of the many attempts to find a physical reflex of isochrony have been successful in the past (Bolinger, Reference Bolinger, Abe and Tanekiyo1965; Wenk and Wioland, Reference Wenk and Wioland1982; Roach, Reference Roach and Crystal1982; Dauer, Reference Dauer1983, Reference Dauer1987; Manrique and Signorini, Reference Manrique and Signorini1983; Eriksson, Reference Eriksson1992; Deterding, Reference Deterding2001; Gibbon and Gut, Reference Gibbon and Gut2001; Wagner, Reference Wagner and Russo2010). Rhythm is no longer considered as a language primitive but rather as an emergent property, the product of phonological structure and phonetic realization. The shift from isochrony to variability led to the breakdown of the initial dichotomy in auditory perception, causing the disconnection of the syllable from its role as a fundamental unit of rhythm. The concept of syllable and foot regularity has been replaced by the degree of syllabic irregularity depending on the range of syllable complexity, with sub-syllabic durational measures as its acoustic basis (for an additional perspective in neuroscience, consider Chapters 3, 5, and 9; also, for the language acquisition view, see Chapters 35 and 36).
Moving somewhat away from what had been defined in the past as syllabic isochrony in all languages, in the new approaches the measurements of durational variation seem to serve more successfully to separate rhythmic types (Low, Reference Low1998; Ramus, Reference Ramus, Nespor and Mehler1999; Ramus et al., Reference Ramus, Nespor and Mehler1999; Grabe and Low, Reference Grabe, Low, Gussenhoven and Warner2002; Barry et al., Reference Barry, Andreeva, Russo, Dimitrova and Kostadinova2003; Russo and Barry, Reference Russo and Barry2004, Reference Russo and Barry2008a, Reference Russo and Barry2008b; Dellwo, Reference Dellwo, Karnowski and Szigeti2006; Mok and Dellwo, Reference Mok and Dellwo2008).
Speech is rhythmically structured in time (Chapter 32; Arvaniti, Reference Arvaniti1994, Reference Arvaniti2009; Cutler, Reference Cutler1994; Barry et al., Reference Barry, Andreeva, Russo, Dimitrova and Kostadinova2003; Russo and Barry, Reference Russo and Barry2008a, Reference Russo and Barry2008b, Reference Russo, Barry and Russo2010; Cummins, Reference Cummins2009; Barry and Andreeva, Reference Barry, Andreeva and Russo2010; Wagner, Reference Wagner and Russo2010). We expect a temporal regularity in the prominent syllables produced in natural, communicatively meaningful speech (see Chapter 35), given the multi-level nature of accentuation. This expectation holds true even if the acoustic basis of rhythm-carrying prominences does not show predictability in each production parameter (i.e., duration, fundamental frequency, intensity, and spectral definition). In a language without lexical stress, such as French (which features a phrase-final demarcative accent), supra-lexical information-based prominence is observed. It’s notable that accentuation effects in French primarily occur at the ends of phrases or stress groups (see Barry and Andreeva, Reference Barry, Andreeva and Russo2010). This prominence disrupts the typical pattern of temporal regularity (isochrony) in syllable sequences. Moreover, in normal speech (with or without a lexical stress system), the rhythm is still carried by the prominences within utterances, but we can rarely find a pattern of regular beats.
The rhythmic differences between language types should be audibly comprehensible, as well as quantitatively demonstrable. And if rhythm is part of a language, such differences should be related to phonology. This connection becomes effective and plausible because of the concepts of mora, syllable, and foot. Thus, the view has grown that the rhythmic character of a language is an emergent property, the product of phonological structure and post-lexical processes in speech production (Bolinger, Reference Bolinger, Abe and Tanekiyo1965; Dauer, Reference Dauer1983, Reference Dauer1987; Low, Reference Low1998; Ramus et al., Reference Ramus, Nespor and Mehler1999; Grabe and Low, Reference Grabe, Low, Gussenhoven and Warner2002; Barry and Russo, Reference Barry, Andreeva, Russo, Dimitrova and Kostadinova2003; Wagner, Reference Wagner and Russo2010).Footnote 2 In the task of rhythm measurement, prosodic patterns serve as a guiding factor. This implies that maintaining some degree of isochrony is crucial for the effective functioning of the rhythmic predictor, as rhythmic measurements capture two levels of speech organization. These measurements encompass both segmental and prosodic syllabic structures embedded within phrasal prosody (Couper-Kuhlen, Reference Couper-Kuhlen1993; Auer et al., Reference Auer, Couper-Kuhlen and Müller1999; Barry et al., Reference Barry, Andreeva and Koreman2009).
It is well known that rhythm measures have been conceived to capture the rhythm typology of different languages. They aim to assign the rhythm of an utterance to either the syllable-timed pole, characterized by less variability in vocalic durations, or to the stress-timed pole, which features greater variability in vocalic durations along the rhythmic continuum. Structurally based measures, which basically focus on different degrees of deviation from physical isochrony, appear to have been much more successful in differentiating languages’ rhythmicity (Ramus, Reference Ramus, Nespor and Mehler1999; Ramus et al., Reference Ramus, Nespor and Mehler1999; Low et al., Reference Low, Grabe and Nolan2001; Grabe and Low, Reference Grabe, Low, Gussenhoven and Warner2002; Barry and Russo, Reference Barry, Andreeva, Russo, Dimitrova and Kostadinova2003; Barry et al., Reference Barry, Andreeva, Russo, Dimitrova and Kostadinova2003; Kohler, Reference Kohler2009; Nolan and Asu, Reference Nolan and Asu2009; Chapter 30): Ramus’ delta values (∆C and ∆V) (see Ramus, Reference Ramus, Nespor and Mehler1999; Ramus et al., Reference Ramus, Nespor and Mehler1999), the standard deviation of the vocalic and consonantal intervals within an utterance, with in addition a measure of the vocalic proportion of the utterance (%V); and the pairwise variability indices (PVI) (Low et al., Reference Low, Grabe and Nolan2001).Footnote 3
These measures capture separately the degree of variability in the vocalic intervals (vowel duration, PVI-V, ∆V, etc.) and the intervocalic (consonantal) intervals (PVI-C, ∆C, etc.). They represent a reflection of the structural properties of the syllables. This seems to contradict the common assumption of isochrony theory, according to which the syllabic unit is the important element at the basis of rhythmic impression, although, of course, there are measures also based on variability in syllable duration.
Languages cannot be classified solely based on isochrony measures. However, they can be classified using both Ramus’ and Low’s structural measures (Ramus, Reference Ramus, Nespor and Mehler1999; Grabe and Low, Reference Grabe, Low, Gussenhoven and Warner2002; etc.). These measures visualize the stress-timed–syllable-timed continuum, identifying vocalic and consonantal dimensions along which any language might deviate from the prototypical rhythm in a sort of rhythm space (see Barry and Andreeva, Reference Barry, Andreeva and Russo2010).Footnote 4 These rhythmic measures capture various aspects of syllable complexity, making them suitable for comparing languages. These differences in complexity also impact the time required for articulating a syllable. These variability-based rhythm measures (PVI, ∆C, and ∆V) capture durational differences between consecutive vocalic and intervocalic intervals, which are correlated with differences in syllabic structure and the durational effects of degrees of prominence. However, rhythm measures, which focus on variability rather than isochrony (i.e., on the durational consequences of differences in syllable structure and phrasal modification), exhibit a less obvious connection between auditory impressions and physical measures (Barry and Russo, Reference Barry, Andreeva, Russo, Dimitrova and Kostadinova2003; Barry et al., Reference Barry, Andreeva, Russo, Dimitrova and Kostadinova2003; Asu and Nolan, Reference Asu and Nolan2005; Dellwo, Reference Dellwo, Karnowski and Szigeti2006; Mok and Dellwo, Reference Mok and Dellwo2008). Arvaniti (Reference Arvaniti2009) pointed out that there are no objective criteria for postulating a convincing degree of proximity or distance between measures to support a grouping or separation of languages. It’s important to acknowledge the challenge of relating recent rhythmic measures to any auditory perception of rhythm. As a result, we must question whether languages can truly be reliably differentiated based on such measures (Arvaniti, Reference Arvaniti2009; Barry et al., Reference Barry, Andreeva and Koreman2009; Russo and Barry, Reference Russo, Barry and Russo2010; Chapter 30).
46.1.2 Speech Rhythm and the Speech Rhythm Space in Stuttering
Speech impairments can have an impact on rhythm. This is particularly evident in the case of stuttering, a motor control disorder that affects 1% of the global population (Yairi and Ambrose, Reference Yairi and Ambrose2013). Stuttering speech is characterized by the presence of disfluencies, including repetitions of segments/sounds, syllables, words, prolongations of sounds, and interruptions (silent blocks), which can also manifest themselves as a glottal stop in the pre-phonatory posture (Guitar, Reference Guitar2013; Monfrais-Pfauwadel, Reference Monfrais-Pfauwadel2014; Onslow, Reference Onslow2020). Consequently, predictive rhythmic timing is malfunctioning in stuttering children, adolescents, and adults, since their ability in rhythmic speech production and timing is compromised.
People who stutter know exactly what they want to say but are temporarily unable to articulate their speech due to muscle contractions. This sets them apart from non-stuttering individuals who also produce disfluencies, which are more reflective of lexical search or lexical planning time (Lickley, Reference Lickley, Bertini, Celata, Lenoci, Meluzzi and Ricci2018). Being hindered from producing their speech can lead to negative feelings in people who stutter, such as frustration or embarrassment, to the point where speakers may fear speaking up, avoid eye contact with their interlocutor, and/or isolate themselves.
There are two types of stuttering: developmental stuttering and acquired stuttering. Developmental stuttering typically begins between the ages of two and seven and disappears in 80% of cases. Acquired stuttering is a generic term for all stutters that are not developmental. It can be caused by a stroke, tumour, head injury, side effects of certain medications, and so on (Guitar, Reference Guitar2013).
In this chapter, we will focus solely on developmental stuttering. Its origin is multifactorial, involving neurological (Etchell et al., Reference Etchell, Civier, Ballard and Sowman2018) and genetic factors (Riaz et al., Reference Riaz, Steinberg and Ahmad2005; Domingues and Drayna, Reference Domingues and Drayna2015). Apart from these aspects, stuttering is also influenced by several linguistic and/or phonetic factors (Howell et al., Reference Howell, Au-Yeung and Sackin1999; Au-Yeung et al., Reference Au-Yeung, Vallejo Gomez and Howell2003; Buhr and Zebrowski, Reference Buhr and Zebrowski2009). This speech disorder primarily affects the first syllable at the beginning of a turn-taking (Monfrais-Pfauwadel, Reference Monfrais-Pfauwadel2014). Lexical words such as nouns and verbs tend to be more disfluent in adults who stutter compared to functional words. Similarly, stressed syllables are more difficult to pronounce for people who stutter compared to unstressed syllables. Moreover, typical stuttering disfluencies have the peculiarity of being able to break within syllables instead of occurring between syllables or words. They are usually accompanied by tension that may be audible.
Stuttering has an impact on the timing and rhythmic flow of production since it affects timing mechanisms (Guitar, Reference Guitar2013; Monfrais-Pfauwadel, Reference Monfrais-Pfauwadel2014; see DSM-5 in Crocq et al., Reference Crocq, Guelfi, Boyer, Pull and Pull-Erpelding2015; Didirková et al., Reference Didirková, Le Maguer and Hirsch2021).Footnote 5 We know, for example, that the oro-laryngeal timing of people who stutter has particular characteristics. In particular, voice onset time (VOT) and voice termination time (VTT) are longer in this category of speakers than in people who do not stutter (Agnello, Reference Agnello, Webster and Furst1975). Other research, based on electromagnetic articulography (EMA) data, has shown breaks in articulatory timing at the supraglottal level (Didirková et al., Reference Didirková, Le Maguer and Hirsch2021). Stuttering demands a temporal adaptation from speakers when synchronizing rhythmical movements to provide a structural grid of regularity and recurrence. Stuttering affects notably the background of regularity (i.e., the underlying rhythm of speech), the sequences of evenly spaced phonetic material, matched segments, and syllables. Thus, it can be defined as a neurodevelopmental disorder that disrupts the temporal organization of speech. Monfrais-Pfauwadel (Reference Monfrais-Pfauwadel2014: 2) speaks of audible and perceptible traces of motor and then psychic struggle in contrast with normal speakers. This is consistent with accounts of interruptions (freezing) in stuttering (see Assaneo and Poeppel, Reference Assaneo and Poeppel2018; Alm, Reference Alm2021; Orpella et al., Reference Orpella, Flick and Assaneo2024 on the interaction between auditory and speech-motor cortices, and the synchronization between auditory and speech-motor regions related to speech rates). Orpella et al. (Reference Orpella, Flick and Assaneo2024) suggest that there is a reactive inhibitory control response from stutterers when they produce a word that will likely be stuttered. Technically, persons who stutter (PWS) show deactivation of left-hemisphere sensorimotor structures and overactivation of right-hemisphere parts. The problem is due to a lack of motor integration to regulate the movements of speech.
Studies on PWS have evaluated the speech on rhythmic measures such as rate. They have already shown that people who stutter do not use a typical tempo in speech and do not have a rhythmic speech (Boecher et al., Reference Boecher, Franich and Usler2022). PWS have specific patterns in perceptually non-fluent speech, mainly characterized by a lack of coordination between supraglottal articulations and laryngeal gestures; they have a longer laryngeal movement reaction, compared with fluent speech produced by persons who do not stutter (PWNS) (Zimmermann, Reference Zimmermann1980; Van Lieshout et al., Reference Van Lieshout, Hulstijn and Peters1996; Max and Gracco, Reference Max and Gracco2005; Heyde et al., Reference Heyde, Scobbie, Lickley and Drake2016; Didirková et al., Reference Didirková, Le Maguer and Hirsch2021). This affects the temporal variability of oral articulations and the speech rate. A longer duration of onset movements than in PWNS, closing gestures, complex consonant clusters, or vowel nuclei are encouraged by the steady position of the phonatory system, lips, or jaws. In PWS some articulatory movements show high velocity despite lower tempo, a negative correlation that could reflect defective speech–brain synchronization; in line with this proposal, the brains of PWS seem to exhibit alterations, resulting in less stable speech-motor planning and execution (Alm, Reference Alm2004, Reference Alm2021; Alario et al., Reference Alario, Chainay, Lehericy and Cohen2006). These factors lead PWS to asynchronous movements and a variable articulatory behaviour. Consequences of this are the stuttering-like disfluencies mentioned above and the difficulties for PWS to increase their speech rate (Howell et al., Reference Howell, Au-Yeung and Sackin1999). Thus, PWS show a poor temporal coordination, variable gestural movements, and a dysfunctional inter-articulatory coordination (Didirková et al., Reference Didirková, Le Maguer and Hirsch2021).
The aim of this chapter is to study how rhythm is disrupted in stuttering speech by comparing adults who stutter (PWS) with typically developing adults (PWNS) (n = 14 per group). We assess simple and complex rhythmic chunks to achieve this. Speech rhythm has been quantified using rhythmic measures (the PVI from Grabe and Low, Reference Grabe, Low, Gussenhoven and Warner2002; ∆V and ∆C from Ramus, Reference Ramus, Nespor and Mehler1999; Ramus et al., Reference Ramus, Nespor and Mehler1999). Both PVI and ∆V/∆C provide a diagnostic frame for identifying the two-dimensional presentation of the values (vocalic or consonantal) along which stuttered speech deviates from the prototypical normal speech.
46.1.3 Methods
Among the types of stuttering described in the literature (Yairi and Ambrose, Reference Yairi and Ambrose2013; Ward, Reference Ward2018), our study deals with persistent developmental stuttering, which generally starts between ages three and seven and remains persistent from adolescence to adulthood (Didirková et al., Reference Didirková, Le Maguer and Hirsch2021). A corpus study was conducted, and the raw and normalized pairwise variability index (nPVI) was computed for individual utterances to distinguish PWS from PWNS. We quantified rhythmicity in the speech of PWS using PWNS as control subjects.
46.1.4 Corpus and Participants
Our corpus investigation is based on audiovisual recordings coming from the French ANR project under grant no. ANR-18-CE36–0008 (BENEPHIDIRE: Bégaiement: la Neurologie, la Phonétique, l’Informatique pour son Diagnostic et sa Rééducation, PI: Fabrice HirschFootnote 6). The main objective of this ANR project is to enhance our understanding of stuttering to facilitate diagnosis and treatment of this disorder by speech-language therapists. To collect the data, a multidisciplinary team, composed of researchers in linguistics, computer scientists, neurologists, along with therapists specialized in treating this disorder, was assembled. This ANR project acquired morphological brain-imaging data, articulatory data using dynamic MRI, and acoustic data.Footnote 7 Our study is part of the work package aimed at studying the acoustic and motor characteristics of disfluencies.
We analysed data from 28 French native speakers (14 males and females who stutter; 14 males and females who do not stutterFootnote 8), who participated in an interview task conducted by a speech pathologist (a phoniatrist), accompanied by a speech therapist. The French treatment model is based on a relaxed style of interacting and motor rehabilitation in order (1) to reduce avoidance of speaking and (2) to develop gradually normal speech and to eliminate negative feelings. The therapy aims at restoring flexible and spontaneous speech that allows patients to express themselves even when disfluencies persist in conversational settings with smooth transitioning between listening and speaking.
The participants were asked by a phoniatrist to perform several tasks in the way of semi-directed speech and reading. The semi-spontaneous speech focuses on the description of a typical day, hobbies, Covid period and life, the emotional experience of the person with stuttering. Participants (PWS and PWNS) completed the interview task and a reading passage during the same interview under clinical test-taking conditions. Thus, PWS and PWNS participants were engaged in an in-person conversation. Control participants completed the same tasks and reading passage as PWS and matched the same questions. We measured for each speaker 13 minutes of the interview task, distributed over nine minutes of semi-spontaneous speech and four minutes of the reading task. The task also included a syllable-timed speech test as a training device aimed at enhancing speech in PWS. With this device, PWS were pushed to produce their speech with more isochronous intervals. The stuttering of our PWS was evaluated as severe by their speech therapist on the Riley’s Stuttering Severity Instrument scale (Riley, Reference Riley1994).
In the following sections we show the analysis conducted on four speakers (two per group PWS and PWNS).Footnote 9 We extracted 229 spontaneous speech samples from the recorded interviews. All samples were longer than four syllables (ips = inter-pause stretches > four syllables), matched for length and tasks in terms of PWNS. The ips are the utterance units used for calculating individual rhythm measures, which are then grouped and averaged over speakers. In addition to spontaneous speech, a total of 79 read speech samples were extracted.
46.2 Analysis
The use of purely durational measures to capture the rhythmic effects might appear like an oversimplification, but in fact many structural properties of speech are linkable to duration (i.e., length properties). In PWS, there is a reduced amount of time available for articulatory gestures. The reduction in articulatory time leads to articulatory changes. These changes in articulation affect the quality of vowels and consonants. Additionally, alterations in speech timing occur as a result of these changes. This is why word length has also increased the rhythmic variability in PWS.
We used two approaches in our study: an automatic analysis and a manual analysis. Data analysis relied first on the auditory and acoustic identification of stuttered utterances. The manual method allowed us to better highlight the stuttered sequences. Phrase boundaries were defined for utterances as syntactic boundaries or pauses (typical disfluencies) produced by the speaker. For our rhythmic computation, non-pathological disfluencies, revisions, or filler pauses were removed from measures, so it was possible to identify prosodically uninterrupted ‘inter-pause stretches’ (ips), while stuttered (supraglottal) disfluencies within phrase boundaries were considered as part of segmental stutterers’ production.Footnote 10 Therefore, we assume that stuttering-like disfluencies, segment/syllable repetitions, prolongations, and stuttering blocks count for rhythmic intervals.Footnote 11
This extraction process was performed using the speech editor Praat (software version 6.3.09).Footnote 12 We compared the duration of acoustic segments in the speech of PWS prior to and following the use of speech techniques, that is, the automatic speech recognition and rhythm quantification based on the variability of vocalic and intervocalic intervals (see Section 46.1). The segmentation, aligned with the speech signal, was based on an acoustic-perceptive identification, as well as on automatic segmentation (see below).
This section also provides acoustical evidence for some basic differences in the syllable structure of PWS and PWNS, which can be expected to result in systematically divergent rhythmic measures. We applied the following method. The extracted speech samples were transcribed orthographically using an automatic speech recognition system called Whisper, an open-source project available at https://github.com/openai/whisper. The transcription was saved as a text file (.txt). For the purpose of this work, audio recordings were converted to .wav format and analysed in Praat. The entire corpus was first transcribed orthographically in automatic mode (see below) before being segmented and annotated semi-automatically using Praat.
After transcription, the speech samples were automatically segmented into phonetic and word segments using the WebMAUS Basic Service, a web-based tool provided by the Phonetics and Phonology Group at the Ludwig Maximilian University of Munich. Its interface can be accessed at https://clarin.phonetik.uni-muenchen.de/BASWebServices/interface/WebMAUSBasic. The transcription and segmentation results were then manually verified and corrected if necessary, ensuring the accuracy of the data. All segmentation boundaries were moved to their nearest zero-crossings using a Praat script called ‘move-to-zero.praat’ (see Figure 46.1, tiers 1, 2, 3).Footnote 13 A fourth tier was inserted to label all segmental events as a consonant or a vowel based on the phonetic transcription in the third tier (see Figure 46.1, tier 4) using a Praat script called ‘relabel_merge_interval.praat’.Footnote 14
Spectrogram: tiers and intervals.
Spectrogram illustrating characteristic disfluencies in the speech of a PWS, including prolonged intervals and atypical rhythm patterns. Visible disruptions in speech flow are evidenced by irregular spacing between phonetic elements, reflecting the temporal dynamics of stuttering. Vocalic and intervocalic intervals on tier 5.
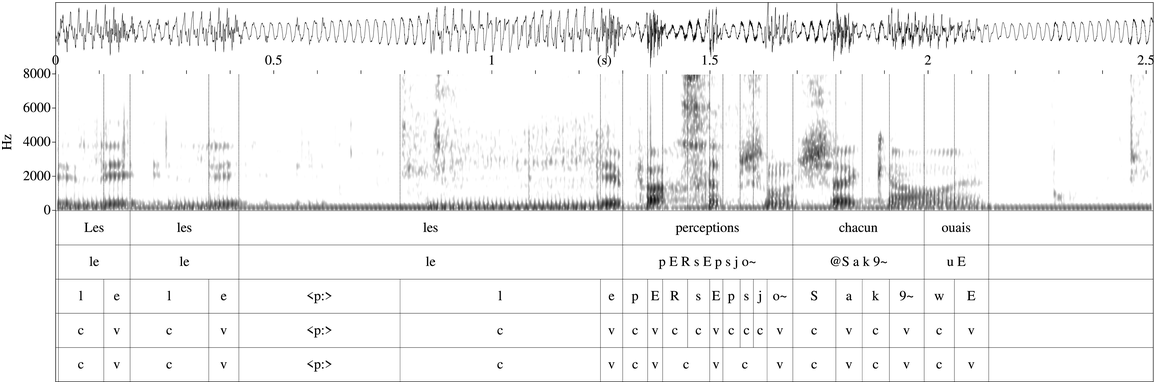
Various X-SAMPA symbols were employed for annotation purposes in our study, such as in Figure 46.1 (see <p:> for stuttered pause).Footnote 15 The tier 5 in Figure 46.1 indicates the interval, whether it is vocalic or intervocalic (= consonantal). For more details on the definition of vocalic and intervocalic intervals see Section 46.2.3.Footnote 16 The specific annotation tier 5 was added to identify the stuttered PVI interval. This includes stuttered disfluencies, such as prolongations (consonantal and vocalic lengthening such as [kkkkkɑ̃] ‘when’, [ssssssɥi] ‘(I) am’, i.e., elongations of a sound); repetitions (segments, syllables, words) annotated on to interval measures for PWS; and blocks in utterance-internal phrase if any (silent intervals between two segments or syllables, combined with spasmodic tension and movements; see Didirková and Hirsch, Reference Didirková and Hirsch2020; Didirková et al., Reference Didirková, Le Maguer and Hirsch2021; also see Figures 46.2 and 46.3).
Spectrogram: stuttering on consonants (speaker B31).
Spectrogram of stuttered speech. This visual representation captures the prolonged and repeated articulations typically seen in PWS, such as extended consonant intervals and the irregular vocalic segments, reflecting the disrupted timing and rhythm patterns that challenge the regular speech flow.

Spectrogram: stuttering on vowels at the beginning of the utterance (speaker 00001bis).
Spectrogram highlighting the pattern of stuttering on vowels at the beginning of an utterance in a person who stutters. The image showcases the characteristic stuttering disfluencies including a high number of repetitions, prolongations, and blocks, illustrating the unique temporal dynamics and rhythm disruptions encountered in stuttered speech.

A high number of repetitions, prolongations, and blocks were identified in our analysis. By ‘stuttered’ block, we mean a disfluency made up of a silent duration between two segments or syllables associated with tension, whereas the stuttered prolongations are identified as an identical structure of the formants (for vowels and sonorants) or spectral cues typical of a consonantal sound. Stuttered disfluencies are only produced by PWS.
46.2.1 Rhythm Measurements and the PVI: A Quantitative Analysis
We highlight that the rhythmic measures introduced in Section 46.1, such as PVI-V and ∆V, reflect differences between languages with only single-slot syllabic nuclei and those with single and double-slot nuclei. Additionally, PVI-C and ∆C measures are sensitive to differences in onset and coda structure (see Russo and Barry, Reference Russo, Barry and Russo2010). Thus, a language with more variable onset and coda structure, long and short vowels, and a reduction of unstressed syllables will generate higher variability measures than a language without such features. Furthermore, it’s important to note that the same rhythmic measures, calculated for the same language but from two different corpora, can result in radically different typological associations in terms of rhythmicity.
We calculated the variability of vowel and consonantal duration and computed rhythmicity of the PWS utterances, adopting the PVI methodology first proposed by Grabe and Low (Reference Grabe, Low, Gussenhoven and Warner2002) to measure rhythmic duration. The basic hypothesis to be tested is that the range of vowel variability, consonantal duration, possible syllable complexity, and other phonological differences between PWS and PWNS lead to an important difference in the rhythm measures between groups. Quantified rhythmicity thus depends on the intersection of multiple parameters, and it is defined in terms of degree rather than rhythmic dichotomy (see Barry and Andreeva, Reference Barry, Andreeva and Russo2010).
The rhythmic nature of the speech alterations in stuttering also leads us to some understanding of the cognitive phonological processes behind the behavioural PWS data. We conducted measurements on vocalic intervals and the intervals between vowels (excluding ‘normal’ disfluencies, such as pauses and hesitations) within a speech passage. We calculated the PVI, the mean difference in vocalic and intervocalic intervals from one vowel or one consonantal interval to another (raw PVI (rPVI) and normalized PVI (nPVI)).
This index of variation quantifies the extent of variability observed in consecutive measurements. Equation (1) provides the rPVI.
(1)


where m is the number of intervals and dk is the duration of the k-th interval. In (1), rPVI (PVI-C) is not normalized for speech rate. However, a normalized PVI, which relates the difference between intervals to the mean duration of the two intervals, was introduced by Deterding (Reference Deterding2001) (cf. Low et al., Reference Low, Grabe and Nolan2001) as an explicit correction for tempo change.Footnote 17 Thus, speech rhythm was quantified in our study between successive vowels also using the nPVI. This nPVI version is represented by the following equation in (2) (see Deterding, Reference Deterding2001; Barry and Russo, Reference Barry, Andreeva, Russo, Dimitrova and Kostadinova2003; Russo and Barry, Reference Russo and Barry2008a, Reference Russo and Barry2008b, Reference Russo, Barry and Russo2010; among others).
(2) nPVI
In (2), the duration (d) of a vowel (k + 1) is subtracted from the duration of the preceding vowel (k) and divided by their average duration. The absolute values of the resulting subtotals are summed up and divided by the number of vowels in the phrase (m) minus one. The result is multiplied by 100 to obtain a normalized score.
The normalization method used for PVI-V (but not for PVI-C) shows that the nPVI-V reduces local inter-syllabic differences, such as stressed versus unstressed or short versus long vowel, which are essential cues of rhythmic impressions. Thus, the range of vowel variability is generally reduced in comparison to Ramus measures (∆V and ∆V; see Section 46.3), but, as will be shown below, its sensitivity to tempo effects remains.
PVI-V captures the degree to which consecutive vowel durations vary: (a) long versus short vowels, b) phonetic variation due to differences in degree of aperture – the effects of phrasal accentuation. The PVI-C captures, on the other hand, the degree to which consecutive consonantal durations vary (e.g., single consonants or consonant clusters). PVI-V and PVI-C provide a measure of variation that takes the sequential nature of rhythmic impressions into consideration. The PVI-C measure captures the degree to which consecutive consonantal durations vary (i.e., single consonants or clusters).
We performed all the calculations of rPVI and nPVI for vocalic and intervocalic intervals using R Core Team (2021). Vocalic intervals were identified as the portion of the signal between the onset and offset of a vowel, characterized by vowel formants. This definition encompassed sections with varying numbers of vowels, including monophthongs or multiple vowels spanning across the transition between adjacent words.
Intervocalic intervals, on the other hand, were defined as the segment of the signal between the offset of one vowel and the onset of the subsequent vowel, regardless of the number of intervening consonants. To measure the duration of both vocalic and intervocalic intervals, we employed a left-to-right approach using wideband spectrograms in Praat. Our first query was whether r/nPVI were different between PWS and PWNS. The higher values of rPVI-C (as for ∆C) indicate that PWS speech is sensitive to complex consonantal structures in the onset and coda of a syllabic structure, as commonly found in languages with a predominant C(C)VC(C) structure.
To offer a broader perspective and some possibility for comparison, we calculated (in Section 46.3) both the sequentially calculated pairwise variability measures (PVI) using the pairwise normalization procedure for vowels (Grabe and Low, Reference Grabe, Low, Gussenhoven and Warner2002) and the three global measures used by Ramus et al. (Reference Ramus, Nespor and Mehler1999) applied to both stuttering and normal speech and the speech rate (the number of vowel intervals per second, including pauses) (3).
(3) Ramus measures
%V (within ips = inter-pause stretches)
∆V – standard deviation of vocalic intervals
∆C – standard deviation of intervocalic intervals
The variability of vocalic and intervocalic (consonantal) intervals are taken by both Ramus and by Grabe and Low as correlates of the complex interaction of structural properties. However, their way of calculating the variability is different. The Ramus %V measure does not capture variation, and ∆V and ∆C are measures of overall vocalic and consonantal variation rather than an accumulative pairwise measure. The vocalic proportion of the utterance (%V), as a measure, is difficult to interpret in connection with any concept of rhythm.
46.3 Results
In this section, we present the results of stuttered speech from two speakers, comparing them with two non-stuttering speakers. The sample size is insufficient to conduct inferential statistical analyses. Therefore, we provide only descriptive statistics, including percentages and standard deviations, following the approach outlined by Ramus et al. (Reference Ramus, Nespor and Mehler1999). We also report observations of rPVI and nPVI across different speech conditions (stuttered versus fluent) and speech styles (read versus spontaneous). Moreover, we examine differences among individual speakers. We computed the average duration of speeches, including both fluent and stuttered speech, categorized according to various contextual factors. Error bars on the graph depict the standard error of the mean (SEM).
In Table 46.1 and Figure 46.4 we display the outcomes for our four speakers (two per group, PWS and PWNS). These results include the standard deviation of durations for vowel and intervocalic consonantal intervals (∆V and ∆C, respectively, shown in Figure 46.4), alongside the percentage of vowel intervals (%V) and consonantal intervals (%C) within ips. Additionally, we detail the proportion and standard deviation of computed pauses and hesitations.
Comparative analysis of vocalic and intervocalic intervals, pauses, and hesitations in stuttered versus normal speech. This table presents the percentages of vocalic intervals (%V) and intervocalic intervals (%C), as well as the proportions of pauses and hesitations, for both PWS and PWNS.
| Stuttering | Normal speech | |
|---|---|---|
| Intervocalic | 46.4% | 48% |
| Vocalic | 48.3% | 49.9% |
| Pauses | 2.5% | 1% |
| Hesitations | 2.7% | 0.45% |
Average standard deviation of vocalic intervals, intervocalic intervals, duration of pauses, and duration of hesitations.
Variability in speech patterns: comparing standard deviation of speech components between PWS and PWNS. This bar graph quantifies the standard deviation for vocalic intervals, intervocalic intervals, pauses, and hesitations. The data show PWS experience more variability in the duration of pauses and hesitations, indicative of stuttering disfluencies. PWNS show lower standard deviation in both vocalic and intervocalic intervals, indicating more consistent timing. This increased variability in intervocalic intervals among PWS suggests a disruption in speech rhythm typical of stuttering patterns.

Figure 46.4 Long description
The bars represent normal and stutter, respectively. The values of standard deviation are as follows. Stutter: Hesitation, 280. Pause; 280. Intervocalic; 170. Vocalic, 150. Normal: Pause; 140. Hesitation, 120. Vocalic, 70. Intervocalic; 65. The values are estimated.
The calculations in Table 46.1 show that stuttered speech exhibits a higher percentage of pauses and hesitations compared to normal speech. Notably, the percentage of vocalic intervals (%V) remains consistently reliable across our speakers. Measures such as %C and %V do not effectively differentiate between PWS and PWNS. In contrast, stuttering disfluencies prove to be more distinguishing factors between the two groups. In Figure 46.4, the average and standard deviation of vocalic intervals, intervocalic intervals, duration of pauses, and hesitations show differences for ∆V and ∆C. The differences observed in the average and standard deviation (∆V and ∆C) between PWS and PWNS can be attributed to the distinct speech patterns associated with stuttering: disfluencies (such as repetitions, prolongations, and blocks) can lead to differences in the timing and duration of vocalic intervals and consonantal intervals between the two groups. PWS exhibit more variability (higher standard deviation) in these intervals due to the interruptions caused by disfluencies. Stuttering involves disruptions in the neural processes responsible for speech production and motor control. These disruptions can lead to inconsistencies and variability in the timing and duration of speech intervals, as well as in the deviation of these intervals from the expected norms.
In Figure 46.4, we see that PWNS have a lower standard deviation in vocalic intervals than PWS. This suggests that PWNS have less variability in the duration of their vocalic intervals. The standard deviation for intervocalic intervals is lower for PWNS compared to those who stutter, which again indicates less variability for the non-stuttering group in the timing between vowels across consonants. For the duration of pauses, the standard deviation is higher for PWS. This implies that the length of pauses among PWS varies more than PWNS. Furthermore, Figure 46.4 shows a higher standard deviation for PWS in the duration of hesitations, suggesting greater variability compared to PWNS. Thus, it appears that PWS have more variability in the duration of their pauses and hesitations but less variability in vocalic and intervocalic intervals compared to PWNS. This could reflect a compensation mechanism where PWS try to maintain a steadier rhythm in some speech components while experiencing more variability in others, as a response to the disruptions caused by stuttering.
Figure 46.5 presents the average duration of various speech elements for PWS and PWNS, categorized according to different contextual factors such as vocalic and intervocalic intervals, pauses, and hesitation, with error bars indicating the SEM. We observe the following. For the vocalic intervals, both PWS and PWNS show relatively short average durations, with PWS having slightly longer vocalic intervals on average, as indicated by the error bars; for the intervocalic intervals, again PWS show longer average duration compared to PWNS. The average duration of pauses is notably longer for PWS. This difference is clearer, as shown by the lack of overlap in the error bars. There is a significant difference in the average duration of hesitations, with PWS showing much longer durations. This is due to the individual’s attempt to avoid or postpone stuttering events, which results in prolonged filler sounds or silent blocks. The error bars indicate the variability of each measurement, and we can see that there is greater variability in the duration of hesitations for both groups, but it is most pronounced in PWS. This aligns with the variable nature of stuttering and how it can impact different aspects of speech timing. Overall, PWS tend to have longer durations of pauses and hesitations, which can be attributed to the speech disfluencies characteristic of stuttering.
Average duration of speech according to vocalic intervals, intervocalic intervals, pauses, and hesitation.
Comparative duration of speech elements in stuttering and normal speech. This bar chart presents the mean durations of vocalic and intervocalic intervals, pauses, and hesitations for both normal speakers and PWS. PWS demonstrate longer and more variable durations for pauses and hesitations, highlighting the temporal disruption characteristic of stuttered speech.

Figure 46.5 Long description
The bars represent normal and stutter, respectively. The mean values of duration are as follows. Stutter: Hesitation, 812.5. Pause; 500. Intervocalic; 125. Vocalic, 125. Normal: Hesitation; 375. Pause, 175. Vocalic, 100. Intervocalic; 100. The values are estimated.
In Figure 46.6, the standard deviation of vocalic and intervocalic intervals, as well as the duration of pauses and hesitations, are compared across read and spontaneous speech modalities for PWS and PWNS. This figure presents a clear distinction between read and spontaneous speech, showing that the rhythmic measures are indeed text-dependent. In the context of read speech, PWS show higher standard deviation compared to PWNS, suggesting more variability in the duration when reading. For intervocalic intervals, again, PWS display higher standard deviation during read speech, indicating more inconsistency in the timing between vowels across consonants. For PWS, the standard deviation for pauses is higher compared to PWNS, indicating that even in a controlled reading environment, PWS exhibit more variability in their pausing. There is a significant increase in the standard deviation of pauses for PWS during reading tasks. For hesitations, PWS have a notably higher standard deviation, reflecting much more variability in the occurrence and duration of hesitations when compared to PWNS in read speech. In spontaneous speech, the variability in the duration of vocalic intervals for PWS increases further, as evidenced by the standard deviation, surpassing that of PWNS. Similarly, the standard deviation for PWS in intervocalic intervals during spontaneous speech is greater than for PWNS, indicating a heightened level of variability. The variability in pauses for PWS in spontaneous speech also increases, maintaining a higher standard deviation compared to PWNS. The standard deviation of hesitations in spontaneous speech for PWS is significantly higher than for PWNS. We use here ‘significantly higher’ in a descriptive sense, observing that Figure 46.6 indicates a noticeably larger standard deviation for PWS, which suggests more variability in their hesitations during spontaneous speech compared to PWNS.
Effect of speech style: read and spontaneous.
Variability in speech components during read and spontaneous speech. The bar graph compares the standard deviation of vocalic and intervocalic intervals, pauses, and hesitations for both PWS and PWNS across read and spontaneous speaking tasks. Notably, PWS exhibit a higher standard deviation in intervocalic intervals than PWNS in both speech contexts, which is indicative of greater timing irregularities during stuttered speech. This variability is more pronounced during spontaneous speech, suggesting that unplanned speaking poses additional challenges for PWS.

Figure 46.6 Long description
The bars represent normal and stutter, respectively. The values of standard deviation are as follows. Left. Stutter: Pause; 280. Vocalic, 170. Intervocalic; 120. Normal: Pause, 125. Vocalic, 50. Intervocalic; 40. Right. Stutter: Hesitation; 300. Pause; 270. Intervocalic, 170. Vocalic, 130. Normal: Pause, 152. Hesitation; 120. Vocalic, 80. Intervocalic; 60. The values are estimated.
Figure 46.7 illustrates the mean duration of various speeches (normal and stuttered) within the four contextual categories across distinct speech styles (read and spontaneous), with error bars representing the SEM. For read speech, both PWS and PWNS have similar, relatively short mean durations for vocalic intervals, but PWS have slightly higher variability as indicated by longer error bars. For intervocalic intervals, PWS show longer mean durations with greater variability than PWNS. This may indicate more difficulty in transitioning between sounds. The mean duration of pauses for PWS is much longer than for PWNS, with significantly larger error bars. PWS demonstrate a longer mean duration for hesitations compared to PWNS, along with greater variability, as evidenced by the longer error bars. In spontaneous speech, the mean durations for vocalic intervals are relatively similar between PWS and PWNS; however, PWS exhibit more variability. Again, PWS have longer mean durations for intervocalic intervals than PWNS, with larger error bars indicating more variability. PWS have longer pauses on average than PWNS in spontaneous speech as well, and the variability is quite high. PWS have a notably longer mean duration of hesitations and also show considerable variability in these durations. The error bars suggest that the variability in speech patterns is contextually influenced. The larger error bars for PWS across all categories indicate that stuttered speech is more variable and less predictable than non-stuttered speech, particularly in spontaneous contexts. In Figure 46.7, the intervocalic intervals for PWS appear to have longer mean durations than those for PWNS in both read and spontaneous speech, which could suggest that these intervals are particularly affected by stuttering. The error bars for the PWS group are noticeably longer in the intervocalic category compared to the PWNS group, indicating greater variability around the mean. This greater variability for PWS suggests that intervocalic intervals might be a key area where stuttering manifests, potentially due to the motor coordination needed to transition between sounds or the timing required to articulate consonants that come between vowels.
Mean duration of normal and stuttered speech across read and spontaneous tasks.
Duration of speech elements in read and spontaneous speech. The bar graph illustrates the average duration of vocalic and intervocalic intervals, pauses, and hesitations for PWS compared to PWNS during read and spontaneous speech. The graph indicates that PWS experience longer and more variable durations of these speech components, especially during spontaneous speech, highlighting the increased challenges faced by PWS in real-time conversational contexts.

Figure 46.7 Long description
The bars represent normal and stutter, respectively. The values of duration are as follows. Left. Stutter: Hesitation, 1100. Pause, 480. Vocalic, 175. Intervocalic, 175. Normal: Pause, 100. Vocalic, 80. Intervocalic, 80. Right. Stutter: Hesitation, 700. Pause, 600. Intervocalic, 125. Vocalic, 120. Normal: Hesitation, 300. Pause, 250. Intervocalic, 125. Vocalic, 120. The values are estimated.
The results also show that PWS severely speak with a lower speech rate than speakers who stutter less severely or who speak in a ‘normal’ way, that is, normal subjects;Footnote 18 see Figures 46.8 and 46.9.
Comparison of speech rates between PWNS and PWS.
Speech rate distribution for PWS versus PWNS. This box plot reveals that PWS generally have a slower speech rate than PWNS, as evidenced by the lower median value. The plot also shows a wider range of speech rates among PWS, indicating greater variability within this group.

Speech rate: effect of speech style.
Speech rate in read and spontaneous speech for PWS and PWNS. The box plots compare speech rates, showing that PWS have a consistently slower speech rate than normal speakers in both read and spontaneous speech modes. The wider spread of rates for PWS during spontaneous speech suggests greater variability in speech production when speaking without a script.

Figure 46.9 Long description
Left. The median speech rate for normal and stutter speeches are 5.3 and 2.6, respectively. Right. The median speech rate for normal and stutter speeches are 5.3 and 2.6, respectively. The values are estimated.
We quantified speech rate by dividing the number of vocalic intervals by the total time in seconds of each utterance. The median value, indicated by the line in the middle of each box, is lower for PWS compared to normal speakers. This suggests that, on average, PWS have a slower speech rate. The boxes represent the interquartile range (IQR), which is the middle 50% of the data. The IQR for PWS is narrower and shifted lower on the scale, indicating that most PWS have a lower speech rate compared to most normal speakers. The dot above the ‘normal’ category indicates an outlier, a speech rate that is unusually high compared to the rest of the data for normal speakers. The figure underscores the impact of stuttering on speech rate, showing that stuttering tends to slow down speech and reduce variability in speech rate among PWS. This information is crucial for understanding and developing therapeutic strategies to help PWS manage their speech rate and improve communication effectiveness.
In Figure 46.9, we compare the speech rate of PWNS and PWS during read and spontaneous speech tasks. In read speech, the median speech rate for PWNS is higher than for PWS, indicated by the median line within each box. This suggests that during read tasks, PWS generally speak more slowly. The median speech rate for PWS in spontaneous speech appears to be lower than for PWNS, consistent with the pattern seen in read speech. The IQR for PWS in spontaneous speech is narrower than for PWNS, and the median is lower, reinforcing that PWS have a more confined range of speech rates and generally slower speech. PWS show longer whiskers in spontaneous speech compared to read speech, indicating a broader range of speech rates in spontaneous conditions. However, the median is still lower than that of PWNS, underlining a slower speech rate for PWS. The sequential Grabe and Low variation measures also showed notable effects for intervocalic (consonantal) variation.
In Figure 46.10, we present the PVI results for all utterances, including both raw for consonantal intervals and normalized for vocalic intervals, along with a comparison of rhythm patterns between stuttering and normal speech in both read and spontaneous conditions. Each point in the figure represents the results of individual utterances, with vocalic nPVI values plotted on the vertical axis and intervocalic rPVI values on the horizontal axis.
PVI (raw and normalized) results for all utterances (PWS and PWNS).
PVI in read and spontaneous speech for PWNS and PWS. This scatterplot displays individual utterances, comparing vocalic nPVI and intervocalic rPVI. The data points illustrate that PWS, particularly in spontaneous speech, tend to have higher intervocalic rPVI values, signifying greater variability in the timing of their speech and reflecting the rhythmic irregularities associated with stuttering.
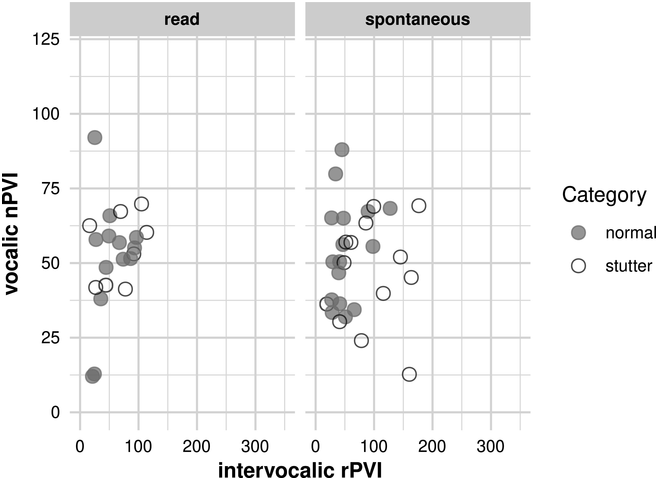
Figure 46.10 Long description
The horizontal axis represents intervocalic r P V I which ranges from 0 through 300. The vertical axis represents vocalic n P V I which ranges from 0 through 125. It plots data points for normal and stutter.
In read speech, PWS tend to have greater variability in both vocalic and intervocalic intervals. In the spontaneous section, while there is some overlap between PWS and PWNS, PWS still tend to show higher vocalic nPVI and intervocalic rPVI values. This suggests that in spontaneous speech, the pattern continues, with PWS displaying greater rhythm variability. In spontaneous speech, points representing PWS are further right on the horizontal axis than those for PWNS; this indicates higher rPVI values for PWS, suggesting greater variability in their intervocalic intervals.
The result from Figure 46.10 regarding rPVI-C is consistent with the acoustic analysis we conducted, and it appears to be correlated with frequent repetitions and prolongations of consonants, especially in onset positions of syllables. Additionally, it is associated with tense pauses (blocks), during which a word sequence fails to initiate.
On the vertical axis, higher points indicate greater variability in vocalic intervals. PWS who have higher nPVI values show more variability in the rhythm of their vocalic intervals. The high nPVI-V values for PWS also reflect prolonged vocalization associated with stuttering, as well as prolonged pauses between vocalization chunks. The higher rPVI-C for PWS is consistent with the presence of speech disfluencies shown above. These disruptions in the speech flow contribute to the irregularity of consonantal intervals, which is captured by a higher rPVI measure.
The figure provides a visual confirmation of these descriptions, showing that stuttered speech can be differentiated from ‘normal’ speech in terms of temporal variability, with PWS generally showing increased variability in rhythm. We subsequently calculated intra-speaker, across-utterance variability. This variability was more pronounced in PWS compared to PWNS. Individuals who stutter exhibited a wide range of rhythmic measurements, both high and low. This is also because rhythm values are a reflection of the language material that occurs in the corpus, and of the style in which the utterances are produced (see Barry and Russo, Reference Barry, Andreeva, Russo, Dimitrova and Kostadinova2003; Russo and Barry, Reference Russo, Barry and Russo2010). Two speakers reading the same two texts can vary significantly, even in different dimensions for different texts, one on the consonant axis, the other on the vowel axis. With spontaneous speech, and speaker variation, it can be expected to be a much higher variability.
In Figure 46.11, we give the average of the PVI results. PWS has high variability in both vocalic and intervocalic intervals, as measured by the nPVI and rPVI, respectively. The figure provides a visual comparison between PWS and PWNS across different speaking conditions, allowing for an analysis of how stuttering may affect speech rhythm in controlled (read) versus natural (spontaneous) settings. Vocalic nPVI values are plotted on the vertical axis against intervocalic rPVI values on the horizontal axis.
PVI results for PWS and PWNS: average (read and spontaneous speech).
Rhythmic variability in speech. The plot illustrates the relationship between vocalic nPVI and intervocalic rPVI for both PWNS and PWS in read and spontaneous speech contexts. Each symbol represents a distinct speech sample, with higher intervocalic rPVI values observed among PWS, especially in spontaneous speech. This indicates a more variable and disrupted speech rhythm in PWS, which contrasts with the more uniform rhythmic pattern seen in normal speakers.
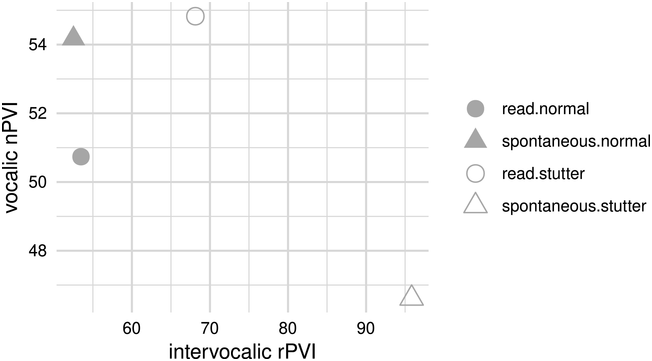
Figure 46.11 Long description
The horizontal axis represents intervocalic r P V I, which ranges from 60 through 90. The vertical axis represents vocalic n P V I, which ranges from 48 through 54. The distribution of data points is as follows. Spontaneous normal, (50, 54). Read Normal, (50, 51). Read Stutter, (55, 70). Spontaneous Stutter, (95, 47). The values are estimated.
PWS and PWNS differ in terms of average PVI in reading and in interview conditions. Read speech has allowed us to identify text-dependent and speaker-dependent differences in rhythm measures. The reading condition revealed less rhythm differences between PWS and PWNS than spontaneous speech. The spread of the point along the horizontal axis suggests that there is some variability in the timing between consonants (intervocalic rPVI) for stuttered speech in read and spontaneous conditions. In this figure, the highest intervocalic rPVI value for PWS is indicated by a triangle in the spontaneous speech section, positioned further right on the horizontal axis. This high rPVI value suggests that there is considerable variability in the timing between the consonants for this PWS speech sample during spontaneous speech.
PWS produced a range of rPVI-C values. As in Figure 46.10, in our PWS corpus we found a production variability between consonantal and vocalic segments greater in consonantal targets and complex sequences than in vowels. This leads to more rhythmic speech in those intervals (i.e., relatively low nPVI scores for PWS, and high rPVI).
46.3.1 Speech Rhythmicity of Individual Speakers
We found systematic differences between two speakers who stutter; thus, clearly, personal speech production strategies of PWS affect ‘rhythm’ measures. The range of PVI values produced by the same speaker was greater in the PWS group compared to the PWNS group, whereas PWNS produced a more regular nPVI level. We show in Figure 46.12 the average duration of speech components at the individual speaker level, incorporating both normal and stuttered speech, categorized according to different contextual factors such as vocalic and intervocalic intervals, pauses, and hesitation, with error bars indicating the SEM.
Average duration metrics for vocalic and intervocalic intervals, pauses, and hesitations among individual speakers.
Duration of speech components among individual speakers. The bar graph compares the average duration of vocalic and intervocalic intervals, pauses, and hesitations for individual speakers identified as 00001bis, B31, C14, and C15. It highlights the contrast in speech durations between normal speakers and PWS, with PWS generally showing longer durations in pauses and hesitations, indicative of the speech disfluencies commonly associated with stuttering. The differences in duration and variability between speakers underscore the individual nature of stuttering manifestations.

Figure 46.12 Long description
The vertical axis represents duration, which ranges from 0 through 600 milliseconds. The horizontal axis lists the following: Vocalic, Intervocalic, Pause, and hesitation. The bars represent Normal and Stutter, respectively. The mean duration values for Stutter are as follows. First: Pause, 350. Hesitation, 220. Vocalic, 170. Intervocalic, 110. Second: Pause, 500. Hesitation, 400. Intervocalic, 120. Vocalic, 80. The mean duration values for Stutter are as follows. Third: Hesitation, 300. Pause, 290. Vocalic, 90. Intervocalic, 80. Fourth: Hesitation, 460. Pause, 150. Intervocalic, 100. Vocalic, 90. The values are estimated.
Figure 46.12 suggests that for some speakers, the duration of vocalic intervals is longer in stuttered speech compared to normal speech, although this is not consistent across all speakers. However, the figure shows that the intervocalic intervals (rPVI) can be longer for stuttered speech than for normal speech. The duration of pauses appears to be longer in stuttered speech for all individual speakers represented in the figure, suggesting a common trait among PWS. The average duration for hesitations is longer for stuttered speech, while in others, it is comparable between stuttered and normal speech. The error bars across all categories indicate variability in the durations for both normal and stuttered speech. A larger error bar indicates for PWS more variability in that particular speech component. Overall, the figure reveals that the average duration of both intervocalic intervals and pauses is longer in stuttered speech compared to normal speech, with individual variations across the speakers. Hesitations and vocalic intervals show a less consistent pattern and may vary more on an individual basis.
Figure 46.13 illustrates the mean duration of various speeches (normal and stuttered) within the four contextual categories across distinct speech styles (read and spontaneous), with error bars representing the SEM, which reflects the amount for each speaker.
Comparative analysis of speech for individual speakers. Mean durations for vocalic intervals, intervocalic intervals, pauses, and hesitations.
Detailed speech component durations by speaker. Presenting both mean values and variability, this dual-bar graph compares the duration of vocalic and intervocalic intervals, pauses, and hesitations for each of the four speakers distinguished by ‘normal’ and ‘stutter’ speech patterns. Inter-speaker variability is marked, with PWS often showing extended durations and higher variability in pauses and hesitations. The graph also illustrates significant inter-speaker variability, particularly in the stuttering group, underscoring the personalized nature of speech disruptions experienced by PWS.

Figure 46.13 Long description
The vertical axis represents duration, which ranges from 0 through 600 milliseconds. The horizontal axis lists the following: Vocalic, Intervocalic, Pause, and hesitation. The bars represent Normal and Stutter, respectively. The mean duration values for Stutter are as follows. First: Pause, 350. Hesitation, 220. Vocalic, 170. Intervocalic, 110. Second: Intervocalic, 210. Vocalic, 80. Third. Pause, 430. Hesitation, 220. Vocalic, 130. Intervocalic, 100. Fourth. Pause, 500. Hesitation, 400. Intervocalic, 110. Vocalic, 80. The mean duration values for Normal are as follows. First: Vocalic, 100. Intervocalic, 100. Pause, 100. Second. Vocalic, 80. Intervocalic, 100. Pause, 300. Third: Pause, 400. Hesitation, 400. Pause, 300. Vocalic, 100. Intervocalic, 100. Fourth: Hesitation, 480. Pause, 100. Intervocalic, 100. Vocalic, 100. The values are estimated.
PWS often have increased mean durations for pauses and hesitations, as this is a common feature of stuttered speech. This is typically seen in the higher dark grey bars within these categories. The standard error represented by the error bars is larger for PWS in certain speech elements, such as pauses and hesitations. This is indicative of greater variability in how these elements are expressed by PWS compared to PWNS.
By comparing read and spontaneous speech, PWS show a larger discrepancy in mean durations between these two types of speech, reflecting the increased challenges PWS face in spontaneous speech scenarios.
46.3.2 Speech Rhythmicity in PWS
We calculated also the percentage of vocalic intervals, intervocalic intervals, pauses, and hesitations during stuttering speech and normal speech for individual speakers; see Table 46.2.
This table delineates the percentage of intervocalic and vocalic intervals, along with the frequency of pauses and hesitations, for both PWS and PWNS. It highlights that PWS tend to have a higher percentage of hesitations and a variable distribution of pauses, reflecting the stuttering characteristics. Meanwhile, the percentage of intervocalic and vocalic intervals does not significantly differ between PWS and PWNS.
| Stuttering | Normal speech | |||
|---|---|---|---|---|
| B31 | 00001bis | C14 | C15 | |
| Intervocalic | 49% | 44% | 49.2% | 47.7% |
| Vocalic | 48.4% | 48% | 49.5% | 50% |
| Pauses | 1.3% | 3.5% | 0.8% | 1.4% |
| Hesitations | 1.3% | 4% | 0.5% | 0.4% |
In Table 46.2, ∆C and ∆V do not separate PWS from PWNS; however, stuttering disfluencies are numerically important. This result is not surprising since Ramus’ ∆V measure captures global variation within ips, whereas Grabe and Low’s PVI measure captures ‘pairwise’ sequential variation. We calculated the average and the standard deviation of vocalic intervals, intervocalic intervals, duration of pauses, and duration of hesitations. The numerical results in Table 46.2 are also visible in Figure 46.14.
Standard deviation of vocalic intervals, intervocalic intervals, duration of pauses, and duration of hesitations.
Variability in speech components among individual speakers. The graph displays the standard deviation of vocalic and intervocalic intervals, pauses, and hesitations for two PWNS (C14 and C15) and two PWS (00001bis and B31). The pronounced variability in the stuttering speakers’ intervocalic intervals and hesitations, particularly for B31, indicates the degree to which stuttering can affect speech rhythm and flow.

Figure 46.14 Long description
The vertical axis represents duration, which ranges from 0 to 600 milliseconds. The horizontal axis lists the following: Vocalic, Intervocalic, Pause, and hesitation. The bars represent Normal and Stutter, respectively. The values of standard deviation for Stutter are as follows. Top Left. Pause, 300. Vocalic, 200. Hesitation, 190. Intervocalic, 50. Top right. Hesitation, 600. Intervocalic, 210. Pause, 200. Vocalic, 50. Bottom left. Pause, 200. Hesitation, 110. Vocalic, 90. Intervocalic, 20. Bottom right. Vocalic, 80. Intervocalic, 80. Pause, 80. Hesitation, 10. The values are estimated.
In PWNS the standard deviation values across all speech elements are relatively low. For the PWS, the standard deviation values are also relatively low (but higher than PWNS) and comparable to those of the normal speakers (but higher than PWNS for intervocalic intervals). A PWS speaker has a noticeably higher standard deviation in the hesitation category, which suggests a significant variability in the duration of hesitations. This could indicate moments where the speaker is experiencing blocks or is attempting to avoid disfluent moments. The standard deviation for intervocalic intervals for PWS speaker B31 shows a much larger standard deviation compared to both the normal speakers and PWS speaker 00001bis. This suggests that there is a greater variability in the timing of consonantal intervals for this speaker, which may reflect the irregular speech rhythm commonly associated with stuttering. This could be related to the stuttering disfluencies that affect the flow of speech, potentially leading to more pronounced and irregular spacing between consonantal sounds. This can be a characteristic of the speech patterns in PWS.
Figure 46.15 displays the standard deviation of speech elements for both normal speakers and PWS, broken down by read and spontaneous speech styles. Both speakers exhibit low standard deviation in read and spontaneous speech styles across all speech elements. This suggests that their speech timing is fairly consistent, whether reading a text or speaking spontaneously. For PWS, during spontaneous speech, the standard deviation increases, especially for intervocalic intervals and hesitations. In a speaker who stutters (B31) during spontaneous speech, there’s a notable increase in the standard deviation for hesitations. This large variability could indicate significant disruptions in speech flow due to stuttering, affecting the speaker’s ability to maintain consistent hesitations. Overall, the figure illustrates that while normal speakers maintain a consistent rhythm across both speech styles, PWS exhibit more variability, particularly in spontaneous speech. This is most pronounced in the duration of their hesitations, suggesting that spontaneous speech poses more significant challenges for individuals who stutter.
Standard deviation of vocalic intervals, intervocalic intervals, duration of pauses, and duration of hesitations. Effect of speech style: read and spontaneous.
Speech component variability across speaking conditions for individuals. In this graph, intervocalic intervals demonstrate notable variability for PWS, especially in spontaneous speech, with speaker B31 showing a heightened standard deviation in intervocalic intervals during spontaneous speech. This suggests that the timing between spoken sounds is a critical indicator of stuttering, highlighting the irregular speech rhythm and flow for PWS. Additionally, the variability in pause and hesitation durations for PWS further emphasizes the rhythmic disruptions characteristic of stuttering.
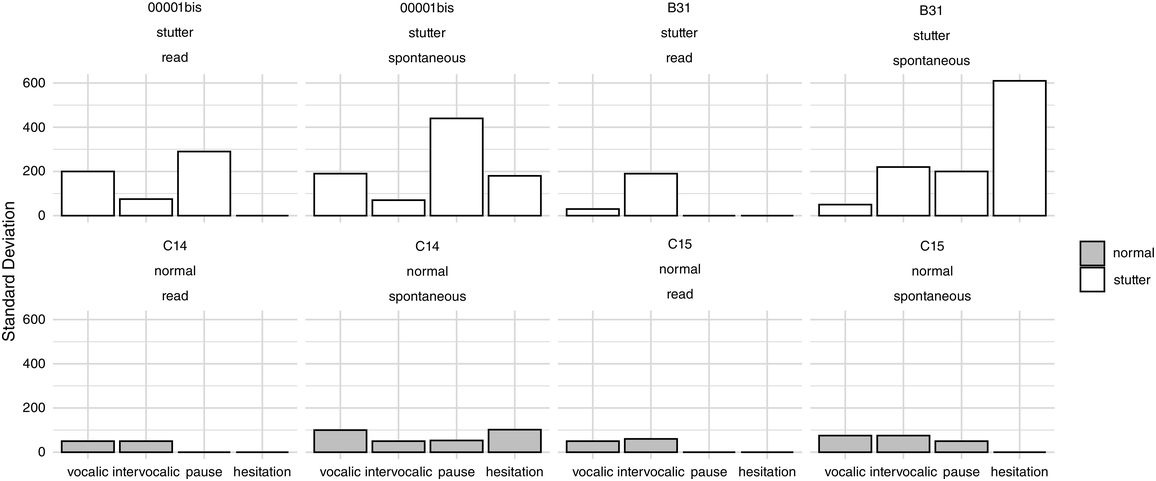
Figure 46.15 Long description
The vertical axis represents duration, which ranges from 0 to 600 milliseconds. The horizontal axis lists the following: Vocalic, Intervocalic, Pause, and hesitation. The bars represent Normal and Stutter, respectively. The values of standard deviation for Stutter are as follows. First. Pause, 300. Vocalic, 200. Intervocalic, 80. Hesitation, 10. Second. Pause, 450. Vocalic, 200. Hesitation, 200. Intervocalic, 80. Third. Intervocalic, 200. Vocalic, 20. Pause, 10. Hesitation, 10. Fourth. Hesitation, 600. Intervocalic, 210. Pause, 200. Vocalic, 50. The values of standard deviation for normal are as follows. First. Vocalic. Intervocalic, 50. Pause, 10. Hesitation, 10. Second. Vocalic, 100. Hesitation, 100. Intervocalic, 50. Pause, 50. Third. Intervocalic, 50. Vocalic, 40. Pause, 10. Hesitation, 10. Fourth. Vocalic, 80. Intervocalic, 80. Pause, 50. Hesitation, 10. The values are estimated.
The comparison of stuttering and normal speech rhythm in read and spontaneous conditions for the PVI measures is shown in Figure 46.16, where the points represent the results of all utterances. Vocalic nPVI values are plotted on the vertical axis against intervocalic rPVI values on the horizontal axis.
PVI results for all utterances.
PVI values by individual and speech context. This scatterplot maps the vocalic nPVI against the intervocalic rPVI for four speakers, distinguishing between ‘normal’ and ‘stutter’ speech patterns during read and spontaneous speaking tasks. For both 00001bis and B31, who stutter, there is a noticeable spread in intervocalic rPVI values, particularly in spontaneous speech, indicating substantial rhythmic variability.

Figure 46.16 Long description
The horizontal axis represents intervocalic r P V I which ranges from 50 to 150. The vertical axis represents vocalic n P V I which ranges from 25 to 75. Top left and right. The data points representing read stutter and spontaneous stutter are randomly distributed throughout both graphs. Bottom left and right. The data points representing read normal and spontaneous normal are randomly distributed throughout both graphs. The legends for these data points are given on the right side.
In Figure 46.16, individual utterance measures are plotted for both normal speakers and PWS across two speech conditions: read and spontaneous. The PVI is used to analyse the rhythmic characteristics of speech, with vocalic nPVI on the vertical axis indicating variability between vowel durations, and intervocalic rPVI on the horizontal axis indicating variability between consonant durations. It is well known that the selection of words, and the prosodic structure of the utterances at phrasal level, can result in considerable shifts in values. The tempo and style of speech (e.g., the difference between read and spontaneous speech, or the type of read text or the type of natural discourse) influenced the values that have been obtained. However, there are key elements to identify PWS and understand the rhythmic measures of nPVI and especially rPVI. The spread of the points along the horizontal axis (rPVI) shows variability in the timing of intervocalic intervals. We can observe variance of PVI values at intra-speaker level across utterances in the spontaneous speech interview. PWS have points that are spread further right, and this suggests higher variability in their intervocalic rhythmic measure compared to normal speakers. One can observe how the speech rhythm changes from a read to a spontaneous condition. A significant shift in position, especially horizontally, indicates how stuttering impacts speech in a less controlled environment.
In Figure 46.17 we show the average of the PVI results for the comparison of stuttering and normal speech rhythm in read and spontaneous conditions. Vocalic nPVI values are plotted on the vertical axis against intervocalic rPVI values on the horizontal axis.
PVI results: average.
Vocalic and intervocalic temporal variability in speech. This scatterplot contrasts vocalic nPVI and intervocalic rPVI across read and spontaneous speech tasks for each speaker, showcasing the temporal dynamics of speech. The plot points to differences between normal speakers (C14 and C15) and those who stutter (00001bis and B31), particularly in spontaneous speech. The individuals who stutter demonstrate wider scatter in intervocalic rPVI values, indicative of the variability in speech rhythm and timing that is characteristic of stuttering.

Figure 46.17 Long description
The horizontal axis represents intervocalic r P V I which ranges from 40 to 120. The vertical axis represents vocalic n P V I which ranges from 46 to 58. Top left and right. The data points representing read stutter and spontaneous stutter are randomly distributed throughout both graphs. Bottom left and right. The data points representing read normal and spontaneous normal are randomly distributed throughout both graphs. The legends for these data points are given on the right side.
In Figure 46.17, the average PVI results are plotted for individuals with normal speech and PWS across two different speech conditions: read and spontaneous. Higher nPVI values on the vertical axis indicate greater variability in vocalic intervals. In this figure, the nPVI values for all speakers seem to fall within a relatively close range, suggesting similar variability in vocalic intervals among the speakers. Higher values on the horizontal axis indicate greater variability in intervocalic timing. PWS have higher rPVI values than normal speakers; this indicates more pronounced variability in their intervocalic interval.
Normal speakers exhibit less variability in both nPVI and rPVI, indicating more regular speech rhythm, while PWS show more variability, particularly in rPVI, indicating a less regular rhythm. The PVI values, particularly the intervocalic rPVI, could be used to identify and characterize the rhythmic differences in speech related to stuttering. However, in spontaneous speech, we expect a considerably higher degree of variation in measures due to both the material being spoken and the individual characteristics of the speaker. We have observed that personal speech production strategies during stuttering affect rhythm measures. There will always be differences between PWS with different phonotactics and differences in durational oppositions. However, PWS demonstrate considerable variability in their speech rhythms, particularly exhibiting greater variability in the intervocalic intervals (consonants) measured by PVI-C (and ∆C), compared to PWNS.
46.4 Conclusions
This study offered a comprehensive analysis of speech rhythm in PWS compared to PWNS, highlighting the pivotal role of rPVI as an identifier of rhythmic patterns specific to PWS (along with the measures of pauses and hesitations). This measure particularly stands out, denoting higher variability within PWS speech, thereby disrupting the expected rhythm patterns typically found in PWNS. This variability is especially pronounced in spontaneous speech conditions, suggesting that the dynamic speech production is impacted by the natural variability of spoken material and the speaking strategies of individuals. Our study underscores the critical role of the rPVI in delineating the rhythmic deviations in PWS, offering insights into the mechanisms underlying stuttering and its effects on speech production dynamics.
Our findings highlight the significant impact of stuttering on speech rhythm, particularly in spontaneous speech scenarios, which exhibit a heightened degree of variability due to both the linguistic material and the speaker’s unique characteristics.
The analysis draws on the rhythm measures developed by Ramus (Reference Ramus, Nespor and Mehler1999), Ramus et al. (Reference Ramus, Nespor and Mehler1999), and Grabe and Low (Reference Grabe, Low, Gussenhoven and Warner2002), applying these to our corpus to dissect the nuanced rhythmic profiles of our participants. The data are extracted from the French ANR project (BENEPHIDIRE), as detailed in Section 46.1.3. The analysis on the corpus, encompassing interviews and read tasks performed by 14 French native speakers, underscores the variability in PWS’ speech rhythm. PVI measures (PVI-V and PVI-C) and Ramus et al. (Reference Ramus, Nespor and Mehler1999) (∆V and ∆C) both reflect the amount of variation in syllabic structure and prosodic factors that affect duration. Syllable complexity in PWS, repetitions, blocks, or lengthening of sounds and syllables during speech were contributory factors to the rhythm of an utterance (expected high rPVI), and to the general rhythmic impression of stuttering speech.
In our sample of four speakers (two PWS, two PWNS), the rPVI metric emerged as a crucial element for distinguishing rhythm between groups, showcasing how stuttering introduces significant rhythmic variability, especially in intervocalic intervals. This variability reflects the inherent challenges PWS face in speech production, attributed to disruptions in neural processes governing speech and motor control. These disruptions result in variability across speech intervals, emphasizing the marked impact stuttering has on speech rhythm. This study demonstrates that these measures are adept at identifying the rhythmic deviations characteristic of stuttered speech, providing insights into the complex interplay between phonological structure, phonetic realization, and the emergent properties of rhythm.
Based on the detailed analysis presented in Section 46.3, it’s clear that the rPVI notably shifts to the right for PWS when compared to PWNS. This rightward movement on the horizontal axis, which represents intervocalic variability, underscores a key finding: PWS exhibit significantly greater variability in the timing between consonants.
PWS displayed pronounced intra-speaker variability in rhythmic values across utterances. This variability was evident in both the average values of the PVI and in the distribution of the normalized PVI mean values. The variability was markedly more in spontaneous speech than in reading conditions, underscoring the substantial influence of speech style on rhythmic measures. Particularly, intervocalic interval variability (PVI-C and ∆C) was more pronounced, likely due to variations in the onset and coda structures of syllables.
Interestingly, certain instances of speech from PWS were less variable, potentially due to more controlled motor-planning processes during clinical tests. This resulted in a decreased variability in vowel duration (nPVI), which served as an indicator of fluency improvements.
The rPVI outcomes delineate a rhythm plot where PWS align closer to the ‘stress-timed’ end of the rhythm spectrum, diverging from the more ‘syllable-timed’ rhythm of PWNS. This distinction is rooted in the less isochronous nature of PWS utterances, with syllable complexity – marked by repetitions, blocks, and sound or syllable lengthening – contributing to this rhythmic deviation. The observed high variability in both vocalic and intervocalic intervals among PWS, as contrasted with PWNS, show the impact of stuttering on speech rhythm, making rPVI a robust measure for differentiating between PWS and PWNS across various speaking tasks and styles.
Our analysis reaffirms the importance of rPVI in identifying the rhythmic patterns inherent in PWS and highlights the broader implications of rhythm measures in understanding the dynamic motor system’s instability in stuttering. This contributes to our comprehension of stuttering’s multifaceted impact on speech rhythm, paving the way for future research into its underlying mechanisms and potential therapeutic interventions.
The results from our analysis underscore the complexity of speech production in stuttering, which goes beyond simple durational measures. The study’s findings reiterate that rhythm is a composite, emergent property rather than a simple binary classification of speech patterns.
Our chapter significantly advances our understanding of the causal mechanisms of neurodevelopmental stuttering by providing a detailed examination of speech rhythm variability in PWS compared to PWNS. By highlighting the increased variability in speech rhythm among PWS – especially in spontaneous speech – the study suggests that the neurological underpinnings of stuttering may involve disruptions or inefficiencies in the neural circuits responsible for timing and coordinating speech production. This aligns with current theories that posit stuttering as a motor-timing disorder, providing empirical evidence to further this hypothesis (Ludlow and Loucks, Reference Ludlow and Loucks2003; Alario et al., Reference Alario, Chainay, Lehericy and Cohen2006; Kell et al., Reference Kell, Neumann and von Kriegstein2009; Watkins, Reference Watkins, Chesters, Connally, Hickok and Small2016; Assaneo and Poeppel, Reference Assaneo and Poeppel2018; Chang et al., Reference Chang, Garnett, Etchell and Chow2019).
The observed intra-speaker variability in rhythmic measures among PWS, particularly in the context of rPVI, underscores the complexity of stuttering as a neurodevelopmental condition. It suggests that the stuttering mechanism may not solely be a result of static neural disruption but could also involve dynamic factors such as neural plasticity, attentional control, and the processing of linguistic information (Kell et al., Reference Kell, Neumann and von Kriegstein2009; Watkins, Reference Watkins, Chesters, Connally, Hickok and Small2016; Neumann, Reference Neumann, Euler and Bosshardt2017; Chang et al., Reference Chang, Garnett, Etchell and Chow2019).
Understanding the precise nature of rhythm variability in stuttering can guide the development of targeted interventions and therapies, potentially focusing on improving rhythm perception and production as a means to mitigate stuttering symptoms.
46.5 Acknowledgements
We thank Qianwen Gwan (IR SFL 7023 CNRS) for her help with automatic data transcription and annotation.
Summary
This study provided an analysis of speech rhythm in both PWS and PWNS. The analysis reveals that while rhythm measures fluctuate, the impact of stuttering on speech rhythm is substantial. Our findings indicate that the rPVI measure serves as a key marker for identifying the rhythmic patterns inherent in PWS. This crucially illustrates the dynamic motor system’s instability in stuttered speech.
Implications
The PVI measures reflect structural differences, which affect the emergent perceived rhythm of an utterance. Thus, we are not measuring the rhythm of PWS but the properties that affect the potential for certain rhythmic patterns in the utterances of stuttering speech. These rhythmic conditions can provide timing cues to overcome vulnerable pathways that affect the impaired neurological system of PWS.
Gains
This analysis has also been a tool to indirectly assess the severity of stuttering. It improves our comprehension of the causal mechanisms of neurodevelopmental stuttering, thus suggesting new and future pathways for research on this speech/motor disturbance.

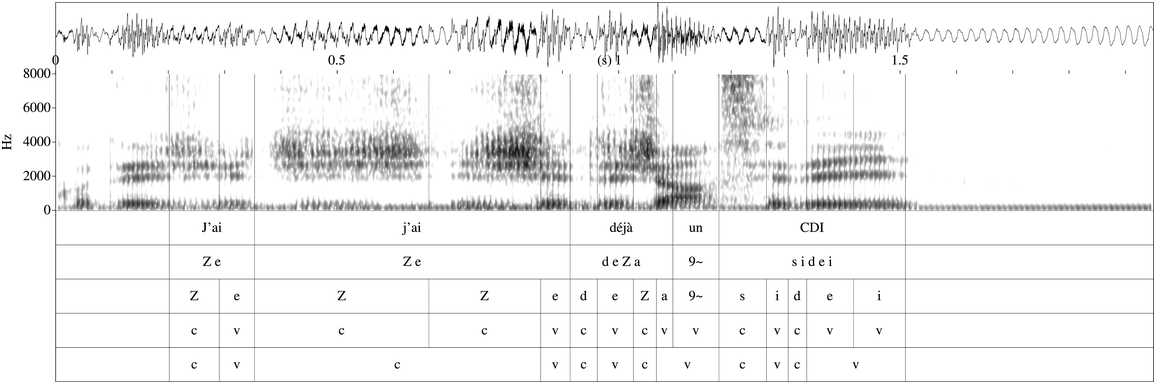
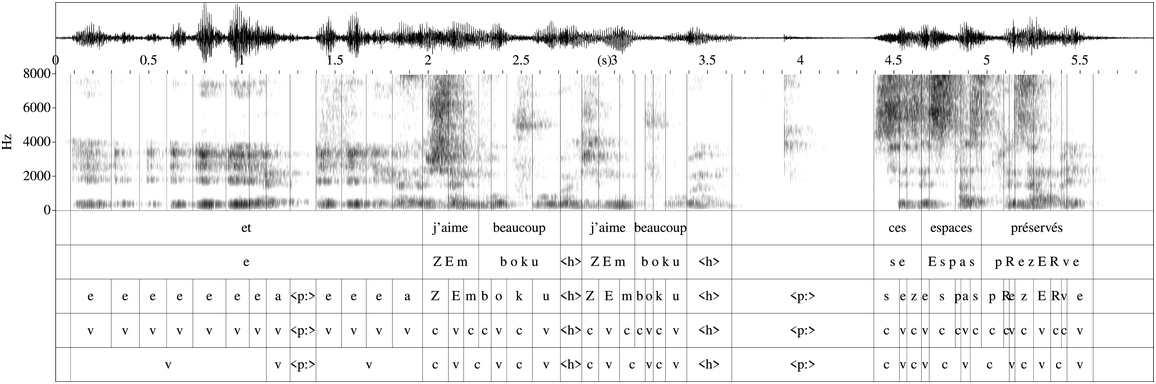
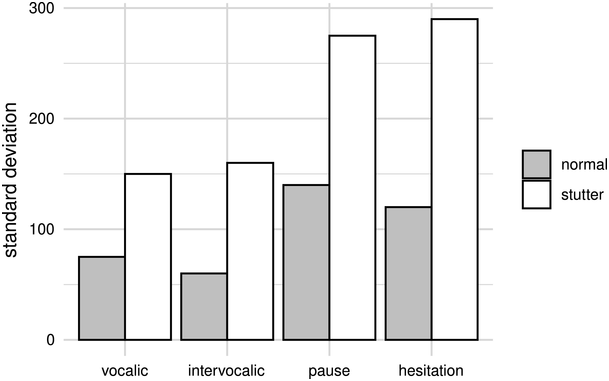
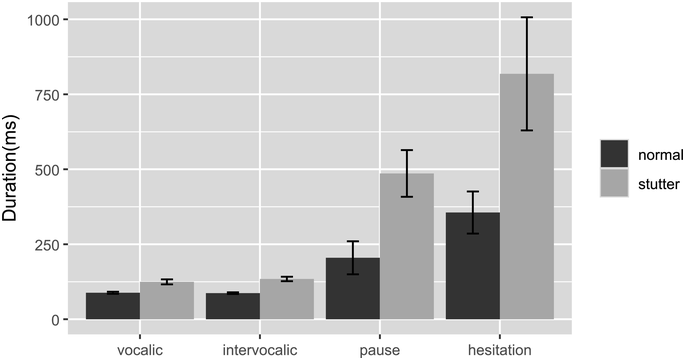
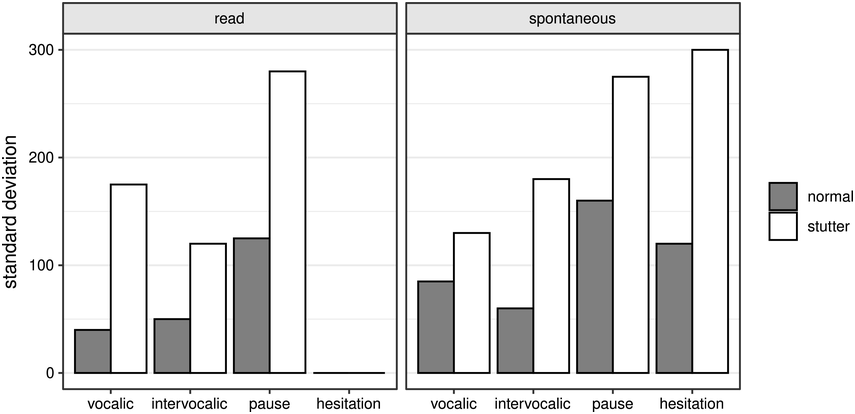
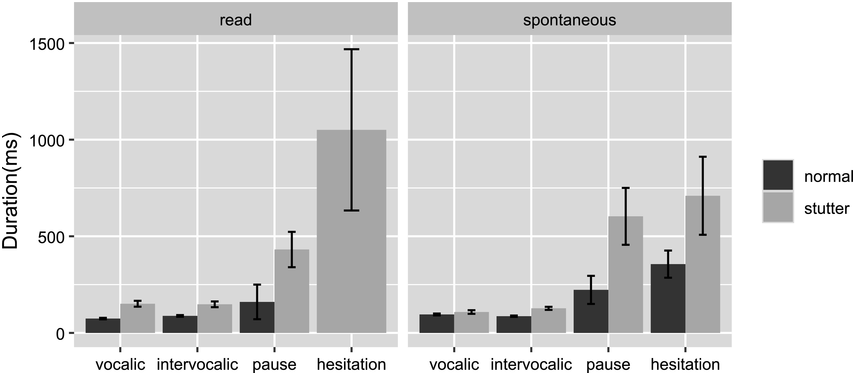
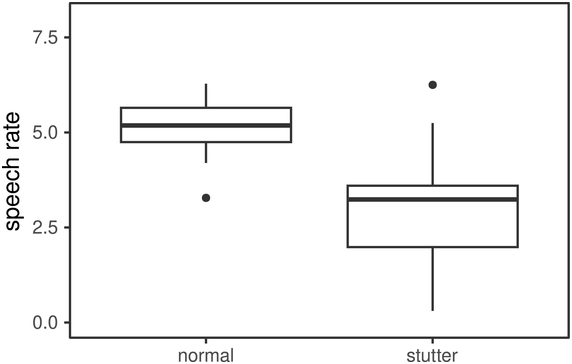
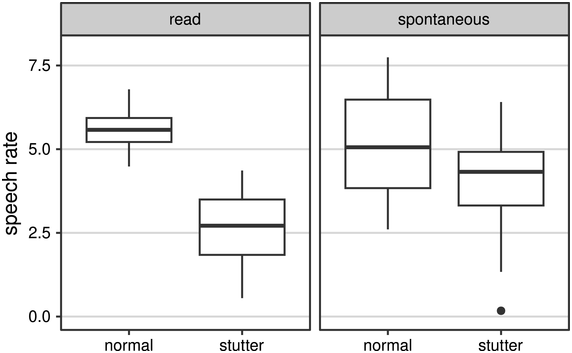


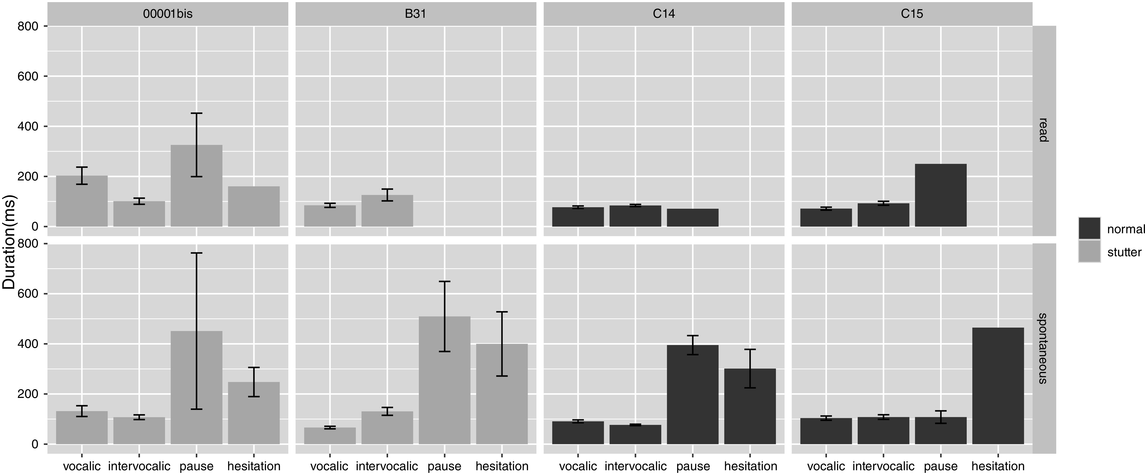
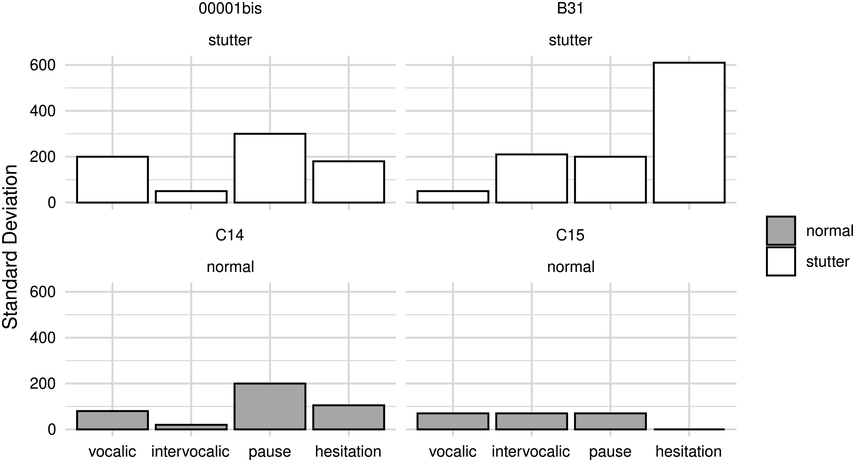

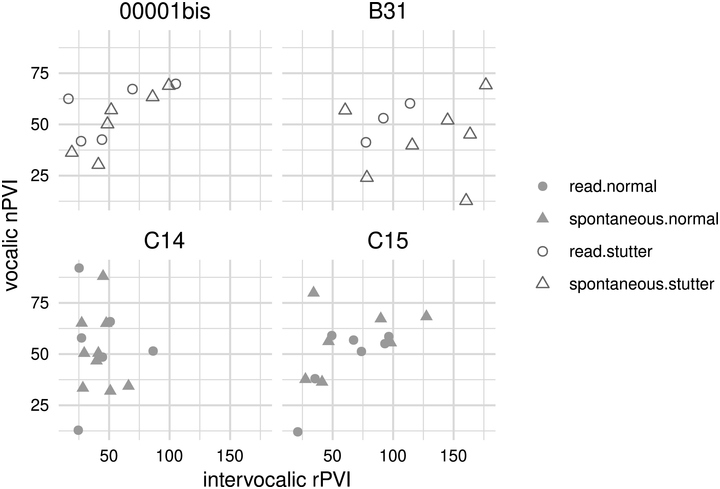
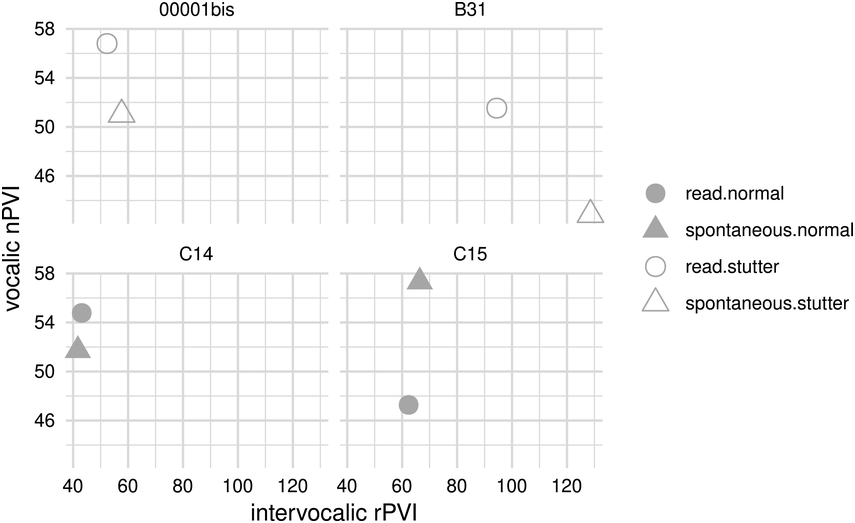

 Open access