


Monitoring hand hygiene (HH) compliance of healthcare personnel (HCP) and providing them with feedback is an essential element of multimodal strategies to improve HH.1 Direct observation of HCP by trained observers is currently the gold standard for estimating HH compliance rates.Reference Sax, Allegranzi and Chraiti2–Reference Sax, Boyce, Pittet, Allegranzi and Boyce4 Although direct observation has several unique advantages, its limitations have generated interest in supplemental methods for monitoring HH performance.Reference Ward, Schweizer and Polgreen3, Reference Yin, Schacht Reisinger and Vander Weg5–Reference Masroor, Doll, Stevens and Bearman8 To address this issue, automated HH monitoring systems (AHHMSs) have been developed, the advantages and limitations of which have been identified.Reference Ward, Schweizer and Polgreen3, Reference Conway, Riley and Saiman9–Reference Boyce, Cooper, Lunde, Yin and Arbogast12 Several studies have found that AHHMS installation without sufficient supplementary activities may not result in improved HH performance rates.Reference Conway, Riley and Saiman9, Reference Kwok, Juergens and McLaws13, Reference Edmonds-Wilson, Pelz and Moore14 Adoption of the AHHMS by hospitals is hampered by a paucity of published evidence regarding their ability to yield sustained HH performance rate improvements and to reduce healthcare-associated infections (HAIs).Reference Ward, Schweizer and Polgreen3
For years, Hanover Hospital, a 93-bed nonprofit acute-care facility with 6 nursing units, often reported HH compliance rates of 80%–95%, based on direct observations. However, informal observations by the hospital’s quality improvement department questioned the accuracy of these reported rates. In response, in 2014 the hospital formed a “Do No Harm” team designed to reduce patient harm. In addition, the hospital selected a group monitoring system (Smartlink activity monitoring system, GOJO Industries, Akron, OH) with a high degree of sensitivity and positive predictive value.Reference Limper, Slawsky and Garcia-Houchins15 In this article, we describe the impact of combining an AHHMS with multiple promotional activities on HH performance and HAIs.
Methods
HH compliance rates generated by routine direct observations
The hospital has recorded HH compliance direct observation results in a dedicated database since 2009. In each hospital unit, 1 or 2 individuals are trained and are required to covertly observe ≥10 HH opportunities per quarter on their unit.
Automated HH monitoring system
Elements of the Smartlink AHHMS have been described in detail.Reference Limper, Slawsky and Garcia-Houchins15 Alcohol-based hand rub (ABHR) and soap dispensers record each dispersal as an HH event (HHE). Activity monitors near each patient room doorway detect each entry into and exit from the room as an HH opportunity (HHO). Data captured by dispensers and activity monitors are sent to a secure cloud-based server that stores the information at the device level. Unit HH performance rates (estimates of compliance) are calculated by dividing HHEs by HHOs. Near real-time performance rates can be viewed on a computer display in each nursing unit. Performance rates are distributed to “Do No Harm” team members and unit leaders on a weekly basis.
In June 2014, the AHHMS was installed on 1 medical–surgical nursing unit (unit A) to better understand HH performance rates and increase awareness of the importance of HH. The AHHMS was subsequently installed in a stepwise manner in another medical-surgical unit (unit B) in August 2015, in a progressive care/step-down unit (unit C) in December 2016, and in a mixed medical-surgical intensive care unit (unit D) in April 2017. The AHHMS was not installed on the pediatrics or maternity units, which rarely report HAIs.
Goal setting
Following AHHMS installation, nursing unit team members set goals for improved HH performance rates.Reference Al-Tawfiq, Abed, Al-Yami and Birrer16, Reference Luangasanatip, Hongsuwan and Limmathurotsakul17 As goals were met, units celebrated their achievements and set new goals.
Frontline ownership initiative (Intervention I)
The hospital consulted an expert on using frontline ownership (FLO) to promote improved compliance with HH recommendations.Reference Zimmerman, Reason, Gitterman, Christian and Gardem18 The expert visited Hanover Hospital on 3 occasions between August 2015 and June 2016 to assist the hospital in implementing FLO.
Support by hospital leadership (Intervention II)
In 2014 and 2015, hospital leadership supported AHHMS installation on units A and B. In mid-September 2016, hospital leadership sent 6 frontline nursing staff, the infection preventionist, and the vice president for medical affairs to visit a large hospital in Chicago that had achieved sustained increases in HH compliance rates using the same AHHMS as part of a multimodal strategy.Reference Limper, Slawsky and Garcia-Houchins15, Reference Landon, Pacholek and Runjo19 Meetings with the physician leading the Chicago hospital’s HH campaign included discussions of methods for analyzing AHHMS data and additional promotional activities. Following the visit, administrators approved stepwise installation of the AHHMS on units C and D.
Do No Harm team HH audit
In September 2016, members of the Do No Harm team, which included HCP from every unit and all ancillary departments, performed covert direct observations of HH compliance upon room entry and exit on all nursing units.
Toyota Kata methodology (Intervention III)
In February 2017, the hospital began to adopt the Toyota Kata performance improvement methodology.Reference Ellingson, Haas and Aiello20, Reference Merguerian, Grady and Waldhausen21 A Kata involves changing behavior using a step-by-step process with experimentation by frontline personnel and using a “Plan, Do, Check, Act” (PDCA) cycle to achieve the desired behavior. The hospital provided mandatory training for management and leadership staff and developed an institutional commitment to the philosophy. Unit A started its HH Kata project in February 2017, and unit B chose HH improvement as their first Kata project in late March 2017. On each unit, 1 person each day was assigned to wear an “HH Sheriff” badge and reminded personnel to perform HH. Efforts were made to improve HH when passing meal trays. HH rates were reported at each shift huddle and at a daily “safety huddle,” data were posted in staff lounges and reported to senior leadership. HCP were coached when compliance decreased.
HAI prevention and surveillance
Bundles for prevention of central-line–associated bloodstream infections (CLABSIs) and of catheter-associated urinary tract infections (CAUTIs) were in place prior to implementation of the AHHMS. Surveillance for HAIs was performed by the hospital’s infection control program using National Healthcare Safety Network (NHSN) definitions.22
Monthly HAI data reported to the Pennsylvania Department of Health through June 2018 were available for the following HAIs: methicillin-resistant Staphylococcus aureus (MRSA) and vancomycin-resistant Enterococcus (VRE) bloodstream infections, CLABSIs, CAUTIs, and Clostridioides difficile infections (CDIs). Because the number of HAIs per month was low on all 4 units, incidence density data for the 4 units, expressed as the number of HAIs per 10,000 patient days, were aggregated for the purposes of data analysis. Furthermore, because increased HH (and use of alcohol-based hand rub) may not have the same impact on CDI as on other infections,Reference Vernaz, Sax and Pittet23, Reference Kaier, Hagist, Frank, Conrad and Meyer24 HAIs were divided into 2 groups: CDI and all other reported HAIs combined (non-CDI).
Statistical analyses
We fit 2 types of mixed-effects Poisson autoregressive (AR) time-series models to the HH and HAI data separately. First, a general additive modelReference Wood25 (ie, a smoother via penalized regression splines) was fit to assess nonlinear trends. Second, to compare rates among the 4 periods, a linear model was fit with a random effect for unit, a covariate for month, a fixed effect to account for the baseline, and 3 intervention periods: (1) baseline period up to August 2015, (2) period after FLO (Intervention I), September 2015–September 2016, (3) period after Chicago visit (Intervention II), October 2016–March 2017), (4) period after Toyota Kata Education (Intervention III), April 2017–June 2018, and the month-by-intervention period interaction.Reference Zuur, Ieno, Walker, Saveliev and Smith26 Both types of models weighted the number of HH or HAI events by the number of opportunities or the number of patient days, respectively. Seasonal effects were modeled by smoothing terms. Units A and B had the most experience with the AHHMS, so units A and B were analyzed separately. Model fit was assessed graphically by scatter, autocorrelation, and partial autocorrelation plots of the model’s residuals. Model fit was also assessed using augmented Dickey-Fuller (ADF) unit root tests.Reference Shumway and Stoffer27 A separate mixed-effects Poisson model was used to investigate the relationship between HAI rates (both CDI and non-CDI) and HH performance rates. The lagged relationship between HH performance and HAI rates was assessed at units A and B using a vector autoregression model (VAR) to HH and HAI data simultaneously and then tested for Granger causality.Reference Pfaaf28 All statistical calculations were performed using R version 3.4.1 software.29 R packages MASS Reference Venables and Ripley30 and nlme Reference Pinheiro, Bates, DebRoy and Sarkar31 were used to fit the AR models; vars was used to fit the VAR models and was used to perform a Granger test;Reference Pfaaf28 and tseries was used to perform ADF tests.Reference Trapletti and Hornik32 Individual Wald 2-sided P values and 95% 2-sided CIs are reported throughout. To maintain a 95% family-wise false discovery rate over the test results (Tables 2 and 3), the Benjamini-Hochberg method requires that the individual P values in the tables be compared against .015 to determine statistical significance.
Results
Hand hygiene compliance rates by routine direct observations
Hand hygiene compliance rates generated by direct observations since January 2014 were analyzed. Average (and range) compliance rates before and after installation of the AHHMS on each unit are shown in Table 1. The average quarterly compliance rates on all 4 units ranged from 65.5% to 94.8%.
Average and Ranges of Hand Hygiene (HH) Compliance Rates Generated by Routine Direct Observational Surveys Before and After Installation of the AHHMS, by Nursing Unit

Note. AHHMS, automated hand hygiene monitoring system; HHE, HH events; HHO, HH opportunities.
HH performance rates determined by the AHHMS
Unit A. During the first month after AHHMS installation on unit A in June 2014, the AHHMS HH performance rate was initially 38.9%, but it rapidly fell to a baseline rate of 26.7% by the next month. HH performance rates varied from 26.7% to 38.9% in the period June 2014–August 2015 (Fig. 1). Following implementation of the FLO concept, AHHMS-based performance rates gradually increased to 38.5% in September 2016 (Fig. 1).
Hand hygiene (HH) performance rates are indicated by different colored symbols for each unit. Trend of the HH performance rates are indicated by different colored curves. The vertical dashed lines indicate when 3 interventions occurred Note. Intervention I, frontline ownership initiative (FLO); Intervention II, Chicago visit; Intervention III, Toyota Kata method.
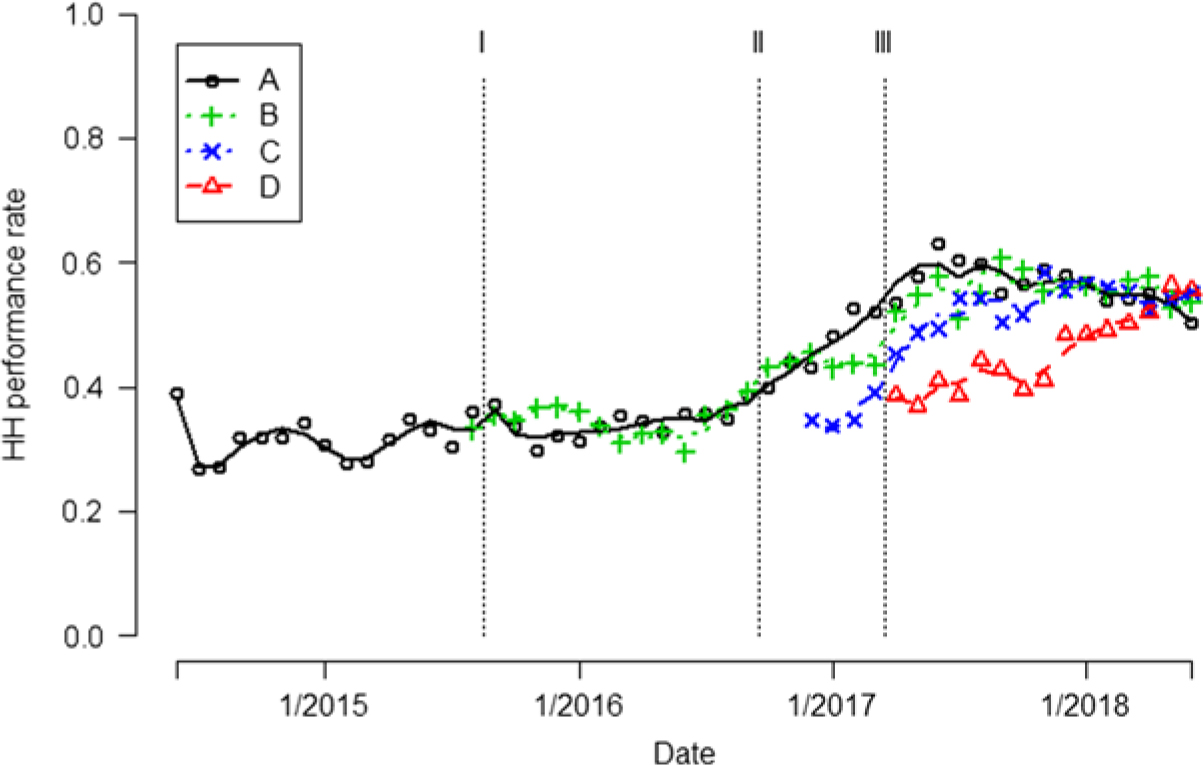
In September 2016, covert direct observations by Do No Harm team members determined a 38% (8 of 21) compliance rate on unit A, which was similar to the 38.5% AHHMS rate. The similarity of rates obtained by the AHHMS and direct observation improved HCP acceptance of performance rates generated by the AHHMS.
Following implementation of the Toyota Kata methodology and the use of the PDCA tool, performance rates on unit A continued to increase from 38.5% to a maximum of 62.9% in June 2017, with some decline in early 2018 (Fig. 1). After all 3 interventions, there was an aggregate 81% (95% CI, 70%–92%) increase in rates over the baseline (P < .0001) (Table 2).
Hand Hygiene (HH) Performance Rates Pooled Over all 4 Units (A–D) and Separately at Units A and B for Which Data Were Collected During all 3 Intervention Periodsa

Note. HHOs, hand hygiene opportunities; CI, confidence interval; FLO, frontline ownership.
a Two-sided P values are reported for the test that HH rates increased compared to the first period (baseline for A–D and A; initial intervention period for B).
Unit B. During the first month after installation of the AHHMS on unit B in August 2015, the HH performance rate was 33.1%. In the period September 2015–September 2016 after the first intervention, rates generated by the AHHMS varied from 29.5% to 39.2% (Fig. 1). In unit B, an aggregate 61% (95% CI, 60%–62%) increase in HH rates occurred during the last 2 intervention periods (October 2016–June 2018) over the initial intervention (September 2015–September 2016; P < .0001) (Table 2).
Unit C. In the month after installation of the AHHMS on unit C in December 2016, the HH performance rate was 34.7%. Performance rates in the first quarter of 2017 averaged 35.9%, and they increased progressively to a maximum of 58.5% in November 2017. They then remained above 52% for the rest of the study (Fig. 1).
Unit D. In the month after the AHHMS was installed on unit D in April 2017, the HH performance rate was 38%. Subsequently, performance rates increased each quarter, reaching a maximum of 56.3% in May 2018 (Fig. 1).
Pooled over all 4 units, the aggregate HH performance rate for the period June 2014–August 2015 was 28% (95% CI, 25%–32%). Table 2 shows steady, statistically significant increases in the HH performance rate after each of the 3 interventions were enacted, resulting in an 85% (95% CI, 68%–103%) increase from the baseline after the implementation of all 3 interventions (P < .0001).
HAI rates
Pooled over all 4 units, non-CDI rates were at 5.7 per 10,000 patient days and showed a flat trend in the 14-month baseline period before FLO intervention (June 2013–August 2015, 95% CI, −3.0% to 5.0% per month; P = 0.652) (Fig. 2). That trend decreased by 8% (95% CI, −24% to 11%; P = 0.3938) in the 13 months after the FLO intervention, resulting in 3.7 non-CDI per 10,000 days (Table 3). Greater reductions occurred in 2017 and early 2018 after the addition of the Toyota Kata methodology, which resulted in a 2.5 per 10,000 non-CDI (from April 2017 through June 2018), a 56% decrease (95% CI, −82% to 10%; P = .0841). The incidence density rates of non-CDI on unit D, which were higher than the other 3 units, were already trending downward from 2013 to 2016 before the installation of the AHHMS in April 2017 and remained flat after AHHMS installation (Fig. 2).
Monthly non-CDI (MRSA, VRE, ESBL, CLABSI and CAUTI) for each unit are indicated by different colored symbols. Most months no non-CDI were reported (if plotted, they would form a solid horizontal line at 0), so only nonzero rates are shown. Trend of the non-CDI rates are indicated by different colored curves. Note. CDI, Clostridioides difficile infection; MRSA, methicillin-resistant Staphylococcus aureus; VRE, vancomycin-resistant Enterococcus; ESBL, extended-spectrum β-lactamase; CLABSI, central-line–associated bloodstream infection; CAUTI, catheter-associated urinary tract infection. Intervention I, frontline ownership initiative (FLO); Intervention II, Chicago visit; Intervention III, Toyota Kata method.

Hospital-Acquired Infection Rates Pooled Over all 4 Unitsa

Note. CDI, C. difficile infection; non-CDI, other HAIs; CI, confidence interval; FLO, frontline ownership.
a Two-sided P values are reported for the test that HAI rates differed from the baseline.
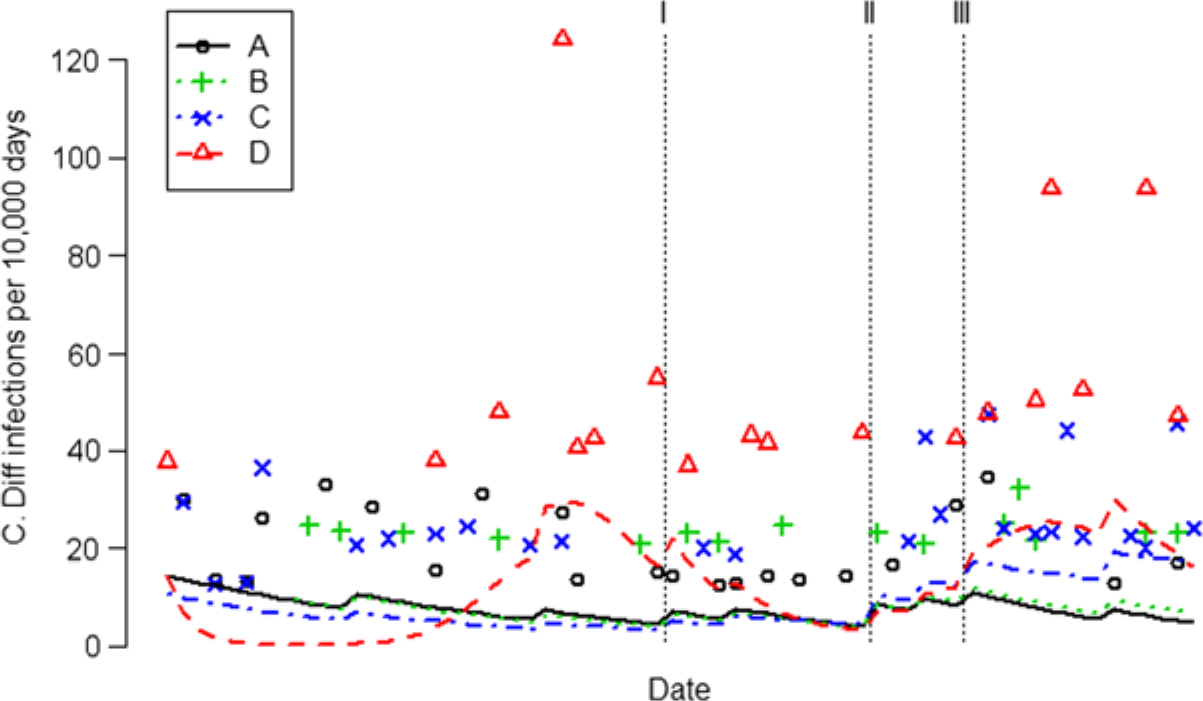
The incidence density of CDI increased after AHHMS installation on units C and D and remained flat on Units A and B (Table 3 and Fig. 3). Pooled across the 4 units, the CDI rate was 7.9 per 10,000 patient days and exhibited a flat trend (95% CI, −4.0% to 2.3% per month) in the 14-month baseline period before the FLO intervention (from June 2013 through August 2015). After all 3 interventions, the incidence of CDI rose 60% (95% CI, −0.1% to 155%; P = .0533). However, that increase was totally attributable to units C and D, which had less experience with the AHHMS. Units A and B exhibited a 63% (95% CI, −86% to 1.1%) decrease in CDI (P = .0538) after all 3 interventions compared to units C and D.
Monthly CDI rates for each unit are indicated by different colored symbols. Most months no CDI were reported (if plotted, they would form a solid horizontal line at 0), so only nonzero CDI rates are shown. Trend of the CDI rates are indicated by different colored curves. Note. CDI, Clostridioides difficile infection. Intervention I, frontline ownership initiative (FLO); Intervention II, Chicago visit; Intervention III, Toyota Kata method.
Pooled over all 4 units, we found no significant association between the increase in HH rate and a change in the same month of the CDI rate (P = .9143) or non-CDI rate (P = .2374). When looking only at units A and B over the period September 2015–June 2018 for which both units had data, the data failed to show time-delayed effects (up to 6 months) of HH performance rates on either CDI (P = .1651) or non-CDI rates (P = .1159).
Discussion
The Hanover Hospital experience with improving HH performance illustrates several important concepts related to promotion and monitoring of HH practices. For example, average HH compliance rates from direct observations (76.7%–90%) on the 4 units when the AHHMS was installed were consistently higher than those generated by the AHHMS, which most likely reflects overestimation of compliance rates due to the Hawthorne effect.Reference Srigley, Furness, Baker and Gardam6, Reference Conway, Riley and Saiman9, Reference Kwok, Juergens and McLaws13 Exaggerated compliance rates via direct observations may also be influenced by inadequate sample sizes.Reference Sax, Allegranzi and Chraiti2, Reference Yin, Schacht Reisinger and Vander Weg5 For example, following AHHMS installation on unit A, direct observational surveys measured 10–87 HHOs per quarter, compared to 468,452 HHOs per quarter on average recorded by the AHHMS.
Introducing the FLO concept was associated with intermittent improvement of 10% in performance rates on units A (P = .0113) and B (P < .0001). In September 2016, the hospital paid for multiple nurses and an administrator to visit an out-of-state institution that had successfully implemented the same AHHMS, which demonstrated to HCP the commitment the hospital leadership had made to using the AHHMS. Insights gained during the visit resulted in new supplementary activities, including making signage and posters regarding HH and discussions on nursing units and with the Do No Harm team about ideas obtained during the trip. These activities had a substantial impact on HH performance rates on units A (52% increase over the baseline; P < .0001) and B (27% increase over FLO; P < .0001). Finally, the application of the Toyota Kata methodology to HH activities in early 2017 resulted in further substantial improvements of 85% (95% CI, 68%–103%; P < .0001) compared to the baseline in HH performance rates on units A–D (Table 2 and Fig. 1).
Although downward trends in non-CDI HAI rates occurred during the study period, the low baseline rate resulted in the study being underpowered to demonstrate a statistically significant reduction in HAI rates (Table 3). Other studies have also found an association between the use of an AHHMS and varying degrees of reduction of selected HAIs.Reference Swoboda, Earsing, Strauss, Lane and Lipsky33–Reference McCalla, Reilly, Thomas, McSpedon-Rai, McMahon and Palumbo35 Failure to achieve reductions in CDI may be related to confounding variables such as antimicrobial stewardship activities, compliance with glove use when caring for patients with CDI, handwashing practices, and/or surface disinfection protocols.Reference Dubberke, Carling and Carrico36, Reference Sitzlar, Deshpande and Fertelli37
Limitations of the study include its quasi-experimental design with stepwise implementation of multiple interventions. Because there was no formal control group in which supplementary promotional activities were implemented in the absence of the AHHMS, it is possible that HH performance improvements may have been achieved without AHHMS installation. However, between June 2014 and installation of the AHHMS on units C and D, direct observations revealed that compliance rates remained at high levels without substantial improvement, despite supplementary activities implemented by the hospital. Critical assessment of cost-effectiveness, short-term performance changes (eg, the unit A HH performance rate declined in early 2018), unit culture, and leaders would have been good additions to this study. Finally, the small hospital size may the limit generalizability of our findings.
The lack of sustained improvement in HH performance rates observed on unit A during the first year after AHHMS installation (Fig. 1) illustrates that the implementation of an AHHMS may not lead to improved HH practices unless it is part of a multimodal strategy that includes supplementary promotional activities.Reference Conway, Riley and Saiman9, Reference Kwok, Juergens and McLaws13, Reference Edmonds-Wilson, Pelz and Moore14 Hanover Hospital personnel believe that the combination of feedback of quantitative assessments of HH performance provided by the AHHMS plus supplemental promotional activities is responsible for the significant improvements in HH practices. Hanover Hospital’s experience is consistent with other studies reporting that complementary activities such as goal setting, reward incentives and accountability can result in improved HH practices when added to an AHHMS or basic multimodal strategies recommended by the World Health Organization.Reference Edmonds-Wilson, Pelz and Moore14, Reference Luangasanatip, Hongsuwan and Limmathurotsakul17, Reference Edmisten, Hall and Kernizan38
In conclusion, providing HCP with quantitative HH performance data from an AHHMS in combination with multiple supplementary promotional activities resulted in a significant and sustained increase in HH performance rates. Reductions in HAIs occurred but were not statistically significant. Additional studies that include AHHMSs as part of a multimodal strategy are needed to better define the ability of AHHMSs to produce sustained improvements in patient safety by reducing HAIs.
Author ORCIDs
John M. Boyce, 0000-0002-4626-1471
Acknowledgments
Financial support
The study was supported in part by GOJO Industries (manufacturer of the SMARTLINK system), which made an AHHMS clinical support person (P.W.) intermittently available to the Hanover Hospital during the study period.
Conflicts of interest
J.M.B. and A.E.P. are consultants for GOJO Industries. P.W. and J.W.A. are employees of GOJO Industries.


 Open access