





Introduction
Freshwater biodiversity is imperilled globally by many anthropogenic stressors (Dudgeon et al. Reference Dudgeon, Arthington, Gessner, Kawabata, Knowler and Lévêque2006), including the impoundment and extraction of freshwater resources for consumptive use (Rodell et al. Reference Rodell, Famiglietti, Wiese, Reager, Beaudoing, Landerer and Lo2018, Gerdener et al. Reference Gerdener, Kusche, Schulze, Döll and Klos2023). Damming or diverting natural flow paths secures freshwater access for domestic and agricultural use and hydroelectric dams can generate renewable energy, but such developments modify the volume and timing of natural flows and impact downstream ecosystems (Bunn & Arthington Reference Bunn and Arthington2002). This can also reduce or remove overbank flows, thereby interrupting natural patterns of wetland inundation (Maheshwari et al. Reference Maheshwari, Walker and McMahon1995). Wetland ecosystems support a disproportionately high biodiversity (Vörösmarty et al. Reference Vörösmarty, McIntyre, Gessner, Dudgeon, Prusevich and Green2010) but are more susceptible to flow modification than channel ecosystems (Kingsford Reference Kingsford2000). During the twentieth century, c. 64–71% of global wetland area was lost (Davidson Reference Davidson2014), and the extent and condition of wetlands continue to decline (Convention on Wetlands 2021). However, wetlands receive comparatively little conservation attention (Kingsford et al. Reference Kingsford, Basset and Jackson2016).
Environmental water (or flow) delivery, defined as ‘… the water regime provided within a river or coastal zone to maintain ecosystems and their benefits where there are competing water uses and where flows are regulated’ (Bergkamp et al. Reference Bergkamp, Dyson and Scanlon2008), is an increasingly implemented conservation intervention in flow-modified catchments across the globe (European Commission 2016, Kennen et al. Reference Kennen, Stein and Webb2018, Chen & Wu Reference Chen and Wu2019). Such interventions attempt to identify flow thresholds that trigger ecological responses, allowing managers to meet multiple ecological objectives with less water.
Monitoring ecological responses to environmental water typically focuses on a particular species or group (Pahl-Wostl et al. Reference Pahl-Wostl, Arthington, Bogardi, Bunn, Hoff and Lebel2013) and rarely addresses conflicting water requirements between species (Rogers & Ralph Reference Rogers and Ralph2010). For example, high-velocity flows create turbulent microhabitats and facilitate movement (e.g., dispersal of salmonids; Dunbar et al. Reference Dunbar, Alfredsen and Harby2012) but can scour important habitat features and displace species that are poorly adapted to high-flow conditions (Kupferberg et al. Reference Kupferberg, Lind, Thill and Yarnell2011). Similarly, environmental flows that target wetlands must balance the competing needs of aquatic, littoral and riparian vegetation, as well as wetland-dependent biota (Gibbs et al. Reference Gibbs, Bice, Furst, Gao, Joehnk and McCullough2023). Thus, water planners must choose from an intractable number of solutions to allocate limited resources across a range of competing needs.
Abstracting such problems into a mathematical model allows managers to compare solutions by their simulated relative probability of success. Such approaches offer a defensible basis for decision-making that would otherwise rely on guesswork; however, they scale poorly as the number of candidate solutions increases (due to the high computational cost of combinatorial problems). When the total number of solutions (the solution space) cannot be evaluated with conventional technology, applied metaheuristics provide a tractable approach to problem-solving (Blum & Roli Reference Blum and Roli2003). Rather than evaluating every solution, metaheuristics selectively iterate through the solution space using inductive learning to converge on near-optimal solutions. Metaheuristics have been widely applied to the field of water management (Maier et al. Reference Maier, Kapelan, Kasprzyk, Kollat, Matott and Cunha2014), and publication rates of applied metaheuristics in river research are increasing (Ho & Goethals Reference Ho and Goethals2022).
Genetic algorithms (Holland Reference Holland1975) are inductive metaheuristics inspired by evolution through competition and sexual reproduction. Here, an ‘objective function’ determines the ‘fitness’ of each evaluated solution, and the fittest solutions ‘interbreed’ using an approximation of sexual recombination and random genetic mutation. Genetic algorithms have been widely applied to water-resource planning (Nicklow et al. Reference Nicklow, Reed, Savic, Dessalegne, Harrell and Chan-Hilton2010) but require careful design. For example, an objective function that maximizes the abundance of a threatened bird species will prioritize this population to the detriment of the greater ecosystem. With careful formulation of the objective function and mathematical representations of the problem’s feasibility constraints, genetic algorithms can identify solutions that balance competing needs in a multi-user system, thereby guiding near-optimal returns on investment of a limited resource.
An optimal environmental flow policy must balance the competing (and sometimes conflicting) needs of the target species and critical processes (e.g., nutrient and sediment transport; Chalov et al. Reference Chalov, Liu, Chalov, Chalova, Chernov and Promakhova2018), and some systems must also balance energy generation (Suwal et al. Reference Suwal, Huang, Kuriqi, Chen, Pandey and Bhattarai2020), water security (Alvarez-Garreton et al. Reference Alvarez-Garreton, Boisier, Billi, Lefort, Marinao and Barria2023) and poverty alleviation. The many direct and indirect interactions among these objectives cannot be captured by single-user models, and balancing the various trade-offs is a wicked problem. Optimization identifies the subset of solutions where no objective can be improved without worsening another (Pareto-optimal solutions). Decision-makers can then select the most suitable compromise based on the specific priorities and constraints of their problem. In multi-user systems, the objective function frames the project’s goals and can incorporate critical needs (e.g., the most objectives met, given that conditions A and B are met), management priorities (e.g., the most objectives met in order C, D, … n) or efficiency (e.g., the lowest cost to achieve E and F).
To demonstrate the value of this approach for threatened species management and environmental water allocation, we integrated a genetic algorithm with a spatially explicit, agent-based, stochastic hydroecological model of a 70-km reach in one of the world’s most regulated river systems: the Murray–Darling Basin (south-eastern Australia). Several metaheuristic optimization approaches have been developed for this catchment, but they have typically focused on logistics and abiotic processes, such as scheduling (Szemis at al. Reference Szemis, Maier and Dandy2014) and salinity management (Rana et al. Reference Rana, Khan and Rahimi2008). The novelty of our approach was the optimization of 16 decision weights that corresponded to wetland attributes and prioritized annual environmental water allocations. Our objective function sought solutions that met the existing management plans for two wetland plant species (river red gum Eucalyptus camaldulensis and tangled lignum Duma florulenta), controlled the presence of aquatic predators (fish and crustaceans) and maximized the population response of a Vulnerable national priority species, the southern bell frog (Ranoidea raniformis).
Materials and methods
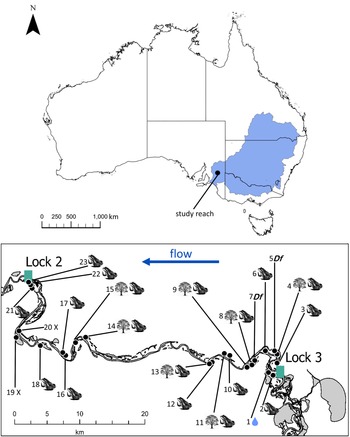
Our core ecosystem model simulated a 70-km reach in Australia’s second largest catchment: the Murray–Darling Basin (Fig. 1). This is among the world’s most regulated catchments, and up to 62% of the Basin’s flow is extracted annually for domestic and agricultural use (CSIRO 2008). Flow regimes in the modelled reach are highly modified, and the muted high-flow bands are rarely sufficient to fill adjacent wetlands. This has diminished high-flow events in the modelled reach, and the adjacent wetlands are rarely inundated by channel flows. Policy mechanisms and infrastructure operate to reinstate wetland inundation through environmental water delivery. Each year, wetlands in the reach are prioritized for delivery to support plant and animal species of management/conservation concern. Annual water budgets are limited, and delivery often incurs additional costs, such as the construction or removal of earthen bunds (sloped embankments) to retain water or portable pump operation to fill elevated or distant wetlands. This limits the number of wetlands that receive water each year.
The modelled reach lies within the Murray–Darling Basin (top plot, shaded blue). It is c. 70 km of river channel between two main channel-damming structures (Locks 3 and 2). There are 23 wetlands in the reach with historical records of Ranoidea raniformis, numbered incrementally from upstream to downstream. Symbols represent the watering priorities for each wetland: the water drop symbol at wetland 1 is watered independently of the model; ‘Df’ indicates priority watering to support Duma florulenta; the tree symbol represents priority watering to support Eucalyptus camaldulensis; the frog symbol indicates that the wetland can receive water for R. raniformis. Wetlands marked with an ‘X’ do not have the infrastructure to deliver environmental water.

Our ecosystem model follows Mathwin et al. (Reference Mathwin, Wassens, Gibbs, Young, Ye, Saltré and Bradshaw2024) and can be conceptualized as three integrated components: wetlands, biota and hydrology. For wetlands, we created a node for each of the 23 off-channel wetlands in the reach, incorporating sill height (lowest river height that fills the wetland), surface area when full (expressed as a size category: medium, n = 3; large, n = 4; or very large, n = 17), volume when full (calculated in QGIS 3.36.3 from high-resolution digital elevation models), flow conditions for the wetland to remain full for the year and a matrix of dispersal distances between each node (incorporating movement rules and landscape resistance).
For biota, we populated the ecosystem model with two vegetation management priorities (Fig. 1). Wetlands 5 and 7 have management plans for D. florulenta that fill wetlands 3 years in every 10. Additional inundation is acceptable but can impact D. florulenta and is generally avoided. Wetlands 4, 8, 9, 11, 13, 14 and 15 have management plans for E. camaldulensis that deliver water after 2 consecutive dry years, but more frequent delivery is not harmful provided there is a within-year dry period. We incorporated R. raniformis management by populating each wetland (node) with an age-classified Leslie matrix (Leslie Reference Leslie1945) and a guild of aquatic predators that reduced the survival probability of larvae during protracted wetland inundation. We incorporated agent-based R. raniformis dispersal to simulate a classic metapopulation structure (for details, see Mathwin et al. Reference Mathwin, Wassens, Gibbs, Young, Ye, Saltré and Bradshaw2024).
For hydrology, we simulated 10 000 sets of 25-year flow/river height time series for the reach (Appendix S1 Fig. S2; Mathwin et al. Reference Mathwin, Wassens, Gibbs, Young, Ye, Saltré and Bradshaw2024) and ranked them by total flow over the 25 modelled years (wetness). We selected 100 time series from the 20th percentile of wetness for modelling.
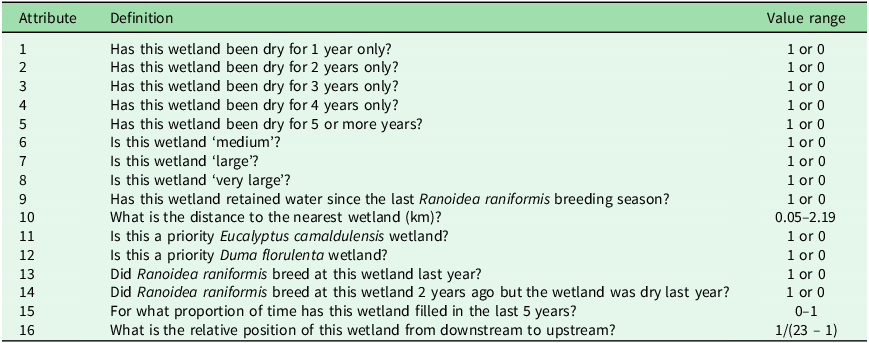
In each modelled year, we reset the environmental water budget (429.75 ML, the average annual volume delivered in this reach between 2012 and 2023) and prioritized delivery for D. florulenta and E. camaldulensis management plans. We ranked the remaining dry wetlands (assuming perfect knowledge of the system) using 16 wetland attributes as environmental watering policy indicators (Table 1). These attributes captured typical considerations for environmental water (presence of managed species, time since last wetting and the volume required) and important ecosystem processes (relative position along the reach and proximity to surrounding wetlands).
Each wetland that could receive environmental water was scored annually using 16 wetland attributes.

We represented each solution as a 16-dimensional vector of numbers in the interval [−10,10], where each element corresponded to an attribute. The relative importance of an attribute was indicated by its corresponding vector value (weight), with higher values indicating greater importance. We calculated wetland priority by multiplying each attribute by its weight, and we ranked wetlands in descending order by the sum of their weighted scores.
Each modelled year, environmental water was sequentially allocated to the highest-ranked dry wetland that could be filled with six constraints: the annual water budget, which was 429.75 ML; only 10 deliveries were possible in any 3-year period (on average 3.2 wetlands were watered annually between 2012 and 2023); wetland 1 received water every second year under an unrelated management plan (additional deliveries were allowed; Fig. 1); wetland 2 filled from wetland 1 and could only receive water if wetland 1 received water; D. florulenta wetlands could receive no more than one additional delivery every 5 years beyond their management plan (because interceding dry periods are important for the health of this species); and wetlands 19 and 20 were never watered (due to logistical constraints at those sites).
Each solution was evaluated for all 100 hydrological scenarios to calculate the objective function (solution fitness): the mean surviving R. raniformis subpopulations (extant nodes) at the 25th modelled year. Although we stochastically resampled all model parameters, the 100 hydrological scenarios were each allocated a seed to ensure consistent evaluation. Our initial solutions were generated using Latin-hypercube sampling to ensure broad initial coverage of the solution space (a 16-dimensional hypervolume). In each subsequent generation, we allowed the 100 fittest solutions an equal probability of breeding (roulette-wheel selection with replacement) using one-point crossover (selecting a single point along the 16-dimensional vector, after which all subsequent weights were exchanged) to generate two novel solutions (offspring; Goldberg Reference Goldberg1989). Each element in the offspring vectors had an independent probability of 1/16 to ‘mutate’ (modify the attribute weight; Eiben & Smith Reference Eiben and Smith2015). Mutation extent was resampled from a symmetric triangular distribution, initially ranging from −2.6 to 2.6 and narrowing to −0.6 to 0.6 over 250 generations. This prioritized early exploration of the solution space (reducing the probability of converging on local maxima) and later generations prioritized exploitation, convergence and polishing. Mutations were deflected from the extremities to maintain the interval [−10, 10] (see Appendix S1 Fig. S1 for an integrated conceptual diagram).
The model was programmed in R version 4.2.2 (R Core Team 2022) and ran on the DeepThought high-performance computing array (Flinders University 2021) for 212 generations. We incorporated an island approach (Whitley et al. Reference Whitley, Rana and Heckendorn1999) by sequentially populating three additional computers with the 50 fittest solutions and 50 novel solutions. These islands ran for 126, 83 and 26 generations, respectively. This process led to the evaluation of a total of 43 300 unique solutions. We also ran a control scenario that delivered water to D. florulenta and E. camaldulensis but not R. raniformis to reflect existing delivery priorities in the reach.
To explore fitness trade-offs among users, we reran a subset of solutions (n = 1422) using the integrated ecosystem model but removed environmental water delivery to D. florulenta and E. camaldulensis. Current watering prioritizes these plants but not R. raniformis, so the attribute weights were not reoptimized. Instead, we recalculated single-user fitness for the 500 best- and worst-performing multi-user solutions and every 100th ranked solution from 1 to 43 300.
We performed a sensitivity analysis to derive the relative influence of attribute weights on fitness using a boosted regression tree algorithm parameterized with a Gaussian distribution, 500 initial trees, tree complexity = 2, step size = 50, learning rate = 0.0001, tolerance = 0.0001, bag fraction = 0.6 and 200 000 maximum trees (Prowse et al. Reference Prowse, Bradshaw, Delean, Cassey, Lacy and Wells2016). We calculated the monotonic effect of each attribute using Kendall’s rank correlation coefficient (τ; to manage tied ranks) and modified Type I error probabilities using Bonferroni correction to control for family-wise errors.
Results
All four optimization islands converged within their respective run-times (Appendix S1 Fig. S3). On average, the control scenario delivered 164 ML per annum split across two watering actions. This resulted in an average of four R. raniformis subpopulations in the 25th modelled year (fitness).
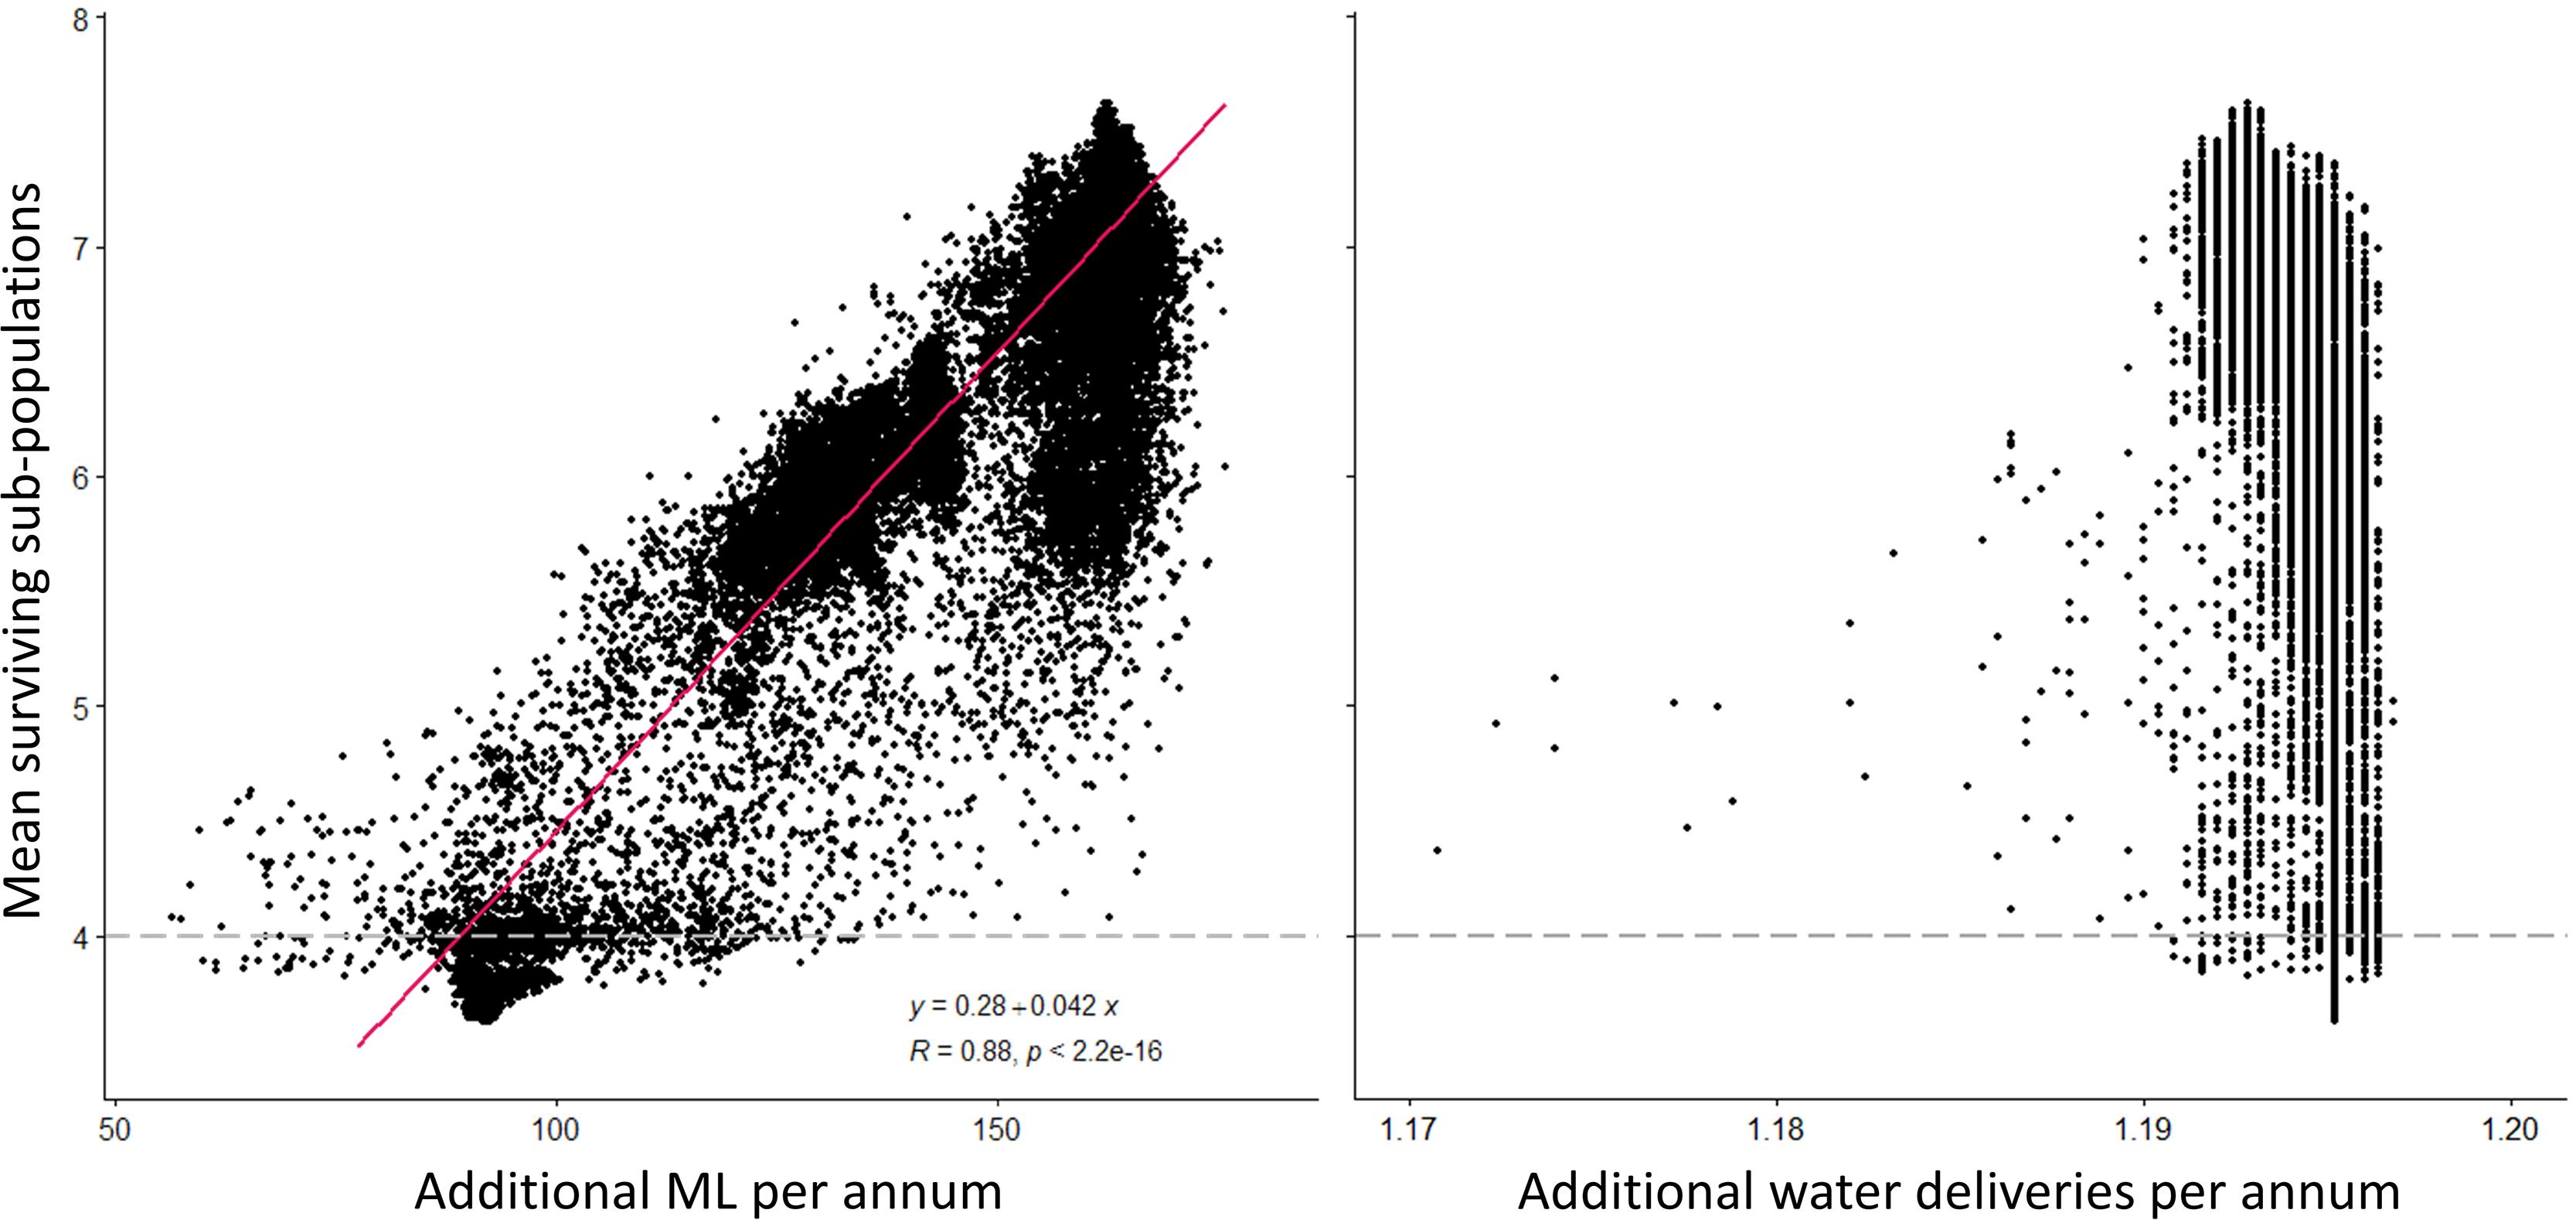
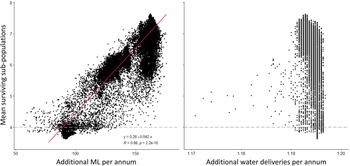
The simulated fitness of the evaluated solutions ranged from 3.63 to 7.62 (Fig. 2), increased the average count of annual water deliveries by 1.17–1.97 (58.5–98.5%) above the control scenario and increased the annual volume delivered by 56–172 ML per annum (34.1–104.8%; Fig. 2). Both total volume and the number of deliveries showed a positive linear relationship with solution fitness (Fig. 2); however, fitness varied broadly at each volume (and delivery) increment (Fig. 2).
Fitness of the 43 300 evaluated solutions plotted against additional megalitres (ML) of environmental water delivered per annum (left) and increase in the count of environmental water deliveries per annum (right) relative to the control scenario. The horizontal grey long-dash lines indicate the mean fitness of the control scenario, and the red line indicates the positive linear relationship between environmental water volume and fitness.
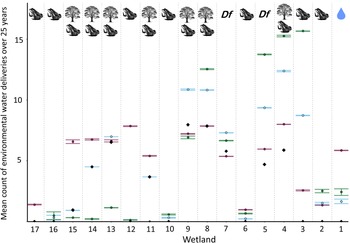
The 500 best-performing solutions had a mean fitness of 7.6 without exceeding the maximum prescriptions for D. florulenta or E. camaldulensis (Fig. 3). These solutions prioritized delivery to wetlands 3, 4, 5, 7, 8 and 9, whereas the 500 worst-performing solutions spread the available water more broadly across wetlands 1–15 (Fig. 3). Although these 1000 solutions did not prioritize delivery to the six wetlands in the downstream reach (wetlands 18, 21, 22 and 23 could have received water), this does not reflect an algorithmic bias. Many interceding solutions prioritized delivery to the downstream reach but did not feature in the 500 fittest or least-fit solutions and were not plotted.
Mean number of environmental water deliveries to each wetland by the 500 best-performing solutions (mean fitness = 7.6, in blue), the 500 worst-performing solutions (mean fitness = 3.63, in magenta) and the 500 best-performing solutions evaluated without management consideration for Duma florulenta or Eucalyptus camaldulensis (mean fitness = 9.03, in green). Horizontal coloured lines indicate one standard deviation from the mean. The mean number of deliveries in the control scenario are displayed as black diamonds. Images at the top of the plot indicate the watering priorities for that wetland and correspond to Fig. 1. Wetlands 18, 21, 22 and 23 did not receive water in these solutions and are not plotted.

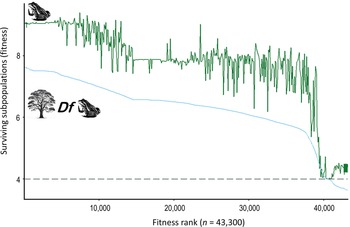
Rerunning a subset of solutions using the single-user model (by removing water allocation for D. florulenta and E. camaldulensis) increased the average number of surviving R. raniformis subpopulations for most modelled solutions (Fig. 4). For the 500 best-performing solutions, this increased the mean count of surviving subpopulations from 7.6 to 9.03 (+18.8%) but overwatered D. florulenta at wetland 5 and underwatered E. camaldulensis at wetlands 9, 11, 13, 14 and 15 (Fig. 4). The solution set evaluated by both models displayed similar overall trends; however, the relative fitness of solutions in the single-user model did not match their corresponding rank in the multi-user model, indicating differences in the relative importance of attribute weights for the two problems (Fig. 4). Reducing the number of attributes without reoptimizing weights reduced solution fitness by disrupting the synergistic interactions among weights (Appendix S1 Fig. S4).
Solution fitness of the single-user Ranoidea raniformis model (green) ranked by the corresponding solution fitness in the multi-user model (blue). The horizontal grey long-dash line indicates the mean fitness of the control scenario.

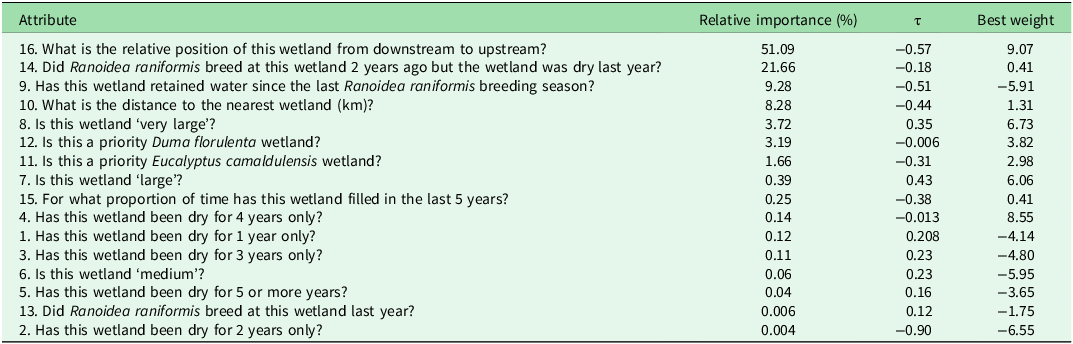
The best-performing solution had a fitness of 7.62 and attribute weights that prioritized upstream wetlands (attribute 16, weight = 9.07) and ‘very large’ wetlands (attribute 8, weight = 6.73). It also prioritized delivery to ‘large’ wetlands (attribute 7, weight = 6.06) and wetlands that had remained dry for 4 years (attribute 4, weight = 8.55). This solution placed a negative value on wetlands that had remained full for the past year (attribute 9, weight = −5.91), ‘medium’ wetlands (attribute 6) and wetlands that had been dry throughout the preceding 1, 2, 3 and 5 years (attributes 1, 2, 3 and 5, respectively; Table 2). Although the fittest solution assigned a low weight to attribute 14 (‘Did R. raniformis breed at this wetland 2 years ago but the wetland was dry last year?’ = 0.41) and a negative weight to attribute 13 (‘Did R. raniformis breed at this wetland last year?’ = −1.75), the prioritization of R. raniformis breeding habitats was met by distributed influence among the 16 weights (Table 2).
Relative importance of the 16 attributes on the variation in fitness (calculated from the boosted regression tree). Kendall’s rank correlation coefficient (τ) indicates the direction and strength of the monotonic relationship for each attribute (no relationship for attribute 12, in bold). The near-optimal weight (best weight) of each attribute is taken from the best-performing solution.
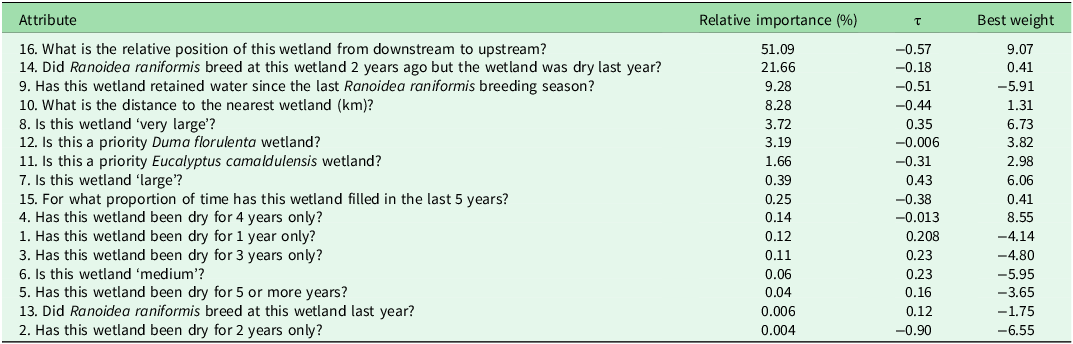
The boosted regression tree showed that varying the 16 attribute weights explained 95.56% (± 0.09%) of the observed variation in fitness. Seven of the 16 weights made a relative contribution of >1% (Table 2), and each attribute had a monotonic relationship with fitness except attribute 12 (‘Is this a priority D. florulenta wetland?’, τ = −0.0061).
Discussion
Although metaheuristics have been widely tested, our study is the first to assign decision weights to system attributes and to optimize those weights in order to prioritize interventions. As such, we have demonstrated a novel approach to identifying near-optimal environmental water allocation for three priority species. This is a promising strategy for conservation planning that has broader implications for the theory and application of applied metaheuristics.
Our fittest solution represents a near-optimal water-delivery policy to support the three species of conservation significance using commensurate resources to the current two-species approach. High adult mortality is typical for R. raniformis and can drive local extinctions (Turner et al. Reference Turner, Heard, Hall and Wassens2022); however, this species also disperses well (Wassens et al. Reference Wassens, Watts, Jansen and Roshier2008), thereby promoting population rescue at proximal wetlands (Heard et al. Reference Heard, Scroggie and Malone2012, Mathwin et al. Reference Mathwin, Wassens, Gibbs, Young, Ye, Saltré and Bradshaw2024). By clustering deliveries in the upper reach, the policy established a functional metapopulation of R. raniformis with fewer modelled local extinctions. Wetlands within this metapopulation typically included a second management target for either E. camaldulensis or D. florulenta. The model first prioritized environmental water delivery to these wetlands in accordance with current management plans. The remaining water budget was limited, and additional deliveries to these wetlands established an inundation frequency that was unachievable with the excess budget alone.
Under this policy, the highest inundation frequency to a managed E. camaldulensis wetland was 12.4 deliveries over the 25-year forecast window. Biennial inundation improves E. camaldulensis condition, with trees typically developing larger canopies and increased active sapwood compared with less frequently inundated trees (Doody et al. Reference Doody, Colloff, Davies, Koul, Benyon and Nagler2015). Biennial inundation also improves drought resilience (Souter et al. Reference Souter, Wallace, Walter and Watts2014) and confers greater capacity for post-drought recovery (Doody et al. Reference Doody, Colloff, Davies, Koul, Benyon and Nagler2015). Our modelled constraints allowed up to four successive annual inundations at E. camaldulensis wetlands, and such sequences are unlikely to harm this species (Roberts & Marston Reference Roberts and Marston2000).
Delivery frequency was also increased at D. florulenta wetlands to a maximum of 9.4 deliveries over the 25-year forecast window. Our model constrained D. florulenta deliveries to a maximum of three inundations within any 4-year period, with 1 mid-sequence dry year. In practice, this regime maintains D. florulenta in good condition with a vigorous response to environmental watering (Campbell et al. Reference Campbell, Freestone, Duncan, Higgisson and Healy2021). We therefore expect the modelled increase in environmental water delivery to generate positive outcomes for E. camaldulensis and D. florulenta wetlands, in addition to the benefits for R. raniformis.
Optimized multi-user models as decision-support tools
Our approach optimized solutions for the three species in an arid climatic phase, with interventions limited by current constraints. These solutions represent local optima within that decision space; however, fitness is conditional on the assumptions and constraints used during optimization, and we expect degraded performance outside of modelled conditions. This was apparent when reducing the number of attributes (Appendix S1 Fig. S4) and species (Fig. 4), and we expect similar degradation during different climatic phases or with modified delivery constraints. Thus, our findings do not reflect a universal best strategy for the reach because better-performing solutions are expected when modifying model conditions.
Optimization is ill-suited to generate static solutions for dynamic systems; however, it shows great potential as a decision-support tool. Such an approach could be implemented by: (1) replacing simulated hydrological scenarios with observed hydrology from the preceding 24 years; (2) using this hydrological scenario to model plausible starting states for the multiple users (informed by monitoring); and (3) optimizing decision weights for the subsequent year using forecasted flow conditions.
Algorithmic approaches can identify solutions that are beyond human recognition, and some perform better than experienced practitioners (Vaccaro et al. Reference Vaccaro, Almaatouq and Malone2024). However, they are often viewed with scepticism in management (DeAngelis et al. Reference DeAngelis, Franco, Hastings, Hilker, Lenhart and Lutscher2021). Hybrid intelligence systems combine the complementary strengths of artificial intelligence and expert practitioners and perform better than human-only decision-making (Vaccaro et al. Reference Vaccaro, Almaatouq and Malone2024). Hybrid intelligence systems offer a framework to embed optimization in environmental water allocation, producing annual recommendations that managers incorporate into the broader evidence base. This combines the advanced pattern recognition of optimized ecological models with human recognition of real-world complexities not captured by a model.
There are many examples of optimization approaches to improve simulated water management. Examples in the Murray–Darling Basin include a genetic algorithm to reduce saline groundwater incursion (Rana et al. Reference Rana, Khan and Rahimi2008), ant colony optimization to schedule environmental watering operations (Szemis et al. Reference Szemis, Maier and Dandy2014) and simulated annealing to maximize taxonomic diversity when allocating environmental water (Bennett et al. Reference Bennett, Linke, Brooks, Bush, Hitchcock, Pollino and Thompson2025). Published optimizations in water management typically focus on algorithm structure and performance rather than real-world implementation or validation (Maier et al. Reference Maier, Kapelan, Kasprzyk, Kollat, Matott and Cunha2014), and, despite extensive review, we found no reports of optimization being implemented for water management in the Murray–Darling Basin, or in any catchment globally. This could arise because practical actions are seldom published or because the time lag between method development and implementation is large. The contribution of optimization to real-world outcomes can also be ambiguous when embedded among multiple lines of evidence to inform the development of management plans or policies.
Single-species models in conservation
Single-species models are common in applied ecology (e.g., population viability analyses for International Union for Conservation of Nature assessments). However, single-species and multi-species (multi-user) approaches can generate different management recommendations. This was apparent in the single-user model that increased R. raniformis subpopulations yet harmed the two plant species, and it has been demonstrated in value-of-information analyses for prioritizing protected habitats (Raymond et al. Reference Raymond, McCune, Rosner-Katz, Chadès, Schuster, Gilbert and Bennett2020), impact assessments in commercial fisheries (Hollowed et al. Reference Hollowed, Bax, Beamish, Collie, Fogarty and Livingston2000) and population viability analyses with strong species interactions (Sabo Reference Sabo2008). Resource-allocation models should balance the competing needs for a shared resource, thereby reducing the potential for a single-user to benefit to the detriment of others. This calls into question the value of single-user approaches for allocating resources in multi-user systems.
Model considerations
We modelled wetland inundation as a binary state that incremented annually with deliveries that met each user’s needs. This ignored the timing of delivery that can be bound by availability (e.g., if deliveries are drawn from natural flow pulses or operational transfer) and hydroperiods that might not meet species’ needs (e.g., R. raniformis breed in spring and take 74 days to metamorphose; Cree Reference Cree1984). Spring deliveries that inundate for 12 consecutive weeks support our three target species by meeting the breeding requirements of R. raniformis and suitable inundation durations for mature D. florulenta and E. camaldulensis. However, deliveries targeting D. florulenta germination (Higgisson et al. Reference Higgisson, Briggs and Dyer2018) or seedlings (Capon et al. Reference Capon, James, Williams and Quinn2009) are shorter in duration than the minimum larval duration of R. raniformis, thus creating conflicts. Management plans in the reach only consider mature plants to avoid intra-annual conflicts; however, incorporating additional users or watering priorities (e.g., germination) could require adjustments to the core model to track delivery month and hydroperiod.
In practice, environmental water delivery is constrained by water availability (recalculated annually) and delivery costs. We modelled a static annual water budget of 429.75 ML; however, the largest annual volume delivered by a solution was 340.1 ML per annum. We filled wetlands by delivering water equal to their capacity. In practice, fill volumes vary by soil type and soil moisture, and filling clay-soil wetlands that have remained dry for several years can increase the volume required by 30% (to fill the deep network of cracks that develop in these soil types). Wetlands also lose water at different rates (influenced by elevation, soil type, antecedent wetting history and proximity to the groundwater table), so additional top-up deliveries could be necessary to achieve a target hydroperiod. There were insufficient data to incorporate these aspects in our model, and so we could have underestimated the volumes required. Nonetheless, all modelled scenarios returned a surplus, and underestimation was probably minor.
Delivery cost also varies according to a wetland’s proximity to the river, elevation, rate of water loss and infrastructure. Low elevation wetlands that are equipped with a regulating structure can be filled during elevated flow events with only a single visit to close the structure after filling. However, wetlands that require temporary structures (earthworks), active pumping or additional top-ups incur greater costs. We controlled for cost somewhat by matching deliveries to historical rates, but some modelled solutions could exceed delivery budgets. Developing robust tools to quantify both the volume and cost of environmental water deliveries will reduce uncertainty for water managers.
Future work could improve our approach by incorporating additional users, tuning model parameters to improve accuracy, integrating estimates of delivery costs and volumes or considering different metrics to summarize ecological outcomes across stochastic replicates (e.g., McPhail et al. Reference McPhail, Maier, Kwakkel, Giuliani, Castelletti and Westra2018). We evaluated the optimization process using a global sensitivity analysis (Table 2) and previously assessed the behaviour of the integrated systems model. However, we cannot validate our outputs due to the aridity of our simulated hydrology, the recent implementation of environmental water delivery, external factors not considered (e.g., water quality) and the paucity of frog monitoring in the reach.
Conclusion
Our optimized multi-species framework provides a tractable pathway to integrate ecological models into the annual water-planning cycle. By coupling observed hydrology, updated ecological states and short-term flow forecasts, managers could generate near-optimal watering priorities each year while retaining full control over final decisions. This hybrid approach offers a pragmatic uptake route for agencies without overhauling existing governance structures. The multi-species focus reduces the risks of allocating a shared resource through a single-species lens and can be readily integrated into the adaptive management cycle to create incremental refinements that are in-step with changing delivery constraints. Given the rich literature, continuous improvements in computation speed and progressive open-data policies, optimized multi-user models are well-positioned to improve conservation outcomes and reduce uncertainty in environmental water planning.
Supplementary material
To view supplementary material for this article, please visit https://doi.org/10.1017/S0376892926100496.
Acknowledgements
Many thanks to Grace Hodder, Allison Stokes and Bec Turner (South Australian Department for Environment and Water), Natalie Stalenberg (South Australian Department for Environment and Water and Nature Foundation SA) and Tim Field (Banrock Station Wine and Wetland Centre) for providing context on watering prioritization and delivery processes.
Financial support
This work was supported by the Murraylands and Riverland Landscapes Board and Nature Foundation SA.
Competing interests
The authors declare none.
Ethical standards
Not applicable.


 Open access

