


Introduction
Does it matter to users whether public, for-profit, or nonprofit providers deliver publicly funded welfare services? This is a core question in nonprofit scholarship, underpinning much of the motivation behind studies of the nonprofit providers. It is also a fundamental issue for policymakers making judgments about the mix of providers in the welfare models.
Yet, a review of the empirical literature shows that it is not possible to give a general answer to the question. Differences between the three sectors depend on institutional features of the welfare model, regulation, and service area. Furthermore, few empirical studies have differentiated between private nonprofit and private for-profit providers, and a majority of the studies has been conducted in the US context. Consequently, existing research has a limited scope and there is a need for research that maps variations in different aspects of services in various contexts.
This paper’s objective is to study differences in user satisfaction between public, nonprofit, and for-profit welfare providers in the Scandinavian welfare context, which is characterized by a strong demand for equality obtained through public financing and regulation. The study contributes on at least two fronts. First, the particularities of nonprofit provision of welfare services are an understudied topic in the Scandinavian welfare states. The study contributes to a growing literature on recent developments in the Scandinavian welfare mix, characterized by a growth in for-profit providers of welfare, which are more or less fully financed by public (tax) money. This literature largely ignores the nonprofits as an independent sector (Petersen and Hjelmar Reference Petersen and Hjelmar2014). Second, we use an outcome variable that is intuitively important for the stakeholders—the users—and that has become a core issue in the public debate among policymakers.
Our case is kindergartens in Oslo, Norway, which is an ideal example in the Scandinavian context of a case where all three types of providers play important roles: all providers are available for practically all citizens, and kindergartens are a core welfare service that the government regulates as such. We rely on an underutilized data source: Surveys distributed annually by the city of Oslo on user satisfaction in most service areas. The kindergarten survey is distributed to parents in all public kindergartens, as well as most for-profit and nonprofit kindergartens, reaching a sample size of more than 20,000. To our knowledge, the surveys have never been used in academic research, and the present study demonstrates the usefulness and limitations of user surveys as a tool to understand differences in the welfare mix—the division of public, for-profit, and nonprofit providers.
Background
Different Service Providers
Despite the limitations of present empirical research, the theoretical literature offers different predictions in terms of variations in service quality between public, nonprofit, and for-profit providers. A classic incentive-based argument is that any institution lacking a profit motive will produce “economic waste” in the form of unnecessary benefits to employees or other organizational excesses (Fama and Jensen Reference Fama and Jensen1983). Accordingly, public and nonprofit providers that have goals other than profit maximization may become inefficient and can thus expect lower quality than for-profits (Enjolras Reference Enjolras2009: 774). One consequence of this line of thinking is the dismantling of the (quasi-monopolist) public sector by way of “privatizing” the provision of services (Wollmann Reference Wollmann, Silva and Buček2014).
An important critique against incentive-based arguments is that incentives favor easily measurable “visible” qualities, while neglecting “invisible” qualities, which are often difficult to measure. While for-profit providers lack an incentive to prioritize invisible quality, nonprofits have managers and employees more dedicated to the service objective (instead of profit generation), and this gives incentives for improved quality production (Roomkin and Weisbrod Reference Roomkin and Weisbrod1999; Hansmann Reference Hansmann1987). Moreover, the theoretical literature often cited in nonprofit scholarship will typically argue that nonprofit providers can contribute with plurality in service content and thus deliver services more in line with individual preferences (Weisbrod Reference Weisbrod1978).
“Nonprofit” is a heterogeneous category, including different types of organizations. Stakeholder theory hypothesizes that user-controlled nonprofits (e.g., cooperatives) have dedication to quality as their prime priority (Ben-Ner and Van Hoomissen Reference Ben-Ner and Van Hoomissen1991) and thus provide better quality. A number of contributions suggest that cooperatives may be more beneficial than other nonprofits that do not have the same user-centered approach (Spear Reference Spear2000; Novkovic Reference Novkovic2008; Leviten-Reid Reference Leviten-Reid2012).
As noted above, empirical studies have rendered the mixed results as to what the differences are between providers. There seems to be an important variation between the providers depending on the regulatory regime (Leviten-Reid Reference Leviten-Reid2012: 38), rendering different findings in different models of welfare states (Caitlin Reference Caitlin2014; Petersen et al. Reference Petersen, Hjelmar and Vrangbæk2018); there is a variation between types of services (Petersen et al. Reference Petersen, Houlberg and Christensen2015), and different types of providers have found to have different kinds of qualities (Salamon and Toepler Reference Salamon and Toepler2015). Furthermore, there is a tendency in the literature to study differences between “public” and “private” providers, not differentiating between for-profit, public, and nonprofit providers. There are few empirical studies from Scandinavia that systematically differentiate between public, for-profit, and nonprofit providers. This is surprising, given the fact that nonprofits played a pivotal role in establishing the Scandinavian welfare states and historically have been an important partner with the public sector, at least in Norway and Denmark (Kuhnle and Selle Reference Kuhnle, Selle, Kuhnle and Selle1990; Sivesind and Trætteberg Reference Sivesind, Trætteberg, Sivesind and Saglie2017). In a review of extant studies on home care for the elderly, provision of child care, and the operation of nursing homes, Petersen and Hjelmar (Reference Petersen and Hjelmar2014) found no evidence of differences between private and public providers in terms of price and quality, dovetailing with most other studies and reviews of various service areas in the Scandinavian context (Hartman Reference Hartman2011; Bogen Reference Bogen2011; Feltenius Reference Feltenius, Sivesind and Saglie2017; Meagher and Szebehely Reference Meagher, Szebehely, Meagher and Szebehely2013). Only a few studies have distinguished between for-profit and nonprofit actors, and these have mostly been unable to draw robust conclusions about their differences (Gautun et al. Reference Gautun, Bogen and Grødem2013; Trætteberg Reference Trætteberg2015; Lindén et al. Reference Lindén, Fladmoe, Christensen, Sivesind and Saglie2017).
The literature comparing nonprofit, for-profit, and public kindergartens is dominated by American data that have mostly studied different forms of process quality. These studies diverge in terms of design and conclusions, making it difficult to derive a coherent summary. Some find quality differences related to the sector of the provider (Morris and Helburn Reference Morris and Helburn2000; Sosinsky et al. Reference Sosinsky, Lord and Zigler2007), or that there are no such differences (Mocan Reference Mocan1997), while others find that structural features like regulation (Phillipsen et al. Reference Phillipsen, Burchinal and Howes1997), market structure (Cleveland and Krashinsky Reference Cleveland and Krashinsky2009), or both (Koning et al. Reference Koning, Noailly and Visser2007) determine performance differences between for-profit and nonprofit providers.
In a study comparing cooperatives with other nonprofits and with for-profits, Leviten-Reid (Reference Leviten-Reid2012) found no differences in terms of quality of service in the kindergartens. She could, however, document greater parental involvement in cooperatives. It is also striking that greater parental participation in boards was a predictor for quality. In Norway, parents normally control the board in parent-owned cooperative kindergartens.
Studies based on North American data do not necessarily travel easily to Europe, where the public sector plays a much more important role in the welfare mix. Studying kindergartens in Sweden, Vamstad (Reference Vamstad2012) found that parents in cooperative (nonprofit) childcare facilities were more content with services than parents in public institutions. In this study, for-profit providers were not included. A study comparing quality based on ethnographic observations in kindergartens found no differences between public and private providers in Norway (Bjørnestad and Os Reference Bjørnestad and Os2018). The study did not differentiate between nonprofit and for-profit providers. To our knowledge, only Lindén et al. (Reference Lindén, Fladmoe, Christensen, Sivesind and Saglie2017) have made comparisons of kindergartens in all three sectors in Scandinavia. They found somewhat higher user satisfaction among users of for-profit, compared with nonprofit, kindergartens in Norway. However, due to data limitations (few observations), the study failed to produce statistically significant differences between providers when controlling for users’ sociodemographic characteristics.
What these studies reveal is that the differences between public, nonprofit, and for-profit providers depend on the institutional setting, and that the broad expectations that can be inferred from the theoretical literature is difficult to identify in empirical studies. Moreover, in spite of these differences being at the core of nonprofit scholarship, there is a limited amount of relevant studies from which to build expectations. Due to the important role of institutional features of the welfare model, it is necessary to examine the differences between public, for-profit, and nonprofit providers across service areas and welfare models and to be specific about which aspect of the provision one wants to understand. In this paper, we contribute by investigating parental satisfaction within the Scandinavian welfare context.
Civil Society and the Welfare State in Norway
The Norwegian (and Scandinavian) societal model encompasses a distinct welfare component and a civil society component, which are intertwined. The Scandinavian model of civil society is characterized by a high level of citizen participation in voluntary organizations, measured in terms of memberships and in volunteers (Henriksen et al. Reference Henriksen, Strømsnes, Svedberg, Henriksen, Strømsnes and Svedberg2019). Voluntary organizations have traditionally recruited broadly and have been important for social integration and equality (Enjolras and Strømsnes Reference Enjolras, Strømsnes, Enjolras and Strømsnes2018). During the expansion of the welfare state in the after-war period, civil society organizations played a major role in the provision of welfare services and constituted an important practical and ideological alternative to the state, while the market was not yet a relevant player (Selle et al. Reference Selle, Strømsnes, Loga, Enjolras and Strømsnes2018).
Over the last few decades, however, service provision has been professionalized with paid staff delivering most services. Moreover, for-profit market actors have gained importance in the welfare mix, propelled partly by new public management reforms that have come to dominate the relations between the state as a funder and the non-public providers (Selle et al. Reference Selle, Strømsnes, Loga, Enjolras and Strømsnes2018). Parallel with the growth of the welfare state, Scandinavian civil societies have increasingly become dominated by leisure organizations, and organizations providing welfare services constitute a moderate share of the organizational landscape (Henriksen et al. Reference Henriksen, Strømsnes, Svedberg, Henriksen, Strømsnes and Svedberg2019). Yet, as the Norwegian nonprofit providers have lost its relative position over the last decades, they remain an important part of the welfare mix with approximately 80% of the welfare market as a whole. Moreover, the nonprofit sector has grown substantially in real numbers over the last decades as the entire welfare sector has expanded. For-profit growth has come mainly at the expense of the public sector (Sivesind Reference Sivesind, Sivesind and Saglie2017). The nonprofit kindergartens represent a wide set of institutions like local diaconal kindergartens, cooperatives, small foundations, and one big chain of nonprofit kindergartens. What sets the nonprofit kindergartens apart from nonprofit service providers in other service areas is that there are mostly local cooperatives where the parents own the one kindergarten their child attends and other small nonprofit entities. Few kindergartens are part of big national organizations like those that we find, for example, in care for the elderly, where big national professional organizations dominate among the nonprofits.
Equity in service quality is historically one of the central features of the Scandinavian model (Rothstein Reference Rothstein1998). Traditionally, key strategies to obtain equal service quality for all citizens have been in place through the state: public financing, public regulation, and public provision of core welfare services (Fritzell et al. Reference Fritzell, Hvinden and Kautto2005). The nonprofit sector has played an important role alongside the state, but overall, the welfare mix in Scandinavia is probably dominated more by the public sector than in any other western region (Anheier and Salamon Reference Anheier, Salamon, Powell and Steinberg2006; Salamon et al. Reference Salamon and Sokolowski2004). In order to uphold the egalitarian ideals of the welfare model while increasing the use of NPM and for-profit providers, the state heavily subsidizes and regulates the private contractors. This is probably an important explanation as to why some studies have found smaller differences between private and public providers in Scandinavia than in Anglo-Saxon countries (Caitlin Reference Caitlin2014). A prerequisite enabling non-public providers to deviate from the public norm is that they have a certain degree of administrative freedom to develop distinctive services and that users are free to choose a provider that fits their preferences (Sivesind et al. Reference Sivesind, Trætteberg, Saglie, Sivesind and Saglie2017).
Measuring “Quality” Through User Satisfaction
The practice of conducting user satisfaction surveys on public services is a relatively new phenomenon, one that became widespread in the USA in the 1990s and then subsequently in Europe (Lindén et al. Reference Lindén, Fladmoe, Christensen, Sivesind and Saglie2017: 262).
The use of user surveys to inform us about sector differences must be done with careful interpretation. Although some studies (e.g., Charbonneau and Van Ryzin Reference Charbonneau and Van Ryzin2012) have demonstrated that user surveys and objective indicators correspond, other studies suggest we should be careful when assuming a consistent relationship between performance, experienced performance, and satisfaction (Andersen and Hjortskov Reference Andersen and Hjortskov2016). There are various reasons for this. First, answers on a user survey can be based on users’ predispositions and expectations, not necessarily on aspects of the provider (James Reference James2007). Second, in the case of kindergartens, users are next of kin (parents), visiting kindergartens for a very limited part of the time when their children are present. Third, although users formally have freedom in choosing kindergartens, in practice, there is often a supply shortage. Therefore, most parents accept what they can get, as long as it is near their homes. Thus, while parents’ free choice is a formal right, it is not necessarily always a reality. Fourth, the supply of for-profit and nonprofit kindergartens might not be equal across neighborhoods in Oslo. Findings from Sweden show that for-profit and nonprofit schools are more likely to be found in wealthy neighborhoods, leaving poorer neighborhoods primarily to public providers (Gustafsson et al. Reference Gustafsson, Sörlin and Vlachos2016: 51). We can remedy some of this by controlling for neighborhood wealth in the analysis, but we cannot fully rule out problems in selection bias.
Even if user satisfaction is not a perfect measure of actual “quality,” it is a component of perceived quality and an important part of the big picture when assessing a service area. It is also an important aspect to study in its own right. In the case of kindergartens, parents are responsible for their children, and it is their right and privilege to make good decisions on their child’s behalf. Since information is a key factor in any purchase of a service, a user survey captures the assessment done by users with their available information. Welfare services are services where quality is inherently difficult to assess (Moberg et al. Reference Moberg, Blomqvist and Winblad2016; Ben-Ner et al. Reference Ben-Ner, Hamann and Ren2018). The reputation of the providers is therefore a key factor, and there are few comparative indicators available for parents seeking information about kindergartens (Vlassopoulos Reference Vlassopoulos2009). The importance of user surveys in this regard is underlined by the observation that many kindergartens use the results from the surveys to promote their kindergarten in order to attract more clients. The results from user surveys are thus instrumental to the dynamic between the nonprofit, for-profit, and public sectors. In effect, the surveys might affect user choice among parents searching for a proper kindergarten for their children.
The Case: Kindergartens in Oslo
Kindergartens in Oslo represent a good case to illustrate the differences between public, nonprofit, and for-profit providers in the Scandinavian welfare context. To make general inferences about satisfaction with different sectors, it is beneficial that all sectors have a certain share of the market and are not only catering to niches in the margins of the citizenry. This situation is usually not common in Scandinavia (Sivesind Reference Sivesind, Sivesind and Saglie2017), but kindergartens in Oslo are one of the exceptions in that all three sectors have an important share: Public providers constitute about half of the market, whereas for-profit and nonprofit providers share the other half. Kindergartens are a service area with considerable public regulation, like all welfare in Norway, but the flexibility in the public guidance is larger than in, for example, hospitals and elderly care, and all kindergartens are subject to the same national legislation, unlike, for example, schools in Norway and Denmark. Both the market situation and the national legislation thus make kindergartens a suitable case for studies of sector differences in Scandinavian welfare.
In Norway, kindergartens—also referred to as day care centersFootnote 1—are voluntary to use, but widely seen as a natural first step on the educational ladder (Trætteberg and Lidén Reference Trætteberg and Lidén2018). Most children in Norway enroll in kindergartens at the age of one, and more than 99% of children attend kindergartens at some point before being enrolled in compulsory schooling at the age of six (Moafi Reference Moafi2017). Most kindergartens offer services to children in all age groups between one and six.
Kindergartens are a municipal service, which means that even if regulation is mostly national, municipalities run public kindergartens and are responsible for the funding and supervision of non-public kindergartens. Oslo—the nation’s capital and the largest municipality in Norway—is a particularly relevant case to study for at least two reasons. First, Oslo is densely populated, and most families can find public, nonprofit, and for-profit kindergartens near their homes. In theory, there is free choice with kindergartens, meaning parents can apply to any kindergarten they want. All kindergartens are listed with key information on the city of Oslo website. However, as discussed above, due to capacity shortages, real user choice is sometimes limited. Approximately, one-third of the kindergartens are nonprofit, something that enables us to examine both parent-owned cooperatives and other nonprofits separately. Second, in accordance with national legislation, regardless of service provider, the fee that parents pay for a kindergarten is capped at a relatively low level. However, kindergartens can charge extra for food service, which has resulted in significant variations: Some kindergartens charge no extra fee and expect kids to bring lunchboxes, while others offer warm meals every day and increase the total payment by as much as 30%. To keep costs for parents low, the city of Oslo has prohibited public kindergartens from charging more than what it costs to offer a simple meal with bread every day. In this way, the city has put a straitjacket on one of the areas in which national regulation leaves the most room for kindergartens to adapt services to parents’ preferences.
Thus, food service is the one important exception to the maximum fee kindergartens are allowed to charge parents, and it is particularly interesting to see whether differences in user satisfaction are related to food service. It is likely that for-profit and nonprofit providers on average offer more expensive food services because they find this to be in line with parents’ preferences. Therefore, one would expect that users of for-profits and nonprofits are more satisfied with the food service than users of public kindergartens, which, in turn, might lead to higher user satisfaction overall.
Data and Methods
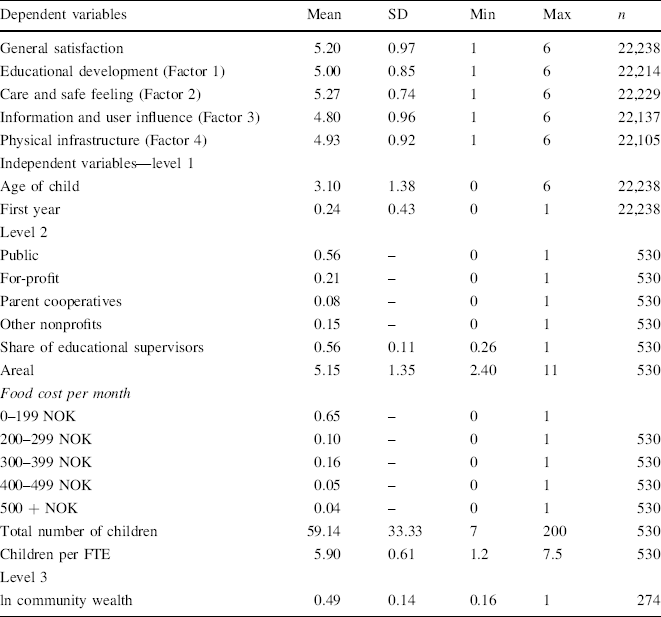
We rely on a large-scale survey on user satisfaction with kindergartens, carried out in Oslo in 2015. The survey was distributed to parents with children in all public kindergartens, as well as most for-profit and nonprofit kindergartens. Parents provided unique answers for each individual child, reaching a sample size of more than 24,000. In 2015, nearly 37,000 children were enrolled in kindergartens in Oslo, indicating that about 65% of users responded to the survey.Footnote 2 The survey was developed and administered by the city administration, and although certain non-public kindergartens did not take part, the vast majority of parents with children in a kindergarten were invited to participate. There is a possibility that non-public kindergartens not participating in the survey deviate from those participating, but, unfortunately, we do not have information on the kindergartens that did not participate. If there are systematic differences, one might expect poor-performing kindergartens to avoid participating in the survey, leading to somewhat inflated satisfaction scores among non-public kindergartens. We do, however, believe this to be a minor problem, as the vast majority of the kindergartens participated. As shown in Table 1, the share of non-public kindergartens in the sample is fairly similar to the real distribution of kindergartens in Oslo.
Descriptive statistics

Dependent variables |
Mean |
SD |
Min |
Max |
n |
|---|---|---|---|---|---|
General satisfaction |
5.20 |
0.97 |
1 |
6 |
22,238 |
Educational development (Factor 1) |
5.00 |
0.85 |
1 |
6 |
22,214 |
Care and safe feeling (Factor 2) |
5.27 |
0.74 |
1 |
6 |
22,229 |
Information and user influence (Factor 3) |
4.80 |
0.96 |
1 |
6 |
22,137 |
Physical infrastructure (Factor 4) |
4.93 |
0.92 |
1 |
6 |
22,105 |
Independent variables—level 1 |
|||||
Age of child |
3.10 |
1.38 |
0 |
6 |
22,238 |
First year |
0.24 |
0.43 |
0 |
1 |
22,238 |
Level 2 |
|||||
Public |
0.56 |
– |
0 |
1 |
530 |
For-profit |
0.21 |
– |
0 |
1 |
530 |
Parent cooperatives |
0.08 |
– |
0 |
1 |
530 |
Other nonprofits |
0.15 |
– |
0 |
1 |
530 |
Share of educational supervisors |
0.56 |
0.11 |
0.26 |
1 |
530 |
Areal |
5.15 |
1.35 |
2.40 |
11 |
530 |
Food cost per month |
|||||
0–199 NOK |
0.65 |
– |
0 |
1 |
|
200–299 NOK |
0.10 |
– |
0 |
1 |
530 |
300–399 NOK |
0.16 |
– |
0 |
1 |
530 |
400–499 NOK |
0.05 |
– |
0 |
1 |
530 |
500 + NOK |
0.04 |
– |
0 |
1 |
530 |
Total number of children |
59.14 |
33.33 |
7 |
200 |
530 |
Children per FTE |
5.90 |
0.61 |
1.2 |
7.5 |
530 |
Level 3 |
|||||
ln community wealth |
0.49 |
0.14 |
0.16 |
1 |
274 |
The survey included several questions measuring user satisfaction with different aspects of kindergartens, making it possible to study whether different providers have distinct qualities. Furthermore, as will be described in more detail below, we added contextual data on each kindergarten and the geographical area in which each kindergarten is located.
Due to the hierarchical structure of the data set, we employed three-level linear regression models, in which Level 1 comprises individual responses, Level 2 includes characteristics of each kindergarten, and Level 3 is the neighborhood where various kindergartens are located.
Dependent Variables
To study whether different providers have distinct qualities, we constructed five different dependent variables on user satisfaction:
General satisfaction consists of mean responses on two general items (“All in all, are you satisfied with your daycare center?”Footnote 3 and “Would you recommend your daycare center to others?”). Answers to each single item were provided on a scale of 1 (“Dissatisfied”) to 6 (“Satisfied”).
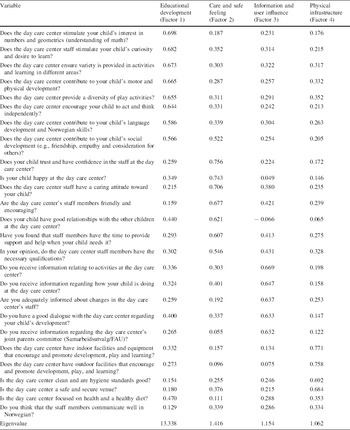
In addition to these general items, the questionnaire consisted of 26 items measuring satisfaction with more detailed features of the kindergartens, using the same 1–6 scale. A principal component factor analysis revealed that 23 of these items cluster in four separate factors (one item loads on two factors, whereas two items do not load on any factor). We constructed four dependent variables based on mean scores on the variables comprising these factors. The results from the factor analysis and exact question wording of each item are displayed in Table 4 in Appendix.
Educational development (Factor 1) comprises seven items that all measure the role that kindergartens have as educational institutions, where children develop physical, social, and cognitive skills, in addition to language.
Care and safe feeling (Factor 2) comprises seven items that center around how parents perceive the care given to their children, i.e., whether the children are happy, have good relations with staff and other children, and are generally looked after in a satisfying manner.
Information and user influence (Factor 3) comprises five items about the information that parents receive regarding the day-to-day operation of the kindergarten and changes that take place generally, as well as the development of the child specifically.
Physical infrastructure (Factor 4) comprises four items measuring whether indoor and outdoor facilities are satisfying for development, playing, and learning, as well as the quality of hygiene and venue security standards.
The five dependent variables are highly correlated, with correlation coefficients ranging from r = 0.58 (Factor 3 and Factor 4) to 0.80 (general satisfaction and Factor 2), indicating that generally satisfied users express high satisfaction with a kindergarten regardless of what feature is measured.
Independent Variables
We constructed independent variables on three levels. The survey did not include many background variables, but on the individual level (Level 1), we included controls for age of the child (0–6 years) and dummy identifying users with short experience, i.e., children who first entered kindergarten during the most recent year.
On the kindergarten level (Level 2), the principal variable is provider, which distinguishes between public, for-profit, nonprofit parent cooperatives and other nonprofit providers. The city of Oslo owns all public kindergartens. Other nonprofit providers comprise mainly charities, voluntary organizations, and diaconal institutions, whereas for-profit kindergartens are mostly joint-stock companies in which some are part of big chains of kindergartens, while others are independent or have owners who own only a few institutions.
Family- and employer-supported kindergartens were excluded from the analyses, as these do not fit well within any of the main categories. Family kindergartens typically consist of an independent childminder looking after a small number of children for a limited time, often in the childminder’s own home. It is a substantively different form of service than the regular kindergartens. Employer-supported kindergartens are owned and operated by firms, and all users are employees of those firms. The kindergartens themselves are not different from regular kindergartens, but their financial situation and user selection make them difficult to compare. This is a relatively marginal offer as only very few employers have their own kindergartens.
Another key variable on the kindergarten level is food cost per month, which, as mentioned above, is the only expense that varies among kindergartens. Food cost per month is likely to be correlated with the quality of food service in the kindergartens. It correlates with an item in the survey concerning satisfaction as to whether kindergartens “focused on health and a healthy diet.” This variable did not load on any of the factors we estimated to construct dependent variables (see Table 4). The mean score on this item is 4.6 (on a 1–6 scale) in kindergartens with NOK 0–199 in monthly food cost, 5.0 in kindergartens with NOK 300–399 in monthly food cost, and 5.3 in kindergartens with NOK 500 + in monthly food cost.
Additional variables on the kindergarten level are overall size (total number of children), number of children per employee (FTE: full-time equivalent), share of educational supervisors per FTE, and size of playing area per child. Variables on the kindergarten level were constructed on the basis of official information from the city of Oslo and the Norwegian Directorate for Education and Training.
On the geographical level (Level 3), we included a variable measuring economic affluence (log of mean score on residents’ average income and fortune) in the neighborhood (postal code) where each kindergarten is located. Oslo is a city with considerable socioeconomic inequalities among different neighborhoods (Ljunggren Reference Ljunggren2017), and these inequalities might lead to selection effects in which parents from different socioeconomic strata systematically choose different kindergartens (Ball Reference Ball2003; Yang Hansen and Gustafsson Reference Yang Hansen and Gustafsson2016). Oslo has more than 630 unique postal codes (and about 680,000 inhabitants), making it a rather nuanced measure of neighborhoods. The data set shows that public kindergartens are overrepresented in poor areas, while for-profit and parent cooperative kindergartens are overrepresented in affluent areas (correlation coefficients between neighborhood wealth and provider are r = − 0.27 [public], r = 0.19 [for-profit], r = 0.15 (parent cooperatives), and r = 0.04 [other nonprofits]). Thus, geographical affluence may affect quality/user satisfaction directly, and in addition, this variable indirectly controls for the affluence level of individual respondents. Ideally, we wanted a measure of individual affluence, but this was not included in the survey. However, as most parents choose kindergartens located near their homes, a strong correlation likely exists between individual and neighborhood affluence.
Descriptive statistics for all variables are summarized in Table 1. A total of more than 22,000 users with children in one of the 530 public, for-profit, parent cooperatives or other nonprofit kindergartens participated in the survey in 2015. These kindergartens were located in 274 neighborhoods in Oslo. Table 1 further shows that more than half of the kindergartens were operated by a public provider, 23% were operated by a for-profit provider, 8% were parent cooperatives, and 15% were operated by another nonprofit provider. As mentioned above, this distribution is fairly similar to the real distribution of kindergartens in Oslo (see also case description above).
Results
We present the results in two steps, the first of which entails demonstrating the relationship between the provider and the different measures of satisfaction, including control variables on the three levels stepwise. In the second step, multilevel models that include all control variables are presented.
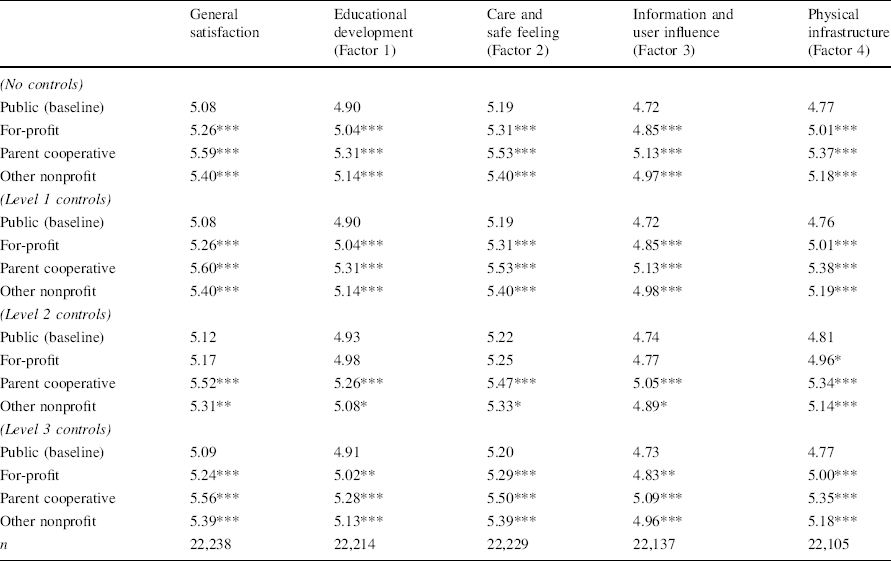
Table 2 displays user satisfaction (predicted probabilities based on the margins command in Stata) with kindergartens by provider and controlling for variables on Levels 1, 2, or 3 stepwise. The table shows that satisfaction with for-profit, parent cooperatives, and other nonprofit kindergartens is significantly higher than satisfaction with public kindergartens when controlling for Level 1 (age of child and first year attending) and Level 3 variables (neighborhood wealth). However, when controlling for Level 2 (kindergarten characteristics) variables, the differences in user satisfaction are reduced, particularly between public and for-profit kindergartens, in which the difference is no longer statistically significant.
User satisfaction with kindergartens by provider

General satisfaction |
Educational development (Factor 1) |
Care and safe feeling (Factor 2) |
Information and user influence (Factor 3) |
Physical infrastructure (Factor 4) |
|
|---|---|---|---|---|---|
(No controls) |
|||||
Public (baseline) |
5.08 |
4.90 |
5.19 |
4.72 |
4.77 |
For-profit |
5.26*** |
5.04*** |
5.31*** |
4.85*** |
5.01*** |
Parent cooperative |
5.59*** |
5.31*** |
5.53*** |
5.13*** |
5.37*** |
Other nonprofit |
5.40*** |
5.14*** |
5.40*** |
4.97*** |
5.18*** |
(Level 1 controls) |
|||||
Public (baseline) |
5.08 |
4.90 |
5.19 |
4.72 |
4.76 |
For-profit |
5.26*** |
5.04*** |
5.31*** |
4.85*** |
5.01*** |
Parent cooperative |
5.60*** |
5.31*** |
5.53*** |
5.13*** |
5.38*** |
Other nonprofit |
5.40*** |
5.14*** |
5.40*** |
4.98*** |
5.19*** |
(Level 2 controls) |
|||||
Public (baseline) |
5.12 |
4.93 |
5.22 |
4.74 |
4.81 |
For-profit |
5.17 |
4.98 |
5.25 |
4.77 |
4.96* |
Parent cooperative |
5.52*** |
5.26*** |
5.47*** |
5.05*** |
5.34*** |
Other nonprofit |
5.31** |
5.08* |
5.33* |
4.89* |
5.14*** |
(Level 3 controls) |
|||||
Public (baseline) |
5.09 |
4.91 |
5.20 |
4.73 |
4.77 |
For-profit |
5.24*** |
5.02** |
5.29*** |
4.83** |
5.00*** |
Parent cooperative |
5.56*** |
5.28*** |
5.50*** |
5.09*** |
5.35*** |
Other nonprofit |
5.39*** |
5.13*** |
5.39*** |
4.96*** |
5.18*** |
n |
22,238 |
22,214 |
22,229 |
22,137 |
22,105 |
Marginal means from multilevel models. Entries are marginal means from multilevel linear regression models. Level 1 controls include age of child and first year attendance. Level 2 controls include share of educational supervisors, areal, food cost per month, total number of children, and children per FTE. Level 3 controls include (ln) community economic affluence
***p = 0.001; **p = 0.01; *p = 0.05; †p = 0.1
Thus, certain kindergarten features explain differences in user satisfaction. Looking more closely at the different Level 2 variables, we find that food cost per month seems particularly important. Excluding all explanatory factors except food cost per month in the multivariate regression models produces fairly similar differences between providers as in models controlling for all Level 2 variables. Figure 1 illustrates the differences in user satisfaction between public providers (baseline) and for-profit, parent cooperatives, and other nonprofit providers with no controls (“dark-gray dots”) and only including controls for food cost (“light-gray dots”).
Satisfaction with child care institutions in Oslo in 2015, unadjusted and adjusted for monthly food cost. Marginal means from multilevel regression analysis. Deviations from public provider
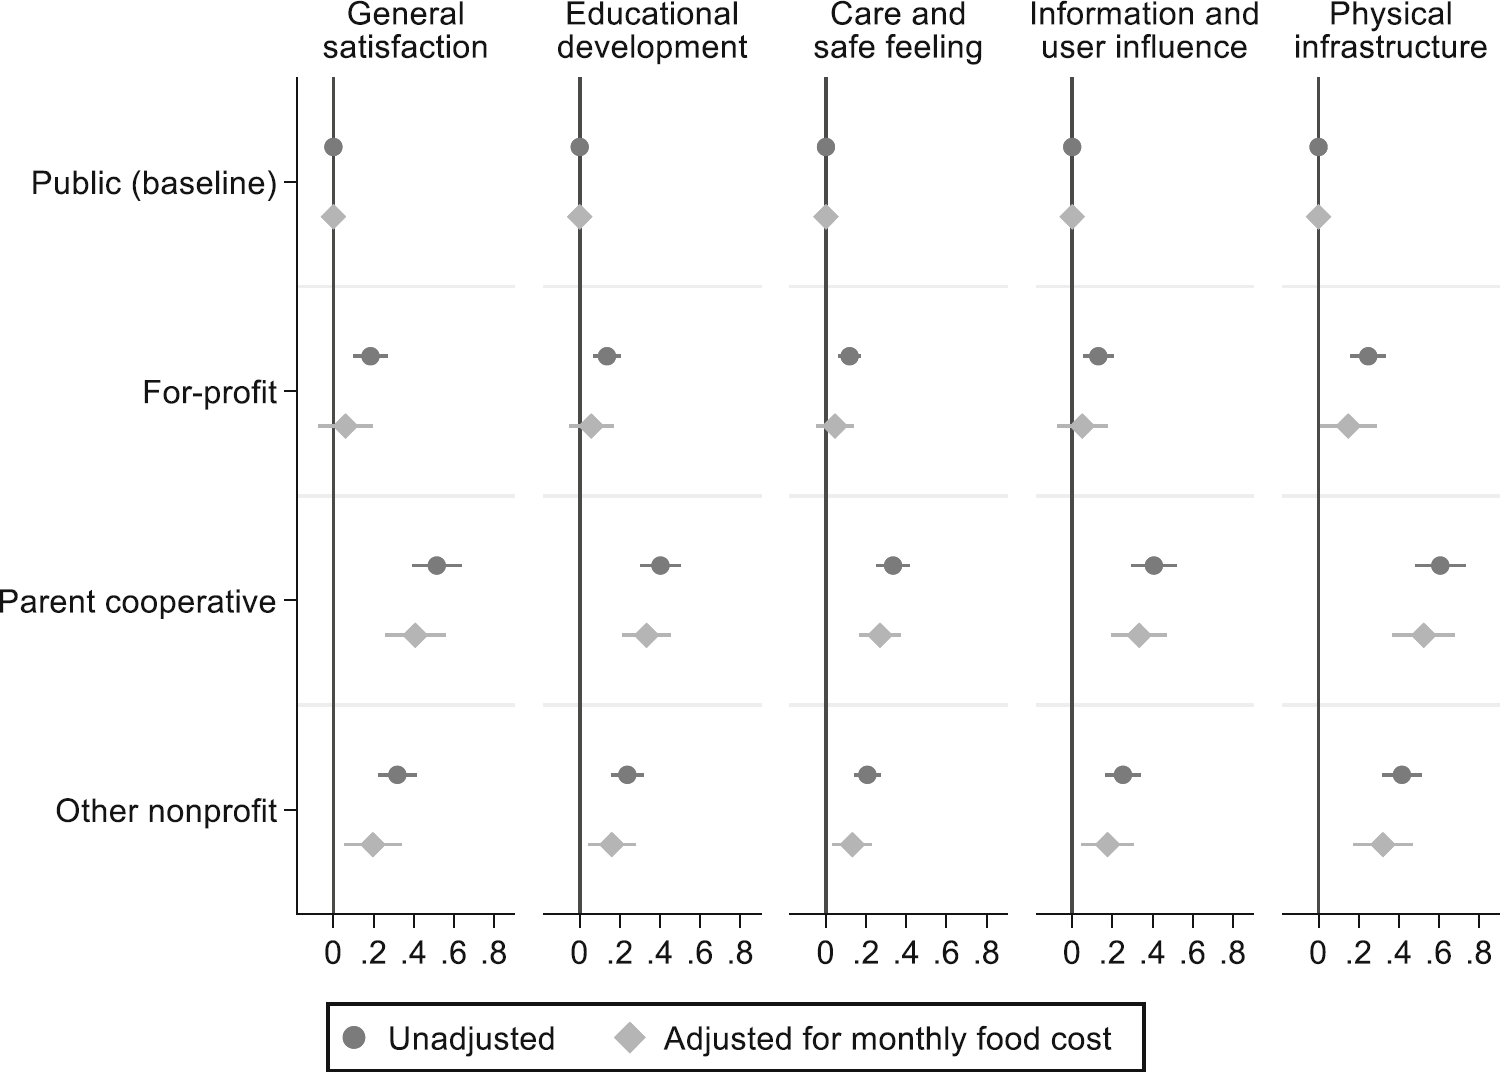
Figure 1 shows that differences in satisfaction scores between public providers on the one hand and for-profit and nonprofit providers on the other hand are reduced when controlling for monthly food cost. Indeed, adjusting for food cost, the difference between for-profit and public providers is no longer statistically significant on four out of five measures. The only significant difference is on the measure of satisfaction with physical infrastructure, but this difference is small (0.15 on a 1–6 scale) and only significant at the 0.05 level—which is a rather weak level of significance in a survey with more than 20,000 respondents. All measures of satisfaction generally follow the same pattern, in which parent cooperatives and other nonprofit providers yield the highest scores, followed by for-profit and public providers. The substantive differences are limited, but satisfaction with physical infrastructure stands out somewhat. On this particular measure, adjusted for food cost, users of parent cooperatives express 0.5 scale point higher satisfaction than users of public kindergartens. One possible explanation is that public kindergartens on average are older and more “worn out.” Alternatively, non-public kindergartens may be better at maintaining their infrastructure. Unfortunately, we did not have data that could measure such mechanisms directly.
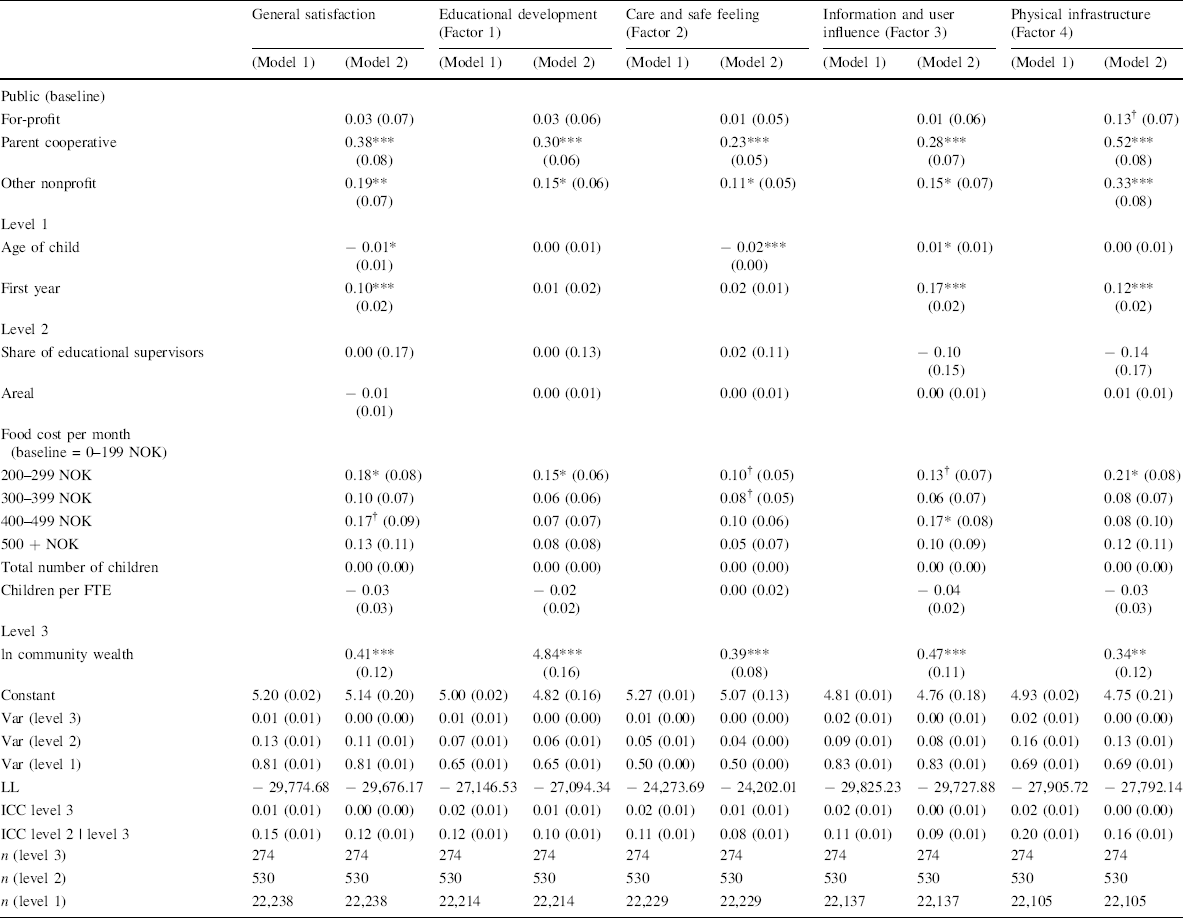
Including all variables simultaneously does not alter these findings much (Table 3). Across all analyses, satisfaction is highest among users of parent cooperatives, followed by other nonprofit kindergartens. For-profit kindergartens do not deviate significantly from public kindergartens when including all controls.
User satisfaction with kindergartens in Oslo in 2015, multilevel linear regression

General satisfaction |
Educational development (Factor 1) |
Care and safe feeling (Factor 2) |
Information and user influence (Factor 3) |
Physical infrastructure (Factor 4) |
||||||
|---|---|---|---|---|---|---|---|---|---|---|
(Model 1) |
(Model 2) |
(Model 1) |
(Model 2) |
(Model 1) |
(Model 2) |
(Model 1) |
(Model 2) |
(Model 1) |
(Model 2) |
|
Public (baseline) |
||||||||||
For-profit |
0.03 (0.07) |
0.03 (0.06) |
0.01 (0.05) |
0.01 (0.06) |
0.13† (0.07) |
|||||
Parent cooperative |
0.38*** (0.08) |
0.30*** (0.06) |
0.23*** (0.05) |
0.28*** (0.07) |
0.52*** (0.08) |
|||||
Other nonprofit |
0.19** (0.07) |
0.15* (0.06) |
0.11* (0.05) |
0.15* (0.07) |
0.33*** (0.08) |
|||||
Level 1 |
||||||||||
Age of child |
− 0.01* (0.01) |
0.00 (0.01) |
− 0.02*** (0.00) |
0.01* (0.01) |
0.00 (0.01) |
|||||
First year |
0.10*** (0.02) |
0.01 (0.02) |
0.02 (0.01) |
0.17*** (0.02) |
0.12*** (0.02) |
|||||
Level 2 |
||||||||||
Share of educational supervisors |
0.00 (0.17) |
0.00 (0.13) |
0.02 (0.11) |
− 0.10 (0.15) |
− 0.14 (0.17) |
|||||
Areal |
− 0.01 (0.01) |
0.00 (0.01) |
0.00 (0.01) |
0.00 (0.01) |
0.01 (0.01) |
|||||
Food cost per month (baseline = 0–199 NOK) |
||||||||||
200–299 NOK |
0.18* (0.08) |
0.15* (0.06) |
0.10† (0.05) |
0.13† (0.07) |
0.21* (0.08) |
|||||
300–399 NOK |
0.10 (0.07) |
0.06 (0.06) |
0.08† (0.05) |
0.06 (0.07) |
0.08 (0.07) |
|||||
400–499 NOK |
0.17† (0.09) |
0.07 (0.07) |
0.10 (0.06) |
0.17* (0.08) |
0.08 (0.10) |
|||||
500 + NOK |
0.13 (0.11) |
0.08 (0.08) |
0.05 (0.07) |
0.10 (0.09) |
0.12 (0.11) |
|||||
Total number of children |
0.00 (0.00) |
0.00 (0.00) |
0.00 (0.00) |
0.00 (0.00) |
0.00 (0.00) |
|||||
Children per FTE |
− 0.03 (0.03) |
− 0.02 (0.02) |
0.00 (0.02) |
− 0.04 (0.02) |
− 0.03 (0.03) |
|||||
Level 3 |
||||||||||
ln community wealth |
0.41*** (0.12) |
4.84*** (0.16) |
0.39*** (0.08) |
0.47*** (0.11) |
0.34** (0.12) |
|||||
Constant |
5.20 (0.02) |
5.14 (0.20) |
5.00 (0.02) |
4.82 (0.16) |
5.27 (0.01) |
5.07 (0.13) |
4.81 (0.01) |
4.76 (0.18) |
4.93 (0.02) |
4.75 (0.21) |
Var (level 3) |
0.01 (0.01) |
0.00 (0.00) |
0.01 (0.01) |
0.00 (0.00) |
0.01 (0.00) |
0.00 (0.00) |
0.02 (0.01) |
0.00 (0.01) |
0.02 (0.01) |
0.00 (0.00) |
Var (level 2) |
0.13 (0.01) |
0.11 (0.01) |
0.07 (0.01) |
0.06 (0.01) |
0.05 (0.01) |
0.04 (0.00) |
0.09 (0.01) |
0.08 (0.01) |
0.16 (0.01) |
0.13 (0.01) |
Var (level 1) |
0.81 (0.01) |
0.81 (0.01) |
0.65 (0.01) |
0.65 (0.01) |
0.50 (0.00) |
0.50 (0.00) |
0.83 (0.01) |
0.83 (0.01) |
0.69 (0.01) |
0.69 (0.01) |
LL |
− 29,774.68 |
− 29,676.17 |
− 27,146.53 |
− 27,094.34 |
− 24,273.69 |
− 24,202.01 |
− 29,825.23 |
− 29,727.88 |
− 27,905.72 |
− 27,792.14 |
ICC level 3 |
0.01 (0.01) |
0.00 (0.00) |
0.02 (0.01) |
0.01 (0.01) |
0.02 (0.01) |
0.01 (0.01) |
0.02 (0.01) |
0.00 (0.01) |
0.02 (0.01) |
0.00 (0.00) |
ICC level 2 | level 3 |
0.15 (0.01) |
0.12 (0.01) |
0.12 (0.01) |
0.10 (0.01) |
0.11 (0.01) |
0.08 (0.01) |
0.11 (0.01) |
0.09 (0.01) |
0.20 (0.01) |
0.16 (0.01) |
n (level 3) |
274 |
274 |
274 |
274 |
274 |
274 |
274 |
274 |
274 |
274 |
n (level 2) |
530 |
530 |
530 |
530 |
530 |
530 |
530 |
530 |
530 |
530 |
n (level 1) |
22,238 |
22,238 |
22,214 |
22,214 |
22,229 |
22,229 |
22,137 |
22,137 |
22,105 |
22,105 |
Multilevel linear regression analysis. Entries are unstandardized coefficients from multilevel linear regression models (standard errors in parentheses)
***p = 0.001; **p = 0.01; *p = 0.05, †p = 0.1
On Level 2, the share of educational supervisors, total playing area (areal), total number of children, and children per FTE are unrelated to user satisfaction, leaving food cost per month the only Level 2 variable with explanatory power. Controlling for all other variables, food cost does not seem to be a very strong predictor of satisfaction. Instead, we observe a weak curvilinear relationship, whereby satisfaction is highest among those with moderate food expenses (NOK 200–299). In alternative model specifications where we replace monthly food cost with a variable measuring satisfaction with the kindergartens’ focus on health and a healthy diet (as described above), we observed a positive significant relationship (p < 0.001) with all dependent variables (results may be retrieved upon request). A possible interpretation of these relationships is that low food costs indicate poor food service and thus a limited focus on health and a healthy diet, while too high costs increase expectations beyond what is possible to deliver.
On the neighborhood level, the results suggest that a consistent positive relationship exists between affluence and user satisfaction. Kindergartens in affluent neighborhoods receive more positive evaluations than kindergartens in poorer neighborhoods.
The full models also suggest that general user satisfaction and satisfaction with care and safe feeling (Factor 2) are negatively related to the age of the child, and also that general satisfaction and satisfaction with information and user influence (Factor 3) and satisfaction with physical infrastructure (Factor 4) are higher among those with short experience (“First year”). In other words, a tendency exists for parents with shorter experience to express higher satisfaction compared with parents with longer experience. This is not surprising, as one might assume that parents’ expectations for kindergartens increase as they gain experience having children in kindergarten.
Discussion
A key insight from this study is that most users of kindergartens in Oslo are satisfied with the services they receive, confirming earlier studies of user satisfaction with welfare services in Scandinavia generally (Van Deth et al. Reference Van Deth, Montero and Westholm2007) and in Norwegian kindergartens specifically (Lindén et al. Reference Lindén, Fladmoe, Christensen, Sivesind and Saglie2017; Christensen and Lindén Reference Christensen, Lindén, Christensen, Lindén and Ytre-Arne2017).
Still, we see differences between institutional sectors: Across various measures, user satisfaction is somewhat higher among parents with children in parent cooperatives and other nonprofit kindergartens than parents with children in for-profit and public kindergartens. Extant studies showing that user satisfaction is higher in private than in public kindergartens did not differentiate between nonprofit and for-profit kindergartens (Christensen and Lindén Reference Christensen, Lindén, Christensen, Lindén and Ytre-Arne2017). However, the present study suggests that private kindergartens outperform public kindergartens mainly because of nonprofit options, and in particular parent cooperatives. This finding runs contrary to a study from Norway suggesting that higher levels of satisfaction exist with for-profit compared with nonprofit kindergartens, but that particular study was based on a general survey on user satisfaction with welfare services and had a limited number of respondents with relevant experience (Lindén et al. Reference Lindén, Fladmoe, Christensen, Sivesind and Saglie2017).
The tight regulatory regime of Norwegian kindergartens is illustrated by the finding that user satisfaction is not affected by factors such as education of staff or number of children per staff member, unlike the cited studies from the US context (Phillipsen et al. Reference Phillipsen, Burchinal and Howes1997). The minimum standards are shared by all institutional sectors, and with a fixed fee, so few incentives exist to increase staff above minimum standards. Thus, the limited variation between institutional sectors is likely to be caused by tight government regulations. Within the present regulatory regime in Norway, food is the only service in which kindergartens are allowed to charge an extra fee. Accordingly, the analyses suggest that food service quality is one explanation for differences among providers. The relationship between food service and user satisfaction indicates the potential for differentiation that exists when providers are allowed to adapt services to users’ preferences. Sivesind et al. (Reference Sivesind, Trætteberg, Saglie, Sivesind and Saglie2017) argue that administrative freedom and user choice are two prerequisites for differentiation between provider types in the Scandinavian context. This study suggests that non-public institutions might use this regulatory freedom to adapt to user preferences.
The fact that the city of Oslo does not use the freedom in national legislation to adapt to user preferences suggests that the municipality finds it imperative to cater to low-income residents. A similar mechanism has been found in studies from Sweden (Gustafsson et al. Reference Gustafsson, Sörlin and Vlachos2016) and Austria (Badelt Reference Badelt and Kendall1997). At the same time, the profit incentive does not seem to drive for-profit providers to provide services more in line with user satisfaction, nor do these providers deliver services that parents do not like. The profit motive seems to be less relevant in this regulatory context than many stakeholders and scholars alike would presume (see for example Petersen et al. Reference Petersen, Hjelmar and Vrangbæk2018: 131).
The importance of food cost across different measures of user satisfaction raises important questions about the validity of user satisfaction surveys as an instrument to measure service quality, at least in service areas where users are next of kin and, therefore, have limited information. Whereas it is natural that overall satisfaction is related to food service, it is more difficult to find a logical explanation as to why food service should be related to satisfaction with, for example, “care and safe feeling” or “information and user influence.” The data suggest that generally, satisfied users do not discriminate much between various items in the survey; rather, they are satisfied with “everything.” Thus, one implication of this study is that user satisfaction surveys have limited validity beyond measuring a service’s general features. This interpretation is in line with Andersen and Hjortskov (Reference Andersen and Hjortskov2016) who suggest that users will often use heuristic tools to simplify the world when answering a satisfaction survey and thus focus on a more narrow aspect of services than the whole range of issues that they are asked to consider.
After controlling for a host of factors, parents using parent cooperatives and other nonprofit institutions generally seem somewhat more satisfied than users of public and for-profit providers. One possible explanation is that given that nonprofit providers are not part of a bureaucratic structure and do not have a profit incentive, they are able to provide services that are better tailored for the individual user. This is in line with a traditional argument that nonprofit providers have satisfied users because they to a larger extent than public and for-profit providers manage to fill gaps in public services not filled by other actors, based on, for example, religion. In effect, families choosing nonprofits may, to a greater extent than other parents, actively be seeking particular services only offered by nonprofit providers (Weisbrod Reference Weisbrod and Weisbrod1998). This has been shown to have certain validity in the Norwegian school sector (Trætteberg Reference Trætteberg2018), but not in elderly care (Feltenius Reference Feltenius, Sivesind and Saglie2017).
There is, however, reason for caution when offering such a hypothesis in the kindergarten sector in Norway. First, there is a capacity limitation. In many places in Oslo, and in Norway in general, there is not sufficient capacity for parents to freely choose their preferred kindergarten. Hence, it is unclear how many of the parents with children in a nonprofit kindergarten actively have applied such a provider. Second, currently more than 90% of Norwegian children attend a kindergarten, but many of the nonprofit kindergartens were established when there was far less capacity. Up until just a few years ago, many nonprofit kindergartens were established in order to increase capacity, not necessarily to broaden the range of service content. Moreover, the more or less systematic differences between the different satisfaction measures analyzed in this paper suggest that there are some unidentifiable features of the nonprofit providers and their match with the users that make their score superior.
One such feature, based on the stakeholder theory as formulated by Ben-Ner and Van Hoomissen (Reference Ben-Ner and Van Hoomissen1991), is that when lacking a profit motive, entrepreneurs establishing nonprofit services must be driven by an alternative incentive, such as a dedication to provision and quality for the users. The prime example of this is when the users themselves become owners through cooperatives (Van Puyvelde et al. Reference Van Puyvelde, Caers and Du Bois2012), like the parent cooperatives. Moreover, Enjolras (Reference Enjolras2009) argues that nonprofits may reinforce a norm of reciprocity that make it possible to pool resources and facilitate collective action. In this way, the values and dedication of the entrepreneurs may be internalized in the governance structure of nonprofit institutions. Our findings are compatible with these theories, even if they do not constitute a test that makes us able to rule out alternative explanations.
Some scholars have argued that the role of nonprofit institutions as autonomous and distinct from their public and for-profit peers, stemming from their member-based, democratic organization (Eikås and Selle Reference Eikås, Selle, Ascoli and Ranci2002), has been in decline as the nonprofit sector has been caught up in the marketization of the welfare field and lost much of its ideological force and operational distinctiveness (Selle Reference Selle2016). Since we do not have time series data, we cannot rule out this possibility, but the results in this paper suggest at least that the nonprofit sector is still a viable and important component of the kindergarten sector, one of the sectors where marketization has arguably gone furthest in the Norwegian welfare model.
One limitation of the present study is that we do not have information about users’ (parents) socioeconomic background; therefore, we cannot rule out possible selection effects, i.e., parents from different socioeconomic strata seek certain providers. However, we do see that satisfaction is higher with kindergartens located in affluent neighborhoods than with kindergartens in poorer neighborhoods. The data also indicate overrepresentation of for-profit providers and parent cooperatives in affluent neighborhoods, while public providers are overrepresented in poorer neighborhoods. A similar geographical distribution between public and private providers has been found in other areas of Scandinavian welfare as well (Gustafsson et al. Reference Gustafsson, Sörlin and Vlachos2016), an important finding when assessing how to approach the trade-off between tight regulation that does not provide room for providers to develop distinct services in line with user preferences and the traditional values of equity in quality. If more lenient regulation provides more differentiation between providers in the welfare mix, and non-public kindergarten providers gravitate to affluent neighborhoods, the role of public welfare services as a tool for creating social equality might be undermined.
Extant studies have found that it is difficult to identify differences between providers, which have been attributed to tight regulation. Our case study shows how only a minor opening in regulation (food service) might create room for flexibility that non-public providers exploit to adapt services to users’ preferences. Given that inherent differences exist among public, for-profit, and nonprofit providers, Scandinavian governments must make decisions not only about the share of different sectors in the welfare mix, but also about the latitude that these sectors should have to develop distinct services.
Acknowledgements
The authors would like to thank the editors and two anonymous referees for their constructive feedback. An earlier version of this article was presented at the Politikkseminar at the Institute for Social Research, Oslo, and at the ISTR Conference in Amsterdam in 2018. We greatly appreciate all comments from the seminar participants. Thanks to Jo Kristoffer Herland for research assistance.
Funding
Funding was provided by Norges Forskningsråd (NO) (Grant No. 248189).
Appendix
See Table 4.
Principal component factor analysis: varimax rotation

Variable |
Educational development (Factor 1) |
Care and safe feeling (Factor 2) |
Information and user influence (Factor 3) |
Physical infrastructure (Factor 4) |
|---|---|---|---|---|
Does the day care center stimulate your child’s interest in numbers and geometrics (understanding of math)? |
0.698 |
0.187 |
0.231 |
0.176 |
Does the day care center staff stimulate your child’s curiosity and desire to learn? |
0.682 |
0.352 |
0.314 |
0.215 |
Does the day care center ensure variety is provided in activities and learning in different areas? |
0.673 |
0.303 |
0.322 |
0.317 |
Does the day care center contribute to your child’s motor and physical development? |
0.665 |
0.287 |
0.257 |
0.332 |
Does the day care center provide a diversity of play activities? |
0.655 |
0.311 |
0.291 |
0.352 |
Does the day care center encourage your child to act and think independently? |
0.644 |
0.331 |
0.242 |
0.213 |
Does the day care center contribute to your child’s language development and Norwegian skills? |
0.586 |
0.339 |
0.304 |
0.263 |
Does the day care center contribute to your child’s social development (e.g., friendship, empathy and consideration for others)? |
0.566 |
0.522 |
0.254 |
0.205 |
Does your child trust and have confidence in the staff at the day care center? |
0.259 |
0.756 |
0.224 |
0.172 |
Is your child happy at the day care center? |
0.349 |
0.743 |
0.049 |
0.146 |
Does the day care center staff have a caring attitude toward your child? |
0.215 |
0.706 |
0.380 |
0.235 |
Are the day care center’s staff members friendly and encouraging? |
0.159 |
0.677 |
0.421 |
0.239 |
Does your child have good relationships with the other children at the day care center? |
0.440 |
0.621 |
− 0.066 |
0.065 |
Have you found that staff members have the time to provide support and help when your child needs it? |
0.293 |
0.607 |
0.413 |
0.275 |
In your opinion, do the day care center staff members have the necessary qualifications? |
0.302 |
0.546 |
0.431 |
0.328 |
Do you receive information relating to activities at the day care center? |
0.336 |
0.303 |
0.669 |
0.198 |
Do you receive information regarding how your child is doing at the day care center? |
0.324 |
0.401 |
0.647 |
0.158 |
Are you adequately informed about changes in the day care center’s staff? |
0.259 |
0.192 |
0.637 |
0.253 |
Do you have a good dialogue with the day care center regarding your child’s development? |
0.400 |
0.337 |
0.633 |
0.147 |
Do you receive information regarding the day care center’s joint parents committee (Samarbeidsutvalg/FAU)? |
0.265 |
0.055 |
0.632 |
0.122 |
Does the day care center have indoor facilities and equipment that encourage and promote development, play and learning? |
0.332 |
0.157 |
0.134 |
0.771 |
Does the day care center have outdoor facilities that encourage and promote development, play, and learning? |
0.273 |
0.096 |
0.075 |
0.758 |
Is the day care center clean and are hygiene standards good? |
0.154 |
0.255 |
0.246 |
0.692 |
Is the day care center a safe and secure venue? |
0.180 |
0.376 |
0.215 |
0.684 |
Is the day care center focused on health and a healthy diet? |
0.470 |
0.111 |
0.288 |
0.353 |
Do you think that the staff members communicate well in Norwegian? |
0.129 |
0.339 |
0.286 |
0.334 |
Eigenvalue |
13.338 |
1.416 |
1.154 |
1.062 |


 Open access