

1. Introduction
Characterizing the relationship between pairs of individuals continues to be of importance in many areas of population and quantitative genetics. Variation in genome sharing identical by descent (ibd) over the genome depends both on the pedigree and the extent to which alleles at different loci are jointly ibd. The degree of relationship might be inferred from pedigree information or it can be estimated from genetic information (Weir et al., Reference Weir, Anderson and Hepler2006; Visscher et al., Reference Visscher, Medland, Ferreira, Morley, Zhu, Cornes, Montgomery and Martin2006; Yu et al., Reference Yu, Pressoir, Briggs, Bi, Yamasaki, Doebley, McMullen, Gaut, Nielsen, Holland, Kresovich and Buckler2006), but in either case there is variation in relationship measures. A recent development has been to utilize this variability in the actual relationship to estimate the components of variance for quantitative traits from the variation in resemblance among full sibs, i.e. family members who have the same pedigree relationship (Visscher et al., Reference Visscher, Medland, Ferreira, Morley, Zhu, Cornes, Montgomery and Martin2006).
By making assumptions about the mapping function, the variation in the proportion of genome-shared ibd, or actual relationship, can be computed for different pedigrees. Formulae have been published for autosomal loci of lineal descendants (Stam & Zeven, Reference Stam and Zeven1981; Hill, Reference Hill1993a), sibs (Hill, Reference Hill1993b) and other relatives, including cousins (Guo, Reference Guo1995). Formulae have also been given for the variation of identity of full sibs for both alleles at each site (Visscher et al., Reference Visscher, Medland, Ferreira, Morley, Zhu, Cornes, Montgomery and Martin2006) and for sex-linked loci (Visscher, Reference Visscher2009).
These analyses are solely concerned with the variances of the distributions of sharing. The distribution itself or other functions of it have also been obtained. In particular, Donnelly (Reference Donnelly1983) computed the probability that the proportion shared with an ancestor exceeded zero. Bickeboller & Thompson (Reference Bickeboller and Thompson1996a, Reference Bickeboller and Thompsonb) obtained approximations for the distribution of the proportion shared between half-sibs and between offspring and parent. The full distribution has been obtained by Stefanov and colleagues for lineal descendants (Stefanov, Reference Stefanov2000, Reference Stefanov2004) and for half sibs (Ball & Stevanov, Reference Ball and Stefanov2005). Their results generally take the form of a set of equations and computer routines for numerical evaluation.
With the advent of dense genome mapping, it has become possible to estimate the actual proportion of the genome shared for pairs of relatives and to compare the observed with expected values. This has been done for full sibs by Visscher et al. (Reference Visscher, Medland, Ferreira, Morley, Zhu, Cornes, Montgomery and Martin2006, Reference Visscher, Macgregor, Benyamin, Zhu, Gordon, Medland, Hill, Hottenga, Willemsen, Boomsma, Liu, Deng, Montgomery and Martin2007), and there was generally good agreement between observed and expected sharing.
Mapping with multiple markers enables relatives to be identified among samples from the population. The ability to correctly assign relationship, to distinguish between second and third cousins, for example, depends on the sampling variance of the actual proportion of genome shared and the additional sampling due to the use of a limited number of markers. Such data arise in genome-wide association studies, for example, where up to millions of single nucleotide polymorphism (SNP) markers are genotyped on thousands of individuals, and the relationship structure of the data is an important component in determining the reliability of conclusions on trait gene identification. Genetic variances of quantitative traits can be estimated by taking advantage of the variation in genome sharing to account for phenotypic similarity both within families of full sibs (including dizygotic twins) (Visscher et al., Reference Visscher, Medland, Ferreira, Morley, Zhu, Cornes, Montgomery and Martin2006, Reference Visscher, Macgregor, Benyamin, Zhu, Gordon, Medland, Hill, Hottenga, Willemsen, Boomsma, Liu, Deng, Montgomery and Martin2007) and between families utilizing information on distant relatives not available from known relationships (Yang et al., Reference Yang, Benyamin, McEvoy, Gordon, Henders, Nyhot, Madden, Heath, Martin, Montgomery, Goddard and Visscher2010). Quantifying the degree of relationship is also an important aspect of genotype data cleaning in genome-wide association studies (Laurie et al., Reference Laurie, Doheny, Mirel, Pugh, Bierut, Bhangale, Boehm, Caporaso, Edenberg, Gabriel, Harris, Hu, Jacobs, Kraft, Landi, Lumley, Manolio, McHugh, Painter, Paschall, Rice, Rice, Zheng and Weir2010), for guarding against incorrect annotation of family membership or for modifying tests of marker trait association (Choi et al., Reference Choi, Wijsman and Weir2009). Genomic selection, which utilizes dense mapping for identifying sharing of genes among relatives, depends on there being variability in genome sharing of relatives that have the same pedigree relationship (Meuwissen et al., Reference Meuwissen, Hayes and Goddard2001), and which has major application, mainly so far in plant and animal breeding. It may be based directly on the actual genomic relationship matrix or with weighting dependent on the variance in the trait associated with particular genomic regions (Goddard, Reference Goddard2009). These activities require an appreciation of the extent of the variation in genome sharing by identity and have motivated this study.
Our objective in this paper is to consider moments of the distribution of allele sharing, and to obtain formulae that can be applied simply to any kind and degree of relationship, including direct descendants and those of half- and of full sibs. The distributions can be highly skewed, particularly when the relationship is low, and hence we also obtain formulae for the magnitude of skew of relationship. Although we restrict the analysis to the relationship among non-inbred individuals, the results apply directly to the variation in actual inbreeding of offspring of consanguineous matings and we show how to apply them.
2. General formulae for variance of genome sharing of non-inbred individuals
(i) Background theory
At any locus individuals may share zero, one or two pairs of alleles ibd with probabilities k 0, k 1 or k 2. The actual ibd status can be indicated by ![]() m, m=0, 1, 2, where
m, m=0, 1, 2, where ![]() m=1 if the individuals share exactly m pairs of alleles ibd and
m=1 if the individuals share exactly m pairs of alleles ibd and ![]() m=0 otherwise. The probabilities k m depend on the pedigree structure and are the expected values of the
m=0 otherwise. The probabilities k m depend on the pedigree structure and are the expected values of the ![]() m. As exactly one of the
m. As exactly one of the ![]() m is equal to 1 at any locus and as squaring an indicator does not change its value, their variances and covariances are
m is equal to 1 at any locus and as squaring an indicator does not change its value, their variances and covariances are
Less detailed measures of relationship are the co-ancestry or kinship coefficient, ![]() , the probability that an allele drawn at random from one individual is ibd to a random allele from the other, and the relationship
, the probability that an allele drawn at random from one individual is ibd to a random allele from the other, and the relationship ![]() . This equals Wright's (Reference Wright1922) relationship for non-inbred individuals and is also called the ‘numerator relationship’. We shall primarily use R here as we are considering an analysis of genome sharing, for R is the probability that a random allele identified in one individual is present ibd in the other. We have previously considered variation in actual coancestry (Cockerham & Weir, Reference Cockerham and Weir1983; Weir et al., Reference Weir, Cardon, Anderson, Nielsen and Hill2005) and thus in relationship. The actual relationship is
. This equals Wright's (Reference Wright1922) relationship for non-inbred individuals and is also called the ‘numerator relationship’. We shall primarily use R here as we are considering an analysis of genome sharing, for R is the probability that a random allele identified in one individual is present ibd in the other. We have previously considered variation in actual coancestry (Cockerham & Weir, Reference Cockerham and Weir1983; Weir et al., Reference Weir, Cardon, Anderson, Nielsen and Hill2005) and thus in relationship. The actual relationship is ![]() and this has variance
and this has variance
The quantity ![]() was written as Δ by Cockerham & Weir (Reference Cockerham and Weir1983) and is the probability that two pairs of alleles at the same locus are ibd.
was written as Δ by Cockerham & Weir (Reference Cockerham and Weir1983) and is the probability that two pairs of alleles at the same locus are ibd.
The inbreeding coefficient F is the probability that the two alleles carried by an individual are ibd. We have discussed the variation in actual inbreeding (Weir et al., Reference Weir, Avery and Hill1980; Cockerham & Weir, Reference Cockerham and Weir1983), with the variation in the two-allele measures θ and F expressed as a function of the ibd probability of a set of two, three or four alleles. We shall also discuss coefficients of variation of actual identity. For example,
In Table 1, we list values for the ks, R and their single-locus variances and covariances for some common relationships. We now consider the variances and covariances of the actual identities when that they are averaged over the genome, assuming that they have the same expected values at all loci. The results for single loci also apply if the loci are completely linked and are therefore a limiting case of the genome-average results.
When we consider the variation in sharing of relatives over the genome, we require the average over pairs of loci i, j of the covariances of the actual sharing indicators ![]() i,
i, ![]() j for 0, 1 or 2 pairs of alleles. For a set of r loci
j for 0, 1 or 2 pairs of alleles. For a set of r loci ![]() and
and
Expectations and variances for actual identity at individual loci
Combining the two terms in this sum and subtracting the square of the mean gives
and similar arguments apply to higher moments discussed later.
(ii) Lineal descendants
If g generations separate two individuals, one being a lineal descendant of the other, k 2=0 and ![]() . For a parent and offspring pair (g=1, e.g. A and D in Fig. 1),
. For a parent and offspring pair (g=1, e.g. A and D in Fig. 1), ![]() 1=k 1=1 and Var(
1=k 1=1 and Var(![]() 1)=0. For linked gametic loci i, j the only way both values can be equal to one in subsequent generations (e.g. G, J) is if there has been no recombination in the descent from ancestor to descendant. The expected value of their product is therefore
1)=0. For linked gametic loci i, j the only way both values can be equal to one in subsequent generations (e.g. G, J) is if there has been no recombination in the descent from ancestor to descendant. The expected value of their product is therefore
where c ij is the recombination fraction between loci. For convenience, we will drop the ij subscript on c ij. The covariance of these two variables is
Note that this covariance is zero if the loci are unlinked and c=0·5, or if one individual is the offspring of the other and g=1. Setting c=0 gives the variance k 1i(1−k 1i) as the two loci are then transmitted as a unit.
Examples of relationship
* If M and N are also full sibs.
For allele sharing over the whole genome, suppose there are infinitely many loci along a chromosome of length l and further suppose Haldane's (Reference Haldane1919) mapping function holds so that ![]() , where d is the map length between loci i, j. Therefore, from eqn (2),
, where d is the map length between loci i, j. Therefore, from eqn (2),
The variance of allele sharing over the whole chromosome is the average of all the covariances and this can be calculated as an integral by letting x, y be the positions of pairs of loci:
![\eqalign{\tab{\rm Var}_{{\rm Lin\comma }g}\, {\rm \lpar }\u {k} _{\setnum{1}} {\rm \rpar } \equals\cr\tab\quad{2 \over {l^{\setnum{2}} }}\left( {{1 \over 4}} \right)^{g \minus \setnum{1}}\!\! \int_{x \equals \setnum{0}}^{l} {\int_{y \equals \setnum{0}}^{x} {\left[ {\lpar 1 \plus {\rm e}^{ \minus \setnum{2}\lpar x \minus y\rpar } \rpar ^{g \minus \setnum{1}} \minus 1} \right]} } {\rm d}y \, {\rm d}x\hskip-2.5pt](https://static.cambridge.org/binary/version/id/urn:cambridge.org:id:binary:20160927085929236-0540:S0016672310000480:S0016672310000480_eqn3.gif?pub-status=live)
(Stam & Zeven, Reference Stam and Zeven1981; Hill, Reference Hill1993a).
As we use this function repeatedly and more generally subsequently, we define
![\eqalign{\equals\tab \left\{ {\matrix{\displaystyle{1 \over {2l^{\setnum{2}} }}\left( {{1 \over 4}} \right)^{\!n} \mathop\sum\limits_{r \equals \setnum{1}}^{n} {\left(\! {\matrix{ n \cr r \cr} } \!\right)} \left[ {{{2rl \minus 1 \plus {\rm e}^{ \minus \setnum{2}rl} } \over {r^{\setnum{2}} }}} \right]\comma \quad n \ges 1\comma\cr 0\comma\hfill n \equals 0 \right.}\hfill](https://static.cambridge.org/binary/version/id/urn:cambridge.org:id:binary:20160927085929236-0540:S0016672310000480:S0016672310000480_eqn4b.gif?pub-status=live)
(Hill, Reference Hill1993a). At the limits, for ![]() and for l→∞, ɸn(l)→0. The variance of the chromosome-sharing variable
and for l→∞, ɸn(l)→0. The variance of the chromosome-sharing variable ![]() for lineal relatives g generations apart can then be expressed as
for lineal relatives g generations apart can then be expressed as ![]() . Also
. Also ![]() and
and ![]() . The coefficient of variation (CV) of
. The coefficient of variation (CV) of ![]() 1 is given by
1 is given by
![\eqalign{\tab{\rm CV}_{{\rm Lin\comma }g}\, \lpar \u {k} _{\setnum{1}} \comma l\rpar \equals 2^{g \minus \setnum{1}} \sqrt {\phi _{g \minus \setnum{1}} \left( l \right)} \cr\tab\quad\equals {1 \over l}\left\{ {{1 \over 2}\mathop\sum\limits_{r \equals \setnum{1}}^{g \minus \setnum{1}} {\left( {\matrix{ {g \minus 1} \cr r \cr} } \right)} \left[ {{{2rl \minus 1 \plus {\rm e}^{ \minus \setnum{2}rl} } \over {r^{\setnum{2}} }}} \right]} \right\}^{\setnum{1}\sol \setnum{2}} \comma \quad g \ges 2](https://static.cambridge.org/binary/version/id/urn:cambridge.org:id:binary:20160927085929236-0540:S0016672310000480:S0016672310000480_eqnU32.gif?pub-status=live)
(Visscher, Reference Visscher2009) and is the same for ![]() and
and ![]() . For a whole genome comprising K chromosomes of lengths l 1, l 2, …, l K and total map length
. For a whole genome comprising K chromosomes of lengths l 1, l 2, …, l K and total map length ![]() , the variance is
, the variance is
We now evaluate the variance of genome sharing or relationship among collateral relatives and their descendants using eqns (3) and (4). Results are summarized in Box 1.
Box 1. Summary of formulae for variances of genome sharing. 
A. Unilineal relatives (k 2=0 and )
Lineal descendants
Examples: g=1 for parent–offspring (when VarLin,g (![]() 1, l)=0), g=2 for grandparent–grandoffspring.
1, l)=0), g=2 for grandparent–grandoffspring.
Half-sibs and their descendants
Examples: g=2 for half sibs, g=3 for half uncle-nephew, g=4 for half cousins.
Descendants of full sibs
Examples: g=2 for uncle-nephew, g=3 for great uncle-great nephew.
Examples: g=3 for (first) cousins, g=5 for second cousins or cousins twice removed.
B. Bilineal relatives (k 2≠0)
Full sibs
Double first cousins
(iii) Half-sibs and their descendants
(a) General formulation
Just as for lineal relatives, half-sibs (e.g. D and E in Fig. 1) and their descendants can have only one or zero pairs of ibd alleles at a locus. Formulae for variances of sharing ibd for half-sibs were given by Hill (Reference Hill1993b) and Guo (Reference Guo1995), but we generalize these here in order to include subsequent generations.
The probability that half-sibs share one pair of alleles is ![]() and the probability that they share zero pairs is
and the probability that they share zero pairs is ![]() , so
, so ![]() . Half-sibs share one pair of alleles at each of loci i, j only if they both receive the same non-recombinant or the same recombinant haplotype from their common parent. Therefore,
. Half-sibs share one pair of alleles at each of loci i, j only if they both receive the same non-recombinant or the same recombinant haplotype from their common parent. Therefore,
and the covariance of the allele-sharing indicators is
showing that the covariance of ![]() s for unlinked loci is zero.
s for unlinked loci is zero.
When we consider relationships across generations, for example, half-uncle nephew, the probability that these share haplotypes is proportional to ![]() of the probability that the half-sibs share haplotypes. For half-sibs and other relatives who are not lineal descendents, the probability of sharing is not simply proportional to powers of (1−c) but involve others such as c 2 as shown in eqn (6). In order to generalize formulae across generations, we find it convenient to express all powers of c in terms of
of the probability that the half-sibs share haplotypes. For half-sibs and other relatives who are not lineal descendents, the probability of sharing is not simply proportional to powers of (1−c) but involve others such as c 2 as shown in eqn (6). In order to generalize formulae across generations, we find it convenient to express all powers of c in terms of ![]() as
as
Therefore, from eqn (6), for half-sibs
This is a specific example of expressions which appear in all succeeding analyses, and so we consider the general form
For unlinked loci, ![]() , the
, the ![]() s are independent and (9) gives the product of the expected values of
s are independent and (9) gives the product of the expected values of ![]() li and
li and ![]() lj, so
lj, so
Expressed in terms of map positions x, y for these loci, ![]() and
and
Using eqns (3) and (4), we obtain
Applying this methodology to half-sibs,
because ɸ0(l)=0. Also
(b) Half-uncle nephew and descendants
The probability that half-uncle and nephew (e.g. D and H in Fig. 1; or, implicit here and subsequently, half-aunt and nephew or niece, etc.) share one pair of alleles ibd is ![]() . They share a pair of alleles ibd at loci i and j only if H receives from its parent E the non-recombinant haplotype that carries alleles from B, the common parent of D and E. Therefore
. They share a pair of alleles ibd at loci i and j only if H receives from its parent E the non-recombinant haplotype that carries alleles from B, the common parent of D and E. Therefore
and immediately, by using (9) and (10),
We generalize the formulae with reference to pairs of relatives that are g generations apart, i.e. their pedigree relationship is ![]() . Thus, g=2 for half sibs (and grandparent–grandoffspring, as above), g=3 for half-uncle nephew and g=4 for half-cousins (G and H in Fig. 1) and for half-great uncle nephew (D and K). The one-locus allele sharing indicator has expectation E(
. Thus, g=2 for half sibs (and grandparent–grandoffspring, as above), g=3 for half-uncle nephew and g=4 for half-cousins (G and H in Fig. 1) and for half-great uncle nephew (D and K). The one-locus allele sharing indicator has expectation E(![]() 1)=(0·5)g−1 and those for two loci reduce by a proportion
1)=(0·5)g−1 and those for two loci reduce by a proportion ![]() each generation as the g meioses are independent. Hence
each generation as the g meioses are independent. Hence
Setting g=2 and noting that ɸ0(l)=0 provide the half-sib result. Note also that the variances are the same for any collateral and lineal offspring of half-sibs that have the same relationship, e.g. half-cousins and half great uncle–great nephew.
(iv) Lineal descendants of full-sibs
We now discuss the relationships between full sibs and their lineal descendants and among these descendants, where it is still the case that only one or zero pairs of alleles might be ibd, i.e. k 2=0. We defer to the next section a treatment of full sibs and of bilineal relatives in general where k 2>0. Note, however, that since the maternal and paternal transmissions are independent,
i.e. twice that for half-sibs (eqn (11)) (Hill, Reference Hill1993b; Guo, Reference Guo1995).
(a) Uncle–nephew
In Fig. 1, E and F are full sibs and I is the offspring of F and a nephew of E. At any locus, they can share one or zero pairs of alleles with probabilities ![]() . They can share a pair of alleles ibd at loci i and j in two ways: either I receives a non-recombinant haplotype from F, and E, F both carry copies of that haplotype which might themselves be both recombinant or non-recombinant from one of their parents; or I receives a recombinant haplotype from F, and E, F receive ibd alleles at i from one parent and ibd alleles at j from the other. So
. They can share a pair of alleles ibd at loci i and j in two ways: either I receives a non-recombinant haplotype from F, and E, F both carry copies of that haplotype which might themselves be both recombinant or non-recombinant from one of their parents; or I receives a recombinant haplotype from F, and E, F receive ibd alleles at i from one parent and ibd alleles at j from the other. So
Integrating over a chromosome of length l and using (9) and (10)
These results are not the same as those for half-sibs, even though the single-locus probabilities k 0, k 1 are the same nor are they twice the value for half-uncle nephew.
(b) Uncle and descendants of a nephew
For great-uncle nephew (e.g. E and L in Fig. 1) and further descendents of the nephew, results are obtained immediately from (12) as the expressions are multiplied by further coefficients b. Hence, if they are g generations apart
This reduces to the uncle–nephew case (where ![]() ) for g=2 and to full sibs for g=1 (provided we set ɸn(l)=0, n⩽0).
) for g=2 and to full sibs for g=1 (provided we set ɸn(l)=0, n⩽0).
(c) Cousins
In Fig. 1, E and F are full sibs, and so their respective offspring H and I are (first or full) cousins. They may share one or zero pairs of alleles ibd with probabilities ![]() and
and ![]() . The haplotypes that they receive from their sibling parents may each be non-recombinant, with probability (1−c)2, in which case they carry ibd alleles at each locus with probability
. The haplotypes that they receive from their sibling parents may each be non-recombinant, with probability (1−c)2, in which case they carry ibd alleles at each locus with probability ![]() . Alternatively, the haplotypes that they receive from their sibling parents may each be recombinant, with probability c 2, in which case they carry ibd alleles at each locus with probability
. Alternatively, the haplotypes that they receive from their sibling parents may each be recombinant, with probability c 2, in which case they carry ibd alleles at each locus with probability ![]() . Therefore,
. Therefore,
and hence
Note that the variances differ from those for great uncle–great nephew, although they have the same relationship parameters k 1 and R.
(d) Descendants of cousins
In Fig. 1, H and L are cousins once removed. An individual shares a haplotype with the offspring of a cousin only if the cousin transmits it without recombination. Hence, the joint probability of sharing is b times that for cousins. Setting g=3 for cousins ![]() , so g=4 for cousins once removed, g=5 for second cousins and for cousins twice removed and g=6 for third cousins, The variances are
, so g=4 for cousins once removed, g=5 for second cousins and for cousins twice removed and g=6 for third cousins, The variances are

and also VarC,1 (![]() , l)=VarFS (
, l)=VarFS (![]() , l).
, l).
(v) Bilineal relatives
(a) General methodology
Bilineal relatives can receive identical alleles from each of the two different pedigrees. Full sibs have two parents in common and each may transmit identical alleles to the sibs. Double first cousins have two pairs of grandparents in common, and each pair may transmit identical alleles to the cousins. It is convenient to refer to the two pedigrees as ‘maternal’ and ‘paternal’, although this may not be the case for double first cousins. In Fig. 1, E and F are full sibs and can receive identical alleles from each of their parents B and C. If M and N are also full sibs, then H and I are double first cousins who may receive ibd alleles from both sets of grandparents, namely B, C and the parents of M, N.
Using superscripts m, p for maternal and paternal events in order to extend the previous definitions of actual identity indicators, the required indicators can be partitioned as

As we assume no inbreeding, ![]() and
and ![]() are independent and have expected values denoted αm=k 1m and αp=k 1p. Therefore, k 2=αmαp, k 1=αm(1−αp)+(1−αm)αp and k 0=(1−αm)(1−αp). For full sibs, for example,
are independent and have expected values denoted αm=k 1m and αp=k 1p. Therefore, k 2=αmαp, k 1=αm(1−αp)+(1−αm)αp and k 0=(1−αm)(1−αp). For full sibs, for example, ![]() ,
, ![]() and
and ![]() .
.
Hence, the variance of the actual relationship, ![]() , can be written in an alternative form to eqn (1) as
, can be written in an alternative form to eqn (1) as
The sharing of either or both maternal and paternal alleles can extend to each of the two loci, i and j, and we introduce the expected products
For full sibs, these values are each the same as for sharing of alleles transmitted from their common parent to half-sibs (eqn (6)), ![]() .
.
As maternal and paternal alleles are inherited independently,
The expected product of sharing two pairs of alleles at two loci for bilineal relatives is

and the covariance of the double-sharing indicators is
For the other covariances, we note that terms such as ![]() contribute zero, whereas terms such as
contribute zero, whereas terms such as ![]() contribute (βijm−αimαjm). The remaining covariances are obtained similarly. The covariance Cov(
contribute (βijm−αimαjm). The remaining covariances are obtained similarly. The covariance Cov(![]() li,
li, ![]() lj) comprises four terms: from sharing of both paternal alleles but neither maternal allele and vice versa, and from sharing of paternal but not maternal alleles at the first locus and of maternal but not paternal alleles at the second locus and vice versa. It is convenient to define ωm=βm−(αm)2 and ωp=βp−(αp)2.
lj) comprises four terms: from sharing of both paternal alleles but neither maternal allele and vice versa, and from sharing of paternal but not maternal alleles at the first locus and of maternal but not paternal alleles at the second locus and vice versa. It is convenient to define ωm=βm−(αm)2 and ωp=βp−(αp)2.
We obtain
and also

Note that these six expressions sum to zero, as ![]() 0+
0+![]() 1+
1+![]() 2=1 at each locus. For unlinked loci, βm=(αm)2 and βp=(αp)2, all these expressions (16) are zero. For completely linked loci, βm=αm and βp=αp, the covariances reduce to the variances and covariances of the single-locus indicators.
2=1 at each locus. For unlinked loci, βm=(αm)2 and βp=(αp)2, all these expressions (16) are zero. For completely linked loci, βm=αm and βp=αp, the covariances reduce to the variances and covariances of the single-locus indicators.
Averaging over just two loci, i, j:
Using one-locus results and the two-locus covariances in this case
As expected, this does not involve the product ![]() (or, equivalently, βm βp) because the maternal and paternal alleles are transmitted independently. For unlinked loci, the variance is half the single-locus value shown in eqn (15).
(or, equivalently, βm βp) because the maternal and paternal alleles are transmitted independently. For unlinked loci, the variance is half the single-locus value shown in eqn (15).
(b) Full sibs
For full sibs, αm=αp=α=½, ![]() . Therefore
. Therefore ![]() , which equals 1/16 when
, which equals 1/16 when ![]() . Using
. Using ![]() from eqns (16) and integrating over a chromosome of length l:
from eqns (16) and integrating over a chromosome of length l:
An alternative summary of these expressions is given in Box 1. The variance of the actual relationship for full sibs can be obtained from these results, and is ![]() , i.e. twice that for half-sibs, as noted previously. The variance of
, i.e. twice that for half-sibs, as noted previously. The variance of ![]() 2 was derived by Visscher et al. (Reference Visscher, Medland, Ferreira, Morley, Zhu, Cornes, Montgomery and Martin2006), who also pointed out that
2 was derived by Visscher et al. (Reference Visscher, Medland, Ferreira, Morley, Zhu, Cornes, Montgomery and Martin2006), who also pointed out that ![]() . The regression of
. The regression of ![]() 2 on
2 on ![]() is therefore 1·0. The genetic covariance of phenotypes of quantitative traits of relatives (ignoring epistasis) is given by RV A+k 2V D, where V A and V D are the additive and dominance variances (Falconer & Mackay, Reference Falconer and Mackay1996) and traditionally pedigree relationships are used. Estimates of the additive genetic and dominance variances free of environmental covariances for quantitative traits can be obtained by regressing the resemblance of trait values of full sibs to their actual genome shared,
is therefore 1·0. The genetic covariance of phenotypes of quantitative traits of relatives (ignoring epistasis) is given by RV A+k 2V D, where V A and V D are the additive and dominance variances (Falconer & Mackay, Reference Falconer and Mackay1996) and traditionally pedigree relationships are used. Estimates of the additive genetic and dominance variances free of environmental covariances for quantitative traits can be obtained by regressing the resemblance of trait values of full sibs to their actual genome shared, ![]() , if dense markers are available. The estimates of V A and V D are therefore highly correlated, however (Visscher et al., Reference Visscher, Medland, Ferreira, Morley, Zhu, Cornes, Montgomery and Martin2006).
, if dense markers are available. The estimates of V A and V D are therefore highly correlated, however (Visscher et al., Reference Visscher, Medland, Ferreira, Morley, Zhu, Cornes, Montgomery and Martin2006).
(c) Double first cousins
For double first cousins ![]() and, utilizing the results for descendants of first cousins (eqn (13)),
and, utilizing the results for descendants of first cousins (eqn (13)), ![]() , it follows that
, it follows that
The other variances and covariances can be expressed simply (Box 1) in terms of VarDFC (![]() 2, l) and
2, l) and ![]() .
.
The variance of the actual relationship is double that of first cousins:
Also ![]() , and so the regression of
, and so the regression of ![]() 2 on
2 on ![]() 2 is one-half.
2 is one-half.
(d) Mothers full sibs, fathers first cousins
The method that we have established allows for asymmetry in the two pedigrees that lead to sets of identical alleles for a pair of relatives. If, for example, the mothers are full sibs and the fathers are first cousins ![]() ,
, ![]() ,
, ![]() and
and ![]() . The results then follow.
. The results then follow.
(vi) Sex-related phenomena
(a) Differences in map length between sexes
In the analysis we have assumed that the map distance is the same in both sexes. Typically, however, the sexes differ in map length, i.e. in the rate of recombination per unit of physical length of the genome. For humans, the autosomal map length in females is 44 M approximately and in males 28 M (Kong et al., Reference Kong, Murphy, Raj, He, White and Matise2004), with the male/female ratio ranging among autosomes from 57 to 85%, typically differing more for the longer chromosomes. We quantify the impact on the variation in genome sharing on the sex through which transmission occurs.
It would be possible to restructure the analysis and specify a ratio of map to physical length for each chromosome and integrate an extension to eqn (4) over physical rather than map length. For maintaining the same notation as previously, however, we simply assume that the sex-averaged map length for a particular chromosome is l, but the map length in females is given by l(1+λ) and in males by l(1−λ). Initially we take a more general approach, and assume that the map length for transmissions at generation i is given by la i and that recombination fractions between any pair of sites are functions of la i. Thus, for a pair of loci d M apart on the sex-averaged linkage map and assuming Haldane's mapping function, their recombination fraction is ![]() , 0<d<l, at generation i. We consider lineal relationships.
, 0<d<l, at generation i. We consider lineal relationships.
Equations (4 a) and (4b) for φn(l) can now be generalized:
![\eqalign{\phi _{n}^{ \circ } \lpar l\semi a_{\setnum{1}} {\rm \comma }\ldots{\rm \comma }a_{n} \rpar \tab\equals {2 \over {l^{\setnum{2}} }}\left( {{1 \over 4}} \right)^{n} \int_{x \equals \setnum{0}}^{l} {\int_{y \equals \setnum{0}}^{x} {\left[ {\prod\limits_{i \equals \setnum{1}}^{n} {\lpar 1 \plus {\rm e}^{ \minus \setnum{2}\lpar x \minus y\rpar a_{i} } \rpar \minus 1} } \right]} } {\rm d}y \ {\rm d}x\cr \tab \equals {2 \over {l^{\setnum{2}} }}\left( {1 \over 4} \right)^{n} \int_{x \equals \setnum{0}}^{l} \int_{y \equals \setnum{0}}^{x} {\left[ \mathop\sum\limits_{\delta _{\setnum{1}} \equals \setnum{0}}^{\setnum{1}} \mathop\sum\limits_{\delta _{\setnum{2}} \equals \setnum{0}}^{\setnum{1}}\cdots \mathop\sum\limits_{\delta _{n} \equals \setnum{0}}^{\setnum{1}} {{\rm e}^{ \minus \setnum{2}\lpar x \minus y\rpar \mathop\sum_{{i \equals \setnum{1}}}^{n} {a_{i} } \delta _{{_{i}} }}} \right]} {\rm d}y \ {\rm d}x\comma\quad\mathop\sum_{i \equals \setnum{1}}^{n} {\delta _{i} } \ne 0\comma}](https://static.cambridge.org/binary/version/id/urn:cambridge.org:id:binary:20160927085929236-0540:S0016672310000480:S0016672310000480_eqn17a.gif?pub-status=live)
If a i=1 for all i, eqns (17a) reduce to (4a) and (17b) to (4b).
Although (17b) can be used directly, we now simplify for the case where there are just two values of a i, namely 1±λ. Assume that m of the n transmissions are through males, with n−m correspondingly through females, and extend the definition of φn(l) accordingly as φ*n,m(l, λ). The sequence in which male or female transmissions occur does not matter. The expansion of the summations in (17b) involves terms with ![]() terms in the sum
terms in the sum ![]() and of these r there are, say, s transmissions through males, where max(0, r−n+m)⩽s⩽min(m, r). Hence
and of these r there are, say, s transmissions through males, where max(0, r−n+m)⩽s⩽min(m, r). Hence ![]() , say, and
, say, and
![\eqalign{\phi \ast _{n\comma m} \lpar l\comma \lambda \rpar \equals\tab {1 \over {2l^{\setnum{2}} }}\left( {{1 \over 4}} \right)^{n} \!\mathop\sum\limits_{r \equals \setnum{1}}^{n} {\mathop\sum\limits_{s \equals \max \lpar \setnum{0}\comma r \minus n \plus m\rpar }^{\min \lpar m\comma r\rpar } {\left(\! {\matrix{ m \cr s \cr} } \right)} } \left(\! {\matrix{ {n \minus m} \cr {r \minus s} \cr} } \right)\cr\tab\times\left[ {2\rho \minus {1 \over {\rho ^{\setnum{2}} }} \plus {{{\rm e}^{ \minus \setnum{2}l\rho } } \over {\rho ^{\setnum{2}} }}} \right]\comma](https://static.cambridge.org/binary/version/id/urn:cambridge.org:id:binary:20160927085929236-0540:S0016672310000480:S0016672310000480_eqn18.gif?pub-status=live)
i.e. ρ replaces r in (4) and hypergeometric coefficients in s are introduced. The n generations here do not include that of the initial transmission from parent to offspring, but those starting with the subsequent transmission to grandoffspring, so
For collateral relatives and their offspring, the general formulation can be extended. For example, for a pair of paternal half-sibs
and for a pair of half-cousins, whose mothers were paternal half-sibs,
As both sexes of parents contribute to resemblance among full sibs, the differences in map length have much impact only in later generations.
For humans, λ averages approximately 0·25, and we illustrate the calculations for a chromosome with l=1 M. For n=2, i.e. great grandparent–great grandoffspring (with the sex of the great grandparent irrelevant), φ2,0*(1, 0·25)=φ2(1·25)=0·0833, φ2,1*(1, 0·25)=0·0954 and φ2,2*(1, 0·25)=φ2(0·75)=0·1088. The corresponding standard deviations (SDs) of k 1 are 0·289, 0·309 and 0·330, describing subsequent transmissions twice through females, once through each sex, and twice through males, respectively. For n=4, m=0, 1, …, 4, φn,m*(1, 0·25)=0·0197, 0·0214, 0·0231, 0·0251 and 0·0272, respectively.
It is straightforward to evaluate eqn (18) directly. These examples illustrate, however, that linear interpolations can provide good approximations. One alternative is to interpolate on φ using (1−m/n)φn(l(1+λ))+(m/n)φn(l(1−λ)), which for the example above for n=4 and m=1, 2 and 3 gives 0·0214, 0·0235 and 0·0253, respectively. Another is to interpolate on l using φn(l(1+(1−2m/n)λ)), for which corresponding values are 0·0212, 0·0229 and 0·0249.
(b) Sex limited recombination
For species such as Drosophila melanogaster there is no recombination in males, so autosomes are transmitted intact to the offspring and the variance in sharing with and among their descendants is increased. The probability that a parental pair of genes is transmitted to an offspring is ![]() through a female and
through a female and ![]() through a male. If m of the n=g−1 transmissions to descendants after the first generation (as the sex of the ancestor is not relevant) are through a male,
through a male. If m of the n=g−1 transmissions to descendants after the first generation (as the sex of the ancestor is not relevant) are through a male,
Hence,
To take another example: for full sibs, the probability of sharing is ![]() for genes from their father and
for genes from their father and ![]() from their mother. Therefore, by summing components for maternal and paternal half-sibs,
from their mother. Therefore, by summing components for maternal and paternal half-sibs, ![]() .
.
(c) Sex chromosomes
Previous formulae apply for the autosomes and we now consider the sex chromosomes (assuming mammalian X, Y sex determination and ignoring the pseudo-autosomal region). For the Y chromosome, father and son share a genome exactly and there is no variation in sharing. Father and son do not share an X chromosome, and so for lineal descendants any male–male transmission in the pathway results in no sharing of descendant with the ancestor. A daughter receives a copy of her father's X chromosome without sampling, and so any male to female transmission reduces by one the number of generations of sampling in eqn (2). Son and daughter receive an X from their mother with recombination as for the autosomes. We consider only the case of full sibs in detail, but sampling variances for genome sharing on the X chromosome can be deduced for any relationship. Visscher (Reference Visscher2009) gives further discussion for sex-linked chromosomes.
We retain the k 1m, k 1p notation for the ibd of maternal or paternal alleles, adding a subscript to indicate X-linkage. For two full brothers, k 1Xp is not defined and ![]() , the same as k 1 for half-sibs;
, the same as k 1 for half-sibs; ![]() 2X=0,
2X=0, ![]() 1X=
1X=![]() 1Xm and
1Xm and ![]() 0X=1−
0X=1−![]() 1Xm. Integrating over the X chromosome of length l X gives VarBB (
1Xm. Integrating over the X chromosome of length l X gives VarBB (![]() 1X)=4φ2(l X)−2φ1(l X), using the autosomal result for half-sibs (11). For a sister and brother, k 1Xp is still not defined and k 1Xm is as for half-sibs with a value of
1X)=4φ2(l X)−2φ1(l X), using the autosomal result for half-sibs (11). For a sister and brother, k 1Xp is still not defined and k 1Xm is as for half-sibs with a value of ![]() . Hence, VarBS (
. Hence, VarBS (![]() 1X)=VarBB (
1X)=VarBB (![]() 1X). For two sisters,
1X). For two sisters, ![]() 1Xp=1 and
1Xp=1 and ![]() 1Xm is as for half-sibs. From the previous results,
1Xm is as for half-sibs. From the previous results, ![]() 2X=
2X=![]() 1Xm,
1Xm, ![]() 1X=1−
1X=1−![]() 1Xm and
1Xm and ![]() 0X=0; therefore, VarSS (
0X=0; therefore, VarSS (![]() 2X)=VarSS (
2X)=VarSS (![]() 1X)=−CovSS (
1X)=−CovSS (![]() 2X,
2X, ![]() 1X)=4φ2(l X)−2φ1(l X).
1X)=4φ2(l X)−2φ1(l X).
(vii) Examples
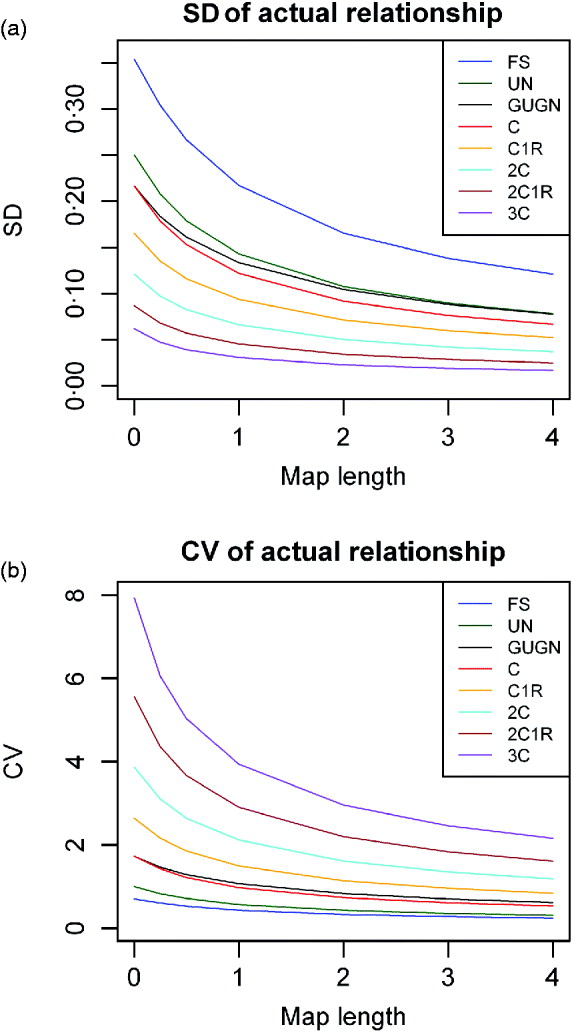
Examples of the SDs of actual proportion of genome shared (![]() ) as a function of map length for single chromosomes are given in Fig. 2 a for descendants of full sibs. It is noticeable that there remains a substantial variation even for the longest chromosomes illustrated (4 Morgans), i.e. longer than most chromosomes in most species. Although the sd becomes smaller as the individuals become less related, the CV becomes larger (Fig. 2 b) (Visscher, Reference Visscher2009). Indeed the CV exceeds unity for all but close relationships, even for chromosomes of map length 2 M.
) as a function of map length for single chromosomes are given in Fig. 2 a for descendants of full sibs. It is noticeable that there remains a substantial variation even for the longest chromosomes illustrated (4 Morgans), i.e. longer than most chromosomes in most species. Although the sd becomes smaller as the individuals become less related, the CV becomes larger (Fig. 2 b) (Visscher, Reference Visscher2009). Indeed the CV exceeds unity for all but close relationships, even for chromosomes of map length 2 M.
(a) SD and (b) CV of actual relationship (proportion of genome shared, ![]() ), for a single chromosome as a function of map length and relationship for full sibs (FS) and their descendants: uncle nephew (UN), cousins (C), cousins once removed (C1R), second cousins (2C), second cousins once removed (2C1R) and third cousins (3C).
), for a single chromosome as a function of map length and relationship for full sibs (FS) and their descendants: uncle nephew (UN), cousins (C), cousins once removed (C1R), second cousins (2C), second cousins once removed (2C1R) and third cousins (3C).
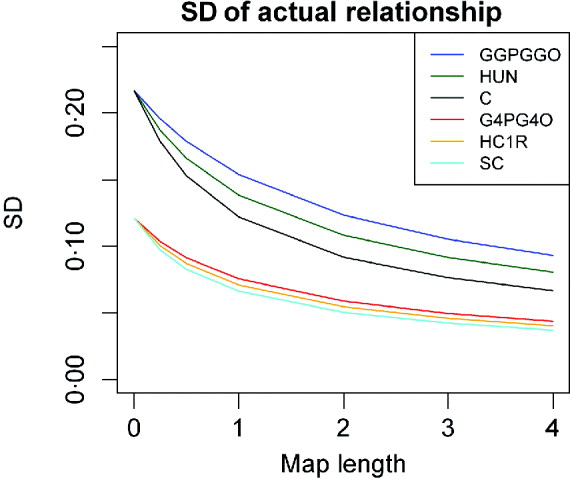
Comparisons between lineal descendants and those of half- and full sibs are given in Fig. 3 for two examples of relationship. With complete linkage the variance depends only on relationship (Table 1). Although the differences are quite small, with increasing map length the variance declines less rapidly with increased chromosome length for lineal descendants than for those involving half sibs, which in turn show a faster decline than descendants of full sibs (Fig. 3). This is presumably because the latter can be ibd at a pair of loci on a pair of recombinant chromosomes: terms in c 2 appearing in eqns (6) and (13), for example, but not in (2). Great uncle–nephew and first cousins, which have the same relationship, differ in the variance of sharing, but not very much (Fig. 3).
SD of actual relationship (proportion of genome shared, ![]() ), for a single chromosome as a function of map length and relationship for three different pedigrees for two different pedigree relationships: R=0·125: great grandparent–great grandoffspring (GGPGGO), half-uncle–nephew (HUN), great uncle–great nephew (GUGN), cousins (C); and R=0·03125: greatgreatgreat grandparent–GGGGoffspring (G4PG4O), half–cousins once removed (HC1R) and second cousins (2C).
), for a single chromosome as a function of map length and relationship for three different pedigrees for two different pedigree relationships: R=0·125: great grandparent–great grandoffspring (GGPGGO), half-uncle–nephew (HUN), great uncle–great nephew (GUGN), cousins (C); and R=0·03125: greatgreatgreat grandparent–GGGGoffspring (G4PG4O), half–cousins once removed (HC1R) and second cousins (2C).
For a mammalian or avian genome with multiple chromosomes, the variation and skew are reduced. Taking data for human autosomes from Kong et al. (Reference Kong, Murphy, Raj, He, White and Matise2004), we assumed that the 22 chromosomes could be grouped into six classes each of 2–8 chromosomes, each member of which was of similar map and genome length, as follows: (1–2) 2·75 M, (3–6) 2·10 M, (7–12) 1·75 M, (13–20) 1·25 M, (21–22) 0·75 M. Results are given in Table 2 for a wide range of relationships. The results are, however, little different from what would be expected from the same number of chromosomes each of the average map length, as shown by an example in the last column of Table 2 and as pointed out previously (Hill, Reference Hill1993a; Visscher, Reference Visscher2009). The average chromosomal length is about 1·6 Morgans, so with 22 chromosomes, the SD, CV and skew of sharing are approximately 20% of those for individual chromosomes.
sd of actual relationship ![]() for a model human genome for different pedigree relationships (R=2θ)
for a model human genome for different pedigree relationships (R=2θ)
a P–O, parent–offspring; GnP–GnO, great(n)grandparent – great(n)grandoffspring; H, half; UN, uncle–nephew; GUGN, great uncle–great nephew; C, 2C, 3C first, second, third cousin; 1R, once removed.
bc SD(![]() ) computed assuming 22 chromosomes: bwith differing map lengths, total 35·9 M (see text), ceach of length Σ35·9/22=1·63 M.
) computed assuming 22 chromosomes: bwith differing map lengths, total 35·9 M (see text), ceach of length Σ35·9/22=1·63 M.
3. Skew of the distribution of genome sharing
(i) Methods
The methods that we have used for evaluating the variance of actual identity can be extended for dealing with higher moments, although the algebra becomes increasingly prohibitive. Here, we consider the magnitude of skew, initially giving formulae for individual genes.
The third central moment of an allele sharing indicator variable ![]() m, m=0, 1, 2, is
m, m=0, 1, 2, is
and the corresponding skew coefficient is
The ![]() ms are symmetrically distributed if they are equal 0·5 and positively skewed if less than 0·5. The third central moment of the actual relationship can be shown to be
ms are symmetrically distributed if they are equal 0·5 and positively skewed if less than 0·5. The third central moment of the actual relationship can be shown to be
For lineal descendants, i.e. k 2=0, γ1(![]() )=γ1(
)=γ1(![]() ) and the distribution of actual relationship or co-ancestry is symmetric if k 1=0·5, e.g. grandparent–grand offspring, half–sibs and uncle–nephew. The distribution of R is also symmetric for full sibs.
) and the distribution of actual relationship or co-ancestry is symmetric if k 1=0·5, e.g. grandparent–grand offspring, half–sibs and uncle–nephew. The distribution of R is also symmetric for full sibs.
For evaluating the skew in genome sharing, we extend the methods used in order to compute the variance in actual relationship, but in view of the complexity of the analysis, restrict it to the case of lineal descendants (i.e. k 2=0 at all loci). Thus, we evaluate E(![]() 13) as an average over r loci, where r becomes infinitely large:
13) as an average over r loci, where r becomes infinitely large:
Consider the expected value of allele sharing E(![]() 1h
1h![]() 1i
1i![]() 1j) at three loci h, i, j so ordered along a chromosome. A three-locus haplotype is transmitted intact from parent to offspring with probability
1j) at three loci h, i, j so ordered along a chromosome. A three-locus haplotype is transmitted intact from parent to offspring with probability ![]() , where c 1 and c 2 are the recombination fractions between loci h, i and i, j, respectively. The probability is
, where c 1 and c 2 are the recombination fractions between loci h, i and i, j, respectively. The probability is ![]() if the loci are unlinked. The probability of allele sharing for three-linked loci between two individuals, one of which is a g-generation lineal descendent of the other, is therefore
if the loci are unlinked. The probability of allele sharing for three-linked loci between two individuals, one of which is a g-generation lineal descendent of the other, is therefore
This equation extends the two-locus result in eqn (2) and can be evaluated over each chromosome by invoking Haldane's mapping function to write recombination fractions in terms of map lengths and integrating:
As the analysis has also to deal with descendants of collateral relatives, we generalize the integration, illustrating the process for half-sibs. The probability that a pair of half-sibs share an allele ibd at each of the three loci is
In order to evaluate this expression, we expand it in terms of (1−c 1) and (1−c 2):

As some terms have different exponents for (1−c 1) and (1−c 2), we redefine the integral more generally than shown in eqn (20), and the exponents are not generation numbers per se. We express (1−c 1)m(1−c 2)n in terms of map distances and define

where the summation terms are included only when the upper limits exceed zero. Note that Φm,n(l)=Φn,m(l). Despite its complex appearance, eqn (22) is quick and easy to compute.
For lineal descendants that are g generations apart, the increase in the joint allele sharing probability over that for unlinked loci is therefore
and for half-sibs, from eqn (19), it is
For subsequent generations, e.g. half-cousins, the formulae can be simply extended by methods similar to those used previously for pairs of loci and therefore have the same basic form. These and other results, including those for full sibs and their descendants, are given in Box 2.
Box 2. Summary of formulae for skew of genome sharing
Lineal descendants, where g=2 is grandparent–grandoffspring (k 2=0)
Half-sibs and their descendants, where g=2 for half-sibs (k 2=0)
The actual relationship ![]() and also
and also ![]() 1 for full sibs are symmetrically distributed (Table 1) although the non-central moments are non-zero. The third moment of
1 for full sibs are symmetrically distributed (Table 1) although the non-central moments are non-zero. The third moment of ![]() 2 and of
2 and of ![]() 0 for full sibs is
0 for full sibs is

Uncle–nephew (g=2) and descendants (k 2=0)
Cousins (g=3) and descendants (k 2=0)
For multiple chromosomes that have the same genome content and map length, the skew and variances would be the same for each, and the skewness for whole-genome actual allele sharing would decrease with the square root of the number of chromosomes.
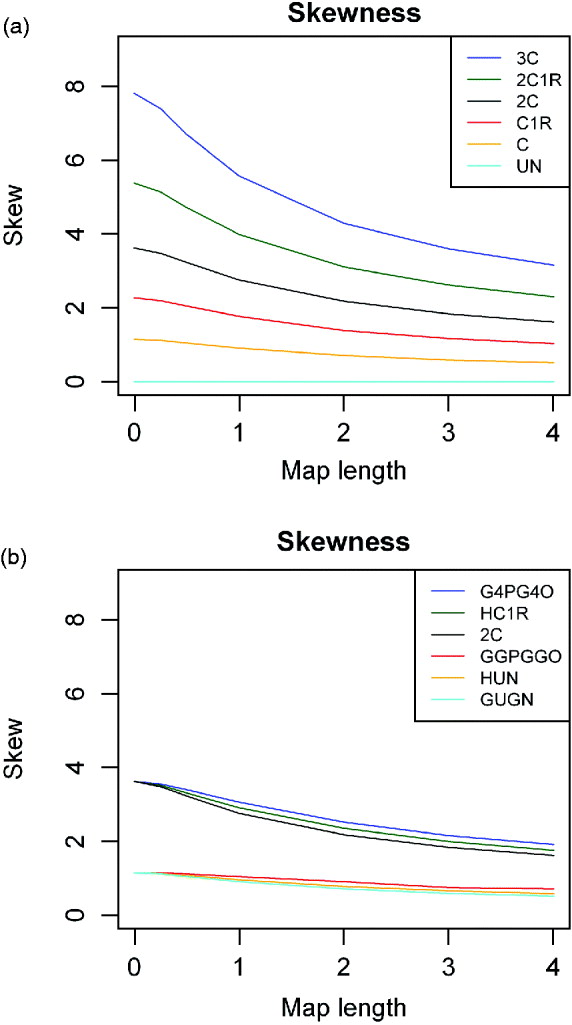
(ii) Examples
The magnitude of skew, expressed as the skew coefficient, is illustrated for single chromosomes in Fig. 4 for a wide range of descendants of full sibs and for alternative ancestry, respectively. The magnitude of the skew rises as relationships become smaller, as expected since it is (1−2k)/√[k(1−k)] for single or completely linked loci. Thus, for second cousins, for example, the skew coefficient exceeds 2 even for long chromosomes.
Skewness of actual relationship (proportion of genome shared) for a single chromosome as a function of map length and relationship for (a) descendants of full sibs (as Fig. 2), and (b) for different pedigrees for two different degrees of relationships (as Fig. 3). For full sibs and uncle–nephew there is no skew.
4. Variation in actual inbreeding
If an individual's parents are related, it is inbred. At a locus i, the actual inbreeding ![]() i takes values of 0 (alleles not ibd) or 1 (alleles ibd). It has expectation E(
i takes values of 0 (alleles not ibd) or 1 (alleles ibd). It has expectation E(![]() i)=F, where F is the pedigree inbreeding, which in turn equals the co-ancestry,
i)=F, where F is the pedigree inbreeding, which in turn equals the co-ancestry, ![]() , of its parents. The variance of
, of its parents. The variance of ![]() i in a population of similarly inbred but independent individuals is F(1−F). Slate et al. (Reference Slate, David, Dodds, Veenvliet, Glass, Broad and McEwan2004) analyse the correlation between multi-locus heterozygosity, a function of actual inbreeding, and the pedigree inbreeding, and show how weak this correlation is. Their analysis does not incorporate linkage, however.
i in a population of similarly inbred but independent individuals is F(1−F). Slate et al. (Reference Slate, David, Dodds, Veenvliet, Glass, Broad and McEwan2004) analyse the correlation between multi-locus heterozygosity, a function of actual inbreeding, and the pedigree inbreeding, and show how weak this correlation is. Their analysis does not incorporate linkage, however.
For the genome as a whole, the actual inbreeding ![]() of an individual is the proportion of its genome which is ibd, with E(
of an individual is the proportion of its genome which is ibd, with E(![]() )=F. Linkage affects variation in the actual relationship of individuals with the same pedigree relationship and also therefore increases variation in the actual inbreeding of their offspring. We use an example to show how it can be computed. Individuals E and F in Fig. 1 are full sibs, and so if they had mated for producing an offspring X, the expected inbreeding coefficient of X would be 0·25. If B is a male, then M is a paternal half sib of X, N is a maternal half sib of X, and their offspring H and I are cousins. The gametes transmitted by E to H and to X have the same random distribution as do those transmitted by F to I and X. Hence, the distribution of
)=F. Linkage affects variation in the actual relationship of individuals with the same pedigree relationship and also therefore increases variation in the actual inbreeding of their offspring. We use an example to show how it can be computed. Individuals E and F in Fig. 1 are full sibs, and so if they had mated for producing an offspring X, the expected inbreeding coefficient of X would be 0·25. If B is a male, then M is a paternal half sib of X, N is a maternal half sib of X, and their offspring H and I are cousins. The gametes transmitted by E to H and to X have the same random distribution as do those transmitted by F to I and X. Hence, the distribution of ![]() of X is identical to the distribution of
of X is identical to the distribution of ![]() 1 of H and I, who are cousins in this example. From eqn (14) or Box 1 (descendants of full sibs with g=3),
1 of H and I, who are cousins in this example. From eqn (14) or Box 1 (descendants of full sibs with g=3), ![]() , which also equals 4VarFC (
, which also equals 4VarFC (![]() , l) and
, l) and ![]() . Skew coefficients for the actual inbreeding can be obtained similarly.
. Skew coefficients for the actual inbreeding can be obtained similarly.
The arguments do not depend (although the detailed results do) on the relationship among the parents, and can be regarded as a consequence of extending the co-ancestry concept to identity at multiple loci. We are using a quantity, the ‘genomic coancestry’, which for a pair of individuals Y and Z is the proportion of the genome-shared ibd between a random gamete from Y and a random gamete from Z. Thus, genomic coancestry describes genomes transmitted from individuals, whereas genome sharing (k) describes genomes that are in individuals. Actual inbreeding depends on the genomic coancestry of the two gametes one individual receives; genome sharing and actual relationship depend on the genomic coancestry of the gametes two different individuals receive. For example, the variation of ![]() of offspring of cousin matings is the same as that of
of offspring of cousin matings is the same as that of ![]() 1 of second cousins, as both are the variance in the genomic coancestry of cousins.
1 of second cousins, as both are the variance in the genomic coancestry of cousins.
The results for variances, SD, CV and skew of actual relationship given in the Figures and Tables can therefore also be applied directly to actual inbreeding. For example, from Table 2 the SD of ![]() of offspring of full sib matings in humans is 2×0·0218=0·0436 (from item C) and 0·0240 (from item 2C) for offspring of cousins, with the CV of the latter being 0·0240/0·0625=0·384.
of offspring of full sib matings in humans is 2×0·0218=0·0436 (from item C) and 0·0240 (from item 2C) for offspring of cousins, with the CV of the latter being 0·0240/0·0625=0·384.
The above result applies to the variation in actual inbreeding among a group of unrelated individuals whose parents all have the same pedigree, e.g. are full sibs. In any population there is variation in pedigree inbreeding which also contributes to the total variance in actual inbreeding. The expected variation and distribution of shared segments in any population therefore depend on the population size and mating system, and relevant results for closed populations have been published (Bennett, Reference Bennett1954; Franklin, Reference Franklin1977; Stam, Reference Stam1980; Weir et al., Reference Weir, Avery and Hill1980).
The variation in actual inbreeding can be partitioned into two components, that between families, i.e. the covariance in actual inbreeding of (e.g. full sib) family members, and the variation in actual inbreeding among (e.g. full sib) family members. When we consider just pedigree inbreeding the variance between families is the variance of the co-ancestry from pedigree of the parents, which equals one-quarter of the pedigree relationship of the parents, and there is no variation in pedigree inbreeding within families.
Hence, for full sib matings, for example, ![]() . The variance within families can be obtained by difference, and so from the above results for full sib matings,
. The variance within families can be obtained by difference, and so from the above results for full sib matings,
This can also be regarded as the variance in genomic coancestry of full sibs less the variance in genomic co-ancestry between their parents.
As an example, using results from Table 2 for the human genome as a whole, VarFS (![]() , L)=4(0·0218)2=0·00191, VarBFS (
, L)=4(0·0218)2=0·00191, VarBFS (![]() , L)=(0·0392)2/4=0·00038 and VarWFS (
, L)=(0·0392)2/4=0·00038 and VarWFS (![]() , L)=0·00152, with corresponding SD equal to 0·0436, 0·0196 and 0·0390, respectively. In Table 3, we list relevant relationships and results. It is seen that the variation is substantial and is primarily within families (exclusively within families for selfing and parent–offspring matings of non-inbred individuals). For example, for cousin matings of humans, the mean F is 0·0625 and the SD within families is predicted to be 0·0214.
, L)=0·00152, with corresponding SD equal to 0·0436, 0·0196 and 0·0390, respectively. In Table 3, we list relevant relationships and results. It is seen that the variation is substantial and is primarily within families (exclusively within families for selfing and parent–offspring matings of non-inbred individuals). For example, for cousin matings of humans, the mean F is 0·0625 and the SD within families is predicted to be 0·0214.
SD of actual inbreeding ![]() for a model human genomeFootnote a for matings of relatives
for a model human genomeFootnote a for matings of relatives
a Differing map lengths as in Table 2, except as c.
b Relationship of non-inbred offspring with the same genomic coancestry as the inbred offspring.
c For a model maize genome of 10 chromosomes each of 1 M.
Estimation of inbreeding depression is usually undertaken by regression of phenotype on pedigree inbreeding. The method can be enhanced by using dense marker data in order to infer the proportion of the offspring genotype that is ibd from the parents and hence actual inbreeding ![]() (Slate et al., Reference Slate, David, Dodds, Veenvliet, Glass, Broad and McEwan2004). By undertaking the analysis within families, confounding environmental effects can be eliminated, with the method being analogous to that of Visscher et al. (Reference Visscher, Medland, Ferreira, Morley, Zhu, Cornes, Montgomery and Martin2006) for estimating heritability within families, but focused on means rather than variances. The design is likely to be most useful for species such as pigs that have large families. Christensen et al. (Reference Christensen, Fredholm, Wintero, Jorgensen and Andersen1996) undertook such an analysis, but had only 21 markers available for estimating actual inbreeding (which they refer to as ‘realized inbreeding’).
(Slate et al., Reference Slate, David, Dodds, Veenvliet, Glass, Broad and McEwan2004). By undertaking the analysis within families, confounding environmental effects can be eliminated, with the method being analogous to that of Visscher et al. (Reference Visscher, Medland, Ferreira, Morley, Zhu, Cornes, Montgomery and Martin2006) for estimating heritability within families, but focused on means rather than variances. The design is likely to be most useful for species such as pigs that have large families. Christensen et al. (Reference Christensen, Fredholm, Wintero, Jorgensen and Andersen1996) undertook such an analysis, but had only 21 markers available for estimating actual inbreeding (which they refer to as ‘realized inbreeding’).
5. Discussion
We have shown how to compute the variation and skew in the proportion of genomes shared for diverse kinds of relatives. As theoretical papers have shown previously (Hill, Reference Hill1993a, Reference Hillb; Guo, Reference Guo1995; Visscher, Reference Visscher2009), and anticipated by analyses of junctions and the distribution as a whole, the variance can be high, illustrated most clearly by the coefficient of variation (Fig. 2 b) and skew (Fig. 4) for increasingly distant relatives.
As the CV is large for single chromosomes each of the average length of those of humans (c. 1·6 M) (Fig. 2 b), exceeding two for second cousins or more distant relatives (Fig. 2 b), there is substantial overlap in the amount of sharing of quite different pedigree relationship classes. Further, there is substantial positive skew in the distribution over the whole genome for these and more distant relatives, such that individuals with low-pedigree relationship may share much more genome than expected.
In identifying distant relatives in a sample of individuals on which dense SNP data are available, information on potential relationship is available both from estimates of the mean proportion shared and from the variation among chromosomes. That this variation is substantially illustrated by the CVs of actual relationship (Fig. 2 b), which can greatly exceed unity. Distant relatives are expected to share little or none of the genome of a common ancestor ibd for some chromosomes and a non-negligible amount for others. Indeed, our results for variance in sharing of single chromosomes among pairs of individuals also apply to the variation in sharing among chromosomes of the same length between the same individuals. How best to use such an information has not, in so far as we know, been investigated.
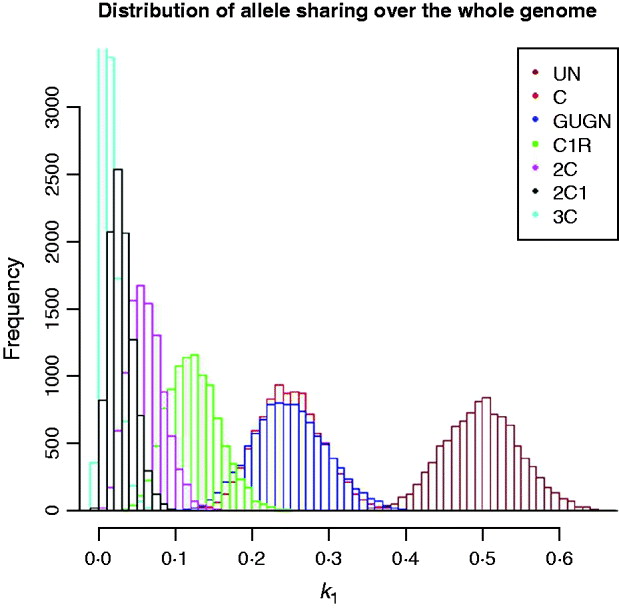
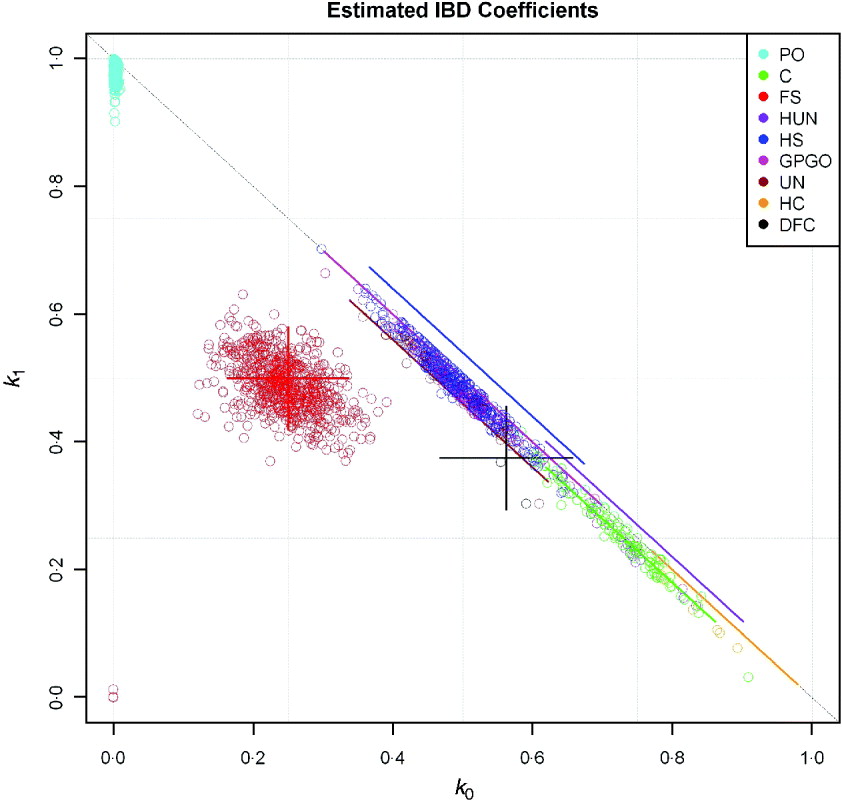
The problem of inferring pedigree relationship from actual relationship (as measured by genome shared) is illustrated in Fig. 5 using the human model genome example. Information on, for example, the distribution of the lengths of shared segments, which will tend to be shorter for distant relatives, also needs to be taken into account, following, for example, the work of Fisher (Reference Fisher1954 and earlier), Bennett (Reference Bennett1953), Stam (Reference Stam1980) and Thompson (Reference Thompson2008) which is based, inter alia, on analysis of junctions. Although the distribution of lengths of shared genome that include the end of the chromosome can be computed, there is no general approach that is simple to apply. While it is quite clear that developing methodology using the distributions of chromosome lengths and the numbers of chromosomes for which there is no sharing would be of some interest and potential practical value in establishing pedigree relationship, for example, in forensic situations, such an analysis is beyond the scope of this paper.
Distribution of actual genome sharing (![]() 1) for samples of ‘human’ genomes for different degrees of pedigree relationship of descendants of full sibs (as Fig. 2) (10 000 replicates each).
1) for samples of ‘human’ genomes for different degrees of pedigree relationship of descendants of full sibs (as Fig. 2) (10 000 replicates each).
Inferring the presence of genes of large effect under selection from shared segments of the genome or for mapping disease genes by comparing allele sharing proportions between affected and unaffected individuals has potential importance, but our results do not give much ground for optimism in its use because the sampling error is so high.
Estimates using dense markers of the variance in actual genome sharing of human full sibs were obtained by Visscher et al. (Reference Visscher, Medland, Ferreira, Morley, Zhu, Cornes, Montgomery and Martin2006, Reference Visscher, Macgregor, Benyamin, Zhu, Gordon, Medland, Hill, Hottenga, Willemsen, Boomsma, Liu, Deng, Montgomery and Martin2007), and, in general, there was good agreement: for example, the observed mean and SD of the proportion of the autosomal genome shared (![]() ), were 0·498±0·036 compared with expectation 0·5±0·039, and the corresponding figures for
), were 0·498±0·036 compared with expectation 0·5±0·039, and the corresponding figures for ![]() 2 were 0·248±0·040 observed and 0·25±0·044 expected. The discrepancy was explained by the fact that identical sections could be missed as a limited number of microsatellite markers were used in these studies, averaging 400–600 per individual for the whole genome (Visscher et al., Reference Visscher, Medland, Ferreira, Morley, Zhu, Cornes, Montgomery and Martin2006, Reference Visscher, Macgregor, Benyamin, Zhu, Gordon, Medland, Hill, Hottenga, Willemsen, Boomsma, Liu, Deng, Montgomery and Martin2007). We offer further illustration in Fig. 6, using data kindly supplied by Dr M. Marazita. Coefficients of ibd were estimated using SNP data obtained for a whole-genome association analysis of dental caries. Relationship classes were inferred from pedigree information with software developed by Dr Cecelia Laurie and the methods of this paper were used for calculating the SDs of
2 were 0·248±0·040 observed and 0·25±0·044 expected. The discrepancy was explained by the fact that identical sections could be missed as a limited number of microsatellite markers were used in these studies, averaging 400–600 per individual for the whole genome (Visscher et al., Reference Visscher, Medland, Ferreira, Morley, Zhu, Cornes, Montgomery and Martin2006, Reference Visscher, Macgregor, Benyamin, Zhu, Gordon, Medland, Hill, Hottenga, Willemsen, Boomsma, Liu, Deng, Montgomery and Martin2007). We offer further illustration in Fig. 6, using data kindly supplied by Dr M. Marazita. Coefficients of ibd were estimated using SNP data obtained for a whole-genome association analysis of dental caries. Relationship classes were inferred from pedigree information with software developed by Dr Cecelia Laurie and the methods of this paper were used for calculating the SDs of ![]() 0 and
0 and ![]() 1. For each pair of related individuals in the study (pedigree R>1/32), the estimated IBD coefficients (
1. For each pair of related individuals in the study (pedigree R>1/32), the estimated IBD coefficients (![]() 0 and
0 and ![]() 1) were plotted, along with predicted ‘error bars’ of two sds each side of the expected values. For display purposes, these bars were offset from the line k 0+k 1=1 in the cases for which k 2=0. We did not perform any statistical tests for inferred relationships; the error bars reflect only Mendelian sampling and linkage, and the effects of using sample allele frequencies on variation in estimated ibd coefficients will be discussed elsewhere.
1) were plotted, along with predicted ‘error bars’ of two sds each side of the expected values. For display purposes, these bars were offset from the line k 0+k 1=1 in the cases for which k 2=0. We did not perform any statistical tests for inferred relationships; the error bars reflect only Mendelian sampling and linkage, and the effects of using sample allele frequencies on variation in estimated ibd coefficients will be discussed elsewhere.
Estimated ibd coefficients, ![]() 0 and
0 and ![]() 1, from SNP data for individuals with known pedigree relationship (PO denotes parent-offspring, DFC double first cousins, other symbols as Figs 2 and 3), together with predicted ‘error bars’ of two SD about expectation. Bars are offset from k 0+k 1=1 if k 2=0.
1, from SNP data for individuals with known pedigree relationship (PO denotes parent-offspring, DFC double first cousins, other symbols as Figs 2 and 3), together with predicted ‘error bars’ of two SD about expectation. Bars are offset from k 0+k 1=1 if k 2=0.
The main objective of this paper was to provide general formulae for computing the variance of shared sites. Obviously there are many other avenues to pursue, but these require different techniques.
We are grateful to Peter Visscher for many helpful comments on previous drafts and to Jinliang Wang for a useful suggestion. This work was supported in part by NIH grants R01 GM075091 and HGU0044446, and by the USS. David Crosslin, University of Washington, plotted the figures. Mary L. Marazita, University of Pittsburgh, consented to inclusion of Fig. 6 that displays results from her study of Dental Caries (supported by NIH grants U01-DE018904 and R01-DE014899, and NIH contract HHSN268200782096C to the Center for Inherited Disease Research for genotyping) as part of the GENEVA project (Cornelis et al., Reference Cornelis, Agrawal, Cole, Hansel, Barnes, Beaty, Bennett, Bierut, Boerwinkle, Doheny, Feenstra, Feingold, Fornage, Haiman, Harris, Hayes, Heit, Hu, Kang, Laurie, Ling, Teri, Manolio, Marazita, Mathias, Mirel, Paschall, Pasquale, Pugh, Rice, Udren, van Dam, Wang, Wiggs, Williams and Yu2010). The paper is dedicated to the memory of Piet Stam for his pioneering work in multi-locus ibd.


