
“A few mavericks did spot the financial crisis coming but their views were dismissed by a complacent economics establishment. The Queen famously put the dismal science in its place when she used a visit to the London School of Economics in November 2008 to ask why nobody saw it coming” (Larry Elliott, The Guardian, 6 June 2016).
Back in 2008, as luck would have it, I had a book published, Organising and Disorganising (Thompson, Reference Thompson2008a), just as the “credit crunch” was blossoming into the “global financial crisis”. Of course there was nothing in the book about those momentous events but, thanks to several reviewers having made the connection, I found myself invited to the Royal Society of Arts to give a talk specifically on that crunch-cum-crisis (Thompson, Reference Thompson2008b). At about the same time, as luck would further have it, I received an email, out of the blue, from Dave Ingram and Alice Underwood who, in the course of their work in the New York office of the insurance giant Willis Re, had been looking up “the cultural theory of risk” on Wikipedia. The result is that, working in our spare time and without any funding, we have now built up around 30 publications.Footnote 1 So we recently paused, pulled all these publications together and decided the time has come to turn them into a book. My idea here is to try to set out the gist of that book, beginning with the changing seasons of risk (Figure 1).
-
∙ Moderate (normal-risk environment): this is when the long-term averages seem to hold up well. Investors and insurers experience mostly gains, but with enough losses to maintain focus on appropriate risk management. Volatility is in the normal range, so hedging and reinsurance programmes have the expected impacts. ERM (enterprise risk management) was designed for the environment. Capacity for risk-taking is carefully matched up to risks, but taking risks up to capacity is usually seen to be the best course in this environment. Capacity is usually defined in terms of something like a one in 200-year loss, but no one really expects to experience a loss of that size. That just would not be normal. In this normal-risk environment, markets will be equilibrium-seeking.
-
∙ Boom (low-risk environment): it does not seem to matter how much risk is taken on during this stage. Every decision to take an additional risk pays off handsomely. Over and over again the naked, unhedged position beats out the carefully hedged position and the uninsured risk beats the insured risk. During this environment, people slowly drift away from being concerned about risk and risk management, because they are looking at others who are not concerned and are making lots and lots of money. Capacity for risk-taking does not seem to be an issue and some will take much more risk than could possibly be prudent in any other environment. In this low-risk environment, markets can and will move out of equilibrium and into bubbles.
-
∙ Uncertain (unpredictable-risk environment): suddenly, things get really risky. Almost any course of action presents potentially fatal threats. Some unexpected event often triggers a shift from one environment to another, with those shifts being generally tied to system capacity. But system capacity, it seems, is often an elusive quantity (partly because of the “This Time is Different” thinking pointed out by Reinhart & Rogoff (Reference Reinhart and Rogoff2009) in their book of that title). Natural or man-made catastrophes, or sudden major shifts in markets, might be triggers. Individual firm risk-taking capacity, which was seen as a perpetual and limitless resource during the boom stage, now suddenly seems like it may or may not be sufficient. Firms that relied upon the predictability of the moderate stage find that they are much more fragile than is prudent. Suddenly people are extremely concerned with how risks are (and were) managed. In this unpredictable-risk environment, markets can and will swing violently.
-
∙ Bust (high-loss environment): many of those risks have turned into losses. The survival of the institution (and potentially of the entire financial system) is uncertain. The market senses that many previously respected firms will not make it through this period, and that suspicion drastically slows business activity. The risk management focus needs to be on helping to find, opportunistically, the course of action that will save the firm. For the firms that fail, risk management efforts shift to work-out. In this high-loss environment, markets may cease to function for periods of time.
Our basic hypothesis.
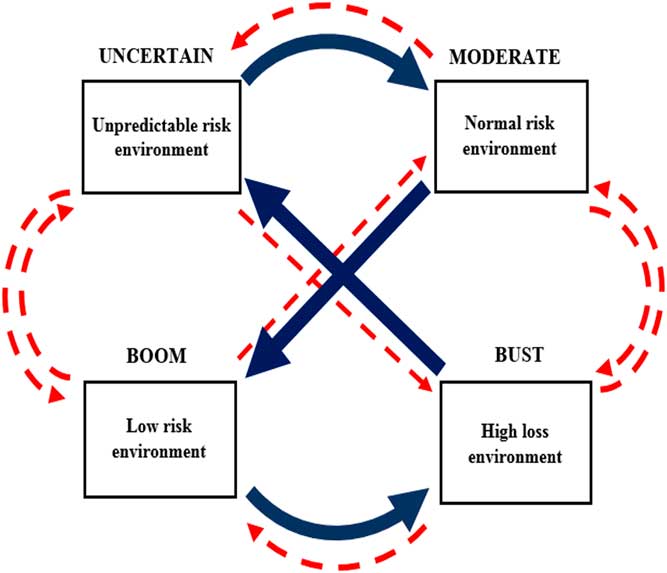
So our hypothesis is that these four environments are loosely analogous to the four seasons in our annual cycle. Each can be seen as paving the way for the next, but sometimes (as with Summer in Britain) one or more may get missed out hence the dashed red arrows in Figure 1. On top of that, one may last for a very long time, or be so short as to be almost imperceptible. In other words, things are cyclical, but they are erratically cyclical: the dynamics, being complex and cultural, cannot be captured in some nicely disciplined sine curve. This pulls the rug from under the long-relied upon objection to Kondratieff (or “long”) waves: that their periods are not of constant duration and their amplitudes are far from steady. This objection has justified some sweeping dismissals. As one high priest within what Larry Elliott calls the “complacent economics establishment” has put it: “there are very few ideas in macroeconomics that serious economists are agreed on, but doubting the existence of the Kondratieff is one of them” (Allen Meltzer, quoted in Angrist, Reference Angrist1991).
This crucial recognition – that cycles can be erratic – helps locate our “anthropological approach” (as it is called) within that long-marginalised line of theorising: evolutionary economics. That line can be seen as starting with Nikolai Kondratieff himself (with his 50-odd years alternations of booms and slumps) and then being picked up by Joseph Schumpeter (with his notion of “creative destruction”), eventually passing on to Richard Nelson and Sidney Winter (with their focus on technological evolution) and then to Brian Arthur (whose exploration of increasing returns to scale, the very existence of which is denied by neoclassical economics. draws our attention to “technological lock-ins”, such as those we currently suffer in relation to fossil fuels and to sewerage and wastewater treatment).Footnote 2 Alfred Marshall too belongs in this lineage, thanks to his ultimate, and equilibrium-rejecting, aim of understanding “the forces that cause movement”.Footnote 3 Anthropology’s contribution to this line of theorising, as we will see, is the fourfold typology of “cultural biases” (or rationalities) that was originally proposed by Mary Douglas (in her How Institutions Think (Douglas, Reference Douglas1986) and, more explicitly, in her Natural Symbols (Douglas, Reference Douglas1970)). It is this typology, we argue, that enables us to put the institutional into evolutionary economics: to pluralise the idea of rational choice.
So I am now faced with two big questions. First, what evidence is there for this erratic cycle? Second, and echoing Alfred Marshall’s focus on “the forces that cause movement”, what, if there is such a cycle, is driving it and preventing it from fizzling out (or blowing itself to pieces)?
Question 1
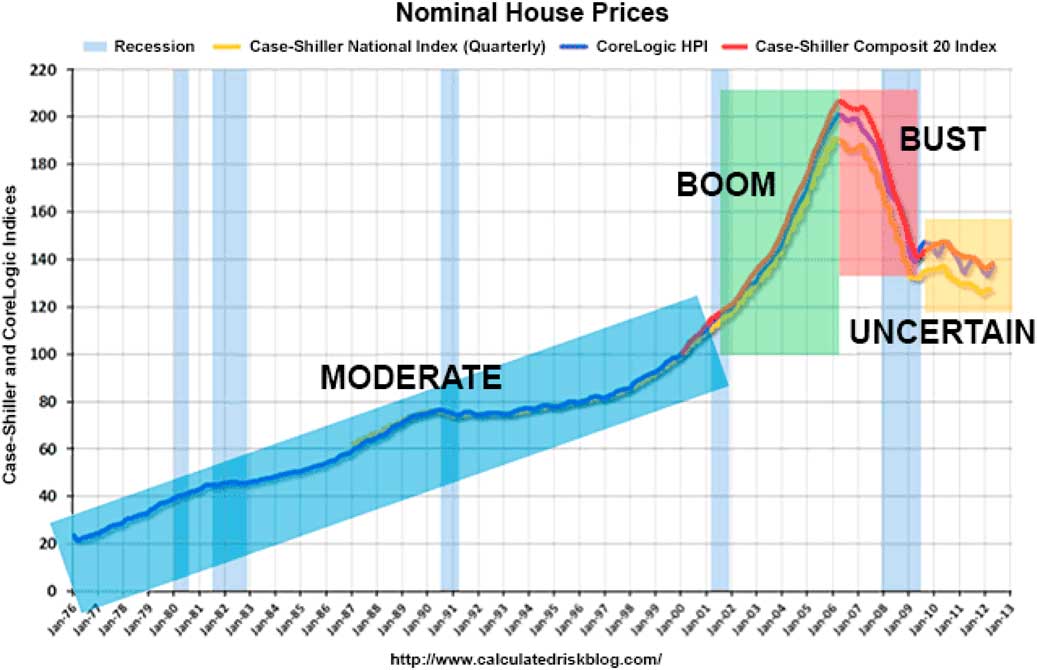
The four seasons of risk are clearly visible in Figure 2: a graph of US house prices.
-
∙ For the first 20-plus years prices were moderately volatile.
-
∙ Then, for a few years, prices went almost straight up: boom.
-
∙ This boom, as we all now know, was followed by a bust.
-
∙ Nothing too surprising (in hindsight) about that, but what we see after the bust is a trend-less and remarkably prolonged season of uncertainty. This happens to coincide with Ben Bernanke’s stint as chairman of the US Federal Reserve, and a content analysis of his speeches during those years reveals a very high count of the U-word.
The four seasons of risk.
Those erratic cycles also show up if we take a long-term, historical perspective. Gerry Mars and I looked at four celebrated busts, spanning more than 400 years: tulipmania, the South Sea Bubble, 1929 and 2007/8. Definitions of deviance, we found, varied consistently with the seasons of risk, with behaviour that was seen as innocuous (even admirable) during the up-turn being considered despicable (even criminal) after the down-turn. For instance, Goldman Sachs’ shenanigans around 1929, and again in 2007/8, have much in common with what happened during tulipmania: inflating the price of certain tulip bulbs, for instance, by letting pigs into the relevant plot at dead of night, having first built up a sizeable stock of those same bulbs (Mars & Thompson, Reference Mars and Thompson2013). Not exactly the same shenanigans, of course; as Mark Twain remarked: “History does not repeat itself; at best, it rhymes”.
Question 2
Economics, we argue, took a wrong turn, back in the 1930s, when it became much more mathematical (“mathematised” itself) and came up with its snappy new definition: “The allocation of scarce resources to alternative ends”.Footnote 4 But, with four seasons of risk, all cycling erratically and in a way that (unlike with, say, a pendulum) cannot be captured in an equation, and with never an equilibrium in sight, mathematisation is simply not possible. If we want to understand “the forces that cause movement” then computer simulation, “artificial life”, as it is sometimes called, is the only way to go. We discuss an example of this called the “Surprise Game” in a moment.
Dave Ingram was looking up “the cultural theory of risk” on Wikipedia because, in the course of several years working in the rating agency Standard and Poor’s, he had become ever more aware that only some insurance companies’ behaviour fitted the model of the rational utility maximiser. Rationality, he reasoned, would have to be treated as plural, not singular. And, sure enough, four distinct camps can be identified: we call them Managers, Conservators, Maximisers and Pragmatists (Figure 3).
-
∙ Managers (i.e. hierarchy in Figure 3), with their expectation of a moderate environment, are confident that the real world can be modelled (by certified experts) and that using information from those models with an ERM system will enable the management of risk. During the moderate environment, managers will experience growing success, avoiding excess losses in bad quarters (beyond the two peaks in their icon) and enjoying larger and larger gains in the better quarters (inside the icon’s “pocket of stability”) as they steadily improve their models.
In a boom environment they are sometimes pleasantly surprised by better-than-expected results, but they are caught totally off-guard by the large losses of the bust environment. And they will be deeply puzzled by the unpredictability of the uncertain environment.
-
∙ Conservators (i.e. egalitarianism in Figure 3), with their expectations of disastrous losses, prefer to assess their risks using stress tests and worst-case scenarios. Statistical economic capital models, they are convinced, convey a totally false sense of mastery over risk: a mastery that, in their minds, cannot be achieved (there being no “pocket of stability” in their icon).
They will usually miss out on some (or all) of the gains available during the boom season and, with their lower risk positions, they will muddle through the moderate and uncertain seasons. However, they will have much smaller losses than others in the next bust season which is what they are always preparing for.
-
∙ Maximisers (i.e. individualism in Figure 3), being convinced that the world is low-risk (and reassuringly “mean-reverting”; the ball, in their icon, always returns to the bottom of the basin), feel no need for an economic capital model, or for a Manager-style ERM system. Superior talent, they believe, will identify the risks with the best returns, and they do not want their judgement over-ruled by a model. For them, risk limits and control systems are unneeded bureaucracy: “business prevention systems”. Maximisers will create massive profits while the boom season lasts, but are likely to be ill-prepared for the adversity that, in varying ways, accompanies the other three seasons. Some readers may recall Chuck Prince, the hapless CEO of Citigroup. who, in 2007, 6 weeks before the markets froze completely, said “As long as the music’s playing, you’ve got to get up and dance; we’re still dancing”.
-
∙ Pragmatists (i.e. fatalism in Figure 3) see the world as operating without rhyme or reason (in their icon, and unlike with the other three, pushing the ball this way or that on the flat surface does not enable you to learn anything). They therefore see no point in spending time and money on building an economic capital model that assumes a predictable range of future outcomes. Much better, they feel, to do the one thing you can do: diversify, so as to ensure you have not got all your eggs in the same basket (and there are a number of quite fancy methods for doing that).
The fourfold typology of cultural biases/rationalities.
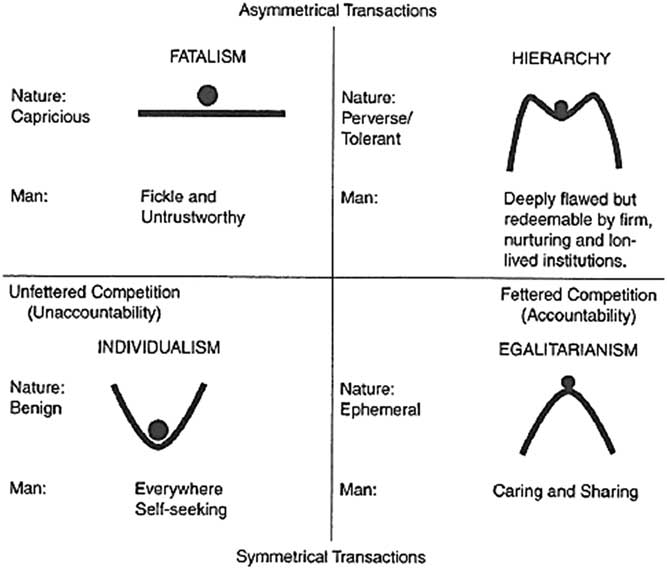
This strategy confers impressive survival value on the Pragmatist firm during the uncertain season that tends to wreak such havoc among Manager-led and Maximiser-led firms, but prevents it from making the most of the opportunities, be they for profit-making or loss-reduction, during the other seasons.
So, to summarise, no strategy is good for all risk seasons. Taken together, along with their varying successes and failures, they constitute the financial sector-specific version of the general theory of surprise (Figure 4).
The general theory of surprise.
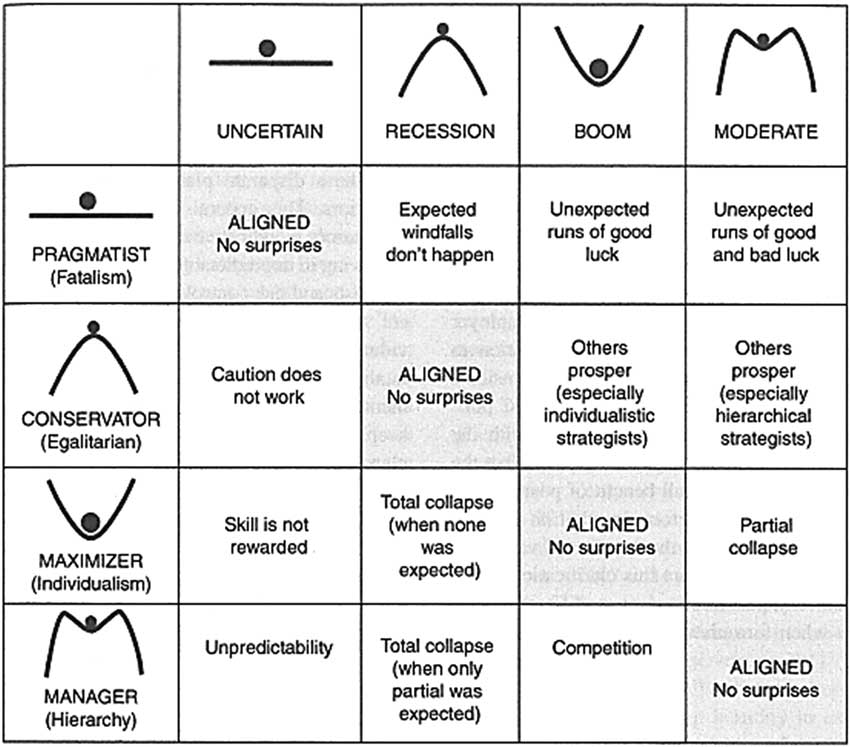
Down the left-hand side of this matrix we have the stipulated worlds each supplied to us, as it were, by our cultural bias/rationality as set out in Figure 3. Across the top we have the actual worlds. The idea is to use this matrix to generate an erratically cyclical sequence of transitions through these four states of the actual world: a seemingly counter-intuitive proposition that is, however, increasingly well supported. In ecology, for instance, there is the ecocycle through four different types of “community” (Holling, Reference Holling1986) and in organisation theory we find a similar sequence through four “causal textures of organisational environments” (Emery & Trist, Reference Emery and Trist1965).Footnote 5 We see much the same being mapped out in the four “general states of economic activity” that have been discerned by the evolutionary economist Hyman Minsky. These are: “hedge” where firms and individuals clearly have the cash flows to support the repayments of both the loan principal and interest, “speculative” where cash flows fully support the repayment of interest but not of the principal, “Ponzi” where cash flows are insufficient to repay either interest or principal and “collapse” the inevitable fate of all pyramid schemes. The transition back to “hedge” can be rapid or prolonged, with that period being heavily influenced by government intervention in the markets.
These all give us what are called epigenetic landscapes, in that they are dynamical systems in which the various actors, species, organisms, firms or whatever, in adapting to and exploiting a particular environment, eventually transform it into a different environment. A process which goes on and on. Or, as Minsky (Reference Minsky1992) has so nicely put it, “stability is destabilising”. I mention all this because it lets me explain something of the profound practical significance of our “anthropological approach” to financial risk.
Some of our most recent work (see Tsanakas et al., Reference Tsanakas, Beck and Thompson2016) has been on model risk. As well as causing something of a stir in the actuarial profession, it won the 2015 IFoA (UK Institute and Faculty of Actuaries) Peter Clark Prize, it has now caught the attention of the BIS (Bank for International Settlements). Based in Basel, the BIS is, in effect, the central banks’ central bank and is therefore, through its FSB (Financial Stability Board), the “uber-regulator”. And in the latest regulatory framework, which is called “Basel II” for banks and “Solvency II” for insurance companies, firms are required to do two things: build an “internal model” and show that they have used it (the so-called “use-test”). So model risk. whether it arises from errors in the model itself or from firms all doing the same thing – “coerced herding”, you could say – where previously they were doing lots of different things, is a potential threat to the regulatory goal which is the stability of the global financial system. And that potential is enhanced when we consider the “reluctant conformers”: Maximiser firms that see controls as business prevention systems, Pragmatist firms who see modelling as a waste of time and money, and Conservator firms who are convinced that models convey a totally false sense of mastery over risk.
Indeed there is a threat, and our suggestion is that the goal of stability needs to be replaced by resilience: not just bounce-back (which assumes just a single “basin of attraction”) but “the ability of a system to cycle endlessly through a small number of different basins of attraction”. Of course, we are not alone in saying that (it is, for instance, what Nassim Taleb (Reference Taleb2012), the inventor of “black swans”, is saying) nor is the BIS unaware of it. The challenge, rather, is to find some effective way of getting to grips with it, which brings us, at last, to our “Surprise Game”: an abstract and highly stylised computer simulation of that epigenetic landscape: a landscape on which stability is forever destabilising.
The game consists of a “world” (which, of course, can be in any of four different states) of just 30 firms. Each of these firms has to survive, and if possible prosper, in its environment, which is nothing more than the other 29 firms. Each firm (or automaton in the artificial life terminology) has to latch onto one of the four strategies – Manager, Conservator, Maximiser or Pragmatist – thereby becoming an agent, but has to relinquish that strategy, and latch onto one of the other three, if it finds itself surprised in three consecutive rounds. These surprises. there are 12 in all, are supplied by our “surprise matrix”: Figure 4. These, together with the various “triggers” for the transitions from one risk season to another, are the “bottom-up” rules. The results of setting the game in motion are shown in Figure 5.
Firms by strategy: 50 period simulation.
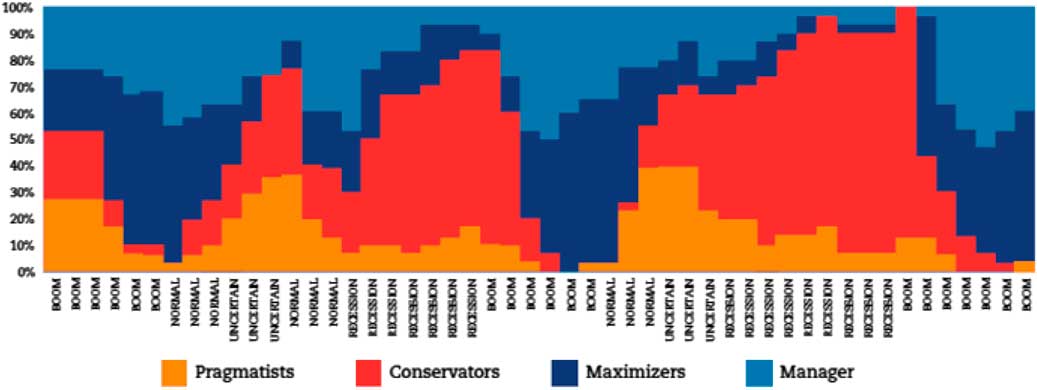
What we see in Figure 5 is the emergence (it was not there to start with) of some remarkable, and remarkably “life-like”, whole-system behaviour: booms, busts, waves of bankruptcies, bouts of “merger mania” and so on.
-
∙ There is, clearly, a fair amount of waxing and waning going on. Indeed, some strategies/rationalities, at times, wax so much as to almost eliminate the others. At other times, some of them wane so much as to completely disappear for a few rounds.
-
∙ Some wax and wane more markedly than others; the Maximiser and Pragmatist strategies, unsurprisingly, but for different reasons, swinging more violently than the Manager and Conservator strategies.
-
∙ Nothing ever goes in a straight line, no trend goes on forever, no strategy is good for all seasons. But these cycles, contra those rejectors of Kondratieff waves, are not pendulum-like. Their various peaks and troughs are not evenly spaced, nor are they of constant amplitude. The same holds for the environment, the four seasons of risk come and go, but not always in the “right” sequence, and enduring sometimes (as with the “Great Moderation” that was presided over by Alan Greenspan) for an unseasonably long time.
-
∙ In other words, we have erratic cycles in which none of the strategies ever goes into permanent extinction, no clear “winner” ever emerges, things never settle down into some dynamic equilibrium. We have run the game, in its old and new forms, it dates from the 1980s, for thousands of rounds and no sequence of changes ever exactly repeats itself.
Equipped with this Surprise Game, we can now get down to the practical applications and implications of our “institutional evolutionary economics”. It is called the Surprise Game, not because you can play it (like Monopoly, say) but because you can play with it. For instance, you can rig it so as to get it to do certain things that firms seem to do in real life, or to do certain other things that you could never get to happen in real life.
-
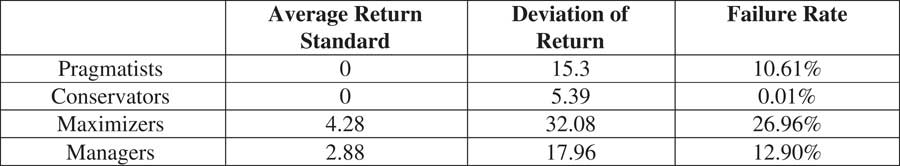
∙ Many avid proponents of one or another of the four strategies, for instance, might feel that the best course of action is to stick with just one strategy through thick and thin. So if we get one of the 30 firms to do this, four times over, we can see the various consequences of the four ways of “staying the course” (Figure 6).
-
◦ Conservator firms, we can see, tend not to grow, but they can have very long life-spans (and many mutuals are just like that).
-
◦ Maximiser firms by contrast, can grow like the clappers, but will likely have rather short lives (as with Bear Stearns and Lehman Brothers in the United States and Northern Rock in the United Kingdom, which hit the buffers, in spectacular style, just a few years after it had de-mutualised).
-
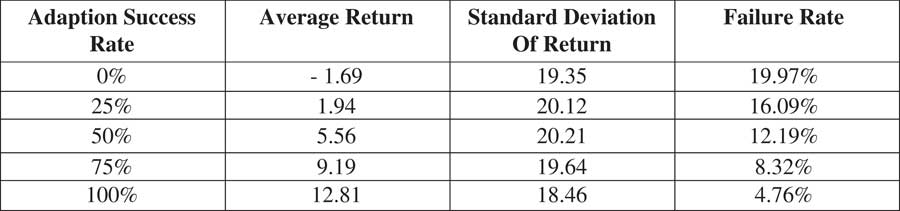
∙ But the game itself, when un-rigged (and as we have seen in Figure 5), has firms frequently changing strategy in lagged response to changes of season. So any shift to a strategy that is in alignment with the new season can be construed as a successful adaptation, and this means that we can use the game to compare how firms do as their adaptation success rates vary: all the way from 0% to 100% (Figure 7).
-
◦ The firm with a zero rate never manages to align strategy with season; it keeps changing but always to the wrong strategy: the ultimate “bad luck” firm!
-
◦ Towards the middle of the range we find the various “stay the course” firms.
-
◦ And at the other extreme – 100% success – we have the rationally adaptable firm: the firm that changes its strategy, correctly, every time the season changes. As you can see, it does spectacularly better than all the others. Unfortunately, such a firm is an ideal construct, like a “perfect gas” or a “black body”, not something that you will ever bump into in the street.
Results of stay the course strategy.
Variation of results of success of adaptation.
However, one thing you can say with the help of this ideal constructFootnote 6 is that the firm that “clumsifies” itself – ensures that all four “voices” are able to make themselves heard and are then each responsive to (rather than dismissive of) the others – will get closer to rational adaptability than firms that are less clumsy. Least clumsy of all, of course, are the firms in which just one voice drowns out all the others, and there were many, many of those in the lead-up to the 2007/8 crunch-cum-crisis. The Chief Risk Officer of AIG (American International Group), for instance, just a few weeks before it crashed out in the biggest bankruptcy in corporate history, declared: “Let’s face it, we’re all in sales [i.e. Maximisers] these days”.
So, with this deceptively simple normative principle – less elegance, more clumsiness – derived from the ideal construct of rational adaptability, we are now right in the middle of a set of concerns that is absolutely central to the financial sector and that can be assembled under the heading: “Risk Cultures and Corporate Governance”. So we went out and looked at a few firms (Figure 8).
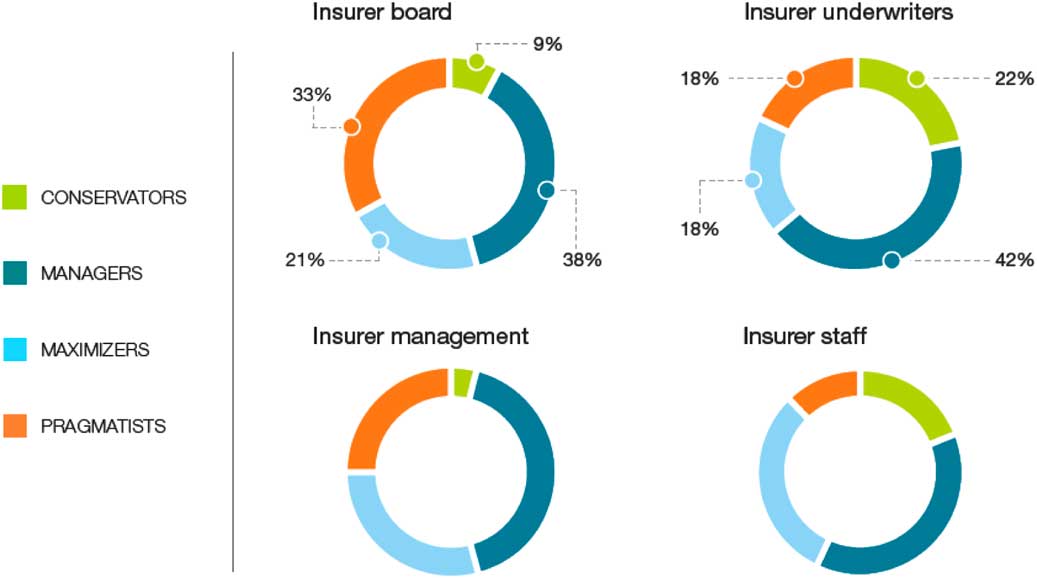
Distribution of risk preference for 200 individual survey respondents. MAX, maximiser; MGR, manager; PRAG, pragmatists; CONS, conservators.
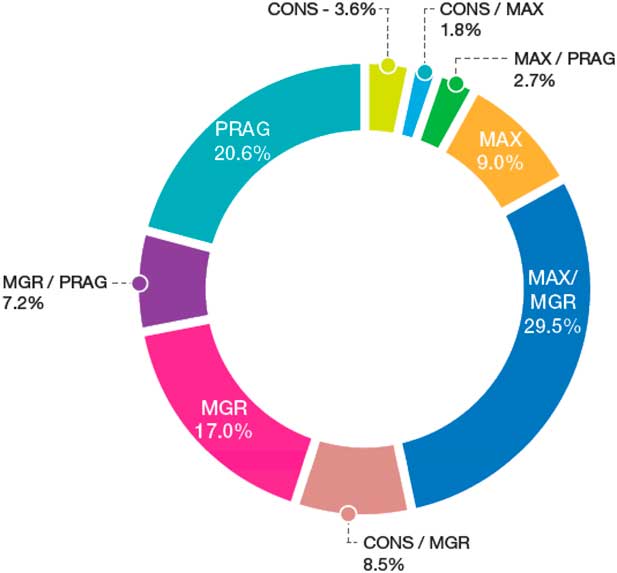
A glance at this survey of senior executives in 11 insurance companies will confirm that Dave Ingram really was onto something when he realised that such actors do not all fit the model of the rational utility maximiser.
-
∙ Indeed, “pure-blooded” Maximisers make up only 9% of the total, far behind Pragmatists (at 20%) and Managers (at 17%) but ahead of Conservators (at 3.6%). However, their ranks swell considerably if we add in some of the “hybrids”, especially the Maximiser/Managers (at 29.5%).
-
∙ But of course this is a snapshot at just one stage in the cycle – the Uncertain one – and we can expect the relative proportions to shift considerably as we go around it.
-
∙ What is most important here is that all four strategies are clearly there. Nor do there seem to be any others that we have missed (which is consistent with the theory’s “impossibility theorem”: that there are these four and only these four).
Another layer to the risk culture puzzle is who in a company favours which strategy. The relative strengths, it turns out, vary from level to level (Figure 9).
-
∙ This company’s board, we can see, is fairly clumsy, in that it does encompass all the voices. But it is a bit more Conservator-minded, and a bit less Maximiser-minded, than is the management level (hardly surprising, since board members are usually top managers somewhere else).
-
∙ The two lower levels, however, are much more Conservator-minded than both the board and the top management, meaning that middle management may well see these upper levels as too aggressive perhaps gung-ho, even.
-
∙ Indeed, in one of our firms, no one in top management favoured the Conservator risk culture. When this was pointed out to them, they were unconcerned. “Ah”, they responded, “that would be Joe; he retired last year and our meetings have had many fewer arguments since then!”. Fewer arguments, maybe; but the corporate culture has become much less clumsy than it was.
Average risk preference by type of position held. MGR, manager; PRAG, pragmatists; CONS, conservators.
Such reductions in the level of argument, and its accompanying erosion of the “requisite cultural variety”, is evidently something that can all too easily happen. Indeed, there are stories of board meetings, in the years leading up to 2007/8, at which those who tried to speak with any voice other than the Maximiser one were literally shouted down. So this is something that needs to be actively guarded against. And this sort of 4×4 scheme – “how many voices are being heard, and how responsive are they to one another?” is now up-and-running in at least one insurance company: Tokio Marine.
Another application came when an insurance company in the southern United States realised it had run into some serious trouble but could not work out what was the cause. Dave Ingram went down there for the day, did the cultural theory interviews in the morning and then presented the results to them in the afternoon. It turned out that the cultural dispositions, the relative strengths of favoured strategies, were wildly out of line as he went from top management to the lower levels: much more so than in the company (depicted in Figure 9) where the differences are probably quite healthy. “Ah”, they said, “that’s what it is”, and they immediately set to work: deliberating over how best to cope with it, whether certain measures of cultural change were needed at certain levels, and so on. Overall, this was a pretty good, and exceedingly swift, piece of consultancy. It was also free, the firm being one of Willis Re’s clients.
However, the most important implication is related to ERM as it is currently conceived. If a risk management programme is to do more than just pay lip service, we suggest, it must align with the corporate culture (Figure 10).
-
∙ Company 7 (see Figure 10), being predominantly of the Manager persuasion, might do well with a “pure” ERM approach.
-
∙ Companies 2, 6 and 10 might do okay with a sort of “Maximiser/Manager” ERM.
-
∙ But companies 1, 4, 5, 8 and 11 have significant minorities favouring the Pragmatist risk culture, while companies 3 and 9 are strongly of the Conservator persuasion. Even a modified ERM will not align with them.
Average risk preferences by company.
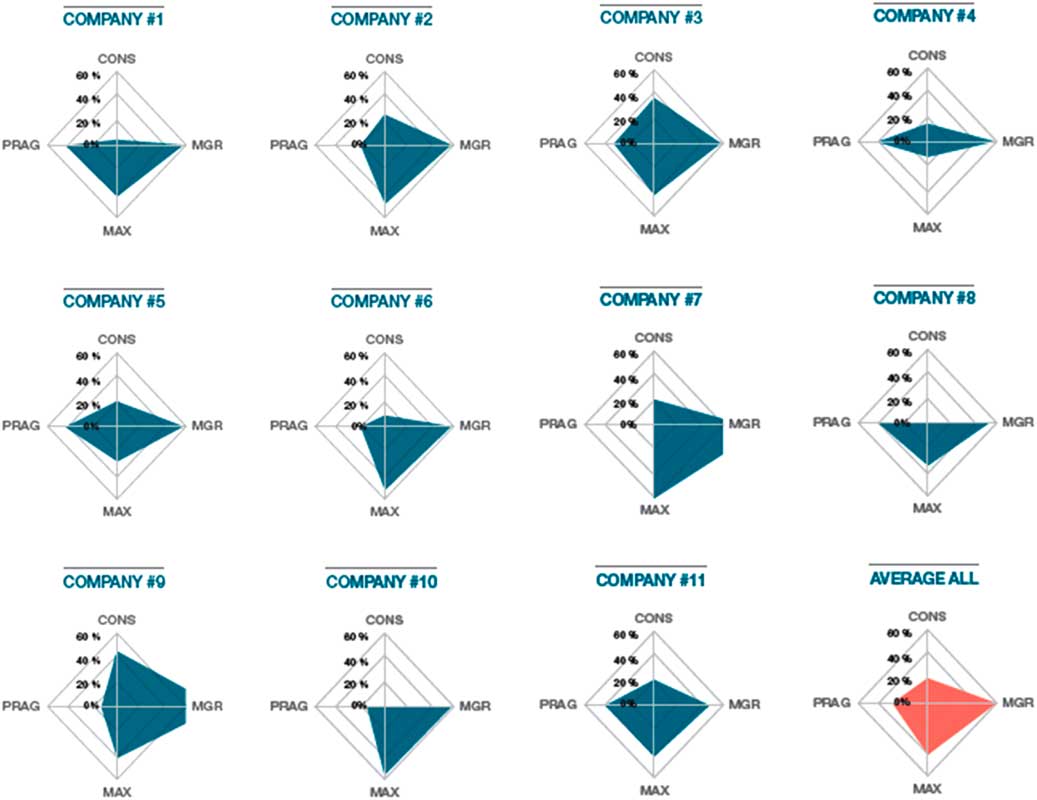
So, if ERM (in its current form) works fine for one in every 11 companies, can be tweaked so as to somewhat work in another three, and simply will not align with the remaining seven then it is, to put it mildly, not much use.
That this is so has, of course, been driven home by the events of 2007/8, and by the consequent non-arrival of the expected return to normality. Nevertheless, many, especially governments, are insisting that ERM, for all its admitted defects, is the only way to go. Their hope is that regulators and central bankers will do their job better, that risk will thereby be tamed, and that henceforth we will always stay in the Moderate (i.e. normal-risk) season, as in that song where “every day will be the first day of Spring”. The mantra here is “Never again!” as it has been after every bust, all the way back to tulipmania. But others, ourselves among them, point out that this invoking of normality is tantamount to declaring Summer, Autumn and Winter to be abnormal, and that we need to extricate ourselves from that non-sensical position (along with its explanations, if you can call them that, in terms of “irrational exuberance”, “animal spirits”, “herding behaviour” and so on) by accepting the strong possibility that future shifts from one risk season to another, for new reasons, exists at all times. Calls for a fixed set of rules, we and they argue, should be ignored. Such rules, if imposed, will likely be immediately arbitraged and, even if they are not, they will be effective in just one of the four seasons. Instead, ERM needs to be made flexible, “season-sensitive”, you could say, so that it can do the different things that are needed in the different seasons (each of which, we must accept, is every bit as “normal” as the others).
Having written up the work on these eleven companies (Underwood et al., Reference Underwood, Thompson and Ingram2014), we took a deep collective breath and decided that the time had finally come to expand our “anthropological approach” to regulation. First, however, the three of us worked with Elliot Varnell (a UK-based actuarial consultant) in order to generate a hypothesis that we could then test in our interviews (Figure 11). Hierarchy (Manager-style thinking), we reasoned, must be the “natural home” of the regulator but, depending on circumstances, it could be that he or she can be lured out of that natural home in any of the three directions our cultural theory typology (Figure 3) offers. Not such an outrageous suggestion, we thought, given Alan Greenspan’s rather pronounced journey towards individualism (Maximiser-style thinking): the “self-interest ideology” that, he told the US Congress, had served him so well for 40 years, only to then be hit, as he put it, “by a once-in-a-century credit tsunami”.
The fluidised regulator.
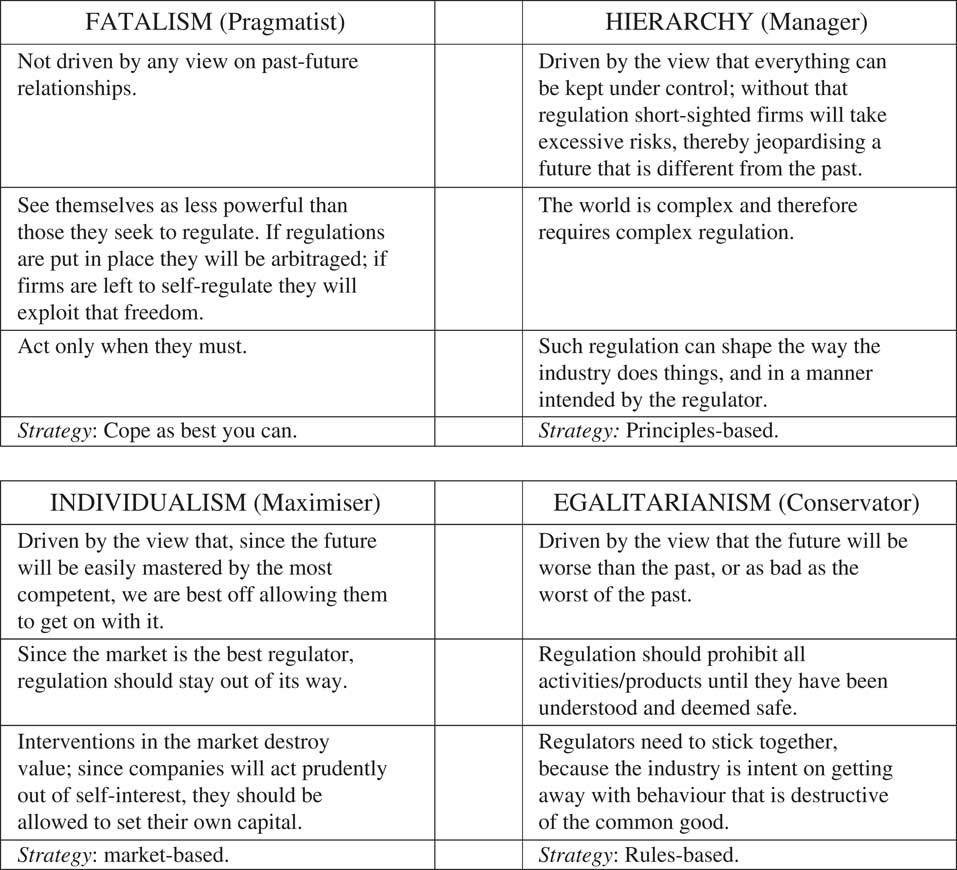
To date we have interviewed Paul Sharma, Chris Moulder and Andrew Bulley (at the Bank of England’s Prudential Regulation Authority), Ian Marshall (The FSB), Martin Wheatley (The Financial Conduct Authority), Pula Houghton (Which? Magazine/The Consumers Association), Andy Haldane (Bank of England), Valerie Mersey (responsible for compliance at Deutsche Bank) and Terri Vaughan (senior US regulator). Each of them, unsurprisingly, gave carefully considered and very definite answers to our questions, but these often contradicted those given by the others (we having begun by stressing that there were “no right or wrong answers”).
Since the teasing out of such “contradictory certainties” is inevitably a lengthy business, I will have to restrict myself to just a few instances in order to give some indication of how our respondents, in distributing themselves between the different quadrants in Figure 11, support our hypothesis.
-
∙ Several felt that firms, in certain circumstances, could be trusted, and saw good regulation as “getting to a stage”, as one of them put it, “where firms are so sure about what is required that enforcement is not needed”. But Martin Wheatley was having none of that. “No”, he said, “give them half a chance and they’ll all be at it”. The bifurcation here, we concluded, is between hierarchy and egalitarianism (top right and bottom right, respectively, in Figure 11).
-
∙ Most were fatalistic (top left in Figure 11) to some extent. “Nothing”, as one of them put it, “could have seen off the credit crunch”. But the question “Do you think that regulatory arbitrage is inevitable, regardless of what tools are deployed?” revealed a marked bifurcation, with some agreeing it was inevitable and others adamant that it was not (top left versus the other three quadrants in Figure 11).
-
∙ Our question “What do you think would happen if the markets were left to be self-regulating?” revealed some interesting disarray. “Absolute disaster!” said some. But others opined that, while it was an experiment they would prefer to avoid, they reckoned that, after some alarming upheavals, things would eventually settle down, with other (non-statutory) actors – such as “Which?”, coming in and taking on the regulatory role. So we went to talk to “Which?”. They, it turned out, did not like regulation, and so would be reluctant to step in. Regulation, they felt, inevitably distorted the market, and their aim is not to distort the market but to get it to work properly, in particular, by eliminating information asymmetries, which they see as being rife in relation to financial sector products (unlike with products like cars and television sets). So “Which?” certainly does exercise a regulatory role, but it is an individualist (bottom left in Figure 11) one: get the market to operate the way Adam Smith said it should and all will be fine!
Finally, and in the hope of pulling all this together into some sort of conclusion, I should explain that our interviews, as well as supporting our hypothesis, revealed an interesting and deep disagreement as to what the goal of regulation should be. Andy Haldane saw himself as being “in a minority, probably of one” in rejecting the orthodoxy that holds that, if you can manage to get every single firm to toe the regulatory line, a state of affairs we have dubbed “coerced herding”, all will then be fine. That approach, clearly, is the thinking behind the current regulatory frameworks. Basel II and Solvency II, for example, insist that every firm must build an “internal model” and then show that they have used it.
So there is evidently a gulf between those who see stability as a goal that can (and should) be reached (after which all will be “normal” evermore) and those, ourselves among them, who see stability as destabilising. In the latter case it is resilience, not stability that has to be the goal. To go and line up all the firms, where previously they were all over the place, Haldane explained, is to introduce a systemic risk that will proliferate throughout the totality and thereby change it into something that will behave very differently from what was there before they were all lined up. Hence the need for what is called “macro-prudential regulation”. And also, I would add, the need for a theory, arrived at by way of the “anthropological approach”, that can support and guide that kind of regulation.


 Open access