


Introduction
The extinction of animals and plants in the wild is a natural process (Raup Reference Raup1986). Under natural conditions, extinction rates are generally balanced by speciation, which maintains or increases global species diversity. However, given the exceptionally high extinction rates observed today, many researchers agree that Earth is entering a sixth mass extinction (Barnosky et al. Reference Barnosky, Matzke, Tomiya, Wogan, Swartz and Quental2011, Veron et al. Reference Veron, Clergeau and Pavoine2016). Between 1900 and 2018, the extinction rate of seed plants exceeded the natural turnover of species, and it was even higher than the rate recorded between 1753 and 1900 (Humphreys et al. Reference Humphreys, Govaerts, Ficinski, Nic Lughadha and Vorontsova2019). Major anthropogenic threats to biodiversity include habitat fragmentation and loss, overexploitation, the spread of pathogens, competition from alien species and climate change (Tilman et al. Reference Tilman, Clark, Williams, Kimmel, Polasky and Packer2017), with the latter recognized as a key driver of global biodiversity loss (Bellard et al. Reference Bellard, Bertelsmeier, Leadley, Thuiller and Courchamp2012). Shifts in environmental conditions can cause a mismatch between the ecological niche of a species and its current geographical distribution, forcing populations to migrate, adapt to the new conditions or face extinction (Davis & Shaw Reference Davis and Shaw2001). In this context, populations occurring at the edges of the range of a species may be particularly vulnerable and potentially affected by even moderate climatic shifts (Wiens Reference Wiens2016).
Many studies have investigated extinction risk in relation to climate change, predicting threats to global biodiversity (Thomas et al. Reference Thomas, Cameron, Green, Bakkenes, Beaumont and Collingham2004, Araújo et al. Reference Araújo, Thuiller and Pearson2006). Most of this research has focused on broad-scale patterns and on forecasting the potential future impacts of ongoing climatic trends. Numerous effects on wild species have been well documented (Kosanic et al. Reference Kosanic, Anderson, Harrison, Turkington and Bennie2018, Renner & Zohner Reference Renner and Zohner2018). However, the direct role of climate change in driving documented extinctions has only rarely been demonstrated empirically (Buse et al. Reference Buse, Boch, Hilgers and Griebeler2015).
Etruscan cotton lavender, Santolina etrusca (Asteraceae), provides a particularly suitable case study, given its limited dispersal ability (Angiolini Reference Angiolini2001) and the potential susceptibility of some related Santolina species to climate change (Varaldo et al. Reference Varaldo, Dagnino, Guerrina, Minuto and Casazza2021). This Italian endemic aromatic shrub historically exhibited a disjunct, bipolar distribution: a northern group of populations along the Lima and Arno rivers; and a southern group including Mount Amiata and surrounding areas, the Maremma area, the Orcia and Paglia valleys, the Tuscia and a small area near Orvieto (Siena, Grosseto, Viterbo and Terni provinces; Figure 1; Angiolini Reference Angiolini2001, Giacò et al. Reference Giacò, De Giorgi, Astuti, Varaldo, Minuto and Peruzzi2022). This species has undergone local extinctions of peripheral populations over the past century (Angiolini Reference Angiolini2001, Giacò et al. Reference Giacò, De Giorgi, Astuti, Varaldo, Minuto and Peruzzi2022) and has been assessed as Near Threatened, primarily due to presumed links of these local extinctions to human activity (Orsenigo et al. Reference Orsenigo, Montagnani, Fenu, Gargano, Peruzzi and Abeli2018). This is based on the distributional study by Angiolini (Reference Angiolini2001), who noted that most northern populations occurred on stony-pebble riverbanks, hypothesizing that this peculiar habitat type may have been lost – at least in some cases – following dam constructions. However, no evidence of human-induced habitat alteration has been provided to substantiate this assumption. Angiolini (Reference Angiolini2001) also suggested a correlation between dispersal and watercourses based on the absence of a pappus on the cypselae; yet the species typically occurs in arid, stony habitats on plains at between 100 and 1,000 m of elevation (Pignatti Reference Pignatti2018). For these reasons, we hypothesize that recent climate change may have acted as a possible driver of these local extinctions. To evaluate whether the disappearance of peripheral populations can be explained by climatic factors, we compared the climatic conditions of sites with extinct versus extant populations. Additionally, to disentangle potential contributions of human-induced habitat change, we carried out a comparative analysis of land use. Specifically, we aimed to address two questions: (1) are there significant differences in land-use patterns and present-day climatic conditions between sites currently occupied by S. etrusca and those where the species has historically gone extinct? And (2) were these climatic differences already present prior to the local extinctions?
Extinct (red) and extant (blue) populations of Santolina etrusca.

Materials and methods
Occurrence, land-cover and climate data
Historical and current distribution data for S. etrusca were gathered from herbarium specimens, the literature and field observations stored in Wikiplantbase #Italia (Peruzzi et al. Reference Peruzzi, Roma-Marzio, Pinzani and Bedini2019 onwards; see also Angiolini Reference Angiolini2001, Giacò et al. Reference Giacò, De Giorgi, Astuti, Varaldo, Minuto and Peruzzi2022). A total of 110 distribution records were retrieved and filtered to retain only one occurrence per 1 × 1 km grid cell. After filtering, 83 grid cells remained, including 15 representing extinct populations and 68 representing extant populations (Figure 1).
Land-cover data for Italy (updated to 2018) were downloaded from the Italian Institute for Environmental Protection and Research (Istituto Superiore per la Protezione e la Ricerca Ambientale; ISPRA) database (www.isprambiente.gov.it). The dataset is provided as a raster layer with 18 land-cover categories at c. 10 m2 spatial resolution (Table S1).
Mean monthly climatic time series were obtained from the CHELSAcruts database (Krager et al. Reference Karger, Conrad, Böhner, Kawohl, Kreft and Soria-Auza2017) at ∼1 km2 spatial resolution. Following Dolci and Peruzzi (Reference Dolci and Peruzzi2022), the ‘modern’ climate period corresponds to 1981–2010, whereas the ‘historical’ climate period corresponds to 1901–1930. These raw climatic time series were used to compute 35 derived climate variables describing local climate conditions (Table S2; O’Donnell & Ignizio Reference O’Donnell and Ignizio2012, Title & Bemmels Reference Title and Bemmels2018). Derived variables were calculated using the R packages dismo and envirem (Hijmans et al. Reference Hijmans, Phillips, Leathwick, Elith and Hijmans2017, Title & Bemmels Reference Title and Bemmels2018).
Data analysis
To disentangle the relative contributions of human activities and climatic factors to local extinctions of S. etrusca, we used the non-parametric Mann–Whitney U-test (α ≤ 0.01) to compare both climatic variables and land-cover categories between sites of extinct and extant populations. This test was chosen for its robustness with unequal sample sizes (MacFarland & Yates Reference MacFarland and Yates2016). For each occurrence site, geographical coordinates were used to extract climatic variable values and to calculate the percentage of each land-use class within the corresponding 1-km2 grid cell. These extracted values were then compared between extinct and extant populations. For climatic data, comparisons were first conducted using modern climate variables. To control for multiple testing, p-values were adjusted using the Benjamini–Hochberg false discovery rate correction (Benjamini & Hochberg Reference Benjamini and Hochberg1995). Variables that remained significant after correction (adjusted p ≤ 0.01) were subsequently examined using a biplot principal component analysis (PCA) to assess collinearity and to identify groups of highly correlated variables. From each correlated group, a single representative, biologically meaningful variable was retained to avoid redundancy. This reduced set of variables was then used to compare historical climatic conditions between extinct and extant populations, enabling direct temporal comparisons of the same climatic predictors.
Results
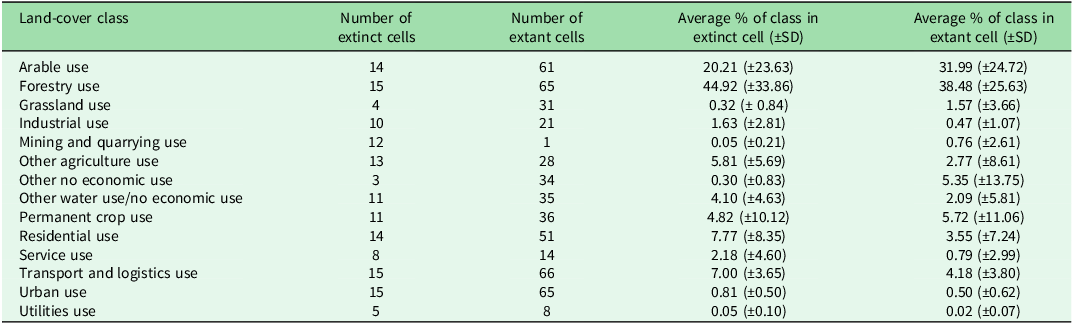
Among the 18 land-cover categories, 14 were shared by extinct and extant populations (Tables 1 & S1), whereas ‘Agroforestry Use’ was exclusive to extant sites. Of all land-cover classes, only ‘Transport and Logistic Use’ showed a significant difference between groups (p = 2.4 × 10⁻³). On average, this category occupied c. 7% (standard deviation: ±3.6) of the area of grid cells with extinct populations and 4.3% (standard deviation: ±3.8) of the area of cells with extant populations.
Comparison of land-cover categories shared between extinct and extant Santolina etrusca populations: number of cells classified as extinct or extant for each land-cover category, along with the average percentage (± standard deviation (SD)) of each class within extinct and extant populations.

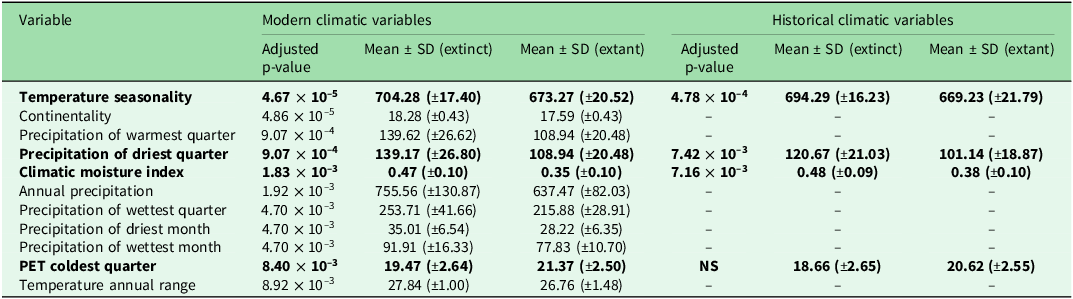
Statistically significant differences were detected for 11 out of the 35 modern climatic variables (Table 2). The PCA biplot (Figure 2) highlighted an overall difference between extant and extinct sites in terms of climatic conditions. Four distinct clusters of highly correlated variables were identified, and one representative variable from each cluster was retained for further analyses of historical climatic conditions. Three of the four retained variables showed statistically significant differences between extinct and extant sites (Figure 3 & Table 2): ‘Climatic Moisture Index’, representing a group highly correlated with ‘Annual Precipitation’, ‘Precipitation of the Wettest Month’ and ‘Precipitation of the Wettest Quarter’; ‘Precipitation of the Driest Quarter’, correlated with ‘Precipitation of the Driest Month’ and ‘Precipitation of the Warmest Quarter’; and ‘Temperature Seasonality’, correlated with ‘Continentality’ and ‘Temperature Annual Range’.
List of modern climatic indices showing statistically significant differences between sites with extinct and extant populations of Santolina etrusca, detected through Mann–Whitney U-tests with Benjamini–Hochberg adjusted p-values ≤ 0.01. Variables retained after the principal component analysis are shown in bold.

NS = non-significant; PET = potential evapotranspiration; SD = standard deviation.
Biplot of the principal component analysis (PCA) of modern climatic conditions at sites with extant (blue) and extinct (red) populations of Santolina etrusca. Points represent the sites. The 95% confidence ellipses depict the climatic niche occupied by each group. BIO4 = Temperature Seasonality; BIO7 = Temperature Annual Range; BIO12 = Annual Precipitation; BIO13 = Precipitation of Wettest Month; BIO14 = Precipitation of Driest Month; BIO16 = Precipitation of Wettest Quarter; BIO17 = Precipitation of Driest Quarter; BIO18 = Precipitation of Warmest Quarter; VAR3 = Climatic Moisture Index; VAR4 = Continentality; VAR11 = Potential Evapotranspiration Coldest Quarter.

Violin plots illustrating the comparison of historical (1901–1930) and modern (1980–2010) climatic variables at sites of Santolina etrusca occurrence. Climatic values from extinct sites are in red, whereas climate values from extant sites are in blue. PET = potential evapotranspiration.

Discussion
A direct anthropogenic impact can seemingly be excluded as the primary cause of local extinctions of S. etrusca, given the absence of substantial differences in present-day land use between extinct and extant sites of S. etrusca (Table 2). However, a limitation of this analysis lies in the spatial grain (c. 1 × 1 km), which may not capture localized, fine-scale habitat alterations. Thus, we cannot rule out that such fine-scale habitat modifications, untested in our study, may represent additional potential drivers – or accelerators – of local extinction. Another limitation of our study is that only present-day land-use data were available; therefore, we cannot rule out past anthropogenic drivers.
Despite this, our results clearly indicate significant climatic differences between extinct and extant sites, although our data could have benefitted from spatially aware cross-validation (Roberts et al. Reference Roberts, Bahn, Ciuti, Boyce, Elith and Guillera-Arroita2017). Overall, areas where extinct populations once occurred exhibit a less characteristically Mediterranean climate. Temperature Seasonality, along with the highly correlated variables Continentality and Annual Temperature Range, show higher values in these sites (Figure 2 & Table 2), indicating greater temperature fluctuations within a given locality (Oliver Reference Oliver2008, O’Donnell & Ignizio Reference O’Donnell and Ignizio2012). The Climate Moisture Index, reflecting the balance between annual precipitation and potential evapotranspiration (Oliver Reference Oliver2008, Title & Bemmels Reference Title and Bemmels2018), is also higher, pointing to overall wetter conditions. Similarly, potential evapotranspiration during the coldest quarter is lower, again indicating greater moisture availability at extinct sites.
Several studies have highlighted temperature seasonality as a key indicator of climate change (Thomson Reference Thomson1995, Braganza et al. Reference Braganza, Karoly, Hirst, Mann, Stott, Stouffer and Tett2003, Qian et al. Reference Qian, Fu and Wu2011, Feng et al. Reference Feng, Qian and Materia2022) and have emphasized its influence on biological processes (Gremer et al. Reference Gremer, Andrews, Norris, Thomas, Munson, Duniway and Bradford2018, Qian et al. Reference Qian, Zhang, Ricklefs and Wang2022). Perennial species with Mediterranean affinities are generally expected to remain stable, or even expand, under climate change (Lavergne et al. Reference Lavergne, Molina and Debussche2006). This pattern appears consistent with the persistence of S. etrusca in its core Mediterranean range but not at the periphery, where sites exhibit less Mediterranean and more continental climatic characteristics.
These findings support the inference of a relationship between the range contraction of S. etrusca and climate change. Nevertheless, some variability exists among extinct sites. For example, the southernmost site in Lazio (Monterotondo) shares more climatic similarities with extant sites, suggesting that extinction there was probably driven by factors other than climate.
Importantly, most of the climatic differences between extinct and extant sites were already present during the period 1901–1930 (Figure 3 & Table 2), namely before the documented extinctions of S. etrusca, and they may have contributed to triggering these events.
This case study suggests that climate change may have already affected Mediterranean flora over the last century, possibly driving the loss of populations at the margins of species’ ranges. Unfortunately, it is plausible that S. etrusca, along with other Mediterranean species with similar ecological traits, will experience further local extinctions under ongoing climatic shifts. Future projections predict a continued increase in temperature seasonality across the Mediterranean region (Feng et al. Reference Feng, Qian and Materia2022), driven by the so-called Mediterranean amplification (Brogli et al. Reference Brogli, Sørland, Kröner and Schär2019), a phenomenon in which summer warming exceeds that of most other regions worldwide (Qian & Zhang 2015) and surpasses the average warming of the Northern Hemisphere (Lionello & Scarascia Reference Lionello and Scarascia2018). Moreover, the most recent Intergovernmental Panel on Climate Change (IPCC) report (Pörtner et al. Reference Pörtner, Roberts, Tignor, Poloczanska, Mintenbeck and Alegría2022, Tollefson Reference Tollefson2022) emphasized that climate change is advancing more rapidly than previously projected and is increasingly emerging as a global challenge.
Conclusions
The lack of substantial differences in current land uses between sites of local extinction and those where S. etrusca still occurs seemingly rules out direct anthropogenic impact as the primary cause of its disappearance. By contrast, the significant climatic differences observed between extinct and extant sites indicate that climate change is associated with the local extinctions of peripheral populations. The persistence of these same climatic differences since the early twentieth century suggests that, at the time when they were first recorded, the now-extinct populations of S. etrusca were already experiencing suboptimal climatic conditions.
Supplementary material
To view supplementary material for this article, please visit https://doi.org/10.1017/S0376892926100332.
Availability of data and materials
Data available on request from the authors.
Acknowledgements
None.
Author contributions
LP conceived the idea and designed the research. PDG and AG curated the distribution data. DD and PDG performed all of the analyses and prepared the figures and tables. DD, PDG and AG drafted the first version of the manuscript. LP and AC contributed to successive versions of the manuscript.
Financial support
This work was supported by the Progetto di Ricerca di Rilevante Interesse Nazionale (PRIN; grant number 2017JW4HZK) and by the Italian Ministry of Universities and Research under the Department of Excellence 2023–2027 initiative. The project was funded under the National Recovery and Resilience Plan (NRRP), Mission 4 Component 2 Investment 1.4 – Call for tender No. 3138 of 16 December 2021, rectified by Decree n.3175 of 18 December 2021 of Italian Ministry of University and Research funded by the European Union – NextGenerationEU; Award Number: Project code CN_00000033, Concession Decree No. 1034 of 17 June 2022 adopted by the Italian Ministry of University and Research, CUP J33C22001190001, Project title ‘National Biodiversity Future Center NBFC’.
Competing interests
The authors declare none.
Ethical standards
Not applicable.


 Open access