


1. INTRODUCTION
The fact that Karakoram glaciers had a balanced mass budget during recent decades has attracted a lot of attention from the scientific community, as this behaviour is at odds with the evolution of the vast majority of glaciers elsewhere on Earth (Vaughan and Comiso, Reference Vaughan and Comiso2013). Hewitt (Reference Hewitt2005, Reference Hewitt2011) was the first to detect and discuss this peculiarity and defined the ‘Karakoram anomaly’. His field observations were supported by subsequent remote-sensing measurements that suggested little length and area changes (e.g., Scherler and others, Reference Scherler, Bookhagen and Strecker2011; Bhambri and others, Reference Bhambri2013; Rankl and others, Reference Rankl, Kienholz and Braun2014; Minora and others, Reference Minora2016), no clear regional signal of velocity change or a slight acceleration (Quincey and others, Reference Quincey2009; Heid and Kääb, Reference Heid and Kääb2012; Dehecq and others, Reference Dehecq2019) and no marked evolution in the supraglacial debris-covered area (Herreid and others, Reference Herreid2015). However, interpretation of local field observations, and of remote-sensing measurements of length, areas and velocity changes are complicated by the highly complex dynamic behaviour of Karakoram glaciers, including many surge-type glaciers (e.g., Copland and others, Reference Copland2011; Sevestre and Benn, Reference Sevestre and Benn2015; Bhambri and others, Reference Bhambri, Hewitt, Kawishwar and Pratap2017).
The regional stability of Karakoram glacier mass between 2000 and 2008 was demonstrated using DEMs differencing (Gardelle and others, Reference Gardelle, Berthier and Arnaud2012) and further confirmed for the period 2003–08 using ICESat laser altimetry (Kääb and others, Reference Kääb, Berthier, Nuth, Gardelle and Arnaud2012; Gardner and others, Reference Gardner2013) and for 2000–12 using DEM derived from SAR interferometry (Rankl and Braun, Reference Rankl and Braun2016). Two subsequent studies using ICESat (Kääb and others, Reference Kääb, Treichler, Nuth and Berthier2015) and Advanced Spaceborne Thermal Emission and Reflection Radiometer (ASTER) DEMs from 2000 to 2016 (Brun and others, Reference Brun, Berthier, Wagnon, Kääb and Treichler2017) found that the Karakoram mountain range lies at the western edge of a wider mass-balance anomaly centred on the West Kunlun, the western part of the Tibetan Plateau. DEM differencing studies indicated that the Karakoram mass stability has existed since at least the 1970s (Bolch and others, Reference Bolch, Pieczonka, Mukherjee and Shea2017; Zhou and others, Reference Zhou, Li and Li2017).
Most of these earlier mass-balance assessments considered Karakoram glaciers as a whole and little attention has been drawn to the mass-balance heterogeneity within the mountain range. A notable exception is a recent work that compared multiple Tandem-X DEMs acquired in 2013 and 2014 to the shuttle radar topographic mission (SRTM) DEM of February 2000 and found that the central Karakoram was more stable than the fringing regions to the west and east (Lin and others, Reference Lin, Li, Cuo, Hooper and Ye2017). One challenge for these authors (as for others studies using the SRTM and Tandem-X DEMs) was the difficulty to account properly for penetration of the radar signal into snow and ice affecting DEMs derived from radar imagery acquired in different wavelengths (X-Band for Tandem-X, C-Band for the SRTM) and during different seasons (Dehecq and others, Reference Dehecq, Millan, Berthier, Gourmelen and Trouve2016; Lambrecht and others, Reference Lambrecht, Mayer, Wendt, Floricioiu and Völksen2018). There is also a need to assess whether the mass-balance anomaly has been ongoing during recent years.
The first goal of the present study is thus to calculate the volume and mass change of glaciers in the Central and Eastern Karakoram (a study area including 12 000 km2 of glaciers) from 2008 to 2016 and examine the broad regional patterns and the mass balances of individual glaciers.
While analyzing the regional pattern of elevation changes, we discovered a region of anomalously high thinning in the ablation zone of Siachen Glacier, the largest glacier in our study area. This led us to perform a temporally comprehensive analysis of the elevation changes at this location in relation to a large rock avalanche that occurred in September 2010. The second goal of our study is thus to assess the impact of this thick layer of debris on the Siachen glacier-wide mass balance, a topic addressed quantitatively by a limited number of studies only (e.g., Jiskoot, Reference Jiskoot2011).
2. DATA
To avoid possible elevation bias due to radar penetration into snow and firn, our measurements of elevation changes are based solely on satellite optical stereo-imagery acquired by the SPOT5-HRS, SPOT6, SPOT7 and ASTER sensors. The SRTM DEM of February 2000 (Farr and others, Reference Farr2007) is used as our reference DEM offglacier for coregistration but is not used for measuring glacier elevation changes. The coverage of our study area with the different stereo pairs is depicted in Figure 1 and the list of images used to estimate the regional volume change is provided in the supplement (Supplementary Table S1). The images used to study in detail the spatio-temporal evolution of elevation, velocity and morphology of the ablation zone of Siachen Glacier after the 2010 rock avalanche are listed in Supplementary Table S2.
Study area and its coverage with satellite stereo pairs. The footprints and the dates (YYYYMMDD) of the different images are shown for the first (upper panel, t1) and second period (lower panel, t2), in grey SPOT5-HRS, in yellow, ASTER and in red SPOT6/7. In blue, the Randolph glacier inventory v6.0. The inset locates the glaciers (blue) of our study area (black rectangle) at the boundary between the Tarim and Indus basins. Major rivers are in blue and drainage basins are outline in grey.

Our 2008–10 topography of Central and Eastern Karakoram is mainly made of two SPOT5-HRS DEMs of 2008 and 2010, and ASTER DEMs are derived from images acquired in 2008, 2009 and 2010. This time frame is hereafter referred to as t1. Our 2014–16 (t2) topography of the study region consists of five DEMs calculated from SPOT6 and SPOT7 stereo pairs acquired in 2015 and 2016, and a single ASTER stereo pair from September 2014.
We use two 40 m DEMs derived from SPOT5-HRS imagery acquired in December 2008 and October 2010 through the SPIRIT project (Korona and others, Reference Korona, Berthier, Bernard, Remy and Thouvenot2009). These DEMs were previously compared to the SRTM DEM in Gardelle and others (Reference Gardelle, Berthier and Arnaud2012, Reference Gardelle, Berthier, Arnaud and Kääb2013). To date, the SPOT6 and SPOT7 twin satellites (SPOT6/7 hereafter) have only been used in a few glaciological studies (Ragettli and others, Reference Ragettli, Bolch and Pellicciotti2016; Kääb and others, Reference Kääb2018; Zhou and others, Reference Zhou, Hu, Li, Li, Zhao and Ding2019). Despite their commercial nature, implying limited or costly access, these satellites have a strong scientific potential as they combine a high agility for stereo and tri-stereo acquisition, fine ground sampling distance (1.5 m) with a wide swath (60 km). SPOT6/7 DEMs are generated using the open-source Ames Stereo Pipeline (ASP, Shean and others, Reference Shean2016), following Lacroix (Reference Lacroix2016). ASTER level 1A (AST_L1A) 15 m stereo-images are selected to fill some data gaps in the SPOT5-6-7 coverage. ASTER DEMs are also derived using ASP from 3N (nadir) and 3B (backward) images using the same processing parameters as in Brun and others (Reference Brun, Berthier, Wagnon, Kääb and Treichler2017).
To study the September 2010 rock avalanche and its influence on Siachen Glacier, we use 11 ASTER, one SPOT5-HRS and one SPOT6 stereo pairs. Nine of these stereo pairs are used to study the elevation changes and eight of them (all from ASTER) are used to map the velocity field during intervals of ~1 year.
3. METHODS
3.1. Determination of glacier-wide and region-wide mass balances
Three-dimensional (3-D) coregistration is a mandatory step to obtain accurate elevation change measurements through DEM differencing (e.g., Nuth and Kääb, Reference Nuth and Kääb2011). Horizontal and vertical offsets of individual DEMs are corrected using the SRTM DEM as a unique offglacier reference. Offsets are determined on stable terrain by minimizing the standard deviation (SD) of the elevation difference (Berthier and others, Reference Berthier2007), masking out glacierized areas using the Randolph Glacier Inventory (RGI) v6.0 (Pfeffer and others, Reference Pfeffer2014; Mölg and others, Reference Mölg, Bolch, Rastner, Strozzi and Paul2018). The 3-D-coregistered DEMs are mosaicked for each time frame (t1 and t2) using the following two priority orders. First, SPOT6/7 and SPOT5-HRS DEMs are preferred to ASTER DEMs as they are more precise. Second, the DEMs acquired closest in time to the end of the ablation season (i.e. October in our study area) are favoured to limit the influence of seasonal snow/melt on the elevation difference. In the resulting mosaics, the mean day-of-year is 8 November for t1 and 27 October for t2, indicating little seasonal offset between t1 and t2. The percentage of glacier area covered with valid data is higher for t2 (SPOT6/7 78%, ASTER 3%, data gaps 19%) than for t1 (SPOT5-HRS 47%, ASTER 23%, data gaps 30%). The rate of elevation differences (dh/dt) is then obtained by subtracting the two DEM mosaics and dividing by the spatially varying time interval between t1 and t2.
The glacier inventory (RGI v6.0) is mainly based on imagery from around the year 2000 (Mölg and others, Reference Mölg, Bolch, Rastner, Strozzi and Paul2018). Using our dh/dt map, we update the inventory to take into account the clear advances of several surging glaciers. This is achieved by overlying the initial RGI glacier outlines on the dh/dt map and updating the outlines manually in regions where spatially consistent high positive dh/dt values occurred. The set of recent (t2) orthoimages is also used to verify, and sometimes further improve, the updated outlines. The entire DEM 3-D-coregistration and mosaicking process is then repeated. This iterative process was applied because our initial mask of stable areas (from the year 2000) included some areas of very large elevation changes that could slightly bias the DEM adjustment.
To extract dh/dt with altitude and compute the mass balances of individual glaciers, we exclude dh/dt data lying outside of ± 3 normalized median absolute deviations (NMAD) about the median elevation difference (dh) in each 50 m altitude interval for each glacier (Brun and others, Reference Brun, Berthier, Wagnon, Kääb and Treichler2017). We also exclude pixels where the surface slope, calculated from the SRTM DEM, is larger than 45° because errors in DEMs increase rapidly with slope (Toutin, Reference Toutin2002; Lacroix, Reference Lacroix2016). The total volume change rate is calculated as the integral of the mean dh/dt in each 50 m band over the total area altitude distribution, an efficient method to fill in data voids (named local mean hypsometric method in McNabb and others (Reference McNabb, Nuth, Kääb and Girod2019)). The mass balances are then derived using a volume-to-mass conversion factor of 850 kg m−3 (Huss, Reference Huss2013).
Systematic and random errors for dh/dt are estimated on the nonglacierized, assumed stable, terrain. The map of residual elevation differences offglacier and the histogram of their distribution are shown in the supplement (Supplementary Figure S1 and S2). Following Rolstad and others (Reference Rolstad, Haug and Denby2009) and Fischer and others (Reference Fischer, Huss and Hoelzle2015), for a glacier with an area (A), the random component of the error (σ bΔz) is quantified using:
 $$\sigma _{\Delta z} = \left\{ \matrix{\sigma_{\Delta h}\,\sqrt {\displaystyle{{A_{{\rm cor}}} \over {5A}}}, A \gt A_{{\rm cor}} \hfill \cr \sigma_{\Delta h},\,A \le A_{{\rm cor}} \hfill} \right\}$$
where A cor = πL2, L being the decorrelation length, taken here as 500 m as in Brun and others (Reference Brun, Berthier, Wagnon, Kääb and Treichler2017) and σ Δh (1.12 m a−1) is the NMAD of dh over the stable terrain divided by the mean time separation between the DEMs.
The systematic error on dh/dt is estimated using the remaining vertical offsets between the DEMs following their coregistration to the SRTM DEM, a strategy known as the triangulation method (Nuth and Kääb, Reference Nuth and Kääb2011; Paul and others, Reference Paul2015). Practically, the systematic error is computed on the overlapping parts of five DEM pairs acquired a few weeks apart (Table 1) by adding in quadrature (i) the average of the absolute median dh off-glacier, 0.30 m (SD = 0.15 m, n = 5) which quantifies our ability to coregister the DEMs off-glacier and (ii) the average of the absolute difference between the median dh on and off-glacier, 0.44 m (SD = 0.35 m, n = 5). To our knowledge, this second component of the systematic error has not been used in earlier error assessments. It is included here to quantify the fact that the vertical offset off-glacier, used to adjust the DEMs, may not exactly reflect their vertical offset on glaciers. Our systematic error equals 0.56 m (or 0.09 m a−1 after dividing by the mean time separation between t1 and t2) and does not depend on the area of averaging. We note that a similar systematic error (0.50 m) could have been obtained more directly by calculating the average of the absolute median dh on glacier.
Statistics (median noted ‘med’ and NMAD) for the elevation difference (dh, in m) over the overlapping parts of DEMs acquired about a month apart

As no information is available on the amount of ablation or accumulation during this relatively short-time interval, real glacier elevation changes are assumed negligible. Note also that all these DEMs are previously 3-D-coregistered to the SRTM DEM such that the table illustrates the magnitude of the remaining vertical offsets on- and off-glaciers. All values are in metres. Format for the dates of the acquisition is YYYYMMDD (n/s indicate northern/southern scene of the ASTER segment encompassing two images). Note the two to three times smaller NMAD_dh for SPOT6/7 DEMs than for ASTER DEMs.
For data gaps in the dh/dt map, we conservatively multiply these uncertainties by a factor of five (Berthier and others, Reference Berthier2014). A ± 60 kg m−3 uncertainty is used for the volume-to-mass conversion factor (Huss, Reference Huss2013).
3.2. Observation of elevation and velocity changes related to the Siachen rock avalanche
ASP is used to generate additional ASTER DEMs covering the area (off and on glacier) affected by the Siachen rock avalanche from 2009 to 2016. The 3-D-coregistration of all DEMs (ASTER, SPOT5-HRS and SPOT6/7) to the SRTM DEM is performed on the stable terrain around the tongue of Siachen Glacier.
We derived surface velocity maps of the ablation zone of Siachen Glacier by applying cross-correlation to eight ASTER orthoimages using the Cosi-Corr package (Leprince and others, Reference Leprince, Barbot, Ayoub and Avouac2007; Scherler and others, Reference Scherler, Leprince and Strecker2008). The velocity of moving surface features is measured with an uncertainty typically lower than the image pixel size, so better than 15 m a−1 in our case, given the time separation of ~1 year for our orthoimage pairs.
4. RESULTS
4.1. Pattern of glacier elevation changes
As already revealed by earlier studies applying DEM differencing in the Karakoram (e.g., Gardelle and others, Reference Gardelle, Berthier, Arnaud and Kääb2013; Rankl and Braun, Reference Rankl and Braun2016), the pattern of elevation changes is highly complex with the well-known co-existence of strong thinning and thickening rates for some glaciers, a signature of either active glacier surging or of glacier recovery after a surge (Fig. 2). Our map includes some recently studied surging glaciers such as Hispar (Paul and others, Reference Paul, Strozzi, Schellenberger and Kääb2017; Rashid and others, Reference Rashid, Abdullah, Glasser, Naz and Romshoo2018), Kyagar (Round and others, Reference Round, Leinss, Huss, Haemmig and Hajnsek2017) and Khurdopin (Steiner and others, Reference Steiner, Kraaijenbrink, Jiduc and Immerzeel2018).
Map of the rate of elevation change (dh/dt) between 2008–10 and 2014–16. The yellow circle highlights an area of very strong thinning on Hispar Glacier, whereas the dark blue circle surround a glacier tongue south of Rimo Glacier exhibiting the maximum thickening rate (28.3 m a−1). The black box locates the region of anomalous thinning on Siachen Glacier, which is further examined in Figure 5 and in Section 4.3.
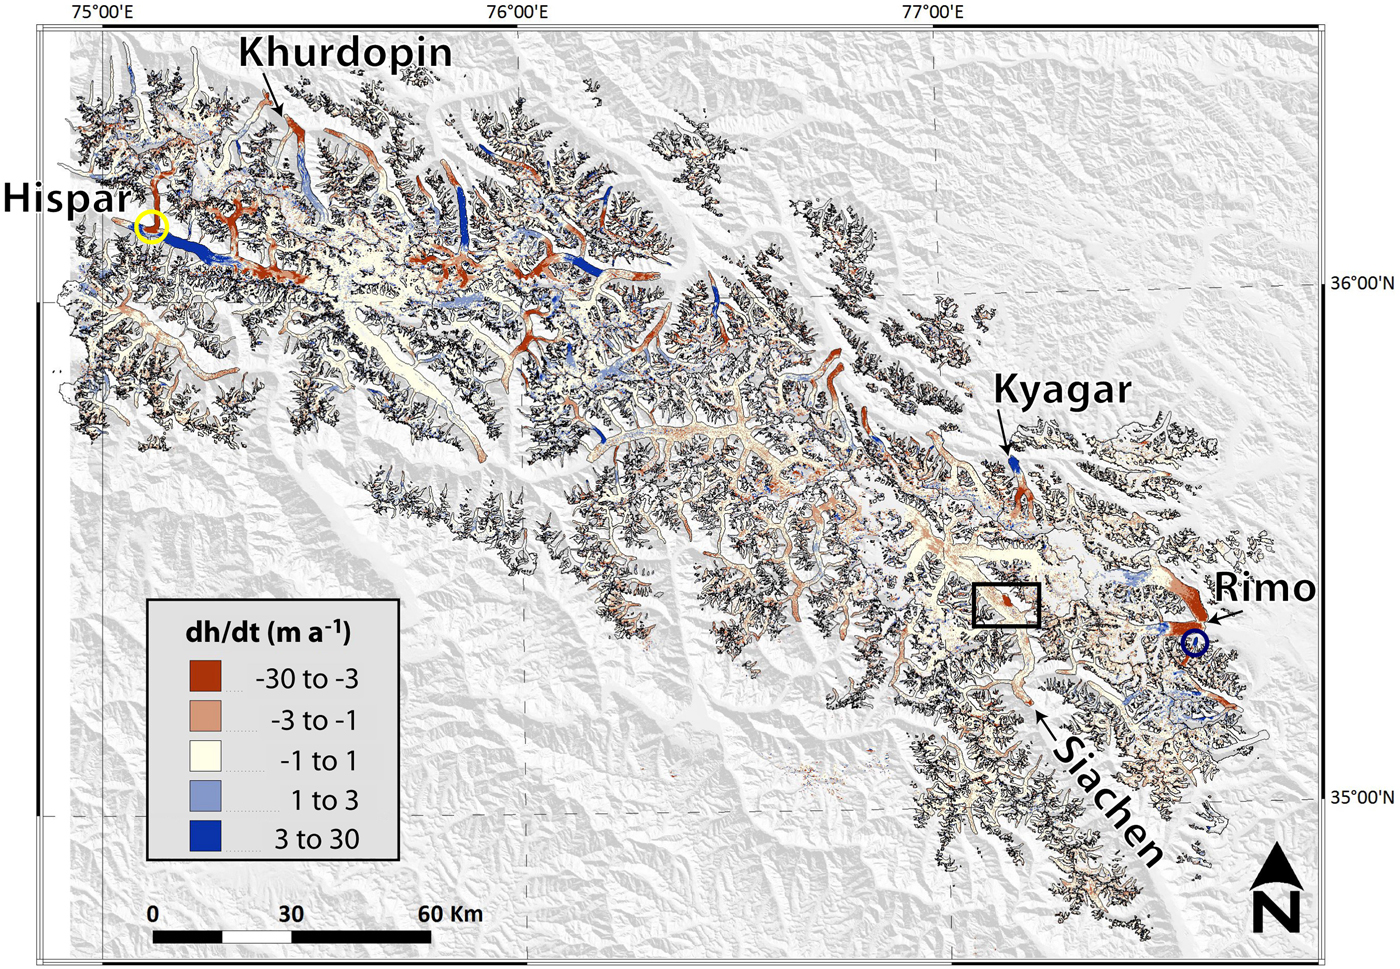
The greatest thickening rate (28.3 m a−1 between 2010 and 2016) is measured close to the glacier front of a glacier south of Rimo Glacier (RGI50-14.07738). This 6-year averaged value is equivalent to a total thickening of 170 m. Inspection of Google Earth imagery suggests that the surge active phase mainly developed between 2011 and 2014, implying that even larger thickening rates occurred during this 3-year period.
The maximum lowering rate (−28 m a−1, black box in Fig. 2) is not observed on a surge-type glacier but in the ablation area of Siachen Glacier, the largest glacier in our study area. This intriguing feature will be analyzed in more detail in Section 4.3. Otherwise, the maximum lowering rate (−13 m a−1, between 2008 and 2015) is recorded on the lower reaches of Kunyang Glacier, a tributary of Hispar Glacier. This glacier surged between 2006 and 2009 (Paul and others, Reference Paul, Strozzi, Schellenberger and Kääb2017) and was mainly quiescent during our study period. Its rapid thinning thus results from the high ablation rate of a stagnant glacier tongue at relatively low elevation.
4.2. Pattern of individual glacier-wide mass balance
Due to data gaps and errors in our dh/dt map, the mass balance cannot be measured satisfactorily for all glaciers. We restrict our mass-balance analysis to glaciers for which the percentage of coverage with valid dh/dt data is larger than 50% and the mass-balance error lower than 0.5 m w.e. a−1. Over our study area of ~12 000 km2 (3719 glaciers, mean area of 3.2 km2), only 402 glaciers meet these criteria. Their mean area is 23.7 km2 (range of glacier size: 0.9–1078 km2). These 402 glaciers cover in total 9521 km2, a large fraction (79%) of our study area. Our mass-balance sample is thus strongly biased toward large glaciers.
For these 402 glaciers, the mean mass balance is −0.06 ± 0.15 m w.e. a−1 (SD = 0.44 m w.e. a−1). The area-weighted average mass balance is more negative (−0.14 ± 0.15 m w.e. a−1), in part due to the strongly negative mass balance of Siachen Glacier (−0.39 ± 0.11 m w.e. a−1), the largest glacier in our sample. The average error for individual glacier mass balance is 0.33 m w.e. a−1 (range: 0.09–0.49 m w.e. a−1). The error for the average mass balance of these 402 glaciers is more difficult to estimate. An estimate of the error (± 0.15 m w.e. a−1) is obtained using the average of the individual mass-balance errors, weighted according to the area of each glacier.
We examined several factors which could explain the individual glacier mass-balance variability but did not find statistically different mass balances when glaciers are categorized by glacier size, hypsometry (using the hypsometric index of Jiskoot and others (Reference Jiskoot, Curran, Tessler and Shenton2009)) or their dynamical nature (surge-type or nonsurge-type). For example, the mass balance of glaciers classified by Sevestre and Benn (Reference Sevestre and Benn2015) as surge-type (−0.09 ± 0.12 m w.e. a−1) is almost identical to the mass balance of nonsurge-type glaciers (−0.05 ± 0.19 m w.e. a−1). This lack of difference between surge-type and nonsurge-type glaciers is consistent with an earlier similar analysis (Gardelle and others, Reference Gardelle, Berthier and Arnaud2012). We note however that the inventory used here for distinguishing surging glaciers (Sevestre and Benn, Reference Sevestre and Benn2015) is not exhaustive (Bhambri and others, Reference Bhambri, Hewitt, Kawishwar and Pratap2017; Dehecq and others, Reference Dehecq2019).
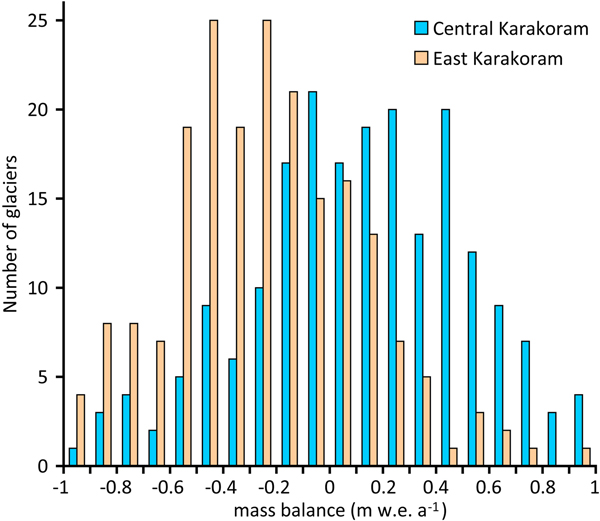
A noteworthy feature of the map of individual glacier mass balance (Fig. 3) is the contrast between the eastern and western part of our study domain. We propose a separation of these 402 glaciers into two similar samples (in terms of a number of glaciers and total area) based on their longitude (given by the parameter CenLon in the RGI attributes) relative to 76.2°E (Fig. 4). The area-weighted mass budget is slightly positive or balanced in the western part of our study domain, corresponding to the Central Karakoram (average mass balance of 0.12 ± 0.14 m w.e. a−1, area = 4287 km2, N = 202) and clearly negative in the eastern part (average mass balance of −0.24 ± 0.12 m w.e. a−1, area = 5234 km2, N = 200). These average mass balances for Central and Eastern Karakoram are statistically different at the 95% confidence level (two-sample t-test, p = 0.05).
Individual glacier-wide mass balances between 2008–10 and 2014–16. We show the mass balance of the 402 glaciers covered by more than 50% of valid data and with a mass-balance uncertainty below 0.5 m w.e. a−1. The solid black line separates the Central and Eastern Karakoram based on the location of the glacier centroid relative to a longitude of 76.2°E.
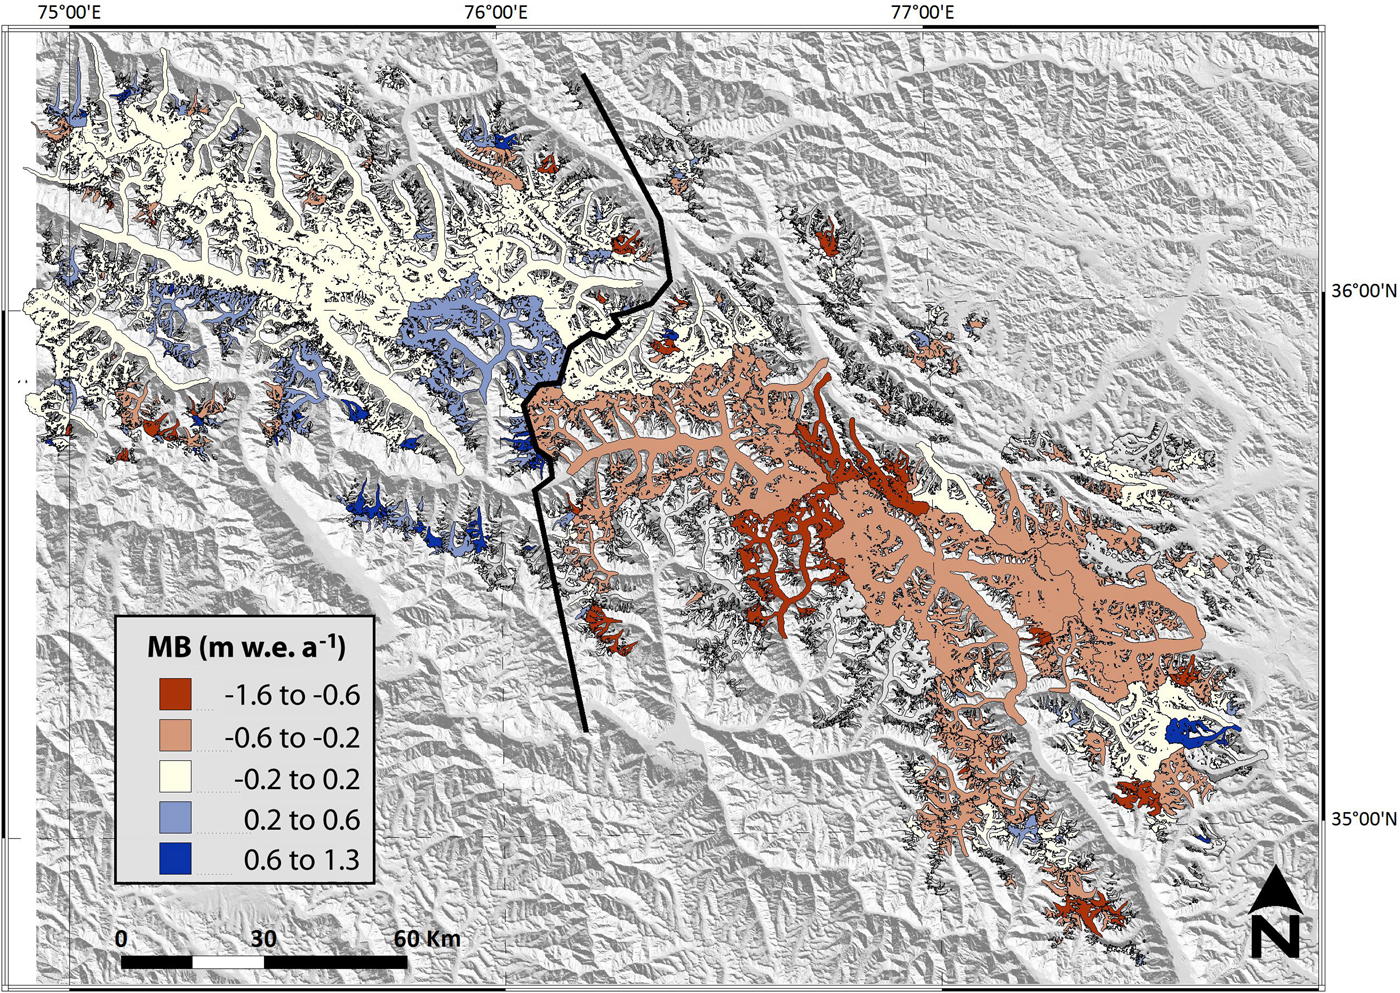
Distribution of the glacier-wide mass balances in Central (n = 202, in blue) and Eastern (n = 200, in salmon) Karakoram.

4.3. Anomalous elevation changes on Siachen Glacier
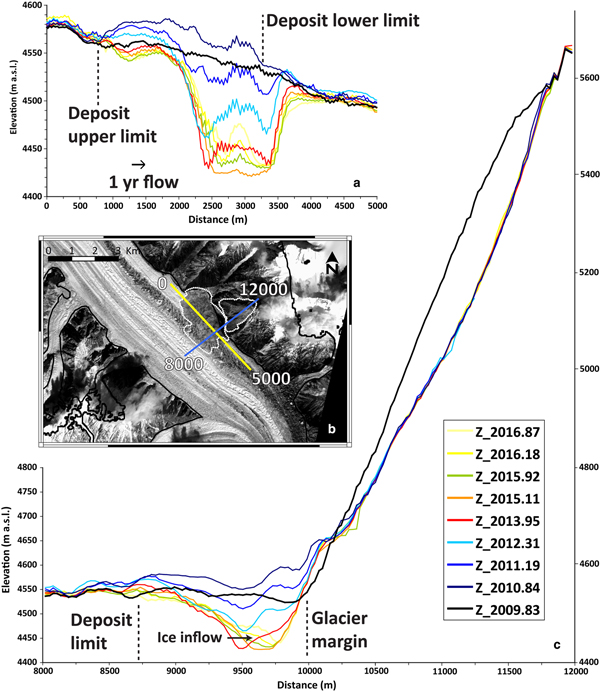
A striking feature of our dh/dt map (Fig. 2) is the very strong thinning for a small portion of the ablation area of Siachen Glacier ~4600 m a.s.l. between 2010 and 2016. To further describe this feature, we construct a time series of 3-D-coregistered DEMs acquired between 2009 and 2016. Figure 5 shows the total elevation changes (not converted to annual rates) from 2009 to 2010, 2010–13 and 2013–16. These three maps of elevation difference are obtained by subtracting DEMs derived from autumn images only, in order to minimize seasonal effects (Supplementary Table S2). Transverse and longitudinal elevation profiles are also extracted from SPOT5-HRS, SPOT6/7 and ASTER DEMs for multiple dates between 2009 and 2016, including some winter imagery to improve the temporal coverage (Fig. 6). Orthoimages are shown to analyze the surface signature of these elevation changes (Fig. 7) and a 3-D perspective view is derived from the 15 November 2016 SPOT6/7 imagery (Fig. 8).
Elevation changes over the ablation area of Siachen Glacier caused by the September 2010 rock avalanche. Elevation changes are mapped (a) from 31 October 2009 to 31 October 2010, (b) from 31 October 2010 to 13 December 2013 and (c) from 13 December 2013 to 15 November 2016. The source and deposit areas are shown using a black dotted line. The black dashed line in panel (a) indicates the area on the glacier right bank used to measure ‘background’ glacier elevation change in order to isolate volume changes driven by the rock avalanche (Table 2). The Siachen Glacier outline from RGI v6.0 is shown in black.

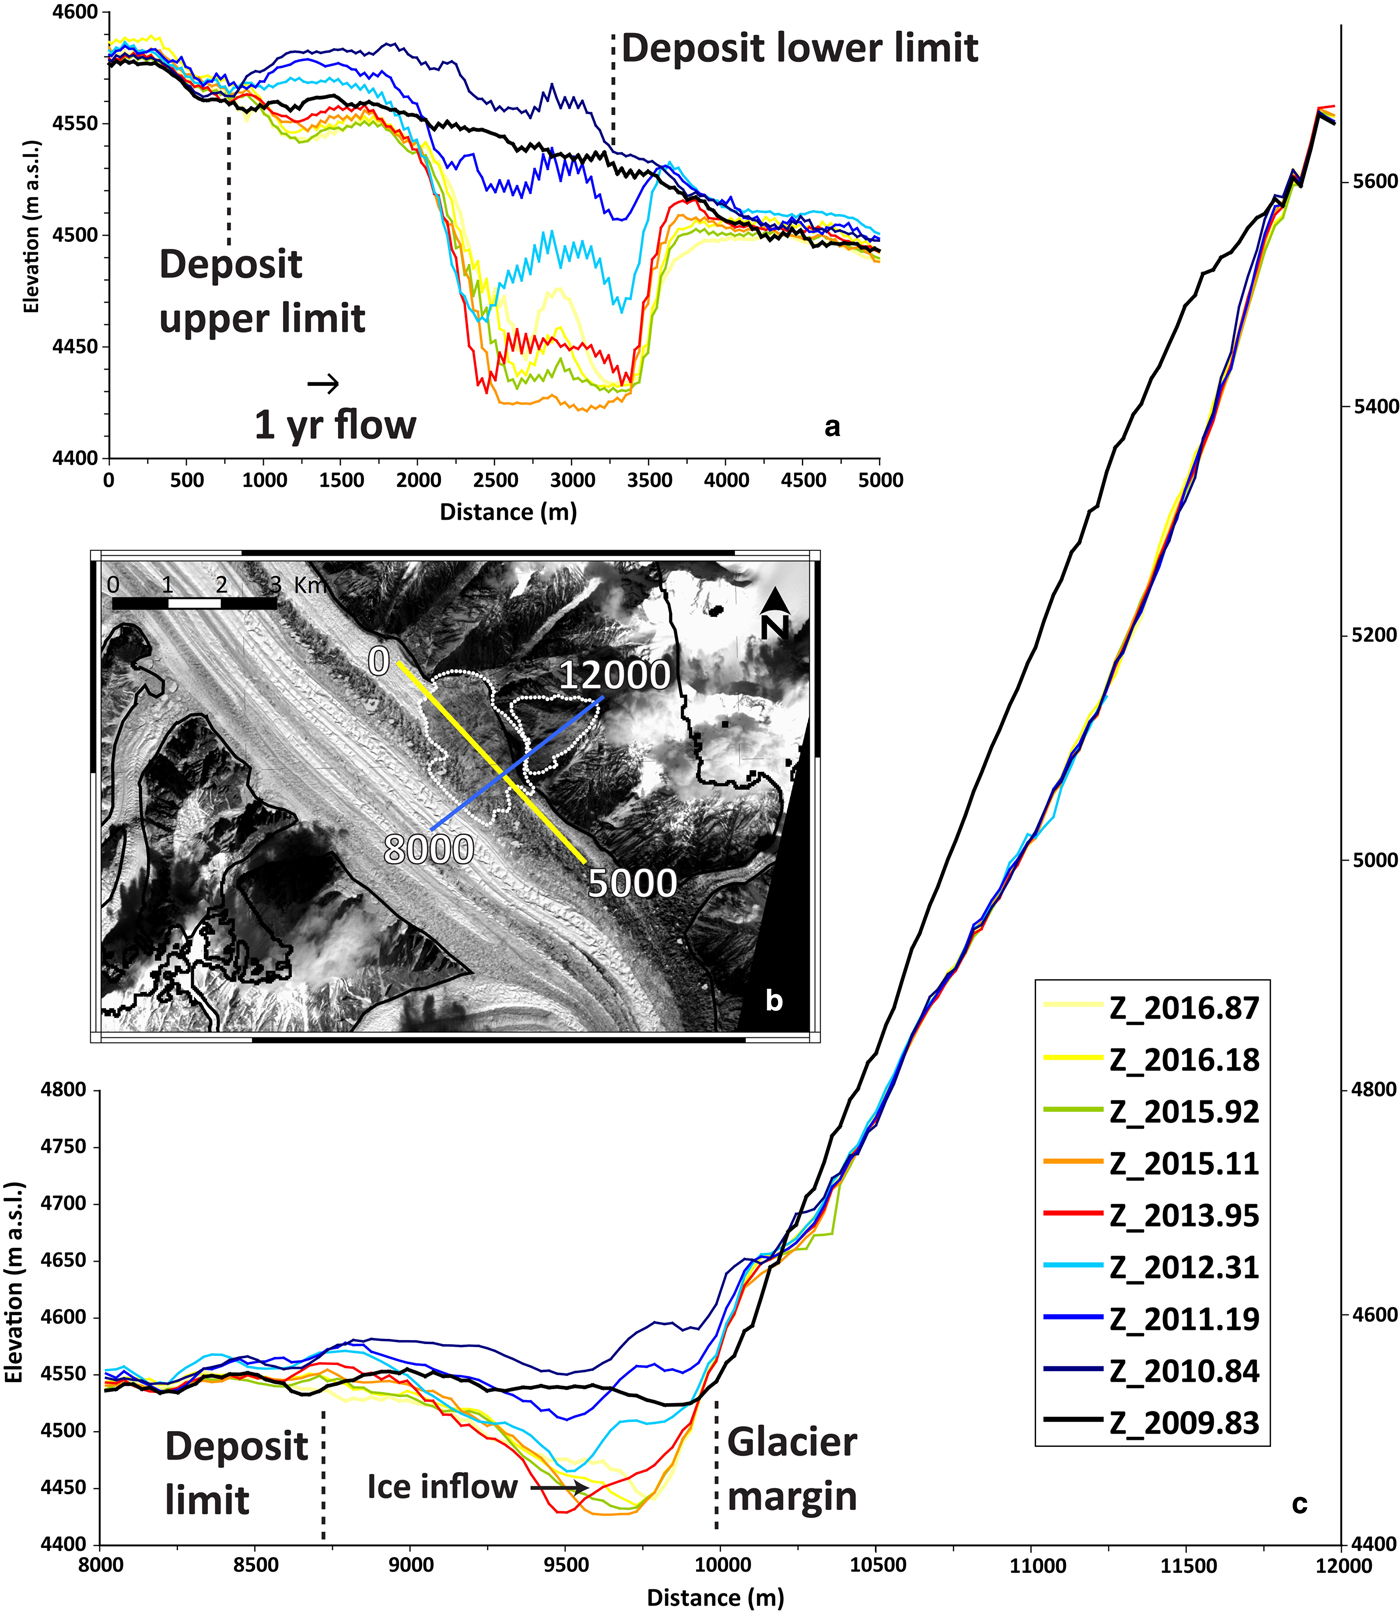
Longitudinal and transverse elevation profiles over the areas affected by the September 2010 rock avalanche. (a) Surface elevations between 2009 and 2016 for a 5 km profile along the glacier flow direction. (b) SPOT5-HRS satellite image acquired 31 October 2010, ~50 days after the rock avalanche (Copyright CNES 2010, Distribution Airbus Defence and Space). The source and deposit area are shown using a white dotted line. The continuous black line is the Siachen Glacier outline from RGI v6.0. (c) Surface elevations between 2009 and 2016 along a 4 km profile (X-axis arbitrarily starting at 8000 m) perpendicular to the glacier flow direction, including the steep source area of the rock avalanche. Note that the vertical and horizontal axes are different for panels (a) and (c). Dates of the elevation profiles are given as decimal years.
Time series of orthoimages over the ablation area of Siachen Glacier showing the surface changes induced by the September 2010 large rock avalanche. Format for the dates of the acquisition is YYYYMMDD. All images are from ASTER, except the ones acquired on 31 October 2010 (SPOT5-HRS) and 15 November 2016 (SPOT6). The white polygon on the 31 October 2009 image shows the source area of the avalanche. The −100 m elevation change contour is overlaid in yellow on the 15 November 2016 image to mark the extent of the large depression. The lower right panel is a close up view of the blue box in the 15 November 2016 image.

Perspective view of the Siachen rock deposit and depression in 15 November 2016. The 3-D-view was generated using a SPOT6 orthoimage and DEM (copyright Airbus D&S).

4.3.1 Changes in elevation during the September 2010 rock avalanche
The orthoimages and the elevation difference map between October 2009 and October 2010 reveal the large topographic and surface changes caused by a massive rock avalanche on Siachen Glacier (Figs 5a, 6). The elevation losses off-glacier result from the collapse of a ~1000 m high rockwall (between 4700 and 5600 m m a.s.l.) and the elevation gains on the true-left bank of the glacier result from the deposition of the corresponding material. By integrating the elevation difference over the 1.41 km2 source area, we estimate a total rock volume of 107 Mm3. The uncertainties on these values are difficult to quantify because the detachment occurred over a very steep face for which the DEM errors, estimated on gentle slopes off-glacier, may not necessarily apply. As a sensitivity test, if we increase the source area using a 1-pixel buffer (40 m), the total rock volume reaches 109 Mm3. Additionally, a null test is performed by computing the volume change over an area of similar orientation and slope as the source area but located to the south and not affected by rock avalanches. The volume change is 0.7 Mm3, equivalent to 0.5 m of elevation difference. These two sensitivity tests suggest that our detachment volume is constrained within a few per cent, i.e. a few Mm3.
Over a deposit area of 3.91 km2 (the runout distance being 1.5 km), the mean elevation gain between October 2009 and October 2010 is 28.8 m (with a maximum of ~110 m) indicating a deposit volume of 113 Mm3. We note that this elevation/volume gain is measured from two DEMs acquired 1 year apart and thus reflect the deposit thickness together with 1 year of glacier elevation change (Bessette-Kirton and others, Reference Bessette-Kirton, Coe and Zhou2018). The mean glacier elevation change over a 6 km2 area on the right bank of Siachen Glacier unaffected by the avalanche and in the same altitude range (4550–4600 m a.s.l., Fig. 5a) is ~6 m (mean 6.3 m, median 6.0 m, SD 3.0 m). This 6 m glacier thickening is also observed in the dh map of a recent study based on different elevation data (Fig. 3 in Lin and others, Reference Lin, Li, Cuo, Hooper and Ye2017) and, thus, seems a realistic feature. The origin of this thickening is discussed in Section 4.3.3. Accounting for this 6 m glacier thickening not related to the rock avalanche itself, we find a corrected deposited volume of 89 Mm3. Lacking the necessary data, we neglect any scour at the ice surface or entrainment of rock material during the avalanche (Jiskoot, Reference Jiskoot2011). In addition, we neglect the influence of differential ablation during the ~50-daytime interval between the date of the rock avalanche (known from seismic records, see Section 5) and the acquisition of the post-event DEM (31 October 2010) due to the (likely) insulating effect of a thick debris layer (Bessette-Kirton and others, Reference Bessette-Kirton, Coe and Zhou2018). The fact that we do not account for these processes together with DEM uncertainties may explain the relatively large difference (18 km3, equivalent to 4.6 m of elevation change over our 3.91 km2 deposit area) between our source and deposited volumes.
4.3.2 Changes in elevation after the September 2010 rock avalanche
Between 2010 and 2013, no significant change is observed in the source area (mean dh of 2 m) indicating that the steep face did not experience new large destabilization events (Fig. 5b). In the deposit area, the glacier thinning is strong (mean dh is −51 m) and locally the elevation change is as negative as −150 m. The thinning is already strong between November 2010 and March 2011 (Fig. 6, dh as negative as −50 m locally), during the first 6 months following the rock avalanche. Due to advection by glacier flow, the region of rapid thinning extends slightly downstream of the initial deposit area (Fig. 5b) but our averaging area (3.55 km2) is smaller than during 2009/10 as no anomalous elevation change is observed in the northernmost portion of the initial deposit. The region of rapid thinning includes a small portion of terrain off-glacier (i.e. outside of the Siachen Glacier outline, Fig. 5b), indicating that a small fraction of the volume loss is explained by debris exported away from the deposit area. From October 2010 to December 2013, the total volume change is −162 Mm3. This suggests that by December 2013, Siachen Glacier had lost a volume ~80% larger than the volume accumulated during the rock avalanche.
Between 2013 and 2016, like from 2010 to 2013, no obvious signal of elevation change is observed in the steep source area (mean dh of 3.1 m). In the deposit region, the pattern is more complex with both loss and gain observed (amplitude of ~50 m, Fig. 5c). Over a 4.02 km2 area of anomalous elevation change (corresponding mostly to the deposit area), the total volume change is −11 Mm3.
The anomalous ice melt from 2010 to 2016 creates a depression up to 150 m deep relative to the original glacier surface (Fig. 8). The length of the depression is 1.2 km and its width ~300 m if we consider the region where the elevation changes are more negative than −100 m. The depression reaches its maximum depth in 2015 and starts to fill in afterward. The shape of the depression evolves with time, a consequence of relatively fast glacier flow (~150 m a−1 at this location) and the strong velocity gradient at these shear margins (Usman and Furuya, Reference Usman and Furuya2018; Dehecq and others, Reference Dehecq2019). We note that our volume change estimates for the different periods do not take into account the effect of the displacement of topographic features due to glacier flow.
The total volume change from 2010 to 2016 over the area of anomalous thinning amounts to −171 Mm3, a value in agreement with the sum of the volume loss for the two sub-periods (2010–13 and 2013–16), considered separately (Table 2, difference of 0.3 Mm3 only). The residual of this triangulation would be larger (9.1 Mm3) if the raw volume changes were considered, i.e. without accounting for glacier elevation changes not related to the rock avalanche (measured on the glacier fraction at the same altitude but not covered with rock material). This result confirms the importance of these corrections in order to properly calculate the volume of rock avalanches on glaciers and their subsequent effects (Jiskoot, Reference Jiskoot2011; Bessette-Kirton and others, Reference Bessette-Kirton, Coe and Zhou2018).
Volume change from 2009 to 2016 in the deposit area of the September 2010 rock avalanche

The table provides both the raw volume change obtained by integrating the elevation change over the deposit area and the corrected volume change after accounting for the elevation change not related to the rock avalanche over a 6 km2 glacier area, located on the right bank of Siachen Glacier at the same altitude as the deposit (see dashed black polygon in Fig. 5a). The area of averaging is outlined manually by examining the map of elevation differences and evolves from one period to another. The last row shows the result of a triangulation, a strategy to assess the consistency of the volume changes (Paul and others, Reference Paul2015).
a DEMs used to estimate the volume change are from 31 October 2009, 31 October 2010, 13 December 2013 and 15 November 2016.
4.3.3 Changes in velocity after the September 2010 rock avalanche
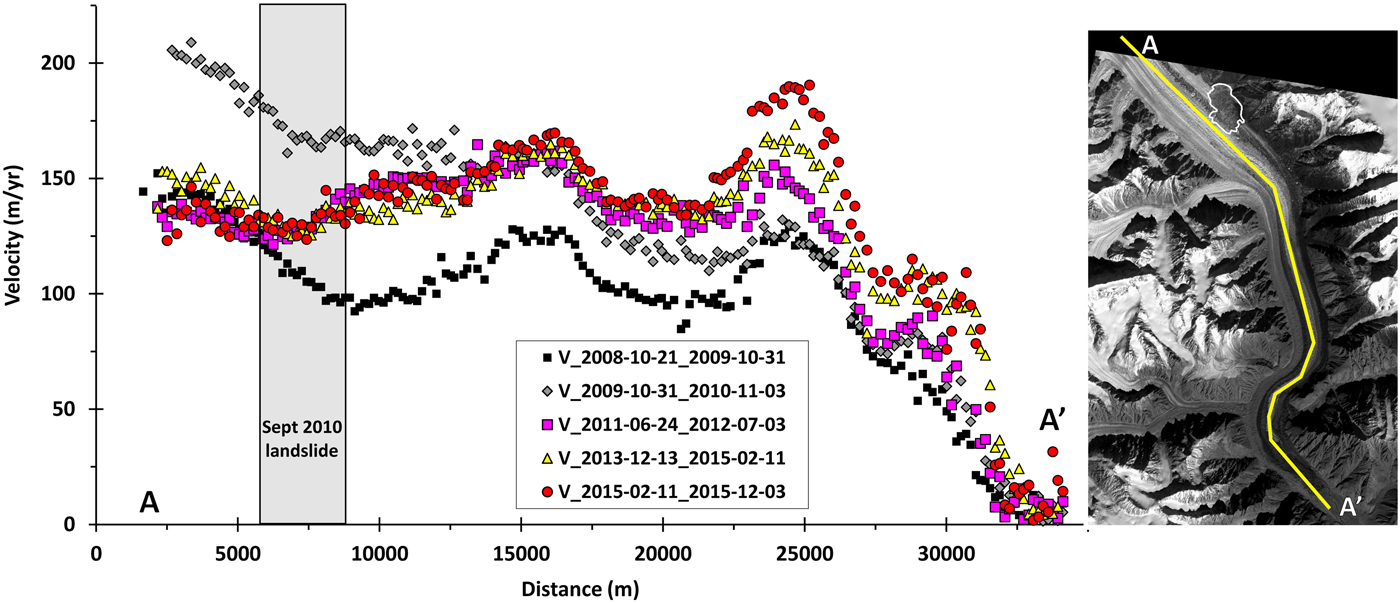
To characterize the Siachen Glacier dynamical reaction to the rock avalanche, we extracted the surface velocity along a longitudinal profile (Fig. 9). Similarly to Usman and Furuya (Reference Usman and Furuya2018), we find a 30–40% acceleration of Siachen Glacier between October 2009 and October 2010, mostly before the September 2010 rock avalanche. This acceleration translates to increased ice fluxes that may explain the ~6 m thickening observed between October 2009 and October 2010 (Fig. 5a). After October 2010, a marked glacier velocity reduction is observed upstream and around the elevation of the rock avalanche, which is again consistent with the thinning measured from 2010 to 2013 over glacier areas not affected by the rock avalanche (Fig. 5b, Table 2). Downstream of the deposit (around location 15 km of the longitudinal profile in Fig. 9), surface velocity remained mostly unchanged from 2010 to 2015. A continuous acceleration ( + 45% in total between 2010 and 2015) is observed further down-glacier (location 25 km) but could be a consequence of either the rock avalanche or, more likely, of the enhanced ice fluxes resulting from the marked 2009/10 velocity pulse.
Annual surface velocities of Siachen Glacier from October 2008 to December 2015 along a 38 km centreline profile. The velocities are measured over periods of about a year to reduce the influence of seasonal variations. The shaded rectangle locates the rock avalanche deposit.
5. DISCUSSION
5.1. Strengths and limitations of our mass-balance assessment
Our mass-balance assessment relies solely on DEMs derived from optical stereo-imagery and thus, contrary to similar studies based on radar data, our elevation change measurements are free of biases due to radar signal penetration into dry snow and firn. A significant source of uncertainty is thus avoided (e.g., Fischer and others, Reference Fischer, Huss and Hoelzle2015) as average penetration depths of 2.4–3.4 m have been found for the SRTM C-Band DEM over Karakoram glaciers (Kääb and others, Reference Kääb, Berthier, Nuth, Gardelle and Arnaud2012; Gardelle and others, Reference Gardelle, Berthier, Arnaud and Kääb2013). We also generated DEMs from imagery acquired mainly at the beginning of the accumulation period (late October or early November) so that the average seasonal offset between the two epochs, t1 and t2, is reduced to 12 days. Thus, we did not apply a seasonal correction.
However, at ~0.2 m w.e. a−1, our error bars remain relatively large because of the short-time separation of 6–7 years. This short-time interval also implies that we just fulfil the 5 year minimum duration recommended by Huss (Reference Huss2013) for employing his constant volume to the mass conversion factor. The fact that the glaciers studied here are close to balance also means that this assumption is less appropriate, i.e. part of the elevation changes could be due to temporal changes in the density profile without any mass change.
One novelty of our study is the use of SPOT6/7 stereo images which, previously, have only been used in a few glaciological studies (Ragettli and others, Reference Ragettli, Bolch and Pellicciotti2016; Kääb and others, Reference Kääb2018; Zhou and others, Reference Zhou, Hu, Li, Li, Zhao and Ding2019). Beyond their generous swath (60 km) associated with a high resolution (1.5 m), SPOT6 and SPOT7 benefit, like Pléiades (Berthier and others, Reference Berthier2014) and Worldview (Shean and others, Reference Shean2016), from improved radiometric performance thanks to their 12-bit radiometric encoding (compared to 8 bits only for ASTER and SPOT5-HRS). This results in an enhanced image contrast in the glacier accumulation areas, an improved correlation between the two images of the stereo pair and thus fewer data gaps in the DEMs. This is well-illustrated over a cloud-free portion of the images in Central Karakoram where the 2008 SPOT5-HRS DEM contains 32% of missing data vs. 1% only in the 2015 SPOT6/7 DEM.
One limitation of our study is the lack of clear time stamp both for the first (t1) and second (t2) epochs. In each epoch, we mosaicked DEMs acquired over three different years (Fig. 1). This is a consequence of several constraints on the acquisition of optical stereo-imagery: no acquisition at night or in cloudy weather, high demand on commercial satellites and the lack of a systematic acquisition plan. This loosely defined time stamp complicates the interpretation of our results given the large interannual variability of glacier mass balance in the Karakoram (Wang and others, Reference Wang, Yi and Sun2018). In others words, part of the mass-balance difference between Central and Eastern Karakoram could be explained by different periods of sampling (mostly 2008–15 in Central Karakoram west and 2010–16 in Eastern Karakoram).
5.2. Comparison to mass balances from earlier studies
Direct comparison of our geodetic mass-balance estimates to other studies is complicated by the different survey periods and, for many studies, the lack of assessment at the scale of individual glaciers. Our East-West gradient is in broad agreement with Lin and others (Reference Lin, Li, Cuo, Hooper and Ye2017) and Zhou and others (Reference Zhou, Li and Li2017). From 2000 to 2014, Lin and others (Reference Lin, Li, Cuo, Hooper and Ye2017) found near zero mass balance (−0.02 ± 0.06 m w.e. a−1) in Central Karakoram where we measured a slight mass gain (+0.12 ± 0.12 m w.e. a−1) and negative mass balance (−0.10 ± 0.06 m w.e. a−1) in eastern Karakoram where we found even more pronounced mass loss (−0.24 ± 0.12 m w.e. a−1). Over a longer time period (1973–2000), Zhou and others (Reference Zhou, Li and Li2017) also found a close to balanced mass budget in Central Karakoram (−0.03 ± 0.05 m w.e. a−1) and mass loss in Eastern Karakoram, −0.16 ± 0.07 m w.e. a−1 around Baltoro Glacier and −0.13 ± 0.07 m w.e. a−1 around Siachen Glacier. These mass-balance differences between Central and Eastern Karakoram seem to be a persistent feature although this contrast is not as clear between 2003 and 2009 according to ICESat data (Kääb and others, Reference Kääb, Berthier, Nuth, Gardelle and Arnaud2012, Reference Kääb, Treichler, Nuth and Berthier2015; Gardner and others, Reference Gardner2013).
We compare our individual glacier mass balances with the estimates for 2000–16 in Brun and others (Reference Brun, Berthier, Wagnon, Kääb and Treichler2017) for 298 glaciers larger than 2 km2 (total: 9458 km2) and well-covered by elevation change data in both studies. The area-weighted mass balance is slightly more negative in this study (−0.08 ± 0.15 m w.e. a−1) than in the ASTER-based study (−0.02 ± 0.16 m w.e. a−1). The East-West contrast in mass balance is more pronounced in our analysis. At 0.44 m w.e. a−1 (0.38 and 0.42 m w.e. a−1 for the western and eastern part of our study domain, respectively), the SD of the individual glacier mass balances is three times larger in this study than in our earlier work using ASTER time series analysis (SD = 0.14 m w.e. a−1). The larger SD of individual mass balances in this study may be a consequence of larger errors due to the relatively short-time period of our analysis and the fact that single DEM differencing is applied vs. multitemporal DEM analysis in Brun and others (Reference Brun, Berthier, Wagnon, Kääb and Treichler2017).
Our mass balance of Siachen Glacier (−0.39 ± 0.11 m w.e. a−1) from 2010 to 2016 is significantly more negative than in earlier studies where it was measured at −0.03 ± 0.21 m w.e. a−1 by comparing the SRTM DEM and a Cartosat-I DEM from 1999 to 2007 (Agarwal and others, Reference Agarwal2017), −0.03 ± 0.21 m w.e. a−1 comparing the SRTM DEM and Tandem-X DEM from 2000 to 2014 (Lin and others, Reference Lin, Li, Cuo, Hooper and Ye2017) and −0.14 ± 0.14 m w.e. a−1 using multitemporal ASTER DEMs (Brun and others, Reference Brun, Berthier, Wagnon, Kääb and Treichler2017) from 2000 to 2016. These contending values could be reconciled if the mass budgets of Siachen Glacier had evolved from balanced to negative values after 2010 which would be consistent with GRACE-derived mass change anomalies that shows a maximum in 2010 followed by a decrease for the entire Pamir-Karakoram region (Wang and others, Reference Wang, Yi and Sun2018). This explanation is however in disagreement with the ASTER-based Siachen Glacier mass balance for 2000–08 (−0.24 ± 0.17 m w.e. a−1, 66% of data voids) and 2008–16 (−0.11 ± 0.15 m w.e. a−1, 49% of data voids). However, given the large error bars in the different studies, a shift toward more negative mass balance after 2010 remains speculative. We also note our limited coverage of the accumulation area of Siachen Glacier with valid data. Overall, these comparisons highlight the difficulty of accurately measuring the mass balance of individual glaciers. There is also a lack of consensus on how their error bars should be calculated, in particular how data gaps should be taken into account while computing these error bars.
It is beyond the scope of this contribution to discuss the cause of the east/west gradient in glacier mass balances and the reasons why glaciers in Central Karakoram had a balanced or slightly positive mass budget. At the scale of our study region (~200 km), there does not seems to be a strong contrast in the map of mass-balance sensitivity calculated by Sakai and Fujita (Reference Sakai and Fujita2017). Extending their analysis for individual glaciers would help to unambiguously confirm this. The existence of a peculiar climate evolution in the Karakoram (and the nearby West Kunlun) has been the topic of several recent publications (e.g., Kapnick and others, Reference Kapnick, Delworth, Ashfaq, Malyshev and Milly2014; Bashir and others, Reference Bashir, Zeng, Gupta and Hazenberg2017; Forsythe and others, Reference Forsythe, Fowler, Li, Blenkinsop and Pritchard2017; de Kok and others, Reference de Kok, Tuinenburg, Bonekamp and Immerzeel2018) and is still an active topic of research. Increasing in high elevation accumulation, decreasing in summer temperature, increasing cloudiness and enhanced irrigation in the lowlands surrounding Karakoram and West Kunlun, particularly in the Tarim basin (or a combination of all these factors) are the suspected drivers for the regional-scale mass-balance anomaly. Interestingly, de Kok and others (Reference de Kok, Tuinenburg, Bonekamp and Immerzeel2018) modelled a clear increase in net radiation for the southeast Karakoram in response to enhanced irrigation, a region where we observe glacier mass loss.
5.3. Influence of the Siachen rock avalanche on glacier mass balance
The anomalous, localized and strong elevation changes observed in the ablation area of Siachen Glacier between October 2009 and October 2010 are the results of seven catastrophic individual events which are the most notable rock avalanches in an inventory based on long-period seismic detection algorithm (Ekström and Stark, Reference Ekström and Stark2013). They occurred between 9 and 12 September 2010 and were each equivalent to a magnitude five earthquake. From their seismic records, Ekström and Stark (Reference Ekström and Stark2013) inferred a total avalanche mass of 546 Mt. For the sake of simplicity, we consider hereafter that these seven events are equivalent to a single rock avalanche. Assuming a rock density of 2400 kg m−3 (as proposed by Ekström and Stark, Reference Ekström and Stark2013), their total displaced mass converts to a volume change of 228 Mm3. This is more than two times larger than the total volume change in the source area (107 Mm3), we obtained using DEM differencing. In the case of the summer 2016 Aru twin glacier collapse (Kääb and others, Reference Kääb2018), the seismically inferred total mass was a factor of three to six lower than the avalanche deposit volumes derived from DEMs (see their supplementary text S10). Conversely, both methods agreed reasonably well on the total mass of rock mobilized (1–1.5 × 10¹¹ kg for the seismic method, 1.8 × 10¹¹ kg for the DEM differencing) during the 2015 Taan Fiord rock avalanche in the Gulf of Alaska (Haeussler and others, Reference Haeussler2018; Higman and others, Reference Higman2018). The seismic approach is thus efficient to precisely date the avalanche (Jiskoot, Reference Jiskoot2011), capture the sequence of events (Ekström and Stark, Reference Ekström and Stark2013) and locate them geographically (Higman and others, Reference Higman2018) but needs to be combined with satellite imagery and DEMs for a more reliable estimate of the mass displacement. The revisited total volume of the 2010 Siachen rock avalanche (107 Mm3) makes it the largest event in the catalogue of documented rock avalanches onto glaciers (Table 9.1 in Deline and others, Reference Deline, Hewitt, Reznichenko, Shugar, Shroder and Davies2015) although those authors note that ‘megaslides’ exceeding 1 km3 can occur. Our Siachen rock avalanche volume is of order of magnitude larger than an estimate (9.5 Mm3) calculated using an extent of the deposit (3.2 km2) similar to ours but assuming a mean deposit thickness of 3 m (Bhutiyani, Reference Bhutiyani2015), which is a factor of 10 too small compared to what we measured using DEM differencing.
An intriguing observation is the enhanced melt that followed the deposit of the thick debris layer on Siachen Glacier. It led to the creation of a large depression, more than 100 m deep (Fig. 8). We discard a hypothesis where this thinning would be (at least partly) explained by the melt of an ice and snow-rich deposit material. The avalanche occurred in September when snow cover is close to its minimum in the Karakoram (Tahir and others, Reference Tahir, Chevallier, Arnaud, Ashraf and Bhatti2015). Inspection of our orthoimages and Google Earth imagery do not reveal the presence of glaciers, glacierets or permafrost features in the avalanche source area. Rather, we suspect (but cannot support) that this anomalous thinning is driven by melt due to en- or subglacial water. An elongated supraglacial lake is visible first in ASTER imagery in July 2012 (Fig. 7), ~2 years after the rock avalanche. Yet, rapid glacier surface lowering already occurred at this location in the months following the avalanche (Fig. 6), more than a year before the first observation of the supraglacial lake. Thus, the development of a supraglacial lake followed the enhanced thinning but did not cause it. The rapid thinning is thus probably due to enhanced sub- or englacial melt. There is evidence of supraglacial ponds around the area of the deposit in the years preceding the event, an indication of a developed sub- or englacial hydrological system. High-resolution images also reveal the growth of a marginal lake just upstream of the rock avalanche (see Fig. 3b in Ekström and Stark (Reference Ekström and Stark2013)). Our hypothesis is that the weight of the rock avalanche disrupted the en- and subglacial drainage (Truffer, Reference Truffer2003; Deline and others, Reference Deline, Hewitt, Reznichenko, Shugar, Shroder and Davies2015), leading to water accumulation upstream of the avalanche in a marginal lake and, ultimately, in enhanced melt along a sub- or englacial channel. Given its shape and orientation, the elongated supraglacial lake would thus result from the collapse of this sub- or englacial feature. Unfortunately, no direct observation is available to confirm this hypothesis.
The >100 m deep depression induced a dynamical response of the glacier with convergent ice flow, as evidenced by concentric crevasses (Fig. 8). A similar glacier response was observed over the Vatnajökull Ice Cap (Iceland) around the deep depression created by the Grímsvötn subglacial volcanic eruption (Adalgeirsdóttir and others, Reference Adalgeirsdóttir, Gudmundsson and Björnsson2000). An increase in surface velocity has been observed on several glaciers following the deposit of debris by large rock avalanches (e.g., Hewitt, Reference Hewitt2009; Shugar and others, Reference Shugar, Rabus, Clague and Capps2012) while other glaciers did not experience any flow change (e.g., Jiskoot, Reference Jiskoot2011). In the ablation area of Siachen Glacier, the pattern of velocity changes measured is rather complex, in agreement with previous studies on Siachen and others Karakoram glaciers (Scherler and Strecker, Reference Scherler and Strecker2012; Usman and Furuya, Reference Usman and Furuya2018; Dehecq and others, Reference Dehecq2019). Thus, disentangling the contribution of the rock avalanche to changes in ice dynamics remains challenging.
During 2010–16, the total volume loss of Siachen Glacier with a total surface area of 1078 km2 was 2948 ± 861 Mm3. The anomalous mass loss following the September 2010 rock avalanche (171 Mm3) accounted for ~6% of the overall Siachen Glacier 6-year mass loss and thus contributed moderately to its negative glacier-wide mass balance (−0.39 ± 0.11 m w.e. a−1). This mass-balance effect on Siachen Glacier (an additional loss of 0.02 m w.e. a−1 over 6 years) is much smaller in magnitude and opposite in sign to a similar estimate for a small cirque glacier in the Canadian Rocky Mountains where a rock avalanche reduced ablation and led to an increase of the glacier-wide mass balance from 0.2 to 0.4 m w.e. a−1 during 5–6 years (Jiskoot, Reference Jiskoot2011). The insulating effect also dominates in the case of a rockslide deposit in 2002 on Black Rapids Glacier (Alaska). The influence on the 2001–10 glacier-wide mass balance remained small in that Alaska case, mainly because only 5% of the Black Rapids Glacier area was covered by the deposit (Kienholz and others, Reference Kienholz, Hock, Truffer, Arendt and Arko2016).
6. CONCLUSION
In this study, we used satellite-derived DEMs to measure elevation changes from 2008 to 2016 over 79% of a 12 000 km2 glacierized area of the Karakoram. Our elevation change measurements are based on optical imagery and thus do not require any correction of the effect of radar penetration. Still, they carry their own limitations such as a varying time-stamp throughout the study region and limited coverage of the accumulation areas. We measure a marked contrast in the mass balance between the Central and Eastern Karakoram. Slight mass gain is observed in the Central Karakoram, showing the persistence of the anomaly, at least in this part of the mountain range. Our results suggest that the Karakoram mountain range should not be considered as a whole but split into different sub-regions, in particular when revisiting ICESat laser altimetry data (Kääb and others, Reference Kääb, Treichler, Nuth and Berthier2015) and analyzing the measurements of the recently launched ICESat-2 (Abdalati and others, Reference Abdalati2010).
Our study also raises some intriguing questions about the influence of rock avalanches on glaciers. We observed that a large rock avalanche on Siachen Glacier in September 2010 led to a persistent enhanced glacier thinning, already in the months following the deposition of this thick layer of debris. It is expected that such a thick rock avalanche deposit would insulate the underlying ice and ultimately lead to a glacier advance unrelated to a change in climate as exemplified, among others, by the Brenva and Sherman glaciers (e.g., D'Agata and Zanutta, Reference D'Agata and Zanutta2007; Deline and others, Reference Deline, Hewitt, Reznichenko, Shugar, Shroder and Davies2015). Our observations of enhanced melt in the rock avalanche deposit area on Siachen Glacier, if made on other glaciers in the future, may have some implications for glacier models simulating the glacier response to rock avalanches, as they currently only consider their insulating effect (Vacco and others, Reference Vacco, Alley and Pollard2010).
SUPPLEMENTARY MATERIAL
The supplementary material for this article can be found at https://doi.org/10.1017/jog.2019.32
ACKNOWLEDGEMENTS
We thank two reviewers (Duncan Quincey and Sam Herreid), Dan Shugar (Scientific Editor) and Hester Jiskoot (Chief Editor) for their constructive comments on our manuscript. E.B. acknowledges support from the French Space Agency (CNES) and the Programme National de Télédétection Spatiale grant PNTS-2016-01. SPOT6/7 data were obtained thanks to public funds received in the framework of GEOSUD, a project (ANR-10-EQPX-20) of the program ‘Investissements d'Avenir’ managed by the French National Research Agency. SPOT5-HRS images and DEMs were provided by the SPOT 5 stereoscopic survey of Polar Ice: Reference Images and Topographies (SPIRIT) project, funded by the French Space Agency (CNES). ASTER image data are courtesy of NASA/METI/AIST/Japan Spacesystems and USA/Japan ASTER Science Team. The GLIMS project allowed the population of a vast archive of ASTER stereo images over glaciers.
AUTHOR CONTRIBUTION STATEMENT
E.B. designed the study, made the data analysis and led the writing. F.B. shared some of the codes used in this work, provided the ASTER DEMs, discussed the results and contributed to the writing.
DATA AVAILABILITY
Our map of elevation changes is available upon request to the corresponding author. Individual ASTER DEMs are also available. Restrictions apply for the SPOT5-HRS and SPOT6/7 DEMs. The glacier-wide mass balances, their errors and the percentage of coverage of the 402 glaciers analyzed in detail are provided in a supplementary CSV file.


 Open access