


Impact Statement
We present the first operational validation of a comprehensive Digital Twin Construction (DTC) system for precast concrete spanning from fabrication to site. Distinct from recent reported implementations with narrow scope, our system demonstrates the technical viability of data-centric “Plan-Do-Check-Act” control across the organizational interfaces of off-site production, supply chain logistics, and on-site assembly in a controlled laboratory setup. We provide a DTC system architecture and implementation details as a reference for future R&D, integrating real-time progress monitoring, relational database, planning and control tools, multi-modal decision support, and optimization that generates alternative plan recommendations. By enabling multiple replications of the construction of the same building under different DTC scenarios, the experimental setup generates systematically comparable empirical evidence, which was previously unattainable.
1. Introduction
As construction monitoring and data capture technologies mature, they make closed-loop planning and control of construction projects, based on data, increasingly plausible. Managers can benefit from situational awareness with greatly reduced latency of reporting, compare what is happening with what was intended, and intervene to adjust the production system proactively (Lappalainen et al., Reference Lappalainen, Seppänen, Peltokorpi and Singh2021; Martinez et al., Reference Martinez, Yeung, Sacks, Shahaf and Sharoni2023). The Digital Twin Construction (DTC) paradigm frames this opportunity as a production management workflow with short Plan Do Check Act (PDCA) cycles in which a digital representation of the project continuously links intent, status, and action (Sacks et al., Reference Sacks, Brilakis, Pikas, Xie and Girolami2020).
The literature offers increasing evidence that many of the necessary system components are technically feasible. These include interoperable data schemas and architectures, automated monitoring of activity on site and status inference, and status-driven simulation and optimization (Schlenger et al., Reference Schlenger, Pluta, Mathew, Yeung, Sacks and Borrmann2025; Yeung et al., Reference Yeung, Martinez, Schlenger, Borrmann and Sacks2025). A small number of field case studies also report early DTC implementations in live projects (Martinez et al., Reference Martinez, Stauch, De Soto and Sacks2025; Valinejadshoubi et al., Reference Valinejadshoubi, Sacks, Valdivieso, Corneau-Gauvin and Kaptué2025). However, these implementations remain narrow in scope. They emphasize monitoring, visualization, and local corrective actions, but few sustain a loop that links intent, status, and action across broader planning horizons. None of the reported solutions spans organizational interfaces between factory production, logistics, and on-site assembly.
Thus, three related gaps follow. First, the practical feasibility of implementing and operating a DTC system as an end-to-end closed loop across coupled production systems that link off-site production, logistics, and on-site erection has yet to be established. Second, the evidence available from the few field implementations that have been reported cannot support exploration of the ways in which managers use DTC systems, how they influence project outcomes, or what their impacts might be under varying conditions or levels of automation. Third, construction projects are one-off endeavors with unique contexts, which makes testing of alternative configurations within a project impossible and like-for-like comparison across projects difficult due to sparse empirical evidence.
To address these gaps, the authors designed, implemented, and tested a laboratory-scale coupled physical and digital environment that simulates a DTC system in a precast residential project as a holistic production system with interacting subsystems (precast factory, storage, and transport). The first aim was to demonstrate the technical feasibility of a comprehensive and fully operational closed-loop planning and control DTC system. The second aim was to implement and validate a laboratory setup that enables reproducible experiments that test DTC performance under different degrees of automation and autonomy. The setup supports a PDCA loop from intent to status to action through an end-to-end pipeline that captures progress on the physical construction site, updates a digital twin repository, and propagates directives and decision support back to participants through integrated interfaces. The setup has been validated through repeated complete executions of the project under a controlled experimental protocol.
The resulting testbed provides a reference architecture and a working implementation that researchers can reproduce, extend, and instrument. It enables repeatable human-in-the-loop experiments in which disruptions, information quality, and control policies can be varied systematically while keeping the underlying project context stable. This supports the accumulation of directly comparable evidence on closed-loop digital twin-enabled production planning and control across the supply chain and the construction site.
The remainder of the paper is organized as follows. Section 2 reviews DTC as a workflow concept and identifies the research gaps. Section 3 presents the research methodology and experimental approach. Section 4 describes the design of the laboratory setup and details the architecture and implementation of the DTC system. Section 5 reports the validation through full project runs. Section 6 discusses implications, limitations, and opportunities for future experimental studies. Section 7 concludes the paper.
2. Background and related work
This section provides background on DTC and reviews the relevant literature on experimental methods for research on construction planning and control.
2.1. Digital twin construction
DTC frames the construction-phase digital twin as a management workflow rather than a technology artefact (Sacks et al., Reference Sacks, Brilakis, Pikas, Xie and Girolami2020). A digital twin in this sense is not simply a detailed BIM model or a digital building representation maintained for operations, but a continuously updated digital counterpart of the project that supports planning and control decisions during execution. DTC combines digital twin information systems with established Lean Construction thinking and uses the twin to operationalize short feedback cycles in the presence of uncertainty and variance, supporting a paradigm similar to that of the Last Planner System (Ballard, Reference Ballard2000).
Closing the loop in DTC means executing Plan–Do–Check–Act cycles (Deming, Reference Deming2000) through an end-to-end information pipeline that links intent, status, and action. Design and planning activities create project intent information that specifies the as-designed product and the as-planned process, information typically captured in Building Information Modelling (BIM) systems (Sacks et al., Reference Sacks, Lee, Burdi and Bolpagni2025). Execution across the supply chain and the site then produces the physical outcomes that monitoring technologies observe as raw data (Rao et al., Reference Rao, Radanovic, Liu, Hu, Fang, Khoshelham, Palaniswami and Ngo2022; Chung et al., Reference Chung, Tariq, Mohandes and Zayed2023). Interpretation functions translate these heterogeneous data streams into project status information that describes the as-built product and the as-performed process, so that managers can compare what is happening with what was intended (Hasan and Sacks, Reference Hasan and Sacks2023). Conformance evaluation turns that comparison into project status knowledge by identifying discrepancies that matter and by framing them as decision needs. Managers can then evaluate corrective interventions, revise designs or plans when necessary, and issue updated directives for production control, which completes the cycle and initiates the next iteration. Simulation and analytics strengthen this loop by supporting what-if evaluation of alternatives and by producing project intent knowledge that improves prediction and option assessment as new status information arrives (Akroyd et al., Reference Akroyd, Mosbach, Bhave and Kraft2021; Yeung et al., Reference Yeung, Martinez, Sharoni, Sacks, Teizer and Schultz2022).
Recent research has demonstrated technical feasibility for the main functional building blocks required to operationalize this pipeline: integrated data architectures, automated monitoring and status inference, and simulation or optimization models.
Schlenger et al. (Reference Schlenger, Pluta, Mathew, Yeung, Sacks and Borrmann2025) addressed data-layer and data-management requirements for DTC by proposing a plug-in-based reference architecture that couples RDF graphs with specialized databases and introduces a Digital Twin Construction Ontology for comparing planning information with monitored status, which they validated on the ConSLAM dataset. Zheng et al. (Reference Zheng, Al Barazi, Seppänen, Abou-Ibrahim and Görsch2025) similarly demonstrated the feasibility of workflow monitoring through the DiCon-DT framework, where an ontology network integrates diverse sources into a semantic data lake and supports contextual interpretation and simulation, building on the DiCon ontology suite (Zheng et al., Reference Zheng, Törmä and Seppänen2021) for formalizing construction workflow information. Farghaly et al. (Reference Farghaly, Soman and Whyte2024) further showed that ontology-enabled interoperability can support production-control use cases by developing the cSite ontology and using SPARQL competency questions and control-room dashboards to query and visualize integrated production information.
Progress monitoring research provides complementary evidence that the “monitor and interpret” portion of the DTC workflow can translate observations into decision-ready project status updates. Studies have shown that imagery and video can infer fine-grained task states and generate structured documentation, including operation-level concrete pouring progress (Pfitzner et al., Reference Pfitzner, Hu, Braun, Borrmann and Fang2025), prefabrication installation tracking using tower-crane CCTV (Wei et al., Reference Wei, Lu, Zhang, Wang and Lin2024), and automated daily reporting from site videos (Xiao et al., Reference Xiao, Wang, Zhang, Chen and Darko2024). UAV-based workflows extend this capability to larger contexts by estimating earthwork progress from photogrammetry (Ersoz and Pekcan, Reference Ersoz and Pekcan2025) and by registering aerial imagery to BIM for façade state capture (Zhang et al., Reference Zhang, Zou, Wang and Dimyadi2025). Point-cloud pipelines continue to improve scan-to-BIM alignment and element association for completion inference (Zhang et al., Reference Zhang, Lu, Luo and Pan2024), while mixed-reality mesh capture supports progress and deviation evaluation for complex indoor MEP work (Tao et al., Reference Tao, Bosché and Li2024). Researchers have also demonstrated that non-visual sensing can contribute additional evidence streams, including passive RFID-enabled traceability for prefabricated elements (Brandín and Abrishami, Reference Brandín and Abrishami2024), indoor monitoring based on multi-sensor data fusion (Khazen et al., Reference Khazen, Nik-Bakht and Moselhi2024), and smartwatch-based activity recognition for tool use (Altheimer and Schneider, Reference Altheimer and Schneider2024). Together, these studies show that sensing and interpretation can produce a project status representation that is sufficiently structured to support coordination and compliance actions.
Beyond status synchronization, researchers have shown that DTC can connect updated status representations to simulation and optimization so that decision models can revise assumptions and evaluate alternatives under current constraints. This work typically targets two horizons, where planning models support production-system configuration and medium-term decisions, while control models support near-real-time logistics and execution adjustments. Yeung et al. (Reference Yeung, Martinez, Schlenger, Borrmann and Sacks2025) integrated an ontology-based digital twin with parametric agent-based simulation to support adaptive production-system design, and demonstrated real-time data ingestion, dynamic simulation model instantiation, and scenario analysis within a single workflow. Jiang et al. (Reference Jiang, Li, Li, Liu, Zhong, Pan and Huang2022) proposed a digital twin-enabled real-time synchronization system for just-in-time precast assembly that uses real-time resource status and construction progress to support planning, scheduling, and execution coordination and dynamic adjustment.
Recent work also suggests that artificial intelligence methods, particularly graph neural networks (GNN), could further support DTC implementation, because they are well-suited to the highly relational data structures that underlie construction systems and digital twins, including spatial relationships among building components, dependencies between activities, and heterogeneous networks of resources and sensors (Jia et al., Reference Jia, Wang, Shou, Hosseini and Bai2023). Kim and Chi (Reference Kim and Chi2022) showed that a semantic GNN can model interactions among construction resources in site images to detect visual relationships, thereby improving scene understanding for monitoring tasks. Pan et al. (Reference Pan, Fu and Zhang2022) applied an attention-based graph convolutional network to tunnel excavation data to predict TBM penetration rate and energy consumption, illustrating how relational learning can support execution-phase performance prediction. Kayhani et al. (Reference Kayhani, McCabe and Sankaran2023) developed a BIM-GNN approach for semantic-aware quality assessment that combines point-cloud observations with spatial and topological relations among building elements to classify as-built status under noisy and occluded site conditions. Mostofi and Toğan (Reference Mostofi and Toğan2023) further demonstrated that graph attention models can improve construction safety prediction by capturing relational patterns in sparse accident networks.
Finally, industrial implementations demonstrate that integrated DTC workflows can operate in live projects, where systems link intent information, monitored status, and management actions in a closed loop. Valinejadshoubi et al. (Reference Valinejadshoubi, Sacks, Valdivieso, Corneau-Gauvin and Kaptué2025) implemented a closed-loop production-control workflow for a cement silo project by integrating BIM, IoT sensing, and GIS to enable near-real-time progress monitoring, planned-versus-actual comparisons, and deviation-triggered interventions. Martinez et al. (Reference Martinez, Stauch, De Soto and Sacks2025) applied the concept to mechanized tunnelling by consolidating TBM and segment-manufacturing data into an as-built tunnel-lining model and comparing the updated status model with the original intent BIM model to define no-drill zones, perform clash detection, and support bracketry design and execution. The authors encountered and overcame persistent barriers such as interoperability limitations and the lack of standardized representations of tunnel geometry and information.
Collectively, these contributions demonstrate the technical feasibility of the core building blocks enabling the DTC workflow. However, whether the feasibility of technical components can be translated into the practical feasibility of a comprehensive system in which the DTC workflow is scaled to the broader decision and production-system scope and across different planning horizons remained an open question. Furthermore, construction production is not confined to the site boundary. Off-site fabrication, transportation, and on-site assembly each operate as production subsystems, yet they function as a coupled, holistic production system in which capacity, sequencing, and handoffs interact and constrain flow (Anvari et al., Reference Anvari, Angeloudis and Ochieng2016; Yeung et al., Reference Yeung, Ying, Li and Sacks2024).
2.2. Experimental methods for research of construction planning and control
In parallel, evidence about the project-level impacts of DTC cannot be established through field deployments. Benefits reported in case studies are promising but remain difficult to validate because construction projects are one-offs and differ widely in scope, contractual settings, organizational culture, construction methods, and scale. Managers adapt decisions to unfolding conditions, and many confounding variables co-vary with the outcomes recorded. All of which makes like-for-like comparisons rare (Vrijhoef et al., Reference Vrijhoef and Koskela2005). Research is also constrained by the realities of construction practice, where projects are capital-intensive, risk-exposed, and organizationally fragmented, and where decision-making and data stewardship are distributed across multiple actors.
Controlled laboratory experimentation offers an alternative setting. Simulation methods allow researchers to hold the context constant and systematically vary modeling parameters. Experimenters may use computer simulations, live role-play simulations, or mixed simulations (Fellows and Liu, Reference Fellows and Liu2015). With simulation, integrated DTC workflows can be implemented, observed, measured, and iterated under controlled conditions. Various analogous experimental setups can preserve key realism in the coupled production flow while making testing of broader-scope feasibility across decision use cases and across factory–transport–site interfaces practical, without the cost, risk, and variance of live projects. Opoku et al. (Reference Opoku, Perera, Osei-Kyei, Rashidi, Bamdad and Famakinwa2024) implemented and validated an IoT–BIM digital twin in a university library “living lab” to support real-time monitoring, visualization, and decision making under live operational conditions. In manufacturing settings, Zhuang et al. (Reference Zhuang, Liu and Xiong2018) reported a digital twin-based production management and control implementation in a satellite assembly shop-floor scenario, and Klein and Furmans (Reference Klein and Furmans2026) evaluated predictive digital twins in a remanufacturing demonstration environment through combined virtual and physical experiments.
General-purpose construction simulation systems using discrete-event simulation (DES), such as those discussed by Martinez and Ioannou (Reference Martinez and Ioannou1999), enabled modelers to represent resource interactions, queues, and stochastic activity durations in a reusable modelling framework. Researchers have also combined DES with optimization so that an algorithm can search large design spaces while the simulation evaluates feasibility and performance. Hamm et al. (Reference Hamm2011), for example, integrated DES within an optimization framework to generate and improve construction schedules by iteratively proposing candidate plans and assessing their simulated execution. When research questions center on decentralized decision-making, local perceptions of uncertainty, and emergent coordination effects, agent-based simulation (ABS) often provides a closer fit (Ben-Alon and Sacks, Reference Ben-Alon and Sacks2017; Korb and Sacks, Reference Korb and Sacks2021; Yeung et al., Reference Yeung, Martinez, Schlenger, Borrmann and Sacks2025). ABS models individual actors as agents governed by behavioral rules, so the global production flow emerges from local interactions rather than being fully prescribed by a central schedule (Ben-Alon and Sacks, Reference Ben-Alon and Sacks2017).
However, modeling the behaviors of construction managers reliably is extremely difficult, and for these reasons, researchers frequently turn to laboratory experiments with human subjects. A common approach is to use live simulation games that represent key production-planning and control decisions while keeping execution simplified and observable. LEAPCON (Sacks et al., Reference Sacks, Esquenazi and Goldin2007), (Warcup and Reeve, Reference Warcup and Reeve2014) and other serious games use Lego-based construction tasks to teach and test LPS concepts. Martinez et al. (Reference Martinez, Yeung, Sacks, Shahaf and Sharoni2023) devised the iKan role play game to investigate how the quality of information flow shapes production planners’ situational awareness and, in turn, workflow quality. They conducted 14 live experimental runs with prescribed information-flow configurations and reported that better information flow reduced subcontractor assembly time and non-value-adding time in the experiments.
Each method offers a distinct trade-off among realism, controllability, and explanatory power. Empirical studies offer ecological validity but limited causal attribution. Simulation enables systematic exploration but depends on modelling assumptions. Experiments enable causal inference but require simplified, controllable task environments (Fellows and Liu, Reference Fellows and Liu2015). Importantly, live laboratory experiments, often implemented as simulation or serious games, have proven well-suited for studying the impacts of planning procedures, collaboration mechanisms, and information or decision-support tools on workflow, because they retain human decision-making and communication dynamics while allowing tight control and repeatable comparison across experimental conditions (Martinez et al., Reference Martinez, Yeung, Sacks, Shahaf and Sharoni2023).
3. Methodology
We adopted a design science research approach (Peffers et al., Reference Peffers, Tuunanen, Rothenberger and Chatterjee2007) to design, build, and validate a laboratory setup that functions as an experimental platform for Digital Twin Construction. The setup simulated a precast residential construction project and allowed repeatable, controlled, and comparable experimental runs. The simulation design focused on achieving a reliable, validated research instrument that can be used to study different configurations of digital monitoring and of decision-support in construction projects.
The laboratory setup is designed to reproduce, at a reduced physical scale, the erection phase of a real precast residential building together with its upstream production and logistics. It simulates the production–transport–erection chain as a holistic production system: precast elements are produced in a factory area, transported to a site area, and erected in a scaled physical building that models the main characteristics of the case project. The building design, process logic, information flows, control loops, and typical sources of disruption were derived from a real project. Human participants operate as planners, coordinators, and construction crews, which allows capture of human variability, decision-making, and errors that are characteristic of construction operations.
The design science process included iterative cycles of problem diagnosis, requirement specification, design, implementation, evaluation, and refinement. Initial problem framing and design requirements were derived from prior research on Digital Twin Construction, lean production, and laboratory experimentation in construction management, as well as from an in-depth analysis of a case-study precast project. On this basis, a first version of the laboratory setup was designed and implemented, combining a scaled physical building, physical flows of elements, a digital monitoring system, a data and computation server, and a decision-support interface. Subsequent iterations refined both the physical and digital components of the setup based on empirical evidence and expert feedback.
Multiple sources of data and knowledge were used throughout these design cycles. A structured review of relevant literature was used to identify desirable properties of a DTC-enabled production system, requirements for experimental control and repeatability, and criteria for fidelity of laboratory simulations. Detailed records from the case-study project, including time-lapse video of site operations, planning and control documents, and production and delivery logs, were used to specify the scope of the simulated system and to calibrate process logic, cycle times, and typical disturbances. Semi-structured interviews and working sessions with practitioners from the case project, complemented by discussions with external experts in construction management and digital construction, were used to assess the face validity and the conceptual validity of the laboratory setup, and to refine modelling assumptions, process maps, and experiment procedures.
To ensure that the setup can support controlled and repeatable experiments, we defined standardized scenarios, protocols, and initial conditions. Each run starts from the same baseline project state (building layout, element set, and nominal plan), while the researcher controls the experimental conditions by enabling or disabling the DTC capabilities described in Section 4. This configuration approach allows the same underlying project to be executed repeatedly under comparable conditions, while isolating the effect of introducing digital monitoring and decision-support on top of an otherwise unchanged production system and management task.
For validation of the laboratory instrument, we targeted four attributes that determine whether the setup can function as an experimental research instrument: (1) functional completeness (the instrument contains the essential physical and informational mechanisms required to execute the intended planning–control task), (2) operational stability (the coupled environment can run end-to-end without breakdowns that would invalidate sessions), (3) repeatability (equivalent initial conditions and protocols yield comparable runs suitable for controlled experimentation), and (4) experimental usability (participants can practically operate the instrument to monitor, plan, and intervene within the study design). To test these attributes, we focused on two end-member scenarios that collectively test the integrity of (i) the physical simulation environment and core planning–control cycle, and (ii) the integrated digital-twin implementation and its coupling to the physical process.
In the no-assistance (baseline) scenario, the run proceeds without DTC assistance active, such that the manager must monitor and coordinate using direct observation and conventional practices. This scenario validates that the physical setting, process logic, roles, and experimental protocol form a coherent and realistic planning and control problem, and that complete runs can be executed without relying on any digital augmentation.
In the full workflow scenario, all DTC capabilities are activated together as a closed loop. Because the DTC workflow is implemented as a sequentially dependent pipeline (i.e., upstream sensing and data handling must reliably support downstream planning and control actions, and downstream actions must consistently propagate back to the project state), successful end-to-end operation provides a stringent functional validation of the digital system as an integrated whole.
To provide evidence for the four instrument-quality attributes mentioned above, we combined face validation and functional validation. Face validation assessed whether the laboratory representation credibly reflects the reference project and whether the constraints encoded in the physical and digital models correspond to real practice. We used case study records (e.g., time-based observations and planning and logistics documents) and practitioner review to calibrate and check the building representation, the encoded spatial/structural constraints, and the process precedence and method rules. We also verified that the intended coupling between factory production, transportation, and site assembly is represented through explicit lead-time and commitment rules, so that production capacity, near-term delivery commitments, and site inventory availability jointly constrain feasible planning decisions.
Functional validation then assessed whether the platform can reliably support complete experimental runs under controlled yet realistic conditions. We executed multiple end-to-end project runs under both scenarios, using the same baseline initial conditions and protocol, and verified stable operation of the coupled physical–digital environment across repeated sessions. System logs and run artefacts were used to confirm consistent recording of element-level progress and consistent propagation of project-state updates through the planning and control loop. Post-run feedback from manager participants was used to assess perceived feasibility and realism of the task environment and the usability of the platform for experimental decision-making.
Together, the face and functional validation methods can establish that the laboratory setup constitutes a viable research instrument. Face validation supports functional completeness and experimental usability by confirming that the represented building, constraints, and process logic are credible and sufficient for the intended management task, thereby reducing the risk that observed behaviors arise from artefacts of an unrealistic model. Functional validation supports operational stability and repeatability by demonstrating that complete runs can be executed reliably under controlled initial conditions and that the coupled physical–digital loop produces consistent records and state updates across repeated sessions. Taken together, successful execution under the no-assistance scenario provides evidence that the physical environment and baseline planning–control cycle are coherent and usable, while successful execution under the full-workflow scenario provides evidence that the integrated digital-twin implementation and its coupling to physical execution operate end-to-end as intended.
4. System design and implementation
The laboratory system is a coupled physical–digital environment that emulates a precast concrete construction project under a DTC paradigm. As illustrated in Figure 1, in the physical environment, human participants construct a scaled 1:25 physical building, while the digital environment hosts the digital twin repository and services. Together, they form a closed-loop system in which real-time progress data from the physical construction site continuously updates the digital twin, and the digital twin in turn provides planning and control recommendations back to the site. This design enables controlled and repeatable experiments on DTC-enabled planning and control, while maintaining a high degree of representativeness with respect to a real-world precast residential project.
Architecture of the laboratory setup DTC system.

Figure 1. Long description
The flowchart is divided into two main sections connected by bidirectional arrows.
1. Physical Environment (Left Section).
At the top is the Construction Site containing an Assembly Worker, a 1 to 25 Physical Building model, a Concreting Worker, and a Construction Manager. Below these is a Site Inventory box.
At the bottom left is the Monitoring System containing Q R Code Scanners and Cameras.
At the bottom right is the Factory Inventory and a Supplier icon.
2. Data Flow (Center).
A top arrow points right from the Physical to the Digital Environment labeled Real-time Progress Monitoring Data.
A bottom arrow points left from the Digital to the Physical Environment labeled Planning Decision Recommendations.
3. Digital Environment (Right Section).
The Digital Twin Services area on the left includes Assembly, Concreting, and Supplier Assistance Interfaces, Manager’s Decision Support Interfaces, and an Optimization Server.
The Digital Twin Repository on the right contains a Cloud Server and an S Q L Database containing as-planned and as-performed information.
4.1. Physical environment
The core element here is the laboratory construction site. Here, an assembly worker and a concreting worker cooperate to build the structure. The assembly worker simulates the crane operations and the activities of the on-site assembly crew, placing precast and prefabricated elements according to the current erection plan and temporary support requirements. The concreting worker simulates the concreting crew and the concrete pump, filling the joints between horizontal and vertical elements as well as grouting of vertical elements. The construction process of the scaled building mimics the sequencing and constraints of the reference project, including installation, temporary support, and concreting steps, respecting physical dependencies between vertical and horizontal elements. A site inventory area adjacent to the building holds the precast elements that are available on site, and a construction manager, who is the main experimental subject, is responsible for planning and controlling the construction progress based on the information and recommendations provided.
The physical environment also includes a monitoring system and a representation of the upstream supply chain. The monitoring system comprises QR code scanners and cameras that track the location and status of elements and capture key milestones in the construction process. This monitoring infrastructure generates real-time progress data that is transmitted to the digital twin. Upstream, a factory inventory area represents the output of the precast factory, where elements arrive according to a specified production rate. A supplier agent is responsible for transporting elements from the factory inventory to the site inventory in accordance with the current delivery schedule and any updated instructions issued by the construction manager. In this way, the laboratory setup captures the interactions between production, transport, and on-site erection within a simplified yet realistic supply chain. Cameras were installed at the four corners of the experiment area to record ground truth for visual validation.
The experimental building is a 1:25 scale model of an eight-story residential building in Helsinki, Finland, with a precast concrete structure. This building was chosen due to its suitable construction method and size, and the availability of the full BIM model and time-lapse videos of the entire construction duration. The building has two floors, each with 11 apartments and lobby spaces, two balconies, two elevator shafts, two stairwells, and seven-bathroom pods. Figure 2 shows the complete model after construction. The structure has six main component types: walls, hollow-core slabs, stairs, bathroom pods, concrete joints for walls, and concrete joints for slabs. The wall and slab elements were laser cut from 8 mm-thick plywood sheets. There is a total of 322 building elements. The concrete joints were 3D printed in grey plastic. Additionally, red triangular temporary supports (Figure 3) were 3D printed.
Complete 1:25 scale experimental model building.
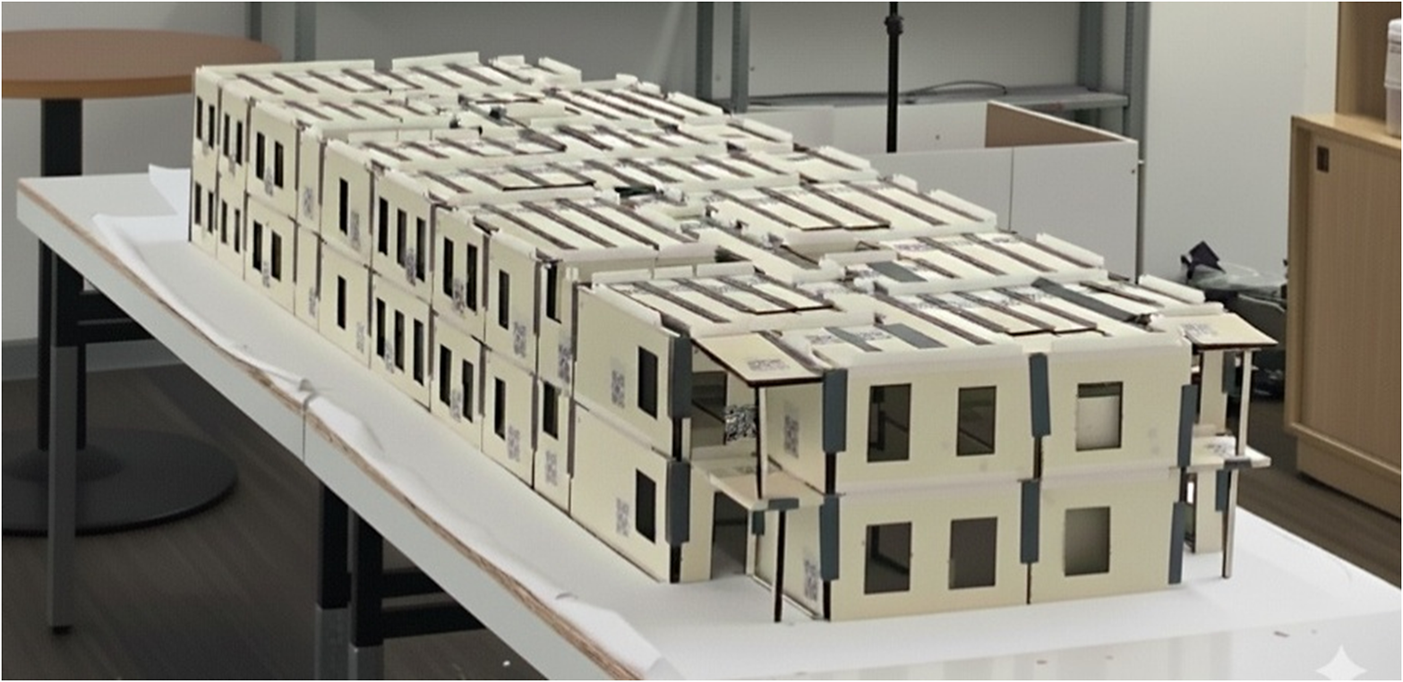
Figure 2. Long description
The model is a rectangular, two-story structure composed of numerous interconnected white modular units. It sits on a long white table in a laboratory or workshop setting.
Exterior Features:
* The facade consists of cream-colored panels with rectangular window cutouts.
* Small Q R codes are visible on several exterior wall panels for tracking or digital integration.
* Dark grey or black vertical strips mark the joints between the modular units.
* The roof is flat and reveals a complex internal grid of structural beams and supports.
Structural Details:
* The building is organized into a dense grid of repeating units.
* On the right side, the structure features open balcony-like sections supported by thin vertical pillars.
* The interior reveals a hollow core within the modules, suggesting a focus on structural load-bearing tests or spatial configuration.
* The model is positioned diagonally across the table, extending from the mid-ground toward the background.
Temporary support.

Each building component is labelled with a QR code, which is scanned twice during construction: first, when a component is delivered to the site; and second, when it is placed in a specific location during erection. Note that pieces are not unique—some pieces can be placed in more than one possible location.
4.2. Digital environment
This includes a digital twin repository and a set of digital twin services. The repository is an SQL database that stores as-planned and as-performed information, including element design data, element status, and the latest production, delivery, and erection schedules. A cloud server interfaces with this database and orchestrates data exchange with the various services and user interfaces. The digital twin services provide monitoring, assistance, and decision-support capabilities tailored to the different roles in the simulation. A decision-support interface for the construction manager aggregates information from the digital twin and presents key indicators and recommendations for planning and control. A planning and control interface allows the manager to formalize decisions on erection sequences and delivery plans, which are then communicated to the workers and the supplier.
Role-specific assistance and data recording interfaces are provided for the assembly worker, the concreting worker, and the supplier. These interfaces display task instructions, such as which element to install or deliver next, and provide simple mechanisms for recording task completion and reporting deviations or issues. As a result, instructions from the construction manager are transmitted digitally through the interfaces rather than orally, and the progress updates from the workers and supplier flow back into the digital twin in a structured way. The combination of monitoring data and interface inputs keeps the digital twin synchronized with the evolving state of the physical construction process, while the decision-support and directive functions enable the digital environment to feed planning and control actions back to the physical environment. This bidirectional information flow operationalizes the DTC concept in the laboratory and establishes the basis for the experiments conducted in subsequent sections.
Figure 4 positions the laboratory setup within a closed-loop Digital Twin Construction (DTC) control cycle structured around Plan–Do–Check–Act (PDCA). On the right-hand side of the figure, the “Do” block represents the ongoing construction work on the laboratory site, while the left and central parts of the figure depict the digital twin processes that monitor this work, assess its alignment with project intent, and support the manager in planning and executing corrective actions. In this way, the digital twin does not simply record project status but continuously compares what is happening on site with what is intended to happen and feeds recommendations and updated plans back to the physical environment.
DTC Plan, Do, Check, Act cycle in the laboratory setup.

Figure 4. Long description
The flowchart is organized into three dashed-line boundary zones and a central data hub.
1. Plan and Act Zone (Top and Left): This section begins with a cylinder labeled Project Intent Knowledge. An arrow points to a box for Recommendation, which leads to a Planning and Control Tool. This tool connects bidirectionally with Rule-based Planning Assistance. Below this sequence, a Simulation forward slash Optimization box feeds back into the Planning and Control Tool. A Project Status Visualization box is also located in this quadrant.
2. Do Zone (Right): An arrow from the Planning and Control Tool leads to Communication Tools. This points down to a Do box containing an icon of a crane lifting a building block.
3. Check Zone (Bottom): An arrow from the Do zone leads to Reality Capture. Four parallel arrows point from Reality Capture to Data Fusion and Interpretation.
4. Central Data Hub: Two stacked cylinders sit in the center. The top cylinder, Project Intent Information, receives input from the Planning and Control Tool and sends data to Communication Tools, Project Status Visualization, and Rule-based Planning Assistance. The bottom cylinder, Project Status Information, receives data from Data Fusion and Interpretation and sends information to Project Status Visualization and Simulation forward slash Optimization.
The loop begins on the bottom right of Figure 4 with reality capture of the construction process. In the laboratory setup, this reality capture is implemented through multiple data streams, including QR code scans, camera-based monitoring, and the inputs that workers provide via their assistance interfaces. These heterogeneous data sources are fed into a data fusion and interpretation module running on the server. This module reconciles and cross-validates the different observations, matches them against known element identities and planned sequences, and infers missing status information where possible. The resulting consolidated view of the state of the project is stored as project status information in the digital twin. This is the “Check” phase of the PDCA cycle.
This project status information supports two key functions: status visualization, which provides the construction manager with up-to-date views of progress, and simulation and optimization, which use the status data to calibrate models and initialize analyses from the correct current state. In addition to the project status information, the digital twin maintains project intent information, which encodes the as-planned production, delivery, and erection sequences as well as the remaining work. Simulation and optimization services combine project status and project intent information to explore alternative future trajectories (“what-if” scenarios), identify potential performance issues, and evaluate the impact of different planning decisions. The results of these analyses are stored as project intent knowledge and presented to construction manager along visualizations based on project status and intent information.
In the “Plan & Act” phase, once the manager has reviewed the recommendations and attained a clear understanding of the situation, the manager can modify the production, delivery, and assembly schedules through planning and control tools. To reduce mental workload and support consistent decision-making, the scheduling tool is complemented by rule-based planning assistance that operates on the project intent information. Examples of such assistance include sorting elements by type or location, filtering by status, automatically reordering elements that have been delayed, and flagging elements that are delayed or defective. Any changes made through the scheduling tool update the project intent information, establishing a new baseline plan.
Finally, the updated plan is transmitted to the physical environment via communication tools. These tools convert the revised schedules and sequences into instructions for the workers and the supplier, which are then delivered through their respective interfaces. The workers and supplier execute the new instructions on site, closing the loop of the PDCA. Through this continuous cycle of monitoring, analysis, planning, and directive communication, the laboratory setup operationalizes DTC as a closed-loop planning and control system that can be systematically studied and experimented with.
4.3. DTC system architecture
Figure 5 details the technical system architecture that underpins the laboratory’s digital twin environment. A relational SQL database at its core stores the project intent and status information, together with detailed logs of all experimental events and user interactions. A Python server sits on top of this database and provides the main entry point for all read–write operations. It implements the data-fusion and interpretation logic described earlier and exposes a set of RESTful API endpoints that are used by all digital twin services and interfaces. In this way, every component of the system interacts with the digital twin through a consistent, centralized service layer, while the database remains hidden behind the Python server.
Technical system components and information flow in the laboratory setup.

Figure 5. Long description
The diagram is centered around a long horizontal purple bar labeled RESTful API Endpoints.
Above the central bar, from left to right:
- A QR Code Scanner points down to Factory Assistance and Reporting with the label Out: Piece scanned. This block also has an In: delivery schedule and Out: Piece delivered connection to the central bar.
- An SQL Database and Python Server are stacked vertically, connected by bidirectional arrows. The Python Server connects bidirectionally to the central bar.
- An Optimization Server connects to the central bar with an Out: alternative assembly sequences, sequence metrics label.
Below the central bar, from left to right:
- Experiment Control Interface connects with an Out: Exp Events Log (Start Day, End Day, etc.) arrow.
- Worker Assistance and Reporting connects bidirectionally with In: assembly sequence and Out: Element completed. It also points down to a second Q R Code Scanner labeled Out: Piece scanned.
- Planning and Control Interface connects bidirectionally with In: assembly sequence, element status and Out: assembly sequence.
- 3 D Progress Visualization connects with an In: assembly sequence, element status arrow.
- Recommendation Dashboard connects bidirectionally with In: alternative assembly sequences, sequence metrics and Out: assembly sequence.
On the far right, a WebSocket Trigger block facilitates a loop, receiving input from the Recommendation Dashboard and sending output to the Optimization Server.
Several interfaces connect the upstream supply and the experiment moderator to the core (left-hand side of Figure 5). The factory assistance and reporting interface supports the supplier in preparing and executing deliveries from the factory inventory. When the supplier scans a QR code on a precast element, the QR scanner sends the piece identifier to the interface, which forwards it via the REST API to the Python server and, in turn, to the database. The same interface retrieves the current delivery schedule from the server so that the supplier can see which pieces should be delivered and in what order. The experiment control interface allows the moderator to log key experimental events, such as the start and end of the experiment or of a workday, directly into the server with precise timestamps, creating a consistent experimental timeline that can later be aligned with the construction and decision-making records.
The worker assistance and reporting interface fulfils an analogous role for the on-site assembly activities. Assembly workers use QR code scanners to record the installation and completion of individual pieces. Through the REST API, these scans are sent to the Python server together with the corresponding element identifiers, which are then stored as element status updates in the database. At the same time, the interface pulls the up-to-date assembly sequence from the server and presents it to the workers as task instructions. This ensures that the workers always follow the current plan resulting from the latest scheduling decisions, and that their progress is fed back to the digital twin in a structured, machine-readable form.
At the center of the figure, the planning and control interface represents the primary planning and control interface for the construction manager. This interface corresponds to the scheduling tool described in Figure 2. It receives the current assembly sequence and element statuses from the server and presents them in an editable form. The manager can modify production, delivery, and erection sequences, after which the interface writes the updated assembly sequence back to the Python server via the REST API. These changes are then committed to the database as the new baseline plan. Adjacent to this, the 3D progress visualization service retrieves both the assembly sequence and the element status data and renders the current state of the project on a 3D model of the building, with elements color-coded according to their status. This visualization provides an immediate, spatially explicit picture of progress that supports situational awareness and complements the tabular and list-based views in the other interfaces.
On the right-hand side, the recommendation dashboard connects the operational system to an external optimization server. The recommendation dashboard communicates with the optimization server via WebSocket, which allows the optimization process to be triggered at predetermined times or in response to specific events without interrupting the rest of the system. When triggered, the optimization server pulls the relevant project intent and status data through the Python server, computes alternative assembly sequences together with their performance metrics, and sends these alternatives back to the recommendation dashboard. The dashboard then queries the server for the latest set of alternatives, presents them to the construction manager, and, if the manager selects one, sends the chosen assembly sequence to the Python server to be stored in the database and adopted as the new baseline.
In this way, the architecture integrates data capture, state management, visualization, planning, and optimization into a coherent technical system that realizes0 the DTC concept in the laboratory environment.
4.4. DTC system implementation
Building on the system architecture described in Section 4.3, this section summarizes the implemented software components that operationalize the monitoring–planning–control loop used in the laboratory experiments. The implementation integrates event capture on the factory floor and construction site, a shared server and database that store authoritative state with explicit plan versioning, and a set of manager-facing interfaces that support replanning and decision making. A detailed technical description of the implementation is provided as Supplementary Materials.
The operational loop begins with structured monitoring of production, delivery, and erection progress, implemented through two lightweight execution-facing interfaces that also provide task guidance to reduce reporting noise. At the factory, a delivery interface supports preparation and confirmation of shipments by aligning required type IDs and quantities with the current plan, thereby producing an auditable record of what has been released to the site and when. On-site, a worker interface (Figure 6) provides the current assembly sequence and location-based guidance (e.g., highlighting the next target element) while capturing erection start and completion events. Delivery planning operates under a fixed lead-time constraint, such that near-term commitments remain operationally stable while longer-horizon plans can be adjusted during replanning.
Worker’s assistance and reporting interface.

Figure 6. Long description
The interface is divided into three main sections.
1. Left Sidebar: Displays a digital clock at 10 56 11 and the date 09 09 2025. Below are session details: Current Session I D 154, Current Day I D 1, Current Element I D V 1044, and Current Type I D E W 25. Action buttons include U N D O, C O M P L E T E in green, SKI P, U N D O S K I P S, and a R E M O V E button in orange. A toggle for Show completed elements is active.
2. Central Grid Map: A large schematic layout on a grid background. The top half contains horizontal gray bars labeled with H-prefixed codes such as H 1001 through H 1080. The bottom half contains a complex network of vertical and horizontal segments labeled with V-prefixed codes. Most labels are black with white text, while some are green (V 1029, V 1031, V 1033, V 1034) or blue (V 1044).
3. Notifications and Footer: In the top right, three stacked notification boxes appear. The top two are blue and reference table worker erect record event insert and table monitor erect record event insert. The bottom box is green and states Worker erect record created. At the bottom of the screen is an Assembly Sequence section with a R E F R E S H T A B L E button and a R E S T A R T button in the bottom left corner.
These raw events are transformed into element-level project status information that downstream components can query consistently. A key modeling challenge is that physical pieces are tracked during production and shipping using piece/type identifiers, whereas the digital model defines fixed element positions; the system resolves the piece-to-element association at installation by combining erection scans with completion confirmations. The monitoring logic fuses delivery scans, erection scans, and completion records into a coherent lifecycle state per element (e.g., produced, delivered, erected-in-progress, installed), while retaining raw logs for traceability. To preserve continuity under imperfect connectivity, the system can record partial status information and reconcile missing identifiers when subsequent events become available.
A shared server and database provide the backbone that makes monitoring, planning, and decision support operate as a single system rather than isolated tools. The services are deployed in a containerized configuration and expose a REST API for session-scoped reads/writes (including plan updates and state queries), complemented by WebSocket-based notifications for low-latency propagation of plan or status changes to connected clients. All records persist in a relational database organized around two identifiers: a session identifier that tracks each experimental run and a plan identifier that versions the schedule across baseline and successive replanning cycles. At a category level, the schema stores event logs and scans, element status timelines, planning tables (assembly, production, and delivery schedules), and optimization outputs and user decisions; the Supplementary Materials provides the complete schema.
Managerial control is enacted through a planning and control interface (Figure 7) that represents the near-term and multi-day plan as a scheduling board. Each element is associated with a requested delivery/erection day, and status cues support rapid assessment of feasibility risk under current production and delivery constraints. When the manager confirms a revised plan, the system increments the plan identifier, writes updated planning tables, and propagates the new plan to the execution-facing interfaces, ensuring that field guidance and factory preparation reflect the current version. The interface also supports a controlled managerial decision point in the experiments (e.g., ordering a concrete pump truck for next-day slab concreting) so that downstream effects on progress and replanning can be observed.
Planning and control interface.

Figure 7. Long description
The interface is divided into three main horizontal sections.
At the top, a dark blue header displays Schedule Manager, Current Day 4, and user information. Below this are five white control panels. From left to right, they include Move elements between days, Assign status to elements, Decision-Making with green and orange buttons for factory and site coordination, Utility with blue and purple buttons for D T synchronization, and Status updates showing a green Status synced indicator.
The middle section contains a row of action buttons: Move to Top, Move to Bottom, Clear Selection, and Undo. Below these is the main schedule grid organized into eight vertical columns representing Day 1 through Day 8. Days 1 to 3 are grayed out as Past. Day 4 is highlighted in blue as Today. Day 5 is green for Delivery Fixed. Days 6 and 7 are orange for Production Fixed. Day 8 is light blue. Each column contains a list of task cards with alphanumeric codes like V 1 0 2 9 or H 1 0 0 3, accompanied by status color bars on the left and up or down arrow icons on the right.
The right sidebar contains two vertical modules. The top module, Owner’s Target, shows a goal of 2 Apartments with 0 Apartments currently delivered. The bottom module is a Status Legend with color-coded bars for Not Started, Delivering Tomorrow, Delivered, Erected, Concreted, Defective, Produced, and Committed for Production.
Three decision-support interfaces provide complementary views of the same authoritative state to support daily “Check” and replanning. First, a location-based dashboard summarizes progress at the apartment/zone level through a completion trajectory view and a table of key dates and aggregated statuses, enabling fast detection of divergence from targets without element-level inspection (Figure 8). Second, a Unity-based 3D visualization provides spatial context for both the planned sequence and the evolving execution state, supporting diagnosis of blocked areas and impacted dependencies; filtering by type, floor, apartment, and status reduces complexity when investigating disruptions (Figures 9 and 10). Third, a recommendation interface presents a small set of feasible alternative plans generated from the current state and managerial priorities, accompanied by summary metrics (e.g., cost proxy and risk score) and explanatory views that help compare alternatives against operational goals. Selecting an alternative updates the authoritative plan version and propagates it to the planning board and execution-facing interfaces (Figure 11). The target apartment delivery rate of the project is presented to the user in the left module in Figure 8 and in the top-right module in Figure 11.
Location-based visualization for manager decision support.

Figure 8. Long description
The dashboard is divided into two main sections.
On the left, the Apartment Completion Progress panel displays three key performance indicator cards at the top: 3 Completed, 16 Total, and 19% Complete. Below these is a line graph with the Y-axis labeled Apartments from 0 to 16 and the X-axis labeled Day from 1 to 33. The graph shows several trends:
* An orange line for In Progress peaks at 11 apartments on Day 8 before dropping to 8 on Day 9.
* A blue line for Actual Erected and a green line for Actual Concreted both rise to 3 apartments by Day 9.
* A dashed purple line represents Planned Completion, showing a stepped increase starting at Day 10 and reaching 16 apartments by Day 27.
* A dashed grey line represents the Target Delivery Rate.
On the right, the Completion Status table lists six apartments: A-1-1, A-1-4, A-2-8, A-2-1, A-2-4, and B-1-5. The table includes the following columns:
* Progress: Visual progress bars showing 100% for the first two apartments and ranging from 25% to 35% for the others.
* Status: Labeled as Complete in green or In Progress in orange.
* P. End: Planned end dates such as Day 20, Day 22, and Day 23.
* A Erect End and A. Con. End: Actual dates, both showing Day 8 and Day 9 for completed units.
* Element Status: Numerical counts of components.
* Elements: A grid of individual component IDs like V 1 0 3 1 and H 1 0 8 6, color-coded by their specific status.
2D plan view in the Visualization Interface at Day 0. The interface shows floor 1 layout with apartments (1–8) highlighted in green, an orientation indicator, and the color-coded status legend on the left. At this stage, no construction progress has been recorded, and the view represents the initial state of the project.

Figure 9. Long description
The interface is divided into several functional zones.
At the top, a status bar displays Current Construction Day 00, a search field H 1 0 2 4, and dropdown menus for Floor 1 and Work Package Show All.
On the far left, a vertical toolbar contains icons for 3 D modeling and navigation. Below this is a color-coded legend for construction status. The legend includes Red for Defective, Orange for Committed for Production, Yellow for Produced, Green for Delivering Tomorrow, Cyan for Delivered, Blue for Erected, and Purple for Fully Assembled Concreted.
In the center, the floor plan is oriented with a North arrow pointing upward. The layout consists of eight rectangular zones numbered 1 through 8, all outlined in bright green, indicating the Delivering Tomorrow status.
* Zone 1 is a large vertical rectangle on the West side.
* Zones 2, 3, 4, and 5 form the central corridor of the plan.
* Zones 6, 7, and 8 are clustered on the East side.
Internal structural details like stairwells and smaller rooms are shown in grey and white between the numbered green zones. The bottom left corner features a 2 D slash 3 D View toggle, and the bottom right corner has an Update Plans button.
(a) Zoomed-in 3D view of the erection step sequence, highlighting the planned order of installation; (b) 3D full status view of all elements on a selected floor, providing a spatial overview of production, delivery, and erection; (c) 2D status view; (d) 2D view of currently erected elements.

Figure 10. Long description
Panel a, top-left, shows a zoomed-in 3D view at Current Construction Day 0. Pink circular markers numbered 1 through 4 and teal markers numbered 1 through 10 indicate the planned erection sequence on a grey structural model.
Panel b, top-right, shows a full 3 D status view at Day 19. The floor model is color-coded. A legend on the left defines the colors: Red for Defective, Orange for Committed for Production, Yellow for Produced, Light Green for Delivering Tomorrow, Cyan for Delivered, Blue for Erected, and Purple for Fully Assembled or Concreted.
Panel c, bottom-left, presents a 2 D top-down status view at Day 24. The floor plan is filled with the same color-coding scheme as panel b, showing a mix of yellow, cyan, and purple zones.
Panel d, bottom-right, shows a 2 D view at Day 26. The majority of the floor plan is now colored purple, indicating that most elements are Fully Assembled or Concreted, with some grey areas representing remaining work.
Each panel includes a top navigation bar with fields for Element name, Floor, and Work Package, and an Update Plans button at the bottom right.
Optimization and decision support interface.

Figure 11. Long description
The dashboard is divided into four main sections.
Top-left panel: Recommended Sequences for Day 0. It lists a Current Plan C P with a cost of 39,500 dollars and risk of 163.92, followed by five numbered options. Option 1 is the cheapest at 20,500 dollars with a risk of 142.79.
Top-center panel: A 3 D isometric view of a building floor plan with specific sections highlighted in yellow. Overlays include factory metadata for V1 03 0, navigation controls, and toggle visibility for walls, slabs, stairs, and floors. Below this is a linear Apartment Completion Order sequence from f 1-1 to f 2-7.
Top-right panel: Predicted Apartment Completion Progress line graph. The Y-axis represents Apartments Completed from 0 to 16, and the X-axis represents Project Day from 0 to 31. It compares a Target and Current Plan against five numbered scenarios, showing a stepped upward trend.
Bottom-left panel: Recommended Assembly and Delivery Plan for Sequence 1. It displays a calendar view for Day 1 through Day 14. Each day lists five components, such as V1 02 9 or H 1 00 9, color-coded by risk level where yellow is 1 apartment impacted and red is 3 or more.
Bottom-right panel: Predicted Apartment Throughput line graph. The Y-axis shows Apartments per Day from 0 to 5.5, and the X-axis shows Project Day. It features sharp peaks indicating high-volume delivery days, with a dashed horizontal line representing the target of 0.67 per day.
An optimization service operates behind the recommendation interface to generate the alternative plans presented to the manager. The service uses a two-stage logic: it first enumerates feasible assembly sequences under precedence and spatial heuristics while accounting for partial progress and prioritized areas, and it then schedules production and deliveries to realize candidate sequences under capacity, lead-time, and delivery constraints. The service outputs ranked alternatives together with feasible production and delivery schedules and feasibility diagnostics (e.g., unschedulable elements or bottleneck traces). The system persists these outputs for review and writes the selected plan back to the planning tables as a new plan version.
Together, these components operationalize a traceable closed-loop workflow in which monitored events continuously update the authoritative project state, managers intervene through versioned plans, and optimization-backed recommendations accelerate replanning under controlled experimental constraints. A detailed technical description of the implementation is provided as Supplementary Materials.
5. Validation
This section validates that the laboratory setup functions as a DTC testbed and can support complete experimental runs under controlled yet realistic conditions. The focus is on technical viability and experimental usability of the coupled physical–digital environment (i.e., whether the closed-loop pipeline described in Section 4 operates consistently).
To ensure the laboratory setup faithfully represented the reference project, face validation was performed using ground truth data and expert review. The authors analyzed four months of time-lapse video covering the entire frame erection phase of the case study building to calibrate the simulation against the real-world execution. Additionally, a semi-structured interview was conducted with the project manager of the case study project. This process verified that the modeled building is a good representation of the real structure and that the structural and spatial constraints encoded in the system are accurate, ensuring that the alternative construction sequences explored in the live experiments are practically feasible. Furthermore, the validation confirmed that the simulated construction processes capture the key precedence and method constraints observed in the reference project, including the requirement for temporary bracing during wall erection and the follow-on process logic that triggers joint concreting and subsequent slab-topping operations. It also confirmed that the model reproduces the intended coupling between factory production, transportation, and site assembly through explicit lead-time and schedule-freeze rules, so that production capacity and batching decisions, committed near-term deliveries, and on-site inventory availability jointly constrain the feasible assembly sequence at each replanning step. These constraints are enforced consistently in both the planning algorithms and the underlying data schema.
Functional validation was conducted through 10 full-project runs of the scaled precast residential building across two scenarios. In the no assistance (baseline) scenario (5 runs), the manager relied on direct observation to monitor progress and respond to disruptions and used only the planning and control tool without any decision support from the digital twin. In the full DTC workflow scenario (5 runs), the complete DTC loop operated end-to-end, integrating reality capture, data interpretation and fusion, optimization-based recommendation, and decision-support visualization as described in Section 4.4.
Each full-project run lasts approximately 3–4 hours. Throughout these sessions, the DTC system ran smoothly without error, recorded the precise install time of every building element, processed the status, and updated visualizations in near real-time. In all runs, student workers executed the physical work (delivery, erection, and concreting tasks) while a manager participant attended the laboratory and performed planning using the provided interfaces. Across the 10 runs, manager participants were a mix of industry practitioners and graduate students with prior construction experience, with a different manager involved in each run.
Figure 12 reports construction progress over time for all 10 runs (spaghetti plot), with individual trajectories color-coded by scenario (blue: no assistance (baseline); orange: full DTC workflow) and thicker lines indicating the mean trajectory for each scenario. The figure shows that, on average, apartments were completed earlier in the full DTC workflow runs than in the baseline runs, and that the run-to-run trajectories in the full DTC workflow scenario are more tightly clustered. By contrast, the baseline runs exhibit larger session-to-session dispersion in progress.
Construction progress through time for the ten validation runs.

Figure 12. Long description
The x-axis represents Project Day from 0 to 35. The primary y-axis on the left shows Apartments completed from 0 to 16. The secondary y-axis on the right shows Floors completed from 0 to 2.
Data series include:
- Target: A black dashed line showing a steady step-wise increase, reaching 16 apartments by day 25.
- Full DTC Workflow: Represented by orange lines. The thick orange line is the average, showing a consistent upward trend that reaches the target of 16 apartments around day 27. Individual session lines in light orange cluster closely around this average.
- No Assistance: Represented by blue lines. The thick blue line is the average, showing a slower start and a significant plateau between days 19 and 28 at 8 apartments, before rising to reach 16 apartments by day 31. Individual session lines in light blue show high variability, with some sessions finishing as late as day 35.
Overall, the Full D T C Workflow average tracks closer to the Target line than the No Assistance average.
To test whether the apparent differences between the two sets of curves observed in Figure 12 reflect systematic performance differences rather than random run-to-run variation, a statistical comparison was conducted between the “no assistance” and “full DTC” workflow scenarios. The analysis examined three outcome metrics derived from each run: time to full project completion, time to first-floor completion, and cumulative deviation from the target apartment delivery rate. The last metric was defined as the total apartment-days by which the realized completion curve lagged behind the reference demand curve, showing the client’s apartment delivery schedule requirement that was provided to participants (the stepped demand lines in Figures 8 and 11). Whereas the first two metrics measure single-point outcomes only, the cumulative deviation metric measures adherence to the required delivery trajectory over 16 points through the full project duration. Because each scenario included only five runs and the underlying distribution of the outcome values could not be assumed to be normal, the Mann–Whitney U test (Nachar et al., Reference Nachar2008) was selected as the primary inferential test, with statistical significance assessed at p < 0.05 using Equation (1). The test ranks all observed outcomes across both scenarios and evaluates whether one scenario consistently achieves better ranks than the other. Cohen’s d (Cohen, Reference Cohen2013) was reported alongside the p-values as a standardized measure of effect size using Equation (2), with values above 0.8 interpreted as large effects, so that the analysis evaluates not only whether the scenarios differ but also whether the magnitude of the difference is practically meaningful. The formula expresses the difference between the scenario means relative to the typical variation between runs, making it easier to judge the practical size of the effect.


where
$ {R}_1 $
 = sum of ranks of observations in group 1 after ranking all observations from both groups together;
$ {n}_1={n}_2=5 $
= sum of ranks of observations in group 1 after ranking all observations from both groups together;
$ {n}_1={n}_2=5 $
 = number of observations in group 1 and group 2;
$ {\overline{x}}_1,{\overline{x}}_2 $
= number of observations in group 1 and group 2;
$ {\overline{x}}_1,{\overline{x}}_2 $
 = mean values of the metric for groups 1 and 2;
$ {s}_1^2,{s}_2^2 $
= mean values of the metric for groups 1 and 2;
$ {s}_1^2,{s}_2^2 $
 = variances of the metric for group 1 and group 2;
$ {s}_p $
= variances of the metric for group 1 and group 2;
$ {s}_p $
 = pooled standard deviation.
The results in Table 1 indicate that the full DTC workflow achieved both faster and more stable project delivery than the “no assistance” workflow. Reported values are mean ± standard deviation across the five runs in each scenario, showing that full project completion improved from 31.0 ± 2.6 days in the no assistance condition to 26.8 ± 0.8 days under the full DTC workflow, with a statistically significant Mann–Whitney result (p = 0.015 < 0.05) and a large effect size (d = 2.14 > 0.8). The first-floor milestone showed a similar improvement, from 19.0 ± 2.4 to 16.4 ± 1.3 days, with a large effect size (d = 1.36 > 0.8), although the p-value of 0.053 indicates that this difference falls just above the conventional two-tailed significance threshold. The strongest separation was found for cumulative deviation from the target delivery rate, which decreased from 139.4 ± 21.17 apartment-days to 61.20 ± 6.38 apartment-days, corresponding to a 56% reduction, a statistically significant difference (p = 0.008 < 0.05), and an exceptionally large effect size (d = 5.01 > 0.8).
Statistical results from the validation runs

Table 1. Long description
The table consists of six columns: Metric, No assistance, DTC workflow, Difference, p-value U, and Cohen’s d.
* Row 1: Days to full project complete. No assistance is 31.0 plus or minus 2.6. DTC workflow is 26.8 plus or minus 0.8. Difference is minus 4.2 days or 14 percent. p-value is 0.015. Cohen’s d is 2.14.
* Row 2: Days to 1st floor complete. No assistance is 19.0 plus or minus 2.4. DTC workflow is 16.4 plus or minus 1.3. Difference is minus 2.6 days or 14 percent. p-value is 0.053. Cohen’s d is 1.36.
* Row 3: Deviation from target delivery rate. No assistance is 139.40 plus or minus 21.17. DTC workflow is 61.20 plus or minus 6.38. Difference is minus 78.2 apt-days or 56 percent. p-value is 0.008. Cohen’s d is 5.01.
In summary, these results show that the data-centric DTC approach to planning and control can lead to earlier project completion and a more stable production flow.
To complement the run evidence, semi-structured post-experiment interviews were used to assess perceived feasibility and realism from the manager’s perspective. Responses from managers in the no assistance (baseline) scenario frequently emphasized uncertainty due to a lack of timely, consolidated site status information. Participants described the process as “very chaotic” and noted that manual monitoring “dominated my time” because they “had to track everything manually,” with one manager reflecting that they “didn’t have knowledge of what actually happened on site” and therefore felt “there was no point in making any changes.” In contrast, managers in the full DTC workflow scenario highlighted improved situational awareness enabled by the integrated interfaces, reporting that they were “aware of everything using the DT” and that seeing progress across the interfaces made it “easy to keep track,” which in turn supported more confident strategy selection.
These qualitative observations are consistent with the quantitative results, as participants in the full DTC workflow scenario consistently reported lower levels of uncertainty and stronger confidence in their ability to keep track of element delivery and on-site erection, compared to participants in the baseline scenario. Quantitatively, the full DTC workflow participants reported a 25% improvement in their ability to track project progress relative to the baseline, alongside a 62% reduction in perceived uncertainty and an average 40% increase in perceived confidence.
Subsequent to these validation tests, the authors have conducted an additional 30 full-project runs to investigate aspects of DTC performance. The findings will be reported in follow-on publications.
6. Discussion
The first aim of this study was to demonstrate the feasibility of a comprehensive DTC system by designing, implementing, and validating a laboratory setup that can operate as a closed loop. Second, the study aimed to provide a testbed for research and development of DTC systems and practices, which requires that the setup is repeatable, controllable, and comparable across runs. The validation runs reported in Section 5 indicate that both aims were achieved: the coupled physical and digital environment supported repeated full project executions, and it enabled managers to interact with the decision support and planning and control services without major usability barriers. The DTC information system demonstrated the capacity to transform raw monitoring data into high-level planning knowledge. By merging heterogeneous data streams from factory scanning, on-site tracking, and completion reporting, the system generates coherent project status information. This status is visualized alongside project intent information in dashboards to support situational awareness and serves as the necessary input for the optimization service. The service processes the combined information to generate project intent knowledge in the form of ranked, feasible assembly alternatives and performance metrics, which are presented as actionable recommendations to the manager.
6.1. DTC system feasibility
The validation shows that the implemented DTC system can sustain an end-to-end DTC loop that covers the production flow from the supply chain to erection on site. The system links monitoring of factory and site events to a consistent status model, then uses that status to generate and present planning alternatives, and finally converts managerial decisions into revised production, delivery, and erection instructions that propagate back to the factory and workers. The same database maintains plan versions, progress, and directives across the production transport erection chain, which keeps planning decisions coupled rather than fragmented across independent tools. The setup therefore demonstrates technical feasibility for a single source of truth that supports the intent status action pipeline across organizational boundaries, within the scope and abstraction defined in this study.
The validation runs also confirm that the setup provides an experimental method for testing DTC’s impact on planning and control decisions. Participants with industry experience recognized the decision situation and the disturbance patterns as representative at the level of production control, while the boundary conditions remained stable enough to repeat the same project under different monitoring and decision support configurations. This combination supports controlled comparisons, since the setup can hold the physical scenario constant while varying the digital twin configuration and the human decision conditions. It also supports systematic accumulation of evidence, since the setup compresses project time and reduces field risk, which makes repeated runs practical.
Compared with existing experimental methods, the testbed is well-suited for examining how DTC capabilities influence planning and control decisions, since it couples a realistic production process with human managers and workers in the loop. Simulation-only studies enable rapid iteration and broad parameter sweeps, but they omit human decision makers and workers and cannot reflect the socio-technical tensions that often shape plan changes (Martinez and Ioannou, Reference Martinez and Ioannou1999; Abdelmegid et al., Reference Abdelmegid, González, Poshdar, O’Sullivan, Walker and Ying2020; Korb and Sacks, Reference Korb and Sacks2021). Serious games also rely on repeated runs to study situation awareness, yet they typically use simplified production representations and a narrower system scope (Sacks et al., Reference Sacks, Esquenazi and Goldin2007; Warcup and Reeve, Reference Warcup and Reeve2014; Martinez et al., Reference Martinez, Yeung, Sacks, Shahaf and Sharoni2023). Field demonstrators offer strong realism, but their boundary conditions and time scales make controlled replication difficult, whereas the laboratory setup supports comparative experiments that remain grounded in observed operation.
6.2. Opportunities for future research
By establishing a functioning, repeatable DTC loop in a controlled environment, the laboratory setup also creates a range of new research opportunities. One direction concerns information design and situational awareness. The visualization interfaces and dashboards can be modified while the underlying project and monitoring logic remain constant. Experiments can vary the amount of detail presented, the balance between spatial and abstract representations, and the latency and reliability of updates. The resulting runs can show how these choices affect plan adaptations, flow stability, and managers’ perceived workloads.
A second direction concerns human decision-making under disruptions. Experiments can vary in time pressure, the frequency and severity of defects and delivery delays, and whether decision support recommendations are available. Manager characteristics can also be varied, for example, prior production control experience or familiarity with lean planning practices. Because decisions are taken within the system and logged together with their context, the data can be used to examine how managers form mental models, how they prioritize competing objectives, and when they use or ignore algorithmic suggestions.
A third direction concerns automated and hybrid control. The same loop can be closed by a human manager, by an algorithm that receives status and issues schedules, or by a mixed policy in which the algorithm proposes actions and the manager approves or overrides them. This enables direct comparison of human, automated, and hybrid modes under identical scenario conditions.
A fourth direction concerns uncertainty, variability, and monitoring quality. Task duration variance, defect distributions, delivery delays, and monitoring errors can be adjusted between runs. This supports tests of how the value of specific DTC capabilities, e.g., enhanced monitoring or increased automation, changes between low variance and high variance environments.
6.3. Limitations
Some limitations bound the transfer of the results to practice. The first concerns physical and temporal abstraction. The scaled building, simplified geometry, and discrete task structure reduce the complexity of full-scale sites with multiple crews, overlapping work fronts, and detailed safety constraints. These abstractions are appropriate for capturing the core production-control logic and for keeping the experiments tractable, but they mean that decision-making behavior observed in the laboratory may not thoroughly reflect decisions made in more complex, continuous-time settings.
The second limitation concerns organizational abstraction. A single construction manager holds the central decision-making role, and suppliers follow issued schedules, whereas real projects distribute authority and include negotiation and feedback. This abstraction keeps the experiments manageable and the loop observable, but it limits analysis of multi-actor governance and inter-organizational contracting dynamics. In addition, the limited number of runs and variation in manager participants constrain the strength of inference regarding the magnitude and consistency of observed performance improvements, although these factors do not affect the demonstration of the technical feasibility of the integrated DTC workflow.
A further limitation concerns external validity with respect to commercial and operational feasibility. The experimental setting does not vary project scale; it abstracts away contractual arrangements and commercial relationships and it simplifies resource configurations arising from multiple projects or market conditions. Therefore, the results should not be seen as direct evidence of real-world implementation performance. The study demonstrates the technical feasibility of a comprehensive DTC workflow under controlled conditions, but it does not establish how such systems would perform under the full variability and constraints of practice. As such, conclusions regarding performance improvement should be interpreted as indicative rather than predictive of field outcomes.
Within these bounds, the implemented configuration provides a reference architecture for a comprehensive DTC system and a practical testbed for DTC research. It documents how monitoring, status modelling, optimization, visualization, and directive issuance can operate as one loop across the production transport erection chain, and it provides a platform for systematic comparison of alternative configurations and control policies. Future extensions can add richer physical models, finer time discretization, additional decision roles, and more active supplier behavior while preserving the same PDCA logic, which supports continued empirical and design science investigation of comprehensive DTC systems.
7. Conclusion
Prior to this work, the feasibility of operation of a comprehensive Digital Twin Construction system across a holistic production system that links supply chain decisions with construction on-site had not been demonstrated. At the same time, the literature reports narrow implementations and offers little comparable empirical evidence on how DTC systems perform in practice, how managers use them, or their impact on project outcomes.
This work addressed these gaps by designing a laboratory-scale coupled physical and digital environment that represents production as a holistic system with interacting subsystems and supports a PDCA loop from intent to status to action. The DTC system was designed and implemented as an end-to-end pipeline that captures progress on the physical site, updates a digital twin repository, and propagates directives and decision support back to participants through integrated interfaces. The setup was validated through repeated full project runs that exercised the complete loop and demonstrated consistent operation under a controlled experimental protocol.
The resulting testbed provides a reference architecture and a working implementation that researchers can reproduce, extend, and instrument. It also offers a practical platform for systematically varying disruptions, information quality, and control policies while keeping the underlying project context stable. By enabling repeatable human-in-the-loop experiments on planning and control, the setup supports the generation of rich empirical evidence on DTC-enabled production management. Future work can use the platform to study how alternative monitoring, decision support, and automation designs influence managerial decisions and project outcomes.
Abbreviations
- ABS
-
Agent-Based Simulation
- API
-
Application Programming Interface
- BIM
-
Building Information Modelling
- DES
-
Discrete-Event Simulation
- DTC
-
Digital Twin Construction
- GIS
-
Geographic Information System
- IoT
-
Internet of Things
- LPS
-
Last Planner System
- MEP
-
Mechanical, Electrical, and Plumbing
- PDCA
-
Plan Do Check Act
- RDF
-
Resource Description Framework
- REST
-
Representational State Transfer
- RFID
-
Radio Frequency Identification
- SQL
-
Structured Query Language
- TBM
-
Tunnel Boring Machine
- UAV
-
Unmanned Aerial Vehicle
Supplementary material
The supplementary material for this article can be found at http://doi.org/10.1017/dce.2026.10057.
Data availability statement
The validation run data supporting the findings of this study are available in Mendeley Data at Yeung (Reference Yeung2026) (http://doi.org/10.17632/4fvm55w44z.1).
Acknowledgements
During the preparation of this work, the authors used ChatGPT and Google Gemini to proofread and improve readability. After using these tools/services, the authors reviewed and edited the content as needed and take full responsibility for the content of the publication.
Author contribution
Conceptualization: T.Y., S.G., D.S., R.S.; Data curation: T.Y., S.G., J.L.; Formal Analysis: T.Y., S.G.; Funding Acquisition: D.S., R.S.; Investigation: T.Y., J.L., D.S., R.S.; Methodology: T.Y., H.Y., D.S., R.S.; Project Administration: T.Y., D.S., R.S.; Resources: D.S., R.S.; Software: T.Y. (Lead); S.G.; H.Y. Supervision: D.S.; R.S. Validation: T.Y., S.G., J.L., H.Y.; Visualization: T.Y., S.G.; Writing—Original Draft: T.Y. (Lead), R.S.; Writing—Review & Editing: T.Y., S.G., J.L., H.Y., D.S., R.S.
Funding statement
This work was funded in part under grant No. 2033719 from the Israel Ministry of Science, Technology and Innovation and the Israel Ministry of Construction and Housing. The funder had no role in study design, data collection and analysis, decision to publish, or preparation of the manuscript.
Competing interest
The authors declare there is no competing interest that could have otherwise influenced the outcome of this study.


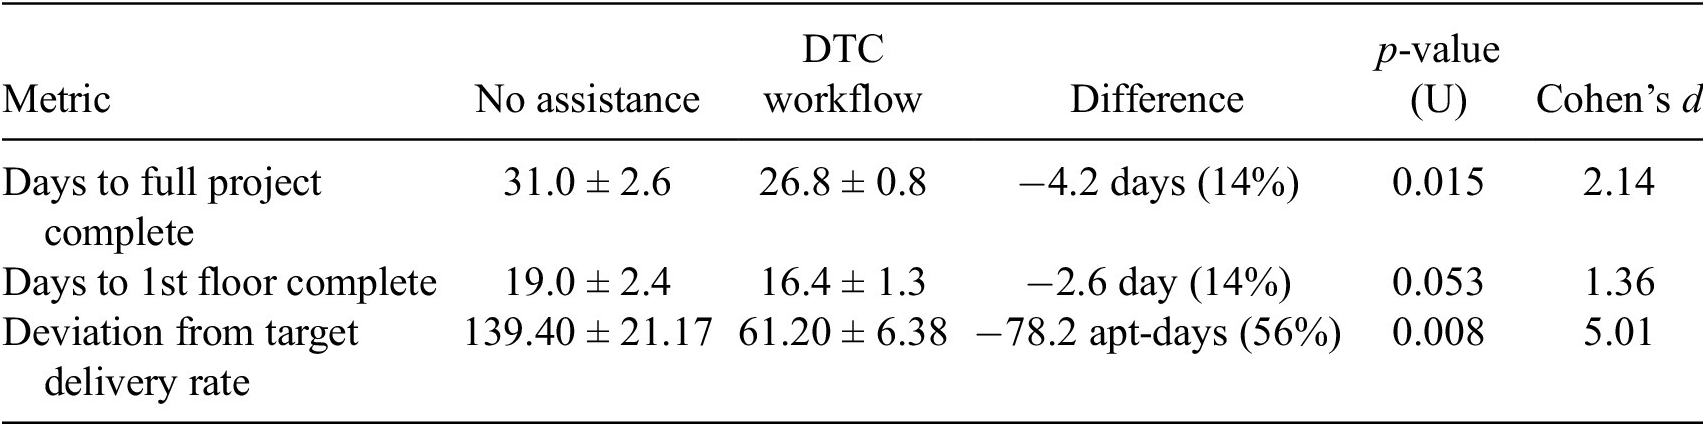


 Open access
Comments
No Comments have been published for this article.