


1. Introduction
The Magellanic Stream (MS) is a tail of diffuse neutral atomic hydrogen (HI) that formed from tidal and ram pressure interactions of the Small and Large Magellanic Clouds (SMC and LMC) with each other and with the Milky Way. At a metallicity of approximately 10 $\%$
of the solar value (Fox et al. Reference Fox2013), the MS is far less chemically enriched than the Milky Way or the LMC (45–50
$\%$
of the solar value (Fox et al. Reference Fox2013), the MS is far less chemically enriched than the Milky Way or the LMC (45–50 $\%$
solar), though comparable with the SMC (10–20
$\%$
solar), though comparable with the SMC (10–20 $\%$
solar, Rolleston, Trundle, & Dufton Reference Rolleston, Trundle and Dufton2002; Fox et al. Reference Fox2013). While the part of the MS close to the Clouds has an estimated distance of 50–65 kpc, (Keller & Wood Reference Keller and Wood2006), distance to the tip of the Stream is observationally not well constrained and ranges from 20 (McClure-Griffiths et al. Reference McClure-Griffiths2008; Casetti-Dinescu et al. Reference Casetti-Dinescu2014) to 100 kpc (Chandra et al. Reference Chandra2023). Other simulations suggest further distances up to 100 kpc (Besla et al. Reference Besla2010; Lucchini, D’Onghia, & Fox Reference Lucchini, D’Onghia and Fox2021) as well.
$\%$
solar, Rolleston, Trundle, & Dufton Reference Rolleston, Trundle and Dufton2002; Fox et al. Reference Fox2013). While the part of the MS close to the Clouds has an estimated distance of 50–65 kpc, (Keller & Wood Reference Keller and Wood2006), distance to the tip of the Stream is observationally not well constrained and ranges from 20 (McClure-Griffiths et al. Reference McClure-Griffiths2008; Casetti-Dinescu et al. Reference Casetti-Dinescu2014) to 100 kpc (Chandra et al. Reference Chandra2023). Other simulations suggest further distances up to 100 kpc (Besla et al. Reference Besla2010; Lucchini, D’Onghia, & Fox Reference Lucchini, D’Onghia and Fox2021) as well.
To understand the evolution of the interstellar medium (ISM) and the process of star formation, it is important to examine a variety of interstellar environments. A necessary condition for star formation is dense, cold gas, in which self-gravity is able to overcome thermal, turbulent, and magnetic pressures. This gas is usually rich with molecules, particularly molecular hydrogen (H $_2$
). Due to the MS’s low metallicity and extended, highly diffuse nature, it offers an extremely different laboratory for studying the early stages of molecule formation (and potentially star formation, e.g. Price-Whelan et al. Reference Price-Whelan2019) than the chemically enriched, cold, dense, molecular clouds in the plane of the Milky Way. While the MS is the product of tidal and ram-pressure stripping and not a direct analogue for sites of primordial star formation, it nevertheless provides a nearby laboratory to study gas in some of the conditions that would have been present at higher redshifts (Hammer et al. Reference Hammer2015; Murray et al. Reference Murray2015; Wang et al. 2019; Galametz et al. Reference Galametz2020).
$_2$
). Due to the MS’s low metallicity and extended, highly diffuse nature, it offers an extremely different laboratory for studying the early stages of molecule formation (and potentially star formation, e.g. Price-Whelan et al. Reference Price-Whelan2019) than the chemically enriched, cold, dense, molecular clouds in the plane of the Milky Way. While the MS is the product of tidal and ram-pressure stripping and not a direct analogue for sites of primordial star formation, it nevertheless provides a nearby laboratory to study gas in some of the conditions that would have been present at higher redshifts (Hammer et al. Reference Hammer2015; Murray et al. Reference Murray2015; Wang et al. 2019; Galametz et al. Reference Galametz2020).
The MS has been extensively imaged in HI (e.g. Putman et al. Reference Putman, Staveley-Smith, Freeman, Gibson and Barnes2003). The HI observations of the tip of the MS, the region farthest away from the MCs (Stanimirović et al. Reference Stanimirović2008; Nidever et al. Reference Nidever, Majewski, Butler Burton and Nigra2010), revealed several long filaments, demonstrating that the MS is very extended and with significant small-scale HI structure. The wealth of observational data (e.g. Weiner & Williams Reference Weiner and Williams1996; Fox et al. Reference Fox2014; For et al. Reference For, Staveley-Smith, Matthews and McClure-Griffiths2014; Kim, Zheng, & Putman Reference Kim, Zheng and Putman2024) suggests that the MS has a complex multi-phase structure that spans a large range in gas densities and ionisation conditions. About 15% of hydrogen clouds in the sample of Stanimirović et al. (Reference Stanimirović2008) have velocity profiles which suggest two temperature components (one cooler at $ \lt 2\,000\,\mathrm{K}$
, and one warmer at
$ \lt 2\,000\,\mathrm{K}$
, and one warmer at $ \lt 13\,000\,\mathrm{K}$
). As summarised in Stanimirovic & Gallagher (Reference Stanimirovic and Gallagher2010), the existence of the multi-phase medium in the MS, embedded in the ambient hot (
$ \lt 13\,000\,\mathrm{K}$
). As summarised in Stanimirovic & Gallagher (Reference Stanimirovic and Gallagher2010), the existence of the multi-phase medium in the MS, embedded in the ambient hot ( $10^6\,\mathrm{K}$
) Galactic halo gas, is surprising considering Stream’s low metallicity, interstellar radiation field, and relevant heating and cooling rates (Wolfire et al. Reference Wolfire, McKee, Hollenbach and Tielens1995; Sternberg, McKee, & Wolfire Reference Sternberg, McKee and Wolfire2002). Even more surprisingly, Matthews et al. (Reference Matthews2009) detected the first HI absorption lines against radio background sources located behind the MS. The two detected absorption features suggest temperatures of the absorbing clouds of 70–80 K, and hydrogen column densities of
$10^6\,\mathrm{K}$
) Galactic halo gas, is surprising considering Stream’s low metallicity, interstellar radiation field, and relevant heating and cooling rates (Wolfire et al. Reference Wolfire, McKee, Hollenbach and Tielens1995; Sternberg, McKee, & Wolfire Reference Sternberg, McKee and Wolfire2002). Even more surprisingly, Matthews et al. (Reference Matthews2009) detected the first HI absorption lines against radio background sources located behind the MS. The two detected absorption features suggest temperatures of the absorbing clouds of 70–80 K, and hydrogen column densities of $2\times 10^{20}\,\,\mathrm{cm}^{-2}$
. Dempsey et al. (Reference Dempsey, McClure-Griffiths, Jameson and Buckland-Willis2020) searched for HI absorption in the far outskirts of the SMC – where the metallicities are similar to those in the MS (the SMC is thought to be the origin of much of the MS gas; D’Onghia & Fox Reference D’Onghia and Fox2016, and references therein) – and detected cold HI with high confidence in two out of five positions. They estimated cold HI properties as having spin temperature
$2\times 10^{20}\,\,\mathrm{cm}^{-2}$
. Dempsey et al. (Reference Dempsey, McClure-Griffiths, Jameson and Buckland-Willis2020) searched for HI absorption in the far outskirts of the SMC – where the metallicities are similar to those in the MS (the SMC is thought to be the origin of much of the MS gas; D’Onghia & Fox Reference D’Onghia and Fox2016, and references therein) – and detected cold HI with high confidence in two out of five positions. They estimated cold HI properties as having spin temperature $\sim 100$
K and column density of
$\sim 100$
K and column density of $(6-16) \times 10^{20}$
cm
$(6-16) \times 10^{20}$
cm $^{-2}$
.
$^{-2}$
.
Remarkably, molecular hydrogen ( $\text{H}_{2}{}$
) has also been detected within the MS, measured through UV absorption towards the Seyfert galaxy NGC 3783 (Sembach et al. Reference Sembach, Howk, Savage and Shull2001; Wakker Reference Wakker2006; Richter et al. Reference Richter2013) and towards the quasar Fairall 9 (Richter et al. Reference Richter, Sembach, Wakker and Savage2001; Wakker Reference Wakker2006; Richter et al. Reference Richter2018), in diffuse environments with the HI column density
$\text{H}_{2}{}$
) has also been detected within the MS, measured through UV absorption towards the Seyfert galaxy NGC 3783 (Sembach et al. Reference Sembach, Howk, Savage and Shull2001; Wakker Reference Wakker2006; Richter et al. Reference Richter2013) and towards the quasar Fairall 9 (Richter et al. Reference Richter, Sembach, Wakker and Savage2001; Wakker Reference Wakker2006; Richter et al. Reference Richter2018), in diffuse environments with the HI column density $ \lt 10^{20}$
cm
$ \lt 10^{20}$
cm $^{-2}$
. These observations suggest
$^{-2}$
. These observations suggest $\text{H}_{2}$
column densities
$\text{H}_{2}$
column densities $N(\mathrm{H_2}) \sim 10^{18}\,{{\,\mathrm{cm}^{-2}}}{}$
and excitation temperatures of
$N(\mathrm{H_2}) \sim 10^{18}\,{{\,\mathrm{cm}^{-2}}}{}$
and excitation temperatures of $\sim 100\,\mathrm{K}$
. Lehner (Reference Lehner2002) also detected more diffuse
$\sim 100\,\mathrm{K}$
. Lehner (Reference Lehner2002) also detected more diffuse $\text{H}_{2}$
in the direction of the Magellanic Bridge, located between the SMC and the LMC, with
$\text{H}_{2}$
in the direction of the Magellanic Bridge, located between the SMC and the LMC, with $N(\text{H}_{2}{})=2.7\times10^{15}\,{{\,\mathrm{cm}^{-2}}}{}$
. Together, these observations indicate that molecular hydrogen can form and survive in the diffuse environments that exist in the MS and the Bridge, far from the main bodies of the SMC and LMC.
$N(\text{H}_{2}{})=2.7\times10^{15}\,{{\,\mathrm{cm}^{-2}}}{}$
. Together, these observations indicate that molecular hydrogen can form and survive in the diffuse environments that exist in the MS and the Bridge, far from the main bodies of the SMC and LMC.
While the Magellanic Bridge contains young stars (Irwin, Kunkel, & Demers Reference Irwin, Kunkel and Demers1985), numerous stellar searches in the MS were unsuccessful (e.g. Mathewson et al. Reference Mathewson, Ford, Schwarz, Murray and Burton1979). Only very recently, Chandra et al. (Reference Chandra2023) identified 13 stars that are likely located in the MS at a distance of 60–120 kpc. Some of those 13 stars are metal-rich and belong to the recently formed tidal counterpart to the MS, but other stars are metal-poor and possibly originated from the SMC outskirts during an earlier interaction between the Clouds. Zaritsky et al. (Reference Zaritsky2020) also detected 15 stars of SMC metallicity with velocities of the MS likely formed by a tidal interaction of the MS with other compact clouds in the outer edges of the MW. Following the star formation models, we would expect that molecular gas can form and survive in the MS if some of star formation has indeed occurred there.
Previous direct detections of $\text{H}_{2}$
in the MS have been valuable for characterising molecule formation in this extreme environment, but these measurements have been extremely rare because molecular hydrogen lacks a permanent electric dipole moment, making it extremely difficult to detect in diffuse environments such as the MS. Instead, observations from other molecular species – which are much easier to detect in emission and absorption – are most often used to trace the molecular content of the gas in these environments. While carbon monoxide (CO) – the most common tracer of molecular gas in galaxies – has been detected in emission in several positions in the Magellanic Bridge (Muller, Staveley-Smith, & Zealey Reference Muller, Staveley-Smith and Zealey2003; Mizuno et al. Reference Mizuno2006), no detections of CO emission exist for the MS. Most metallicity estimates suggest that the MS was formed out of the SMC gas, however metallicity variations along the MS suggest some mixing of the SMC/LMC gas (Fox et al. Reference Fox2013; Richter et al. Reference Richter2013). Several studies (e.g. Richter et al. Reference Richter2013) suggest that the MS likely has a clumpy but widespread diffuse molecular phase that is enabled by efficient H
$\text{H}_{2}$
in the MS have been valuable for characterising molecule formation in this extreme environment, but these measurements have been extremely rare because molecular hydrogen lacks a permanent electric dipole moment, making it extremely difficult to detect in diffuse environments such as the MS. Instead, observations from other molecular species – which are much easier to detect in emission and absorption – are most often used to trace the molecular content of the gas in these environments. While carbon monoxide (CO) – the most common tracer of molecular gas in galaxies – has been detected in emission in several positions in the Magellanic Bridge (Muller, Staveley-Smith, & Zealey Reference Muller, Staveley-Smith and Zealey2003; Mizuno et al. Reference Mizuno2006), no detections of CO emission exist for the MS. Most metallicity estimates suggest that the MS was formed out of the SMC gas, however metallicity variations along the MS suggest some mixing of the SMC/LMC gas (Fox et al. Reference Fox2013; Richter et al. Reference Richter2013). Several studies (e.g. Richter et al. Reference Richter2013) suggest that the MS likely has a clumpy but widespread diffuse molecular phase that is enabled by efficient H $_2$
self-shielding and the absence of local UV sources (Fox Reference Fox2005).
$_2$
self-shielding and the absence of local UV sources (Fox Reference Fox2005).
In the Milky Way, observations of the molecule $\text{HCO}^{+}$
in absorption are commonly used to trace diffuse molecular gas.
$\text{HCO}^{+}$
in absorption are commonly used to trace diffuse molecular gas. $\text{HCO}^{+}$
is readily detected in absorption in directions with
$\text{HCO}^{+}$
is readily detected in absorption in directions with $A_V\gtrsim0.25\,\mathrm{mag}$
(e.g. Lucas & Liszt Reference Lucas and Liszt1996; Rybarczyk et al. Reference Rybarczyk2022b), evidently forming under similar conditions to the HI-to-
$A_V\gtrsim0.25\,\mathrm{mag}$
(e.g. Lucas & Liszt Reference Lucas and Liszt1996; Rybarczyk et al. Reference Rybarczyk2022b), evidently forming under similar conditions to the HI-to- $\text{H}_{2}$
transition. Moreover,
$\text{H}_{2}$
transition. Moreover, $\text{HCO}^{+}$
absorption is regularly detected in directions where CO emission is undetected (Lucas & Liszt Reference Lucas and Liszt1996; Liszt & Lucas Reference Liszt and Lucas2000; Rybarczyk et al. Reference Rybarczyk2022b). This suggests that a search for
$\text{HCO}^{+}$
absorption is regularly detected in directions where CO emission is undetected (Lucas & Liszt Reference Lucas and Liszt1996; Liszt & Lucas Reference Liszt and Lucas2000; Rybarczyk et al. Reference Rybarczyk2022b). This suggests that a search for $\text{HCO}^{+}$
in absorption is among the best approaches for detecting molecular gas in the diffuse environment of MS. Indeed, Murray et al. (Reference Murray2015) reported a tentative detection of
$\text{HCO}^{+}$
in absorption is among the best approaches for detecting molecular gas in the diffuse environment of MS. Indeed, Murray et al. (Reference Murray2015) reported a tentative detection of $\text{HCO}^{+}$
absorption in the Magellanic system outside of the LMC and SMC, in the low density environment of the Magellanic Bridge.
$\text{HCO}^{+}$
absorption in the Magellanic system outside of the LMC and SMC, in the low density environment of the Magellanic Bridge.
In this study, we have obtained the most sensitive observations to date of molecular absorption from key molecular species, including $\text{HCO}^{+}$
, in the MS using the the Atacama Large Millimeter/submillimeter Array (ALMA). In Section 2, we discuss the observations for each of the four molecular lines, HCO
$\text{HCO}^{+}$
, in the MS using the the Atacama Large Millimeter/submillimeter Array (ALMA). In Section 2, we discuss the observations for each of the four molecular lines, HCO $^+$
, HCN, HNC, and C
$^+$
, HCN, HNC, and C $_2$
H at 10 pointings in the MS. In Section 3, we present the upper limits on the optical depths (
$_2$
H at 10 pointings in the MS. In Section 3, we present the upper limits on the optical depths ( $\tau$
) and the column densities of the four molecular species for each line of sight. In Section 4.1, we examine the position of each line of sight relative to the SMC and LMC to contextualise the column density limits presented in Section 3. We also search for possible correlations between the location conditions and the upper limits of the optical depths and column densities of different molecular species. In Section 4.2, we discuss what our observations imply for the molecular fraction in the Stream.
$\tau$
) and the column densities of the four molecular species for each line of sight. In Section 4.1, we examine the position of each line of sight relative to the SMC and LMC to contextualise the column density limits presented in Section 3. We also search for possible correlations between the location conditions and the upper limits of the optical depths and column densities of different molecular species. In Section 4.2, we discuss what our observations imply for the molecular fraction in the Stream.
Summary of observations. For each source (column 1), we list the celestial coordinates (columns 2 and 3), the Magellanic Stream coordinates (columns 4 and 5), the flux density at 89 GHz (column 6), the optical depth sensitivity for HI absorption using ATCA (Column 7), and the optical depth sensitivity in the final spectra achieved for each of the four molecular transitions observed with ALMA (columns 8–11).

The optical depth spectra for the sources 2331+073 (left) and J2230+114 (right) with the corresponding HI brightness temperature spectra from the GALFA-HI survey.

2. Observations
2.1. Molecular absorption measurements from ALMA
We searched for absorption by the $J = 1-0$
transitions of HCN (including three hyperfine lines at
$J = 1-0$
transitions of HCN (including three hyperfine lines at $88.6304$
–
$88.6304$
– $88.6339\,\mathrm{GHz}$
), HCO
$88.6339\,\mathrm{GHz}$
), HCO $^+$
(
$^+$
( $89.1890\,\mathrm{GHz}$
), and HNC (
$89.1890\,\mathrm{GHz}$
), and HNC ( $90.6336\,\mathrm{GHz}$
), and the
$90.6336\,\mathrm{GHz}$
), and the $N = 1-0$
transition of C
$N = 1-0$
transition of C $_2$
H (including two hyperfine lines at
$_2$
H (including two hyperfine lines at $87.3169\,\mathrm{GHz}$
and
$87.3169\,\mathrm{GHz}$
and $87.3286\,\mathrm{GHz}$
) using ALMA Band 3 observations towards 14 background radio continuum sources (project code 2013.1.00700.S, ALMA Cycle 2). Observations were obtained between May 2015 and September 2015. On-source integration times ranged from 5–10 min.
$87.3286\,\mathrm{GHz}$
) using ALMA Band 3 observations towards 14 background radio continuum sources (project code 2013.1.00700.S, ALMA Cycle 2). Observations were obtained between May 2015 and September 2015. On-source integration times ranged from 5–10 min.
Three background sources – NGC3783, NGC7714, and NGC7469 – were chosen because they had complementary UV observations. Unfortunately, all three sources were excluded from our analysis because their continuum flux densities were too low to be able to detect absorption (0.003, 0.002, and 0.003 Jy, respectively). We chose the remaining ten background sources based on their positions behind the MS and their high continuum flux densities. Table 1 lists the positions and 89 GHz flux densities of all ten sources included in our analysis. The velocity resolutions of the final absorption-line spectra ranged from 0.303 to 0.315 km s $^{-1}$
.
$^{-1}$
.
The calibration and imaging for these sources were straightforward, and the ALMA pipeline products were essentially science-ready. To obtain the most accurate estimates of the continuum flux densities, though, we reran the ALMA pipeline without continuum subtraction for all of our observations. Towards each background source, we then extracted the absorption spectrum,
 \begin{equation} e^{-\tau(v)} = \frac{I(v)}{I_0(v)},\end{equation}
where $\tau(v)$
is the optical depth, I(v) is the observed intensity, and
$\tau(v)$
is the optical depth, I(v) is the observed intensity, and $I_0(v)$
is the continuum emission of the background source. All three quantities are functions of frequency (here we convert to radial velocity, v). For each molecular line, we selected the pixel with the brightest continuum flux density and extracted the spectrum (I(v) in Equation 1) from the spectral cube at that pixel. To model the continuum (
$I_0(v)$
is the continuum emission of the background source. All three quantities are functions of frequency (here we convert to radial velocity, v). For each molecular line, we selected the pixel with the brightest continuum flux density and extracted the spectrum (I(v) in Equation 1) from the spectral cube at that pixel. To model the continuum ( $I_0(v)$
in Equation 1), we fit a constant value using the spectral channels where HI is not seen in emission, and therefore no molecular absorption is expected (e.g. Rybarczyk et al. Reference Rybarczyk2022b). We chose to fit a constant because the continuum was nearly flat across each of the
$I_0(v)$
in Equation 1), we fit a constant value using the spectral channels where HI is not seen in emission, and therefore no molecular absorption is expected (e.g. Rybarczyk et al. Reference Rybarczyk2022b). We chose to fit a constant because the continuum was nearly flat across each of the $58.50\,\mathrm{MHz}$
spectral windows.
$58.50\,\mathrm{MHz}$
spectral windows.
In Figs. 1 and 2, we show the optical depth spectra, $\tau(v)$
, measured towards each background source. From bottom to top, we plot the optical depth spectra of HCO
$\tau(v)$
, measured towards each background source. From bottom to top, we plot the optical depth spectra of HCO $^+$
(green), HCN (blue), HNC (purple), C
$^+$
(green), HCN (blue), HNC (purple), C $_2$
H (yellow).
$_2$
H (yellow).
The optical depth spectra for the sources J0635-7516, J0454-8101, 2345-167, J0049-4457, J0253-5441, 2355-534, J1058-8003, and 2326-477 with their corresponding HI brightness temperature spectra from GASS.

2.2. Complementary HI measurements
In Figs. 1 and 2, we show the HI emission spectrum (red, top) alongside the optical depth spectra measured in the direction of each background source. Fig. 1 uses HI emission spectra measured by the Galactic Arecibo L-band Feed Array HI (GALFA-HI) Survey (Peek et al. Reference Peek2011, Reference Peek2018). The HI spectra in Fig. 2 come from the Galactic All Sky Survey (GASS, McClure-Griffiths et al. Reference McClure-Griffiths2009) and the HI4PI survey (HI4PI Collaboration et al. 2016). The 1 $\sigma_{rms}$
noise level is 43, 55, and 60–140 mK for the GASS, HI4PI, and GALFA-HI surveys, respectively (HI4PI Collaboration et al. 2016; McClure-Griffiths et al. Reference McClure-Griffiths2009; Peek et al. Reference Peek2018), corresponding to 1
$\sigma_{rms}$
noise level is 43, 55, and 60–140 mK for the GASS, HI4PI, and GALFA-HI surveys, respectively (HI4PI Collaboration et al. 2016; McClure-Griffiths et al. Reference McClure-Griffiths2009; Peek et al. Reference Peek2018), corresponding to 1 $\sigma_{rms}$ $N(\mathrm{HI})$
sensitivities
$N(\mathrm{HI})$
sensitivities $\sim 2.3 \times 10^{18} \mathrm{cm}^{-2}$
,
$\sim 2.3 \times 10^{18} \mathrm{cm}^{-2}$
, $2.5 \times 10^{18} \mathrm{cm}^{-2}$
, and
$2.5 \times 10^{18} \mathrm{cm}^{-2}$
, and $6.5 \times 10^{18} \mathrm{cm}^{-2}$
, assuming a FWHM of 20, 30, and 20 km s
$6.5 \times 10^{18} \mathrm{cm}^{-2}$
, assuming a FWHM of 20, 30, and 20 km s $^{-1}$
, respectively. For each sightline, we fit a Gaussian function to the main emission feature. The centroid velocity of the fit is shown with the black dashed vertical lines in Figs. 1 and 2 to emphasise at which velocities molecular absorption lines would be expected if present.
$^{-1}$
, respectively. For each sightline, we fit a Gaussian function to the main emission feature. The centroid velocity of the fit is shown with the black dashed vertical lines in Figs. 1 and 2 to emphasise at which velocities molecular absorption lines would be expected if present.
Molecular gas forms from relatively cold and dense HI; if cold molecular gas were present in any of these directions, we would also expect cold HI to be present and potentially detectable in absorption (e.g. Stanimirović et al. Reference Stanimirović, Murray, Lee, Heiles and Miller2014; Nguyen et al. Reference Nguyen2019; Rybarczyk et al. Reference Rybarczyk2022b; Park et al. Reference Park, Wong and Kim2023; Hafner et al. 2023). Moreover, HI absorption observations would probe a similar physical scale to our pencil-beam molecular absorption line spectra, whereas HI emission observations probe a much larger physical scale. Murray et al. (Reference Murray2015) observed several of the same sources observed in this study in several wavelengths including HI absorption. These yielded all non-detections for the observed sources. Because we detect no HI gas in absorption, our assumption made in Section 3 is valid and we derive all HI column densities and velocities from the HI emission spectra.
3. Limits on the molecular column densities in the MS
We do not detect $\text{HCO}^{+}$
, C
$\text{HCO}^{+}$
, C $_2$
H, HCN, or HNC absorption in the direction of any of the 10 background sources listed in Table 1 at a level of
$_2$
H, HCN, or HNC absorption in the direction of any of the 10 background sources listed in Table 1 at a level of $3\sigma$
. In Table 1, we list the
$3\sigma$
. In Table 1, we list the $1\sigma$
noise in
$1\sigma$
noise in $\tau(v)$
for velocity channels of width
$\tau(v)$
for velocity channels of width $\sim 0.3 \, \mathrm{km\ s}^{-1}$
for each transition and each line of sight. Our sensitivity is comparable to that achieved by Rybarczyk et al. (Reference Rybarczyk2022a), who detected
$\sim 0.3 \, \mathrm{km\ s}^{-1}$
for each transition and each line of sight. Our sensitivity is comparable to that achieved by Rybarczyk et al. (Reference Rybarczyk2022a), who detected $\text{HCO}^{+}$
absorption in 10 diffuse sightlines through the Milky Way. If we assume a conversion factor
$\text{HCO}^{+}$
absorption in 10 diffuse sightlines through the Milky Way. If we assume a conversion factor $X_{\text{HCO}^{+}{}}\sim\mathrm{few}\times10^{-9}$
as suggested by Millar & Herbst (Reference Millar and Herbst1990) for both the SMC and LMC, our upper limit on the H
$X_{\text{HCO}^{+}{}}\sim\mathrm{few}\times10^{-9}$
as suggested by Millar & Herbst (Reference Millar and Herbst1990) for both the SMC and LMC, our upper limit on the H $_2$
column density is
$_2$
column density is $\sim10^{19}$
cm
$\sim10^{19}$
cm $^{-2}$
(although see discussion of
$^{-2}$
(although see discussion of $\text{HCO}^{+}$
abundance in Section 4.2).
$\text{HCO}^{+}$
abundance in Section 4.2).
To estimate upper limits to the column densities of HCO $^+$
, HCN, HNC, and C
$^+$
, HCN, HNC, and C $_2$
H we make several assumptions about the nature of a molecular line detection in this environment. The column density, N, of a molecular species is related to the optical depth,
$_2$
H we make several assumptions about the nature of a molecular line detection in this environment. The column density, N, of a molecular species is related to the optical depth, $\tau(v)$
, by
$\tau(v)$
, by
 \begin{equation} N = C(T_{\mathrm{ex}}) \int \tau(v) dv,\end{equation}
where C depends on the the excitation temperature, $T_{\mathrm{ex}}$
, and the physical properties of the observed transition (e.g. Draine Reference Draine2011). We assume an excitation temperature equal to the temperature of the CMB,
$T_{\mathrm{ex}}$
, and the physical properties of the observed transition (e.g. Draine Reference Draine2011). We assume an excitation temperature equal to the temperature of the CMB, $2.725\,\mathrm{K}$
, for all lines, as is typically assumed in diffuse environments (e.g. Lucas & Liszt Reference Lucas and Liszt1996; Reference Lucas and Liszt2000; Liszt & Lucas Reference Liszt and Lucas2001) and has been confirmed in some diffuse directions for
$2.725\,\mathrm{K}$
, for all lines, as is typically assumed in diffuse environments (e.g. Lucas & Liszt Reference Lucas and Liszt1996; Reference Lucas and Liszt2000; Liszt & Lucas Reference Liszt and Lucas2001) and has been confirmed in some diffuse directions for $\text{HCO}^{+}$
(Godard et al. Reference Godard, Falgarone, Gerin, Hily-Blant and de Luca2010; Luo et al. Reference Luo2020). Values for
$\text{HCO}^{+}$
(Godard et al. Reference Godard, Falgarone, Gerin, Hily-Blant and de Luca2010; Luo et al. Reference Luo2020). Values for $C(2.725\,\mathrm{K})$
are listed in Table 2. We also assume that any molecular absorption lines are Gaussian, with peak optical depth
$C(2.725\,\mathrm{K})$
are listed in Table 2. We also assume that any molecular absorption lines are Gaussian, with peak optical depth $\tau_0$
and full width at half maximum (FWHM)
$\tau_0$
and full width at half maximum (FWHM) $\Delta v_0$
. Then, the column density is
$\Delta v_0$
. Then, the column density is $N=C(T_{\mathrm{ex}}) \times 1.064\times \tau_0 \times \Delta v_0$
. We assume a minimum FWHM of 2
$N=C(T_{\mathrm{ex}}) \times 1.064\times \tau_0 \times \Delta v_0$
. We assume a minimum FWHM of 2 ${{\mathrm{km\,s}^{-1}}}{}$
(e.g. Lucas & Liszt Reference Lucas and Liszt1996; Godard et al. Reference Godard, Falgarone, Gerin, Hily-Blant and de Luca2010; Rybarczyk et al. Reference Rybarczyk2022a). Since we find only non-detections, in Table 3 we report upper limits to the molecular column densities using
${{\mathrm{km\,s}^{-1}}}{}$
(e.g. Lucas & Liszt Reference Lucas and Liszt1996; Godard et al. Reference Godard, Falgarone, Gerin, Hily-Blant and de Luca2010; Rybarczyk et al. Reference Rybarczyk2022a). Since we find only non-detections, in Table 3 we report upper limits to the molecular column densities using $\tau_0=3\sigma_\tau$
.
$\tau_0=3\sigma_\tau$
.
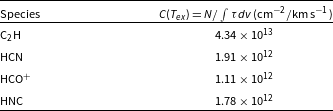
Conversion factors from integrated optical depth to column density ( $C(T_\mathrm{ex})$
in Equation 2) for the transitions observed in this work, assuming
$C(T_\mathrm{ex})$
in Equation 2) for the transitions observed in this work, assuming $T_{\mathrm{ex}}=2.725\,\mathrm{K}$
(e.g. Godard et al. Reference Godard, Falgarone, Gerin, Hily-Blant and de Luca2010; Luo et al. Reference Luo2020).
$T_{\mathrm{ex}}=2.725\,\mathrm{K}$
(e.g. Godard et al. Reference Godard, Falgarone, Gerin, Hily-Blant and de Luca2010; Luo et al. Reference Luo2020).
We also compare these molecular column density upper limits with the HI column densities and surface densities (Table 3). We find the column densities of the HI using the integrated intensities averaged over 20” when using the GALFA-HI data and 44” when using the GASS data to account for diffuse larger structures in that region. The sizes of the areas differed between the two HI surveys because the angular resolution was far improved in the GALFA-HI survey compared to the GASS survey, which allowed the HI emission in the MS to be resolved on smaller angular scales. However because the intensities were averaged, we find minimal differences in the outcomes. These values are then multiplied by a scale factor of $1.823 \times 10^{18}\,{{\,\mathrm{cm}^{-2}}}/(\mathrm{K\,km\,s^{-1}})$
(Murray et al. Reference Murray2018). This assumes an optically thin environment, so these represent lower limits of the HI column densities. We then use a scale factor of
$1.823 \times 10^{18}\,{{\,\mathrm{cm}^{-2}}}/(\mathrm{K\,km\,s^{-1}})$
(Murray et al. Reference Murray2018). This assumes an optically thin environment, so these represent lower limits of the HI column densities. We then use a scale factor of $0.8 \times 10^{-20}$
to convert between the HI column densities,
$0.8 \times 10^{-20}$
to convert between the HI column densities, $N(\mathrm{HI})$
, and the HI surface densities,
$N(\mathrm{HI})$
, and the HI surface densities, $\Sigma(\mathrm{HI}) (\mathrm{M}_\odot \mathrm{pc}^{-2})$
(Roman-Duval et al. Reference Roman-Duval2014).
$\Sigma(\mathrm{HI}) (\mathrm{M}_\odot \mathrm{pc}^{-2})$
(Roman-Duval et al. Reference Roman-Duval2014).
We compare these results with those of Murray et al. (Reference Murray2015), who found a tentative detection of HCO $^+$
towards J0454-8101 with a peak
$^+$
towards J0454-8101 with a peak $\tau$
of
$\tau$
of $0.10 \pm 0.02$
with
$0.10 \pm 0.02$
with $\sigma_{\tau} = 0.026$
per 0.8 km s
$\sigma_{\tau} = 0.026$
per 0.8 km s $^{-1}$
velocity channels using the Australia Telescope Compact Array (ATCA). For HCO
$^{-1}$
velocity channels using the Australia Telescope Compact Array (ATCA). For HCO $^+$
our value at J0454-8101 was
$^+$
our value at J0454-8101 was $\sigma_{\tau} = 0.009$
, which would make our 3
$\sigma_{\tau} = 0.009$
, which would make our 3 $\sigma$
upper limit equal to
$\sigma$
upper limit equal to $\tau = 0.027$
. We are unable to reproduce the results of Murray et al. (Reference Murray2015) here. The tentative detections from Murray et al. (Reference Murray2015) could be a result of radio frequency interference (RFI) contamination. The location of ALMA should be less susceptible to RFI contamination than ATCA, and our observations have both a higher sensitivity and an increased bandpass stability.
$\tau = 0.027$
. We are unable to reproduce the results of Murray et al. (Reference Murray2015) here. The tentative detections from Murray et al. (Reference Murray2015) could be a result of radio frequency interference (RFI) contamination. The location of ALMA should be less susceptible to RFI contamination than ATCA, and our observations have both a higher sensitivity and an increased bandpass stability.
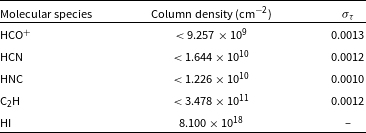
Finally, in an effort to improve the signal-to-noise ratio in our molecular absorption spectra, we stack all 10 spectra for each molecular absorption line to create a weighted mean spectrum (Fig. 3). The spectra are weighted by the inverse square of the standard deviation of individual spectra. When stacking, all of the composite spectra are shifted in velocity so that $0\,{{\mathrm{km\,s}^{-1}}}{}$
in each stacked spectrum aligns with the peak in the HI emission spectrum.Footnote
a
The optical depth sensitivities for each of the stacked molecular absorption spectra are listed in Table 4. Stacking improves the signal to noise ratio by a factor of 1.5 – 10 compared to the individual spectra shown in Figs. 1 and 2. Even with the reduced noise in the stacked spectra, though, we still do not detect molecular absorption at a level 3
$0\,{{\mathrm{km\,s}^{-1}}}{}$
in each stacked spectrum aligns with the peak in the HI emission spectrum.Footnote
a
The optical depth sensitivities for each of the stacked molecular absorption spectra are listed in Table 4. Stacking improves the signal to noise ratio by a factor of 1.5 – 10 compared to the individual spectra shown in Figs. 1 and 2. Even with the reduced noise in the stacked spectra, though, we still do not detect molecular absorption at a level 3 $\sigma$
in any of the four lines. Upper limits to the molecular column densities in the stacked spectra are listed in Table 4.
$\sigma$
in any of the four lines. Upper limits to the molecular column densities in the stacked spectra are listed in Table 4.
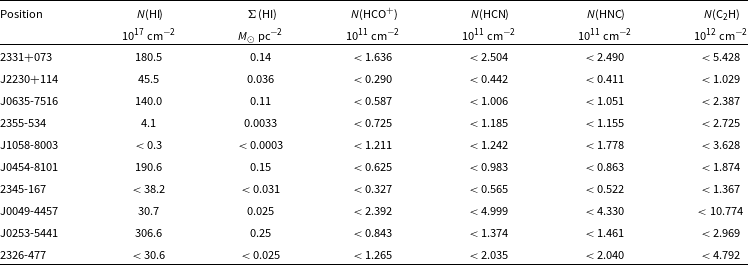
HI column density and surface density and upper limits ( $3\sigma$
) of the column densities of HCO
$3\sigma$
) of the column densities of HCO $^{+}$
, HCN, HNC, and C
$^{+}$
, HCN, HNC, and C $_2$
H for each line of sight in our sample.
$_2$
H for each line of sight in our sample.
4. Discussion
4.1. Spatial distribution of molecular upper limits across the Magellanic Stream
In Fig. 4, we show the locations of our background sources across the MS, using a colour bar to indicate the upper limits of the column density of each molecular line. The background of Fig. 4 shows the column density of the high velocity ( $|v_{LSR}| \lt 450$
km s
$|v_{LSR}| \lt 450$
km s $^{-1}$
,
$^{-1}$
, $v_{dev}$
= 70 km s
$v_{dev}$
= 70 km s $^{-1}$
) HI emission in the MS and Leading Arm from the LAB (Leiden/Argentine/Bonn) survey (Westmeier Reference Westmeier2018), calculated using the HI4PI all sky survey (HI4PI Collaboration et al. 2016). The HI column density is shown using the Magellanic Stream Coordinate System (Nidever, Majewski, & Butler Burton Reference Nidever, Majewski and Butler Burton2008).
$^{-1}$
) HI emission in the MS and Leading Arm from the LAB (Leiden/Argentine/Bonn) survey (Westmeier Reference Westmeier2018), calculated using the HI4PI all sky survey (HI4PI Collaboration et al. 2016). The HI column density is shown using the Magellanic Stream Coordinate System (Nidever, Majewski, & Butler Burton Reference Nidever, Majewski and Butler Burton2008).
We transformed the coordinates of each of the background sources to the Magellanic Stream Coordinate System to emphasise the MS and Leading Arm in the HI4PI data. This was accomplished following the equations first introduced by Wakker (Reference Wakker2001) and Nidever et al. (Reference Nidever, Majewski and Butler Burton2008),
 \begin{equation} \tan\!(\lambda-\lambda_0) = \frac{\sin\!(b) \sin\!(\varepsilon) + \cos\!(b) \cos\!(\varepsilon)\sin\!(l-l_0)}{\cos\!(b)\cos\!(l-l_0)}\end{equation}
 \begin{equation} \sin\!(\beta) = \sin\!(b)\cos\!(\varepsilon) - \cos\!(b)\sin\!(\varepsilon)\sin\!(l-l_0),\end{equation}
where l and b are the Galactic latitude and longitude values, which return $\lambda$
and
$\lambda$
and $\beta$
, the Magellanic longitude and latitude values. In these equations,
$\beta$
, the Magellanic longitude and latitude values. In these equations, $l_0 = 278.5^\circ$
,
$l_0 = 278.5^\circ$
, $\lambda_0 = 32.861^\circ$
, and
$\lambda_0 = 32.861^\circ$
, and $\varepsilon = 97.5^\circ$
(Nidever et al. Reference Nidever, Majewski and Butler Burton2008).
$\varepsilon = 97.5^\circ$
(Nidever et al. Reference Nidever, Majewski and Butler Burton2008).
The smoothed and stacked spectra for each of the molecular species and the HI emission spectrum from GASS and GALFA.

As shown in Fig. 4, we probe a range of HI column density environments. Two sources probe gas in the outskirts of the Magellanic Clouds with higher HI column densities ( $2 \times 10^{19}$
cm
$2 \times 10^{19}$
cm $^{-2}$
) and less filamentary and dispersed gas structures. Three sources probe the Leading Arm (gas on the opposite side of the Stream). At one of these sources (J1058-8003), we do not detect HI and therefore provide an upper limit to the column density as seen in Table 3. The remaining seven sources are in the direction of the Stream with varied column densities ranging from
$^{-2}$
) and less filamentary and dispersed gas structures. Three sources probe the Leading Arm (gas on the opposite side of the Stream). At one of these sources (J1058-8003), we do not detect HI and therefore provide an upper limit to the column density as seen in Table 3. The remaining seven sources are in the direction of the Stream with varied column densities ranging from $4 \times 10^{17}$
–
$4 \times 10^{17}$
– $3 \times 10^{19}$
cm
$3 \times 10^{19}$
cm $^{-2}$
, though at two of these sources (2345-167 and 2326-477) we do not detect HI emission. Upper limits for the column densities can again be found in Table 3. Our sensitivity is roughly uniform across our sample. For most sources, we find
$^{-2}$
, though at two of these sources (2345-167 and 2326-477) we do not detect HI emission. Upper limits for the column densities can again be found in Table 3. Our sensitivity is roughly uniform across our sample. For most sources, we find $N(\text{HCO}^{+}{})\lesssim\mathrm{few}\times10^{10}\,{{\,\mathrm{cm}^{-2}}}{}$
, both around the MCs and in the leading arm of the MS.
$N(\text{HCO}^{+}{})\lesssim\mathrm{few}\times10^{10}\,{{\,\mathrm{cm}^{-2}}}{}$
, both around the MCs and in the leading arm of the MS.
Several previous studies have detected H $_2$
using UV spectroscopy in the direction of the MS (Sembach et al. Reference Sembach, Howk, Savage and Shull2001; Richter et al. Reference Richter, Sembach, Wakker and Savage2001; Wakker Reference Wakker2006; Richter et al. Reference Richter2013, Reference Richter2018) and Magellanic Bridge (Lehner Reference Lehner2002). Sembach et al. (Reference Sembach, Howk, Savage and Shull2001), Wakker (Reference Wakker2006), and Richter et al. (Reference Richter2018) detected
$_2$
using UV spectroscopy in the direction of the MS (Sembach et al. Reference Sembach, Howk, Savage and Shull2001; Richter et al. Reference Richter, Sembach, Wakker and Savage2001; Wakker Reference Wakker2006; Richter et al. Reference Richter2013, Reference Richter2018) and Magellanic Bridge (Lehner Reference Lehner2002). Sembach et al. (Reference Sembach, Howk, Savage and Shull2001), Wakker (Reference Wakker2006), and Richter et al. (Reference Richter2018) detected $\text{H}_{2}$
and other species towards the MS Leading Arm, while Richter et al. (Reference Richter, Sembach, Wakker and Savage2001), Wakker (Reference Wakker2006), and Richter et al. (Reference Richter2013) detected
$\text{H}_{2}$
and other species towards the MS Leading Arm, while Richter et al. (Reference Richter, Sembach, Wakker and Savage2001), Wakker (Reference Wakker2006), and Richter et al. (Reference Richter2013) detected $\text{H}_{2}$
and other species towards the MS. In both directions, best estimates for the
$\text{H}_{2}$
and other species towards the MS. In both directions, best estimates for the $\text{H}_{2}$
column densities are
$\text{H}_{2}$
column densities are $N(\text{H}_{2}{})\sim10^{18}\,{{\,\mathrm{cm}^{-2}}}{}$
, with
$N(\text{H}_{2}{})\sim10^{18}\,{{\,\mathrm{cm}^{-2}}}{}$
, with $f_{\mathrm{mol}}=2n(\text{H}_{2}{})/n_{\mathrm{H}}\approx0.01$
–
$f_{\mathrm{mol}}=2n(\text{H}_{2}{})/n_{\mathrm{H}}\approx0.01$
– $0.04$
.
$0.04$
. $\text{H}_{2}$
has also been detected in the Magellanic Bridge (Lehner Reference Lehner2002), but with relatively lower column density,
$\text{H}_{2}$
has also been detected in the Magellanic Bridge (Lehner Reference Lehner2002), but with relatively lower column density, $N(\text{H}_{2})=2.7\times10^{15}\,{{\,\mathrm{cm}^{-2}}}$
, and lower molecular fraction,
$N(\text{H}_{2})=2.7\times10^{15}\,{{\,\mathrm{cm}^{-2}}}$
, and lower molecular fraction, $f_{\mathrm{mol}}\approx10^{-5}$
–
$f_{\mathrm{mol}}\approx10^{-5}$
– $10^{-4}$
. In Section 4.2 below, we discuss our non-detections in the context of these previous results.
$10^{-4}$
. In Section 4.2 below, we discuss our non-detections in the context of these previous results.
Recently, several studies claimed the detection of stars along and around the MS. Chandra et al. (Reference Chandra2023) detected 13 stars, of ages 4-10 Gyr, trailing the past orbits of the Clouds. Based on kinematics and metallicity these are high-confidence members of the MS. These stars, which we show in Fig. 5, have two populations: about half of the stars form a higher-metallicity population that tracks the HI well, and the rest of the stars form a diffuse, lower-metallicity population that is offset from the HI by about 20 degrees. The higher-metallicity stars were most likely formed in the LMC disc and were stripped at the same time as the HI gas. However, if formed in-situ, as was suggested for 1-4 Gyr-old stars discovered in the Milky Way Halo (Price-Whelan et al. Reference Price-Whelan2019), thought to have formed during the last interaction of the Leading Arm, these stars in the MS would need cold and dense molecular gas to form. The origin of the lower-metallicity stars is harder to constrain, with one idea being that those stars were thrown out of the SMC outskirts during past interactions between the Clouds. If some of recently detected stars were formed in-situ, Price-Whelan et al. (Reference Price-Whelan2019) proposes this to have occurred with tidally stripped gas interacting with Milky Way halo gas during recent low-mass mergers. During these interactions, the turbulence of the infalling gas could have created cold and dense regions where some star formation may have occurred (see Mac Low & Klessen Reference Mac Low and Klessen2004, and references therein); molecular gas would also be formed in this process. The existence of stars in the MS therefore suggests the possibility of the presence of molecular gas, which we constrain here.
Upper limits ( $3\sigma$
) of the column densities for the stacked spectra of HCO
$3\sigma$
) of the column densities for the stacked spectra of HCO $^{+},$
HCN, HNC, and C
$^{+},$
HCN, HNC, and C $_2$
H.
$_2$
H.
The Upper Limits of the Column Densities of HCO $^+$
plotted against the HI column density map of the high velocity components (
$^+$
plotted against the HI column density map of the high velocity components ( $\pm 100$
km s
$\pm 100$
km s $^{-1}$
) of the Magellanic Stream using the Magellanic Stream Coordinate System. The image is from the LAB High Velocity Cloud Sky Survey and has angular resolution of 36’ (Westmeier Reference Westmeier2018).
$^{-1}$
) of the Magellanic Stream using the Magellanic Stream Coordinate System. The image is from the LAB High Velocity Cloud Sky Survey and has angular resolution of 36’ (Westmeier Reference Westmeier2018).

A spatial comparison between detections of O I (blue triangles), stars (yellow stars), $\text{H}_{2}$
(purple xs), and our observations (green circles) in the Magellanic Stream and Leading Arm, plotted in the background using data from the LAB High Velocity Cloud Sky Survey.
$\text{H}_{2}$
(purple xs), and our observations (green circles) in the Magellanic Stream and Leading Arm, plotted in the background using data from the LAB High Velocity Cloud Sky Survey.

Using the Cosmic Origins Spectrograph (COS) on the Hubble Space Telescope, recent studies observed OI in the Magellanic Corona, surrounding the Magellanic Clouds and into the MS (Krishnarao et al. Reference Krishnarao2022). These 12 detections were found to be consistent with tidally stripped gas from the Magallanic Stream rather than originating in the more higher temperature ( $10^6$
K) and highly ionised Magellanic Corona (Krishnarao et al. Reference Krishnarao2022). The other ionised species detected with COS indicated a higher correlation with LMC latitudes, suggesting origins from impacts with the LMC, while the OI correlated stronger with the MS (Krishnarao et al. Reference Krishnarao2022).
$10^6$
K) and highly ionised Magellanic Corona (Krishnarao et al. Reference Krishnarao2022). The other ionised species detected with COS indicated a higher correlation with LMC latitudes, suggesting origins from impacts with the LMC, while the OI correlated stronger with the MS (Krishnarao et al. Reference Krishnarao2022).
In Fig. 5, we show a spatial comparison of the sightlines observed in this work to directions with previously detected $\text{H}_{2}$
, OI, and stars. From this figure, we see that while some of the observed targets probe similar environments, many do not. The majority of the OI detections (Krishnarao et al. Reference Krishnarao2022) probe regions closer to the Magellanic Clouds and the Magellanic Corona, which shows higher HI column densities and in several cases correspond spatially with detections of
$\text{H}_{2}$
, OI, and stars. From this figure, we see that while some of the observed targets probe similar environments, many do not. The majority of the OI detections (Krishnarao et al. Reference Krishnarao2022) probe regions closer to the Magellanic Clouds and the Magellanic Corona, which shows higher HI column densities and in several cases correspond spatially with detections of $\text{H}_{2}$
(Richter et al. Reference Richter, Sembach, Wakker and Savage2001; Sembach et al. Reference Sembach, Howk, Savage and Shull2001; Lehner Reference Lehner2002). Most of the detected stars (Chandra et al. Reference Chandra2023) do not trace similar regions of the MS compared to our observations, or any of the detections of OI or
$\text{H}_{2}$
(Richter et al. Reference Richter, Sembach, Wakker and Savage2001; Sembach et al. Reference Sembach, Howk, Savage and Shull2001; Lehner Reference Lehner2002). Most of the detected stars (Chandra et al. Reference Chandra2023) do not trace similar regions of the MS compared to our observations, or any of the detections of OI or $\text{H}_{2}$
.
$\text{H}_{2}$
.
The upper limit on $f_{\mathrm{mol}}$
as a function of
$f_{\mathrm{mol}}$
as a function of $X_{\text{HCO}^{+}{},\mathrm{MS}}$
(Equation 5) for each source.
$X_{\text{HCO}^{+}{},\mathrm{MS}}$
(Equation 5) for each source.

4.2. Constraints on the molecular fraction
In the diffuse ISM of the Milky Way, the abundance of $\text{HCO}^{+}$
with respect to
$\text{HCO}^{+}$
with respect to $\text{H}_{2}$
is roughly constant, with only a limited scatter,
$\text{H}_{2}$
is roughly constant, with only a limited scatter, $N(\text{HCO}^{+}{})/N(\text{H}_{2}{})=3\times10^{-9}\pm0.2\,\mathrm{dex}$
(Gerin et al. Reference Gerin2019; Liszt & Gerin Reference Liszt and Gerin2023). If
$N(\text{HCO}^{+}{})/N(\text{H}_{2}{})=3\times10^{-9}\pm0.2\,\mathrm{dex}$
(Gerin et al. Reference Gerin2019; Liszt & Gerin Reference Liszt and Gerin2023). If $\text{HCO}^{+}$
is a similarly good tracer of
$\text{HCO}^{+}$
is a similarly good tracer of $\text{H}_{2}$
in the MS, then we can constrain
$\text{H}_{2}$
in the MS, then we can constrain $N(\text{H}_{2}{})$
and set an upper limit on the molecular fraction of the gas in our MS sightlines,
$N(\text{H}_{2}{})$
and set an upper limit on the molecular fraction of the gas in our MS sightlines,
 \begin{equation} f_{\mathrm{mol}} = \frac{2N(\text{HCO}^{+})/X_{\text{HCO}^{+}{}, \mathrm{MS}}}{N(\mathrm{HI})+2N(\text{HCO}^{+})/X_{\text{HCO}^{+}{}, \mathrm{MS}}} = \left(\!1\!+\frac{N(\mathrm{HI})X_{\text{HCO}^{+}{}, \mathrm{MS}}}{2N(\text{HCO}^{+})}\!\right)^{\!-1}\!,\end{equation}
where $X_{\text{HCO}^{+}{}, \mathrm{MS}}=N(\text{HCO}^{+}{})/N(\text{H}_{2}{})$
in the MS. We note that our estimates for
$X_{\text{HCO}^{+}{}, \mathrm{MS}}=N(\text{HCO}^{+}{})/N(\text{H}_{2}{})$
in the MS. We note that our estimates for $N(\text{HCO}^{+}{})$
come from pencil-beam absorption spectra, whereas our estimates for
$N(\text{HCO}^{+}{})$
come from pencil-beam absorption spectra, whereas our estimates for $N(\mathrm{HI})$
come from emission spectra with much larger beam sizes. Ideally, we would compare our molecular absorption observations to HI absorption observations in order to probe similar physical scales. However, because we do not detect HI in absorption, we use the emission observations to estimate the total column density of the atomic hydrogen. Equation (5) implicitly assumes that
$N(\mathrm{HI})$
come from emission spectra with much larger beam sizes. Ideally, we would compare our molecular absorption observations to HI absorption observations in order to probe similar physical scales. However, because we do not detect HI in absorption, we use the emission observations to estimate the total column density of the atomic hydrogen. Equation (5) implicitly assumes that $N(\mathrm{HI})$
and
$N(\mathrm{HI})$
and $N(\text{H}_{2}{})$
are probing the same environment, so our non-uniform approach allows us only to make an approximate measurement of the relationship between
$N(\text{H}_{2}{})$
are probing the same environment, so our non-uniform approach allows us only to make an approximate measurement of the relationship between $f_{\mathrm{mol}}$
and
$f_{\mathrm{mol}}$
and $X_{\text{HCO}^{+}{}, \mathrm{MS}}$
.
$X_{\text{HCO}^{+}{}, \mathrm{MS}}$
.
In Fig. 6, we show what our measurements of $N(\mathrm{HI})$
and
$N(\mathrm{HI})$
and $N(\text{HCO}^{+}{})$
imply for
$N(\text{HCO}^{+}{})$
imply for $f_\mathrm{mol}$
for a range of possible
$f_\mathrm{mol}$
for a range of possible $X_{\text{HCO}^{+}{}, \mathrm{MS}}$
. To properly interpret our results, we need some reasonable estimate of
$X_{\text{HCO}^{+}{}, \mathrm{MS}}$
. To properly interpret our results, we need some reasonable estimate of $X_{\text{HCO}^{+}{}, \mathrm{MS}}$
. Millar & Herbst (Reference Millar and Herbst1990) suggest an abundance of
$X_{\text{HCO}^{+}{}, \mathrm{MS}}$
. Millar & Herbst (Reference Millar and Herbst1990) suggest an abundance of $X_{\text{HCO}^{+}{}}\sim\mathrm{few}\times10^{-9}$
for both the SMC and LMC, similar to that observed in the Milky Way’s diffuse ISM, although their analysis focuses on dark clouds which may be much denser than the diffuse environments of the Stream and therefore have a different
$X_{\text{HCO}^{+}{}}\sim\mathrm{few}\times10^{-9}$
for both the SMC and LMC, similar to that observed in the Milky Way’s diffuse ISM, although their analysis focuses on dark clouds which may be much denser than the diffuse environments of the Stream and therefore have a different $X_{\text{HCO}^{+}{}}$
(e.g. Panessa et al. Reference Panessa2023). We further note that Millar & Herbst (Reference Millar and Herbst1990) estimates are probably inflated due to the low estimate of the H
$X_{\text{HCO}^{+}{}}$
(e.g. Panessa et al. Reference Panessa2023). We further note that Millar & Herbst (Reference Millar and Herbst1990) estimates are probably inflated due to the low estimate of the H $_3^+$
dissociative recombination rate (see summary by Larsson, McCall, & Orel Reference Larsson, McCall and Orel2008, and references therein). The MS has a lower density than dark clouds and a lower metallicity than the LMC. The relationships of
$_3^+$
dissociative recombination rate (see summary by Larsson, McCall, & Orel Reference Larsson, McCall and Orel2008, and references therein). The MS has a lower density than dark clouds and a lower metallicity than the LMC. The relationships of $X_{\text{HCO}^{+}{}}$
with density and with metallicity are non-linear, so it is difficult to estimate
$X_{\text{HCO}^{+}{}}$
with density and with metallicity are non-linear, so it is difficult to estimate $X_{\text{HCO}^{+}{}, \mathrm{MS}}$
from SMC and LMC analogues. If we use a PDR model (Gong, Ostriker, & Wolfire Reference Gong, Ostriker and Wolfire2017) with conservative estimates for the cosmic ray ionisation rate, temperature, density, metallicity, and interstellar radiation field of gas in the MS (motivated by direct measurements or comparisons to the SMC/LMC, e.g. Fox et al. Reference Fox2013; Barger et al. Reference Barger2017; Dempsey et al. Reference Dempsey, McClure-Griffiths, Jameson and Buckland-Willis2020; Kosenko & Balashev Reference Kosenko and Balashev2023), we find a range of
$X_{\text{HCO}^{+}{}, \mathrm{MS}}$
from SMC and LMC analogues. If we use a PDR model (Gong, Ostriker, & Wolfire Reference Gong, Ostriker and Wolfire2017) with conservative estimates for the cosmic ray ionisation rate, temperature, density, metallicity, and interstellar radiation field of gas in the MS (motivated by direct measurements or comparisons to the SMC/LMC, e.g. Fox et al. Reference Fox2013; Barger et al. Reference Barger2017; Dempsey et al. Reference Dempsey, McClure-Griffiths, Jameson and Buckland-Willis2020; Kosenko & Balashev Reference Kosenko and Balashev2023), we find a range of $X_{\text{HCO}^{+}{}}$
values between
$X_{\text{HCO}^{+}{}}$
values between $\mathcal{O}(10^{-12})$
and
$\mathcal{O}(10^{-12})$
and $\mathcal{O}(10^{-10})$
. However, the fixed abundance of
$\mathcal{O}(10^{-10})$
. However, the fixed abundance of $\text{HCO}^{+}$
in the Milky Way (Gerin et al. Reference Gerin2019; Liszt & Gerin Reference Liszt and Gerin2023) is an empirical result whose origin remains poorly understood. This result is not predicted by equilibrium chemical models, and PDR models generally underpredict the abundance of
$\text{HCO}^{+}$
in the Milky Way (Gerin et al. Reference Gerin2019; Liszt & Gerin Reference Liszt and Gerin2023) is an empirical result whose origin remains poorly understood. This result is not predicted by equilibrium chemical models, and PDR models generally underpredict the abundance of $\text{HCO}^{+}$
in diffuse environments (e.g. Godard et al. Reference Godard, Falgarone, Gerin, Hily-Blant and de Luca2010). Given these considerations, we take the range of
$\text{HCO}^{+}$
in diffuse environments (e.g. Godard et al. Reference Godard, Falgarone, Gerin, Hily-Blant and de Luca2010). Given these considerations, we take the range of $10^{-11} \lesssim X_{\text{HCO}^{+}{}, \mathrm{MS}} \lesssim 10^{-9}$
to be plausible (this region is shaded in Fig. 6), but we consider an even wider range of possible
$10^{-11} \lesssim X_{\text{HCO}^{+}{}, \mathrm{MS}} \lesssim 10^{-9}$
to be plausible (this region is shaded in Fig. 6), but we consider an even wider range of possible $X_{\text{HCO}^{+}{}, \mathrm{MS}}$
values in Fig. 6. Because
$X_{\text{HCO}^{+}{}, \mathrm{MS}}$
values in Fig. 6. Because $N(\text{HCO}^{+}{})$
is an upper limit for each line of sight, the curves in Fig. 6 indicate upper limits to
$N(\text{HCO}^{+}{})$
is an upper limit for each line of sight, the curves in Fig. 6 indicate upper limits to $f_{\mathrm{mol}}$
as a function of
$f_{\mathrm{mol}}$
as a function of $X_{\text{HCO}^{+}{},\mathrm{MS}}$
.
$X_{\text{HCO}^{+}{},\mathrm{MS}}$
.
If $X_{\text{HCO}^{+}{}, \mathrm{MS}}\lesssim10^{-10}$
, our observations do not give us tight constraints on the molecular fraction beyond indicating that the gas is not fully molecular. If
$X_{\text{HCO}^{+}{}, \mathrm{MS}}\lesssim10^{-10}$
, our observations do not give us tight constraints on the molecular fraction beyond indicating that the gas is not fully molecular. If $10^{-10} \lesssim X_{\text{HCO}^{+}{}, \mathrm{MS}} \lesssim 10^{-9}$
, we can place only slightly better constraints on the sightlines with the highest HI column densities – in this case, the gas towards J0253-5441, J0454-8101, and J0635-7516 must be
$10^{-10} \lesssim X_{\text{HCO}^{+}{}, \mathrm{MS}} \lesssim 10^{-9}$
, we can place only slightly better constraints on the sightlines with the highest HI column densities – in this case, the gas towards J0253-5441, J0454-8101, and J0635-7516 must be $ \lt 90\%$
molecular, while the gas towards J2230+114 and J1058-8003 must be
$ \lt 90\%$
molecular, while the gas towards J2230+114 and J1058-8003 must be $ \lt 95\%$
molecular. Despite our excellent
$ \lt 95\%$
molecular. Despite our excellent $\text{HCO}^{+}$
optical depth sensitivity, the low column densities of the gas in the direction of our background sources mean that, for any plausible
$\text{HCO}^{+}$
optical depth sensitivity, the low column densities of the gas in the direction of our background sources mean that, for any plausible $X_{\text{HCO}^{+}{}, \mathrm{MS}}$
, we can only place weak limits on the fraction of molecular gas towards our 10 lines of sight. If we consider the stacked spectrum, where we achieve an
$X_{\text{HCO}^{+}{}, \mathrm{MS}}$
, we can only place weak limits on the fraction of molecular gas towards our 10 lines of sight. If we consider the stacked spectrum, where we achieve an $\text{HCO}^{+}$
optical depth sensitivity
$\text{HCO}^{+}$
optical depth sensitivity $\sigma_\tau\sim0.001$
(Table 4), we can place somewhat more stringent limits on the molecular fraction: for
$\sigma_\tau\sim0.001$
(Table 4), we can place somewhat more stringent limits on the molecular fraction: for $X_{\text{HCO}^{+}{}, \mathrm{MS}}\lesssim10^{-10}$
, we can still only say that the MS gas is less than
$X_{\text{HCO}^{+}{}, \mathrm{MS}}\lesssim10^{-10}$
, we can still only say that the MS gas is less than $\sim95\%$
molecular, but for
$\sim95\%$
molecular, but for $10^{-10} \lesssim X_{\text{HCO}^{+}{}, \mathrm{MS}} \lesssim 10^{-9}$
, we find upper limits on the molecular fraction of
$10^{-10} \lesssim X_{\text{HCO}^{+}{}, \mathrm{MS}} \lesssim 10^{-9}$
, we find upper limits on the molecular fraction of $\sim70$
–90%.
$\sim70$
–90%.
The $\text{HCO}^{+}$
column density (left y-axis) expected if
$\text{HCO}^{+}$
column density (left y-axis) expected if $f_{\mathrm{mol}}=0.04$
in the MS (Sembach et al. Reference Sembach, Howk, Savage and Shull2001; Wakker Reference Wakker2006; Richter et al. Reference Richter2013) as a function of
$f_{\mathrm{mol}}=0.04$
in the MS (Sembach et al. Reference Sembach, Howk, Savage and Shull2001; Wakker Reference Wakker2006; Richter et al. Reference Richter2013) as a function of $X_{\text{HCO}^{+}{}, \mathrm{MS}}$
. The right y-axis shows the corresponding
$X_{\text{HCO}^{+}{}, \mathrm{MS}}$
. The right y-axis shows the corresponding $\text{HCO}^{+}$
optical depth (assuming a Gaussian line with
$\text{HCO}^{+}$
optical depth (assuming a Gaussian line with $2\,{{\mathrm{km\,s}^{-1}}}{}$
FWHM). Lines show the results for
$2\,{{\mathrm{km\,s}^{-1}}}{}$
FWHM). Lines show the results for $N(\mathrm{HI})=10^{17}\,{{\,\mathrm{cm}^{-2}}}{},10^{18}\,{{\,\mathrm{cm}^{-2}}}{},10^{19}\,{{\,\mathrm{cm}^{-2}}}{},10^{20}\,{{\,\mathrm{cm}^{-2}}}{},$
and
$N(\mathrm{HI})=10^{17}\,{{\,\mathrm{cm}^{-2}}}{},10^{18}\,{{\,\mathrm{cm}^{-2}}}{},10^{19}\,{{\,\mathrm{cm}^{-2}}}{},10^{20}\,{{\,\mathrm{cm}^{-2}}}{},$
and $10^{21}\,{{\,\mathrm{cm}^{-2}}}{}$
(colours correspond to the HI column density). The region highlighted in purple outlines the range of plausible
$10^{21}\,{{\,\mathrm{cm}^{-2}}}{}$
(colours correspond to the HI column density). The region highlighted in purple outlines the range of plausible $X_{\text{HCO}^{+}{}, \mathrm{MS}}$
(Section 4.2). The region highlighted in grey indicates the range of
$X_{\text{HCO}^{+}{}, \mathrm{MS}}$
(Section 4.2). The region highlighted in grey indicates the range of $\tau_{\text{HCO}^{+}{}}$
that could be detected with ALMA in
$\tau_{\text{HCO}^{+}{}}$
that could be detected with ALMA in $\lesssim15\,\mathrm{hr}$
for the sources listed in Table 1.
$\lesssim15\,\mathrm{hr}$
for the sources listed in Table 1.

Previously, direct measurements of $\text{H}_{2}$
using UV absorption have placed tighter constraints on the molecular fraction in different parts of the Magellanic System. In the direction of the MS, towards the quasar Fairall 9, observations of
$\text{H}_{2}$
using UV absorption have placed tighter constraints on the molecular fraction in different parts of the Magellanic System. In the direction of the MS, towards the quasar Fairall 9, observations of $\text{H}_{2}$
and other neutral species suggest
$\text{H}_{2}$
and other neutral species suggest $f_{\mathrm{mol}}=0.01$
(Richter et al. Reference Richter, Sembach, Wakker and Savage2001; Wakker Reference Wakker2006; Richter et al. Reference Richter2013). Meanwhile, in the direction of the Leading Arm of the MS, towards the Seyfert galaxy NGC 3783, observations suggest
$f_{\mathrm{mol}}=0.01$
(Richter et al. Reference Richter, Sembach, Wakker and Savage2001; Wakker Reference Wakker2006; Richter et al. Reference Richter2013). Meanwhile, in the direction of the Leading Arm of the MS, towards the Seyfert galaxy NGC 3783, observations suggest $f_{\mathrm{mol}}=0.04$
(Sembach et al. Reference Sembach, Howk, Savage and Shull2001; Wakker Reference Wakker2006; Richter et al. Reference Richter2013). In the Magellanic Bridge, observations suggest a lower molecular fraction,
$f_{\mathrm{mol}}=0.04$
(Sembach et al. Reference Sembach, Howk, Savage and Shull2001; Wakker Reference Wakker2006; Richter et al. Reference Richter2013). In the Magellanic Bridge, observations suggest a lower molecular fraction, $f_{\mathrm{mol}}=10^{-5}$
–
$f_{\mathrm{mol}}=10^{-5}$
– $10^{-4}$
(Lehner Reference Lehner2002).
$10^{-4}$
(Lehner Reference Lehner2002).
In Fig. 7, we show the $\text{HCO}^{+}$
column density implied by
$\text{HCO}^{+}$
column density implied by $f_{\mathrm{mol}}=0.04$
(Sembach et al. Reference Sembach, Howk, Savage and Shull2001; Wakker Reference Wakker2006; Richter et al. Reference Richter2013) as a function of
$f_{\mathrm{mol}}=0.04$
(Sembach et al. Reference Sembach, Howk, Savage and Shull2001; Wakker Reference Wakker2006; Richter et al. Reference Richter2013) as a function of $X_{\text{HCO}^{+}{}, \mathrm{MS}}$
. Lines of different colour show the results for different HI column densities. On the right side of the plot, we show the
$X_{\text{HCO}^{+}{}, \mathrm{MS}}$
. Lines of different colour show the results for different HI column densities. On the right side of the plot, we show the $\text{HCO}^{+}$
optical depth (assuming a FWHM of
$\text{HCO}^{+}$
optical depth (assuming a FWHM of $2\,{{\mathrm{km\,s}^{-1}}}{}$
) corresponding to the
$2\,{{\mathrm{km\,s}^{-1}}}{}$
) corresponding to the $\text{HCO}^{+}$
column density on the left axis. As in Fig. 6, we highlight in purple the range of
$\text{HCO}^{+}$
column density on the left axis. As in Fig. 6, we highlight in purple the range of $X_{\text{HCO}^{+}{}, \mathrm{MS}}$
that we deem most plausible for the MS. We further highlight in grey the range of
$X_{\text{HCO}^{+}{}, \mathrm{MS}}$
that we deem most plausible for the MS. We further highlight in grey the range of $\text{HCO}^{+}$
optical depths that could plausibly be detected at a level
$\text{HCO}^{+}$
optical depths that could plausibly be detected at a level $\geq3\sigma$
with ALMA for sources with
$\geq3\sigma$
with ALMA for sources with $90\,\mathrm{GHz}$
flux densities listed in Table 1 (note that the flux density sensitivity needed to reach an optical depth sensitivity
$90\,\mathrm{GHz}$
flux densities listed in Table 1 (note that the flux density sensitivity needed to reach an optical depth sensitivity $\sigma_{\tau}$
is
$\sigma_{\tau}$
is $\sigma_{F}=\sigma_{\tau}\times F$
, where F is the flux density of the background source in Jy). The intersection of the puple- and grey-highlighted regions in Fig. 7 (highlighted with cross-hatching) represents the space in which we could detect
$\sigma_{F}=\sigma_{\tau}\times F$
, where F is the flux density of the background source in Jy). The intersection of the puple- and grey-highlighted regions in Fig. 7 (highlighted with cross-hatching) represents the space in which we could detect $\text{HCO}^{+}$
with ALMA in
$\text{HCO}^{+}$
with ALMA in $\lesssim15\,\mathrm{hr}$
if
$\lesssim15\,\mathrm{hr}$
if $f_{\mathrm{mol}}=0.04$
. For any sightline with an HI column density
$f_{\mathrm{mol}}=0.04$
. For any sightline with an HI column density $\gtrsim10^{20}\,{{\,\mathrm{cm}^{-2}}}{}$
, ALMA should be able to detect
$\gtrsim10^{20}\,{{\,\mathrm{cm}^{-2}}}{}$
, ALMA should be able to detect $\text{HCO}^{+}$
if
$\text{HCO}^{+}$
if $f_{\mathrm{mol}}\sim0.04$
. For
$f_{\mathrm{mol}}\sim0.04$
. For $10^{19}\,{{\,\mathrm{cm}^{-2}}}{} \lesssim N(\mathrm{HI}) \lesssim 10^{20}\,{{\,\mathrm{cm}^{-2}}}{}$
, we could reasonably expect to detect
$10^{19}\,{{\,\mathrm{cm}^{-2}}}{} \lesssim N(\mathrm{HI}) \lesssim 10^{20}\,{{\,\mathrm{cm}^{-2}}}{}$
, we could reasonably expect to detect $\text{HCO}^{+}$
if
$\text{HCO}^{+}$
if $X_{\text{HCO}^{+}{}, \mathrm{MS}}\gtrsim\times10^{-10}$
. It is unlikely that
$X_{\text{HCO}^{+}{}, \mathrm{MS}}\gtrsim\times10^{-10}$
. It is unlikely that $\text{HCO}^{+}$
could be detected for sightlines with
$\text{HCO}^{+}$
could be detected for sightlines with $N(\mathrm{HI})\lesssim10^{19}\,{{\,\mathrm{cm}^{-2}}}{}$
.
$N(\mathrm{HI})\lesssim10^{19}\,{{\,\mathrm{cm}^{-2}}}{}$
.
5. Conclusions
We have carried out the most sensitive search to date for molecular gas at millimetre wavelengths towards the MS. Despite our excellent sensitivity, we do not detect absorption from any of the four molecular species we observed – $\text{HCO}^{+}$
, HCN, HNC, and C
$\text{HCO}^{+}$
, HCN, HNC, and C $_2$
H. We still do not detect absorption in any of these species when we stack the absorption spectra from our 10 sightlines, reaching an optical depth sensitivity of
$_2$
H. We still do not detect absorption in any of these species when we stack the absorption spectra from our 10 sightlines, reaching an optical depth sensitivity of $10^{-3}$
in each of the four lines (Table 4). This includes our observations in the direction of J0454-8101 (towards the Magellanic Bridge), where Murray et al. (Reference Murray2015) reported a tentative detection of
$10^{-3}$
in each of the four lines (Table 4). This includes our observations in the direction of J0454-8101 (towards the Magellanic Bridge), where Murray et al. (Reference Murray2015) reported a tentative detection of $\text{HCO}^{+}$
absorption. Despite our improved optical depth sensitivity (
$\text{HCO}^{+}$
absorption. Despite our improved optical depth sensitivity ( $\sigma_{\tau}=0.009$
per
$\sigma_{\tau}=0.009$
per $0.3\,{{\mathrm{km\,s}^{-1}}}{}$
channel, versus
$0.3\,{{\mathrm{km\,s}^{-1}}}{}$
channel, versus $\sigma_{\tau}=0.026$
per
$\sigma_{\tau}=0.026$
per $0.8\,{{\mathrm{km\,s}^{-1}}}{}$
channel in Murray et al. Reference Murray2015); we are unable to reproduce their result.
$0.8\,{{\mathrm{km\,s}^{-1}}}{}$
channel in Murray et al. Reference Murray2015); we are unable to reproduce their result.
Using complementary HI emission (McClure-Griffiths et al. Reference McClure-Griffiths2009; Peek et al. Reference Peek2011, Reference Peek2018), we look at the environments in the MS where we fail to detect molecular gas (Figs. 4 and 5) and place upper limits on the fraction of hydrogen in H $_2$
in these environments. Over a plausible range of
$_2$
in these environments. Over a plausible range of $\text{HCO}^{+}$
abundances in the MS, we find that the column densities are so low that, even with our excellent sensitivity, our
$\text{HCO}^{+}$
abundances in the MS, we find that the column densities are so low that, even with our excellent sensitivity, our $\text{HCO}^{+}$
column density limits only constrain the molecular fraction as
$\text{HCO}^{+}$
column density limits only constrain the molecular fraction as $\lesssim90$
% in most cases (if the
$\lesssim90$
% in most cases (if the $\text{HCO}^{+}$
abundance is
$\text{HCO}^{+}$
abundance is $\gtrsim10^{-10}$
; see Fig. 6). For the stacked spectrum, we can place slightly more stringent limits, with an upper limit of
$\gtrsim10^{-10}$
; see Fig. 6). For the stacked spectrum, we can place slightly more stringent limits, with an upper limit of $f_{\mathrm{mol}}\sim70$
–95% over a range of possible
$f_{\mathrm{mol}}\sim70$
–95% over a range of possible $\text{HCO}^{+}$
abundances. Previous estimates of the molecular fraction in the MS, derived from direct observations of
$\text{HCO}^{+}$
abundances. Previous estimates of the molecular fraction in the MS, derived from direct observations of $\text{H}_{2}$
and other species in UV absorption, range from extremely low,
$\text{H}_{2}$
and other species in UV absorption, range from extremely low, $\sim10^{-5}$
–
$\sim10^{-5}$
– $10^{-4}$
(Lehner Reference Lehner2002), to more moderate,
$10^{-4}$
(Lehner Reference Lehner2002), to more moderate, $\sim\mathrm{few}\times10^{-2}$
(Sembach et al. Reference Sembach, Howk, Savage and Shull2001; Wakker Reference Wakker2006; Richter et al. Reference Richter2013). To be sensitive to this latter range, we estimate that an
$\sim\mathrm{few}\times10^{-2}$
(Sembach et al. Reference Sembach, Howk, Savage and Shull2001; Wakker Reference Wakker2006; Richter et al. Reference Richter2013). To be sensitive to this latter range, we estimate that an $\text{HCO}^{+}$
optical depth sensitivity of
$\text{HCO}^{+}$
optical depth sensitivity of $\mathcal{O}(10^{-5})$
to
$\mathcal{O}(10^{-5})$
to $\mathcal{O}(10^{-3})$
is required (note this depends on both the HI column density and
$\mathcal{O}(10^{-3})$
is required (note this depends on both the HI column density and $\text{HCO}^{+}$
abundance; see Equation 5). For background sources as bright as those observed in this project, we show that ALMA would be capable of detecting such diffuse molecular gas in an observing time
$\text{HCO}^{+}$
abundance; see Equation 5). For background sources as bright as those observed in this project, we show that ALMA would be capable of detecting such diffuse molecular gas in an observing time $\lesssim16\,\mathrm{hr}$
Footnote
b
if the HI column density is
$\lesssim16\,\mathrm{hr}$
Footnote
b
if the HI column density is $\gtrsim10^{19}\,{{\,\mathrm{cm}^{-2}}}{}$
(see Fig. 7). This suggests that ALMA offers an important way to test the existence of molecular gas in the MS, though this requires considerably better sensitivity than achieved here (note that our sources were observed for
$\gtrsim10^{19}\,{{\,\mathrm{cm}^{-2}}}{}$
(see Fig. 7). This suggests that ALMA offers an important way to test the existence of molecular gas in the MS, though this requires considerably better sensitivity than achieved here (note that our sources were observed for $\leq10\,\mathrm{min}$
in ALMA Cycle 2).
$\leq10\,\mathrm{min}$
in ALMA Cycle 2).
Acknowledgements
We note the passing of our scientific colleague Prof. Blair Savage on 2022 July 19 in Madison, Wisconsin. With his students, postdocs, and colleagues, Blair made seminal contributions to studies of the interstellar and intergalactic medium. His enthusiasm for studying molecular hydrogen and dust in the MS was infectious. We would like to thank Nickolas Pingel and Trey Wenger for their insight on this project and continual discussion at group meetings. We would also like to thank Scott Lucchini and Tobias Westmeier for their help in understanding the Magellanic Stream Coordinate System. This project was partially funded by a Hilldale Undergraduate Research Fellowship, awarded in 2021 by the University of Wisconsin–Madison. We would like to thank both the Undergraduate Research Scholars Program at the University of Wisconsin–Madison and the Hilldale Undergraduate Research Fellowship for helping to make this project possible. This paper makes use of the following ALMA data: ADS/JAO.ALMA#2013.1.00700.S. ALMA is a partnership of ESO (representing its member states), NSF (USA) and NINS (Japan), together with NRC (Canada), MOST and ASIAA (Taiwan), and KASI (Republic of Korea), in cooperation with the Republic of Chile. The Joint ALMA Observatory is operated by ESO, AUI/NRAO and NAOJ. The National Radio Astronomy Observatory is a facility of the National Science Foundation operated under cooperative agreement by Associated Universities, Inc.
Data availability
Not applicable.


 Open access