
Place of safety orders constitute Part X of the Mental Health Act 1983, and allow for the temporary detention in a place of safety of an individual in England and Wales while an assessment is made. The two sections commonly used are Section 135 and Section 136. Applications for a warrant under Section 135 can be instigated by a social worker or a constable and authorises access to people in their own homes. Section 136 is instigated by the police and should only be used ‘in a place to which the public have access’, as stated in the Act. A place of safety is defined in the Act as a ‘hospital, police station, mental nursing home or residential home or any other suitable place’.
Previous research has identified that those detained under Section 136 tend to be single, unemployed young men with a mental illness such as schizophrenia, who have previously had one or more psychiatric admissions. Reference Turner, Ness and Imison1 Furthermore, a number of studies have identified ethnicity and social deprivation as important factors. Reference Dunn and Fahy2-Reference Borschmann, Gillard, Turner, Lovell, Goodrich-Purnell and Chambers4 Changes in the use of the Mental Health Act between 1984 and 1996 have been reported. This showed that the use of place of safety orders was starting to increase. Reference Hotopf, Wall, Buchanan, Wessely and Churchill5
The aim of this study was to document in more detail changes in the use of Sections 135 and 136 in England since the introduction of the Mental Health Act 1983 up until the current period, and to investigate whether the rate of subsequent detention in hospital has changed during this time. A comparison was made with the number of detentions in police custody. The change in the rate of detention under Section 136 was compared with changes in other variables such as population of England including Black and minority ethnic population, National Health Service (NHS) bed provision and the number of police officers.
Method
Publicly available data on the use of place of safety orders in England between 1984/1985 and 2010/2011 were obtained from reports on the yearly use of the Mental Health Act by the NHS collected by the Department of Health. 6 The data on Section 136 detentions only included those where the place of safety was an NHS facility, and this was available according to Government Office Region up until 2003/2004. Data on Section 136 detentions where the place of safety was a police station were available only for 2005/2006. Reference Docking, Grace and Bucke7 These were recorded for each police force in England, and were then combined into regions for the purpose of comparing them with the hospital data from 2003/2004. Rates of Section 136 detentions in each region were calculated using the regional population from 2006.
Data on the outcome of Section 136 detention were available from 1988/1989. Information on outcome was incomplete but recorded three outcomes: informal, detention under Section 2, and detention under Section 3. The informal outcome was made up of two groups: those who were admitted on a voluntary basis and those who were discharged immediately back into the community, but the data did not distinguish between these. From 1988/1989, information was recorded on gender of those detained but not on age and ethnicity.
The number of whole-time equivalent (WTE) police officers in England was obtained for each year from the Home Office. Reference Dhani and Kaiza8 The total population of England was recorded as well as the adult population (aged 16 and older). The latter was used to calculate the rate of detention. The White population (White British, White Irish and White other) and the population from Black and minority ethnic groups was also available up to 2009/2010. The average daily number of NHS mental illness beds was recorded for each year of the study. The type of mental illness bed (short-stay, long-stay or secure) is known for the period between 1988/1989 and 2009/2010. These variables are provided in full in online Table DS1. The provision of both police WTE officers and hospital bed numbers was calculated per 100 000 population. One degree of differencing was introduced to calculate annual changes in each of the variables. These were then analysed for any linear correlation. Statistical analysis was carried out using SPSS version 17 for Windows. The data were treated as parametric; percentages, means, standard deviations and Pearson’s correlation were calculated.
Results
The rate of detention under Section 136 to places of safety in hospitals fell slightly and then rose. Overall, it increased more than sixfold from 5.2 to 33.4 per 100 000 adult population (1959 in 1984/1985; 14 111 in 2010/2011). The use of Section 135 also increased, from 0.2 to 0.7 per 100 000 adult population (68 to 288 over the same period). See Fig. 1.
The annual number of place of safety orders (Sections 136 and 135) to English hospitals between 1984/1985 and 2010/1011. Detentions under Sections 2 or 3 subsequent to Section 136 are also shown.
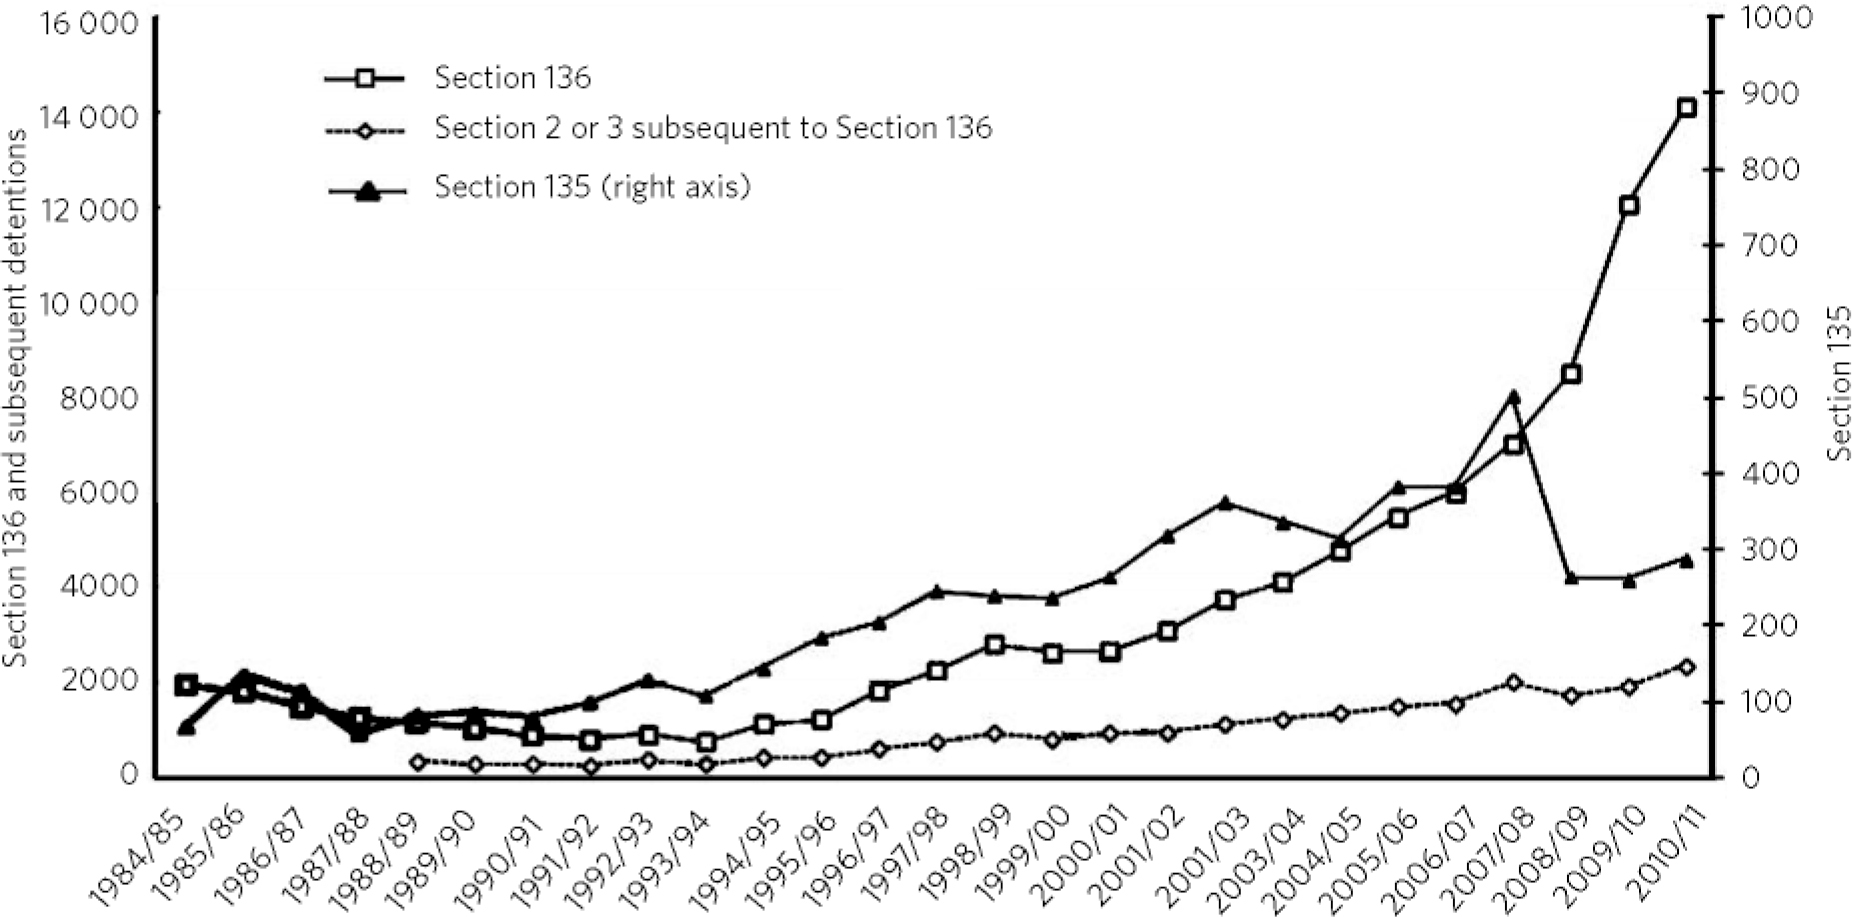
Between 1984/1985 and 1993/1994 there was no correlation between the use of Section 135 and detentions under Section 136 (r = –0.02, n =10, P = 0.97), but from 1994/1995 to 2007/2008 there was a very strong correlation (r = 0.95, n = 14, P<0.001). This link disappeared in 2008/2009 when the number of Section 135 detentions fell slightly. Up to that year the ratio of Section 135:136 detentions was 1:12; this changed to 1:43 between 2008/2009 and 2010/2011.
In total, there were 95 618 detentions under Section 136 and 5896 under Section 135. Data on gender were available from 1988/1989 and on average 59% of Section 136 detentions were of males (s.d. = 2.2, range 54-63%). The proportion of males detained under Section 135 increased steadily, from 40% in 1988/1989 to 57% in 2010/2011, but overall detentions were equally split between the genders (51% male on average between 1988 and 2011, s.d. = 6.7).
In 2003/2004 the average rate of Section 136 detentions to places of safety in NHS facilities in each Government Office Region was 8.5 per 100 000 adult population, and varied from 1.5 in the West Midlands to 24.6 in London. In 2005/2006 the rate of Section 136 detentions in police custody was 24.6, and the corresponding rates were 31.7 in the West Midlands and 1.3 in London (Table 1). Those regions with below-average detentions in NHS facilities tended to be the same regions that 2 years later had above-average numbers of detentions in police custody (r = –0.71, n =9, P = 0.03).
The number and rate of Section 136 detentions in National Health Service (NHS) facilities in 2003/2004 and in police custody in 2005/2006 in each Government Office Region in England
| Section 136 detentions in NHS facilities 2003/2004 | Section 136 detentions in police custody 2005/2006 | |||
|---|---|---|---|---|
| Number | RateFootnote a | Number | RateFootnote a | |
| North East | 55 | 2.6 | 492 | 23.6 |
| North West | 806 | 14.6 | 296 | 5.4 |
| Yorkshire and The Humber | 165 | 4.0 | 1875 | 45.0 |
| East Midlands | 189 | 5.3 | 877 | 24.7 |
| West Midlands | 66 | 1.5 | 1367 | 31.7 |
| East of England | 449 | 9.9 | 496 | 11.0 |
| London | 1488 | 24.6 | 78 | 1.3 |
| South East | 791 | 11.9 | 2685 | 40.3 |
| South West | 97 | 2.3 | 2067 | 49.2 |
| Average(s.d.) | 456 (487) | 8.5 (7.6) | 1137 (907) | 25.8 (17.4) |
a. Rate refers to number per 100 000 adult population.
The outcome of detention under Section 136 was available from 1988 (on average, for 93% of such detentions in each year). The most common outcome was a change to informal status (67%), followed by detention under Section 2 (24%) and detention under Section 3 (9%). However, in years when there were fewer Section 136 detentions to hospitals, a greater proportion were subsequently detained under Section 2 or 3 (48% in 1994/1995). Conversely, in years where there were more Section 136 detentions, a smaller proportion were subsequently detained under Section 2 or 3 (17% in 2009/2010).
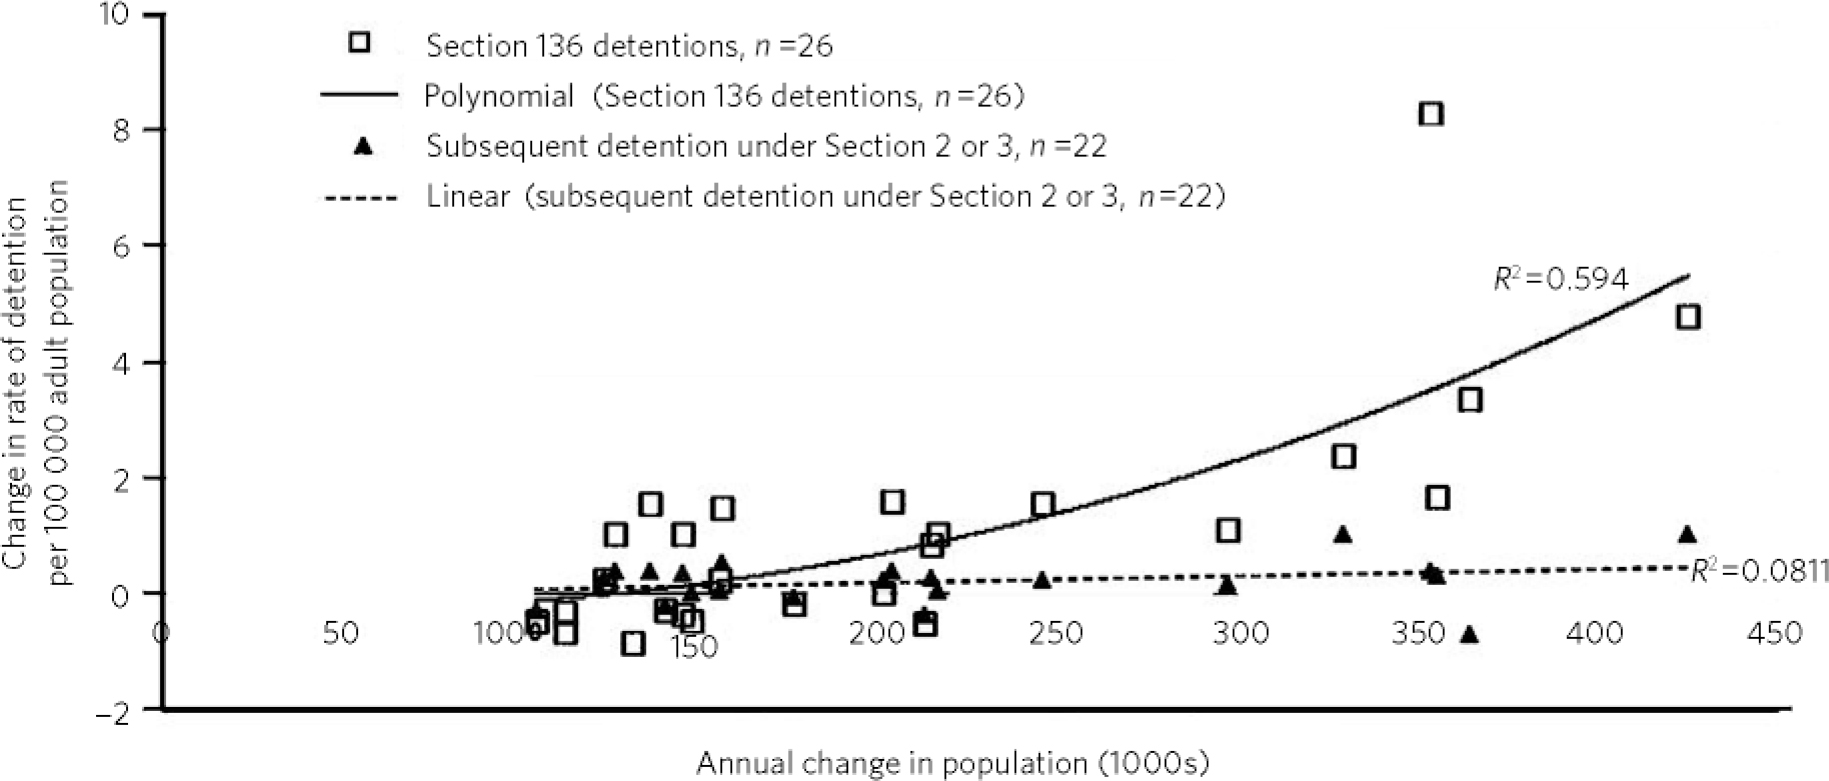
During 1984-2011 the population of England expanded, including the total population, the adult population, as well as the Black and minority ethnic and White population. There was an increase in police numbers (WTE) and secure mental illness beds, whereas the number of short-stay and long-stay mental illness beds fell. All these variables correlated with the annual rate of detentions under Section 136. The association with long-stay beds was non-linear so this was excluded from subsequent analysis. When the annual change in each of the variables was calculated, only the annual change in the total population correlated with the annual change in the rate of detentions under Section 136 (Table 2). This association was strong with informal outcomes (r = 0.70, n = 22, P<0.001) but weak for subsequent detention under Section 2 or 3 (r = 0.28, n = 22, P = 0.20) (Fig. 2).
Annual change in the population of England (1000s) and the annual change in rate of Section 136 detentions (1984/1985-2010/2011) and subsequent detention under Section 2 or 3 of the Mental Health Act (1988/1989-2010/2011).
The association between the rate of detention under Section 136 and police provision, mental illness bed provision, and the population in England between 1984/1985 and 2010/2011, and the association between the annual change in each of these variablesFootnote a
| Rate of detention under Section 136 | ||
|---|---|---|
| Annual total of both variables | Annual change in both variables | |
| Police provision | r = + 0.53 | r =+0.05 |
| n = 27 | n =26 | |
| P = 0.004 | P =0.80 | |
| Short-stay mental illness bed provision | r = −0.96 | r = −0.37 |
| n = 22 | n =21 | |
| P = 0.001 | P =0.11 | |
| Secure mental illness bed provision | r = + 0.92 | r =+0.04 |
| n =22 | n =21 | |
| P<0.001 | P =0.87 | |
| Total population | r = + 0.91 | r = + 0.76 |
| n =27 | n =26 | |
| P<0.001 | P<0.001 | |
| Black and minority ethnic population | r = + 0.90 | r =+0.29 |
| n = 26 | n =25 | |
| P<0.001 | P =0.16 | |
| White population | r =+0.38 | r =+0.12 |
| n =26 | n =25 | |
| P =0.059 | P =0.55 | |
a. Correlations with P<0.01 in bold.
Discussion
The use of place of safety orders in hospitals has increased in England during the past 17 years. It is possible that the changes observed in this study to some degree are the result of a shift from the use of police stations to hospitals as places of safety, reflecting policy driven by the idea that police stations are usually not optimal for this purpose. However, it is unlikely that this accounts for all the increase as even in the last 2 years of the study there continued to be places in England where the majority of Section 136 detentions were in police cells. 9
Interestingly, the relationship between the use of Sections 135 and 136 changed during the study period. Initially, the use of Section 136 fell as for Section 135 it remained steady. This may have reflected a shift in the use of police stations rather than hospitals as places of safety. After 1993/1994 there was a strong link between Section 135 and 136 numbers and this may be further evidence of a real rise in the use of these sections. There were substantial increases in the use of other sections of the Mental Health Act during this period and there is no reason why this has not also applied to the use of place of safety orders. Reference Keown, Weich, Bhu and Scott10 Finally, the last 3 years saw a break in the link between the use of Section 135 and 136 and this may have resulted from amendments made to the Mental Health Act that were introduced in 2007, such as community treatment orders.
An important limitation of this data-set is that apart from one year, it only refers to detention where the place of safety was in a hospital, whereas police stations are also used across the country as places of safety. The data that are available from police stations suggest that in those areas where there were substantial numbers of individuals under a place of safety order taken to hospitals, fewer were taken to police stations. Other factors possibly relevant include the 2007 amendments to the Mental Health Act that increased the flexibility of Section 136 detentions by allowing patients to be conveyed from one place of safety to another.
This alone would not explain the finding that in years with higher numbers of Section 136 detentions, a greater proportion of those detained became informal patients following assessment. This suggests that the threshold for the use of Section 136 may have changed. A possible reason for this may be that many NHS mental health trusts established Section 136 suites during the study period. It is worth noting that staffing levels of the police and other professional groups involved in Section 136 assessments have also increased during this time, Reference Goldberg11 and there have been major changes to the delivery of mental health services in England, including better provision of alternatives to hospital admission. However, in the final analysis the variable that came out as being most strongly associated with the annual change in the rate of detention under Section 136 was the change in the population of England. And this was most strongly associated with Section 136 detentions where the outcome was a change to informal status.
The shift to community-based treatment may not have benefited all groups equally, Reference Keown, Mercer and Scott12 and it may be that those subject to place of safety orders may reflect one such group. Previous research tells us that important variables that are likely to have played a part include social deprivation, social exclusion, ethnicity, urban environments and gender. Further research is needed to investigate the variation in the use of place of safety orders across different regions of England and to obtain more detailed information about those detained, so as to better understand the interaction of these variables.
In addition, two areas warrant further study. The first is to establish how many new places of safety have been set up in NHS hospitals in the past decade, particularly outside of London. Second, 7 years have passed since the last collection of reliable data on the use of police stations as places of safety. Reference Docking, Grace and Bucke7 It is worth repeating this, comparing data for each region with the local number of hospital places of safety, measuring the change in the local population, and gaining the perspective of those who have been subject to a place of safety order and the police regarding the use of these orders. Recent clinical experience of local police indicates that they are less willing to be involved in conveying patients from places of safety to in-patient wards if admission to hospital is the outcome of the assessment, particularly if the nearest available bed is in a hospital at some distance from the place of safety.
How often the Mental Capacity Act 2005 (MCA) has been used to bring people to places of safety is yet to be established. A recent ruling indicates that ‘Sections 5 and 6 MCA 2005 do not confer on police officers authority to remove persons to hospital or other places of safety for the purposes set out in sections 135 and 136’. 13 As a result, the Metropolitan Police have changed their standard operating procedures in terms of how they deal with mentally disordered people. If the Mental Capacity Act was being used routinely for this purpose, then it may be anticipated that this recent ruling could result in a further rise in the use of place of safety orders.


 Open access
eLetters
No eLetters have been published for this article.