


1. Introduction
Inversion of inherited structures is a fundamental process in many contractional orogenic belts (Butler, Reference Butler, Cooper and Williams1989; Williams et al. Reference Williams, Powell, Cooper, Cooper and Williams1989; Marshak, Karlstrom & Timmons, Reference Marshak, Karlstrom and Timmons2000, Butler, Tavarnelli & Grasso, Reference Butler, Tavarnelli and Grasso2006; Mouthereau & Lacombe, Reference Mouthereau and Lacombe2006). Evidence for inversion is present in the northern Andes (Cooper et al. Reference Cooper, Addison, Alvarez, Coral, Graham, Hayward, Howe, Martinez, Naar, Peñas, Pulham and Taborda1995; Mora et al. Reference Mora, Parra, Strecker, Kammer, Dimate and Rodriguez2006) and southern Andes (Ramos et al. Reference Ramos, Zapata, Cristallini, Introcaso and McClay2004; Giambiagi et al. Reference Giambiagi, Mescua, Bechis, Martinez and Folguera2011; Mescua et al. Reference Mescua, Giambiagi, Tassara, Gimenez and Ramos2014), but is limited in the highly shortened central Andes. In the > 3 km high Central Andean Plateau (CAP), defined as a ~1500 × 300 km region spanning southern Peru, Bolivia, and northern Argentina (Isacks, Reference Isacks1988), numerous studies provide insights into the geologic framework (shortening magnitude, structural geometries, fault timing, foreland basin histories, exhumation patterns) (Roeder, Reference Roeder1988; Sheffels, Reference Sheffels1990; Sempere et al. Reference Sempere, Herail, Oller and Bonhomme1990; Gubbels, Isacks & Farrar, Reference Gubbels, Isacks and Farrar1993; Allmendinger et al. Reference Allmendinger, Jordan, Kay and Isacks1997; Baby et al. Reference Baby, Rochat, Mascle and Herail1997; Lamb & Hoke, Reference Lamb and Hoke1997; Horton, Hampton & Waanders, Reference Horton, Hampton and Waanders2001; Horton et al. Reference Horton, Yin, Spurlin, Zhou and Wang2002; McQuarrie, Reference McQuarrie2002a ; DeCelles & Horton, Reference DeCelles and Horton2003; McQuarrie et al. Reference McQuarrie, Horton, Zandt, Beck and DeCelles2005; Oncken et al. Reference Oncken, Hindle, Kley, Elger, Victor, Schemann, Oncken, Chong, Franz, Giese, Gotze, Ramos, Strecker and Wigger2006; Barnes et al. Reference Barnes, Ehlers, McQuarrie, O'Sullivan and Pelletier2006; Gillis, Horton & Grove, Reference Gillis, Horton and Grove2006), geophysical models of crust and lithosphere architecture (Whitman et al. Reference Whitman, Isacks, Chatelain, Chiu and Perez1992; Schmitz, Reference Schmitz1994; Wigger et al. Reference Wigger, Schmitz, Araneda, Asch, Baldzuhn, Giese, Geinsohn, Martinez, Ricaldi, Rower, Viramonte, Reutter, Scheuber and Wigger1994; Beck et al. Reference Beck, Burbank, Sercombe, Riley, Barndt, Berry, Afzal, Khan, Jurgen, Metje, Cheema, Shafique, Lawrence and Khan1995; Whitman, Isacks & Kay, Reference Whitman, Isacks and Kay1996; Myers et al. Reference Myers, Beck, Zandt and Wallace1998; Beck & Zandt, Reference Beck and Zandt2002) and palaeoaltimetry history (Garzione et al. Reference Garzione, Molnar, Libarkin and MacFadden2006, Reference Garzione, Hoke, Libarkin, Withers, MacFadden, Eiler, Ghosh and Mulch2008, Reference Garzione, Auerbach, Smith, Rosario, Passey, Jordan and Eiler2014; Ghosh, Garzione & Eiler, Reference Ghosh, Garzione and Eiler2006; Leier et al. Reference Leier, McQuarrie, Garzione and Eiler2013; Saylor & Horton, Reference Saylor and Horton2014). Despite these advances, debate persists regarding the timing of surface uplift, the role of crustal thickening on plateau and topographic development, and how inherited structural architecture may contribute to the tectonic and magmatic evolution of the Cenozoic Andean orogeny (e.g. Allmendinger, Reference Allmendinger1986; Ehlers & Poulsen, Reference Ehlers and Poulsen2009; Fiorella et al. Reference Fiorella, Poulsen, Pillco Zolá, Barnes, Tabor and Ehlers2015).
Along-strike variations in structural style have been attributed to changes in pre-orogenic sedimentary basin distribution and architecture (Allmendinger et al. Reference Allmendinger, Ramos, Jordan, Palma and Isacks1983; Allmendinger & Gubbels, Reference Allmendinger and Gubbels1996; McQuarrie, Reference McQuarrie2002b ), changes in the geometry of the subducting Nazca slab (Barazangi & Isacks, Reference Barazangi and Isacks1976; Cahill & Isacks, Reference Cahill and Isacks1992), spatial variations in climate and basin integration (Horton, Reference Horton1998, Reference Horton1999; Riller & Oncken, Reference Riller and Oncken2003; Strecker et al. Reference Strecker, Alonso, Bookhagen, Carrapa, Hilley, Sobel and Trauth2007), the role of along-strike motion of material potentially by lower crustal flow (Hindle et al. Reference Hindle, Kley, Oncken and Sobolev2005; Arriagada et al. Reference Arriagada, Roperch, Mpodozis and Cobbold2008; Eichelberger & McQuarrie, Reference Eichelberger and McQuarrie2015), the inherited structural framework from pre-Andean deformation (Ramos, Cegarra & Cristallini, Reference Ramos, Cegarra and Cristallini1996; Kley & Monaldi, Reference Kley and Monaldi1998; Mouthereau, Watts & Burov, Reference Mouthereau, Watts and Burov2013) and rheological, strength, and temperature changes of the crust and lithosphere (Watts et al. Reference Watts, Lamb, Fairhead and Dewey1995; Babeyko & Sobolev, Reference Babeyko and Sobolev2005). Previous balanced cross-sections have focused more on the central (Bolivia) and southern (Argentina) segments (Allmendinger et al. Reference Allmendinger, Figueroa, Snyder, Beer, Mpodozis and Isacks1990; Grier, Salfity & Allmendinger, Reference Grier, Salfity and Allmendinger1991; Dunn, Hartshorn & Hartshorn, Reference Dunn, Hartshorn, Hartshorn, Tankard, Suarez and Welsink1995; Kley, Reference Kley1996; Baby et al. Reference Baby, Rochat, Mascle and Herail1997; Kley, Monaldi & Salfity, Reference Kley, Monaldi and Salfity1999; Kley & Monaldi, Reference Kley and Monaldi2002; McQuarrie, Reference McQuarrie2002a ; Müller, Kley & Jacobshagen, Reference Müller, Kley and Jacobshagen2002; Elger, Oncken & Glodny, Reference Elger, Oncken and Glodny2005; Kley et al. Reference Kley, Rossello, Monaldi and Habighorst2005; McQuarrie, Barnes & Ehlers, Reference McQuarrie, Barnes and Ehlers2008; Menichetti, Lodolo & Tassone, Reference Menichetti, Lodolo and Tassone2008; Monaldi, Salfity & Kley, Reference Monaldi, Salfity and Kley2008; Giambiagi et al. Reference Giambiagi, Mescua, Bechis, Martinez and Folguera2011; Sagripanti et al. Reference Sagripanti, Bottesi, Kietzmann, Folguera and Ramos2012; Pearson et al. Reference Pearson, Kapp, DeCelles, Reiners, Gehrels, Ducea and Pullen2013; Mescua et al. Reference Mescua, Giambiagi, Tassara, Gimenez and Ramos2014), than the northern (Peruvian) segment (W. F. Gil Rodriguez, unpub. Ph.D. thesis, Univ. Paul Sabatier, Reference Gil Rodriguez, Baby and Ballard2001; Gil Rodriguez, Baby & Ballard, Reference Gil Rodriguez, Baby and Ballard2001; Gotberg, McQuarrie & Carlotto Reference Gotberg, McQuarrie and Caillaux2010; Espurt et al. Reference Espurt, Barbarand, Roddaz, Brusset, Baby, Saillard and Hermoza2011; Scherrenberg, Holcombe & Rosenbaum, Reference Scherrenberg, Holcombe and Rosenbaum2014; Eude et al. Reference Eude, Roddaz, Brichau, Brusset, Calderon, Baby and Soula2015). In the Bolivian CAP, cross-section reconstructions emphasize thin-skinned deformation with minimal reactivation of pre-existing structures. In contrast, segments of the southern Andes in Argentina and the northern Andes of northern Peru, Ecuador and Colombia (Cooper et al. Reference Cooper, Addison, Alvarez, Coral, Graham, Hayward, Howe, Martinez, Naar, Peñas, Pulham and Taborda1995; PARSEP, 2000; Hermoza et al. Reference Hermoza, Brusset, Baby, Gil, Roddaz, Guerrero and Bolanos2005; Mora et al. Reference Mora, Parra, Strecker, Kammer, Dimate and Rodriguez2006; Bayona et al. Reference Bayona, Cortes, Jaramillo, Ojeda, Aristizabal and Reyes-Harker2008; Baby et al. Reference Baby, Rivadeneira, Barragan, Christophoul, Nemčok, Mora and Cosgrove2013; Eude et al. Reference Eude, Roddaz, Brichau, Brusset, Calderon, Baby and Soula2015) have been recognized as zones wherein pre-existing extensional structures (e.g. Salta rift system) exert an important influence on later Andean shortening. The role of inherited lithospheric strength may also have an important role on the style and magnitude of deformation. Higher effective elastic thicknesses (Te) correlate with higher shortening magnitudes in the Central Andes of Bolivia, whereas Te and shortening magnitudes are lower in parts of Peru, Colombia and the Sierras Pampeanas of Argentina (Watts et al. Reference Watts, Lamb, Fairhead and Dewey1995; Mouthereau, Watts & Burov, Reference Mouthereau, Watts and Burov2013), potentially owing to the magnitude and orientation of pre-existing faults. Recent syntheses highlight numerous pre-Cenozoic extensional structures along much of the Andean orogen, but a paucity of normal faults in southern Peru and Bolivia (McGroder, Lease & Pearson, Reference McGroder, Lease, Pearson, DeCelles, Ducea, Carrapa and Kapp2015) despite a proposed Permo-Triassic rift system in this part of the central Andes (Sempere et al. Reference Sempere, Carlier, Soler, Fornari, Carlotto, Jacay, Arispe, Néraudeau, Cárdenas, Rosas and Jiménez2002). Identifying the location and potential selective reactivation of inherited structures is key to defining lateral variations in structural style, magnitude of deformation and the kinematic links between well-documented segments of the Andean chain (Mpodozis & Ramos, Reference Mpodozis, Ramos, Ericksen, Cañas Pinochet and Reinemund1989; Kley & Monaldi, Reference Kley and Monaldi1998; Kley, Monaldi & Salfity, Reference Kley, Monaldi and Salfity1999).
The proliferation of thermochronologic datasets affords the opportunity to constrain kinematic models of fold–thrust evolution. Conflicting interpretations support either in-sequence thrust activation (McQuarrie et al. Reference McQuarrie, Horton, Zandt, Beck and DeCelles2005; Barnes et al. Reference Barnes, Ehlers, McQuarrie, O'Sullivan and Pelletier2006, Reference Barnes, Ehlers, McQuarrie, O'Sullivan and Tawackoli2008) or synchronous deformation across broad zones of the CAP (Elger, Oncken & Glodny, Reference Elger, Oncken and Glodny2005; Oncken et al. Reference Oncken, Hindle, Kley, Elger, Victor, Schemann, Oncken, Chong, Franz, Giese, Gotze, Ramos, Strecker and Wigger2006; Ege et al. Reference Ege, Sobel, Scheuber and Jacobshagen2007). Existing exhumational records suggest Eocene and younger development of the Eastern Cordillera in southern Peru and Bolivia (Benjamin, Johnson & Naeser, Reference Benjamin, Johnson and Naeser1987; Farrar et al. Reference Farrar, Clark, Kontak and Archibald1988; Kontak et al. Reference Kontak, Farrar, Clark and Archibald1990; Gillis, Horton & Grove, Reference Gillis, Horton and Grove2006), with deformation propagating to the Subandean Zone after ~25–20 Ma (Horton, Reference Horton2005; Barnes et al. Reference Barnes, Ehlers, McQuarrie, O'Sullivan and Pelletier2006, Reference Barnes, Ehlers, McQuarrie, O'Sullivan and Tawackoli2008; Espurt et al. Reference Espurt, Barbarand, Roddaz, Brusset, Baby, Saillard and Hermoza2011; Eude et al. Reference Eude, Roddaz, Brichau, Brusset, Calderon, Baby and Soula2015). Thermochronologic results show ~13–7 Ma canyon incision linked to uplift along the western CAP margin (Schildgen et al. Reference Schildgen, Hodges, Whipple, Reiners and Pringle2007, Reference Schildgen, Ehlers, Whipp, van Soest, Whipple and Hodges2009; Gunnell et al. Reference Gunnell, Thouret, Brichau, Carter and Gallagher2010) and Pliocene canyon incision linked to enhanced climate-driven erosion along the eastern CAP margin (Lease & Ehlers, Reference Lease and Ehlers2013). Across the central Andes, geomorphologic and thermochronologic investigations suggest Miocene and younger exhumation driven by a complex interplay between tectonically and climatically controlled erosional processes (Strecker et al. Reference Strecker, Alonso, Bookhagen, Carrapa, Coutand, Hain, Hilley, Mortimer, Schoenbohm and Sobel2009; Barnes et al. Reference Barnes, Ehlers, Insel, McQuarrie and Poulsen2012; Whipple & Gasparini, Reference Whipple and Gasparini2014).
Cenozoic hinterland and foreland basins are well preserved in the elevated orogenic interior and flanking lowland regions between the mountain belt and South American craton (Jordan, Reference Jordan, Busby and Ingersoll1995; Horton, Reference Horton, Busby and Azor2012). Ongoing debates focus on whether these depocentres reflect isolated long-lived basin systems or were once contiguous, then later partitioned by uplift of the Eastern Cordillera (e.g. Cooper et al. Reference Cooper, Addison, Alvarez, Coral, Graham, Hayward, Howe, Martinez, Naar, Peñas, Pulham and Taborda1995; Horton, Reference Horton2005; Mortimer et al. 2007; Horton et al. Reference Horton, Saylor, Nie, Mora, Parra, Reyes-Harker and Stockli2010, Reference Horton, Perez, Fitch and Saylor2015; Moreno et al. 2011; Siks & Horton, Reference Siks and Horton2011; Saylor et al. Reference Saylor, Horton, Stockli, Mora and Corredor2012; Pingel et al. Reference Pingel, Strecker, Alonso and Schmitt2013; Perez & Horton, Reference Perez and Horton2014). In central and northern Peru, the existence of a long-lived structural high along the Eastern Cordillera (‘Marañon High’ or ‘Marañon Geanticline’, separating the East and West Peruvian Troughs) has been proposed to explain observed stratigraphic relationships between the separated hinterland and foreland basins (Benavides-Caceres, Reference Benavides-Caceres1956; Wilson, Reference Wilson1963; Mégard, Reference Mégard1978, Reference Mégard1984; Dalmayrac, Laubacher & Marocco, Reference Dalmayrac, Laubacher and Marocco1980; Benavides-Caceres, Reference Benavides-Caceres and Skinner1999; Jaillard, Bengtson & Dhondt, Reference Jaillard, Bengtson and Dhondt2005). In the Eastern Cordillera of Bolivia, Eocene exhumation has been interpreted as the initial partitioning of a once-continuous foreland basin system (DeCelles & Horton, Reference DeCelles and Horton2003; McQuarrie et al. Reference McQuarrie, Horton, Zandt, Beck and DeCelles2005). Resolution of this issue has implications for palaeogeographic reconstructions, and testing the genetic links between flexural foreland/hinterland basin evolution and fold–thrust belts.
This regional study at 13–15°S in southern Peru presents new estimates of total shortening across the Eastern Cordillera and Subandean Zone constrained by a regional balanced cross-section and the timing of exhumational cooling from parts of the Subandean Zone and Eastern Cordillera from apatite and zircon (U–Th)/He thermochronology. We also identify major pre-Andean normal faults selectively reactivated during Cenozoic orogenesis and use U–Pb detrital zircon geochronology to establish the Cretaceous through Cenozoic provenance record of the Altiplano and Subandean basins. These data provide insights into the geometry, timing and kinematics of Cenozoic deformation in southern Peru, the role of inherited structural and stratigraphic architectures on strain and kinematics, and the long-term evolution of major Andean depocentres.
2. Background
2.a. Tectonic framework
In southern Peru, along the northern limb of the Bolivian Orocline, the dominant WNW–ESE structural grain departs from the N–S strike that characterizes much of the Andes. The Altiplano is a high-elevation, low-relief plateau between the Western Cordillera (a Neogene magmatic arc) and Eastern Cordillera (an exhumed fold–thrust belt composed of Palaeozoic–Mesozoic strata) (Fig. 1a). Further inboard, the Subandean Zone (thin-skinned frontal thrust belt composed of Mesozoic–Cenozoic strata) defines the deformation front and border with the active foreland basin. The structural boundary between the Altiplano and Eastern Cordillera is defined by the NE-dipping Ayaviri fault (Fig. 1a), part of a larger fault system that persists ~400 km along strike from 14° to 18°S (Sempere et al. Reference Sempere, Herail, Oller and Bonhomme1990; Perez & Horton, Reference Perez and Horton2014). The Eastern Cordillera–Subandean boundary is marked by the Main Andean Thrust, which places Ordovician on Cretaceous–Cenozoic rocks. Exposed faults are all brittle structures and no ductile shear zones were observed along this transect.
(Large-scale image available in the online Supplementary Material at http://journals.cambridge.org/geo) (a) DEM topography of the central Andes (after Garzione et al. Reference Garzione, Auerbach, Smith, Rosario, Passey, Jordan and Eiler2014) showing study area (red outline). (b) Compiled 1:100000 geologic map quadrangles at 1:250000 scale. Bedding orientation, fault and fold data from own observations. Note locations of new and previous thermochronology samples. (c) Line-length balanced cross-section from transects across study area. Cross-section annotations: 1 – Foreland taper, stratigraphic thickness constrained from Mathalone & Montoya (Reference Mathalone, Montoya, Tankard, Suárez and Welsink1995). 2 – Extra slip on Cretaceous fault used to balance shortening in Palaeozoic duplex below. 3 – Palaeozoic duplex used to elevate Cretaceous section about Cenozoic foreland deposits. 4 – Thin Palaeozoic in Main Andean Thrust hanging wall achieved by second detachment near the top of the San Jose Formation. Map relationships constrain thickening of Palaeozoic succession to the SW. Folding over footwall cutoff honours bedding data. 5 – Wide map exposure of Middle Ordovician San Jose Formation achieved with long flat elevated by 10 km thick basement trust. 6 – Slip on basement thrust B1 fed into Subandean Zone. 7 – Slip on different faults displaces continuation of Cordillera de Carabaya pluton surface exposures. 8 – Hanging wall, footwall cutoff for inverted basement-involved normal fault B2. Thrust motion on B2 fed slip into the Eastern Cordillera. 9 – Folds, faults Carboniferous–Permian rocks are depicted accurately in the deformed section, schematically in the restored section. Constraints from mapping and down-plunge projection. 10 – Long map contact between the CABB and Macusani structural zone is a deposition contact between Cretaceous and underlying Triassic Mitu Group rocks. 11 – Hanging wall, footwall cut off for inverted basement-involved normal fault B3. Thrust motion on B3 fed displacement, guided vergence of the CABB. 12 – Ayaviri thrust fault active at ~28–26 Ma based on chronostratigraphic constraints from footwall growth strata (Perez & Horton, Reference Perez and Horton2014). 13 – Pasani thrust fault active at ~17–16 Ma based on chronostratigraphic constraints from footwall growth strata (Perez & Horton, Reference Perez and Horton2014). 14 – South of the Pasani fault exposures are dominated by Neogene igneous cover. 15 – Slip on basement thrust sheets needed to balance shortening in Phanerozoic section.


The Eastern Cordillera is a doubly vergent thrust wedge that is composed of three structural domains, each ~50–60 km wide, and defined by abrupt changes in structural/stratigraphic exposure levels (Fig. 1b). (1) The Central Andean Backthrust Belt (CABB) (McQuarrie & DeCelles, Reference McQuarrie and DeCelles2001) is a SW-verging system of thrust faults and folds in southern Peru and Bolivia, where it is also known as the Huarina fold–thrust belt (Sempere et al. Reference Sempere, Herail, Oller and Bonhomme1990). Although most CABB exposures in southern Peru consist of Cretaceous sandstones, siltstones and limestones, lower Palaeozoic structural levels are exposed in Bolivia. (2) The Macusani structural zone, previously referred to as the Precordillera de Carabaya (Kontak et al. Reference Kontak, Farrar, Clark and Archibald1990; Sandeman et al. Reference Sandeman, Clark, Farrar and Pauca1997) or ‘Late Hercynian’ fold domain (Laubacher, Reference Laubacher1978), is distinguished by an abrupt increase in exposed structural levels (>4 km) relative to the CABB, and oblique orientations of faults and folds in Carboniferous–Permian strata relative to the main Andean trends. These features have been attributed to late Palaeozoic (‘Late Hercynian’) deformation (Mégard et al. Reference Mégard, Dalmayrac, Laubacher, Marocco, Martinez, Paredes and Tomasi1971; Laubacher, Reference Laubacher1978; Dalmayrac, Laubacher & Marocco, Reference Dalmayrac, Laubacher and Marocco1980; Clark et al. Reference Clark, Farrar, Kontak, Langridge, Arenas, France, McBride, Woodman, Wasteneys, Sandeman and Archibald1990). (3) The Cordillera de Carabaya (McBride, Robertson & Clark, Reference McBride, Robertson and Clark1983; Clark et al. Reference Clark, Farrar, Kontak, Langridge, Arenas, France, McBride, Woodman, Wasteneys, Sandeman and Archibald1990; Sandeman, Clark & Farrar, Reference Sandeman, Clark and Farrar1995) is defined by a suite of Permo-Triassic plutons (Kontak et al. Reference Kontak, Farrar, Clark and Archibald1990; Mišković et al. Reference Mišković, Spikings, Chew, Kosler, Ulianov and Schaltegger2009) that hold up the topographic crest (up to 5500 m) of the Eastern Cordillera. To the northeast, Ordovician–Devonian rocks mark another discrete increase in exposed structural levels and the transition to the frontal segment of the Eastern Cordillera.
Much of the Phanerozoic stratigraphic record is preserved in the ~16 km thick succession of the Eastern Cordillera (Laubacher, Reference Laubacher1978; Reimann Zumsprekel et al. Reference Reimann Zumsprekel, Bahlburg, Carlotto, Boekhout, Berndt and Lopez2015). In southern Peru, most of this succession is defined by marine Ordovician to Devonian siliciclastic deposits (~7 km) and Carboniferous–Permian marine clastic and carbonate rocks (~4 km). A Triassic succession (>2 km), the Mitu Group, preserves non-marine conglomerate, volcanic and siliciclastic rocks interpreted as synrift deposits (Noble et al. Reference Noble, Silberman, Mégard and Bowman1978; Dewey, Reference Dewey1988; Rosas, Fontbote & Tankard, Reference Rosas, Fontbote and Tankard2007; Ramos, Reference Ramos, Kay, Ramos and Dickinson2009; Reitsma, Reference Reitsma2012; McGroder, Lease & Pearson, Reference McGroder, Lease, Pearson, DeCelles, Ducea, Carrapa and Kapp2015). Jurassic rocks are absent, but a Cretaceous section (~3 km) preserves marine and non-marine clastic and carbonate rocks. Thick Carboniferous–Triassic deposits are preferentially preserved in the Macusani structural zone but are very thin or absent in other segments of the Eastern Cordillera. In contrast to Bolivia (McQuarrie, Barnes & Ehlers, Reference McQuarrie, Barnes and Ehlers2008), the Eastern Cordillera of southern Peru preserves pre-Andean unconformities, often angular, among Devonian–Carboniferous, Permo-Triassic and Triassic–Cretaceous strata (Newell, Reference Newell1949; Mégard et al. Reference Mégard, Dalmayrac, Laubacher, Marocco, Martinez, Paredes and Tomasi1971; Laubacher & Mégard, Reference Laubacher, Mégard, Pitcher, Atherton, Cobbing and Beckinsale1985; Sempere et al. Reference Sempere, Carlier, Soler, Fornari, Carlotto, Jacay, Arispe, Néraudeau, Cárdenas, Rosas and Jiménez2002). Cenozoic synorogenic deposits (>4 km) are preserved in the Altiplano and Subandean Zone, with thin restricted accumulations in the Eastern Cordillera.
The axis of a late Palaeozoic – early Mesozoic rift system is proposed along the modern Eastern Cordillera (Sempere et al. Reference Sempere, Carlier, Soler, Fornari, Carlotto, Jacay, Arispe, Néraudeau, Cárdenas, Rosas and Jiménez2002). Throughout Peru, rapid lateral changes in facies and thicknesses within the Triassic Mitu Group have been interpreted as non-marine synrift fill deposited on folded Palaeozoic rocks (Reitsma, Reference Reitsma2012). Despite widespread preservation of the Mitu Group, only industry reflection seismic datasets from central and northern Peru have identified subsurface pre-Andean normal faults (Hermoza et al. Reference Hermoza, Brusset, Baby, Gil, Roddaz, Guerrero and Bolanos2005; Eude et al. Reference Eude, Roddaz, Brichau, Brusset, Calderon, Baby and Soula2015).
2.b. Geochronologic and thermochronologic records
Detrital zircon U–Pb age spectra help constrain maximum depositional ages, sediment provenance and palaeogeographic reconstructions (Gehrels, Reference Gehrels, Busby and Azor2012). Previous datasets have established the characteristic age populations of Proterozoic, Palaeozoic and Mesozoic rocks exposed throughout the Western and Eastern Cordilleras (Loewy, Connelly & Dalziel, Reference Loewy, Connelly and Dalziel2004; Chew et al. Reference Chew, Schaltegger, Kosler, Whitehouse, Gutjahr, Spikings and Miskovic2007, Reference Chew, Magna, Kirkland, Mišković, Cardona, Spikings and Schaltegger2008; Mišković et al. Reference Mišković, Spikings, Chew, Kosler, Ulianov and Schaltegger2009; Mišković & Schaltegger, Reference Mišković and Schaltegger2009; Reimann et al. Reference Reimann, Bahlburg, Kooijman, Berndt, Gerdes, Carlotto and Lopez2010; Bahlburg et al. Reference Bahlburg, Vervoort, DuFrane, Carlotto, Reimann and Cardenas2011; Boekhout et al. Reference Boekhout, Sempere, Spikings and Schaltegger2013; Decou et al. Reference Decou, Von Eynatten, Dunkl, Frei and Worner2013; Perez & Horton, Reference Perez and Horton2014). Here we summarize key U–Pb zircon age populations of potential sediment sources (Western and Eastern Cordilleras, South American craton and Cretaceous–Neogene magmatic arc) to determine preliminary constraints on the provenance and tectonic framework of Cretaceous through Cenozoic rocks deposited in the Altiplano and Subandean basins.
The Arequipa/Antofalla terrane (basement) is characterized by zircon ages of 476–440 Ma, ~1200–940 Ma and ~2020–1790 Ma (Loewy, Connelly & Dalziel, Reference Loewy, Connelly and Dalziel2004; Decou et al. Reference Decou, Von Eynatten, Dunkl, Frei and Worner2013). Neoproterozoic–lower Palaeozoic rocks of the Eastern Cordillera of Peru are dominated by U–Pb zircon ages between ~700–450 Ma and 1300–900 Ma, with minor populations of ~2100–1500 Ma zircons (Chew et al. Reference Chew, Magna, Kirkland, Mišković, Cardona, Spikings and Schaltegger2008). Ordovician–Devonian rocks of the Eastern and Western Cordilleras preserve dominantly 800–400 Ma, 1200–900 Ma and 2200–1600 Ma peaks, with minor occurrences of other populations (Reimann et al. Reference Reimann, Bahlburg, Kooijman, Berndt, Gerdes, Carlotto and Lopez2010; Bahlburg et al. Reference Bahlburg, Vervoort, DuFrane, Carlotto, Reimann and Cardenas2011; Decou et al. Reference Decou, Von Eynatten, Dunkl, Frei and Worner2013; Perez & Horton, Reference Perez and Horton2014). Plutonic rocks of the Eastern Cordillera show a unique ~350–160 Ma signal (Mišković & Schaltegger, Reference Mišković and Schaltegger2009). Mesozoic rocks of the Eastern and Western Cordilleras are characterized by recycled populations observed in Palaeozoic–Proterozoic rocks. The Western Cordillera is distinguished as the main source of Cretaceous–Cenozoic zircons resulting from long-lived magmatic-arc activity. Cratonic blocks of eastern South America preserve characteristic age populations: 1200–900 Ma, 1550–1200 Ma, 1800–1550 Ma, 2000–1800 Ma, 2200–1900 Ma and >2300 Ma (Restrepo-Pace et al. Reference Restrepo-Pace, Ruiz, Gehrels and Cosca1997; Ramos, Reference Ramos, Cordani, Milani, Thomaz Filho and Campos2000; Tassinari et al. Reference Tassinari, Bettencourt, Geraldes, Macambira, Lafon, Cordani, Milani, Thomaz Filho and Campos2000; Cordani et al. Reference Cordani, Sato, Teixeira, Tassinari, Basei, Cordani, Milani, Thomaz Filho and Campos2000; Bahlburg, Carlotto & Cardenas, Reference Bahlburg, Carlotto and Cardenas2006; Bahlburg et al. Reference Bahlburg, Vervoort, DuFrane, Carlotto, Reimann and Cardenas2011).
Although many detrital ages observed in pre-Cretaceous rocks of the Western and Eastern Cordilleras are reworked, three key populations are diagnostic of distinct sediment source areas. Zircon ages of ~350–160 Ma appear limited to Eastern Cordillera sources, Cretaceous–Cenozoic ages are characteristic of the Western Cordillera and ~1400–1300 Ma ages distinguish Rondonia/San Ignacio sources in Bolivia from other potential South America cratonic block sources. With the establishment of these distinctive populations, provenance signatures in the Cretaceous–Cenozoic record from the Altiplano/CABB and Subandean Zone can potentially be linked with their respective sources.
K–Ar and 40Ar–39Ar ages, and apatite and zircon fission track studies suggest initial exhumation in the Eastern Cordillera of southern Peru and northern Bolivia between ~45 and 38 Ma (Benjamin, Johnson & Naeser, Reference Benjamin, Johnson and Naeser1987; Farrar et al. Reference Farrar, Clark, Kontak and Archibald1988; Gillis, Horton & Grove, Reference Gillis, Horton and Grove2006). In Peru this cooling has been linked to a poorly defined episode of shortening. Apatite and zircon (U–Th)/He results suggest younger Eastern Cordillera cooling attributed to continued thrust deformation and climate change (Lease & Ehlers, Reference Lease and Ehlers2013).
3. Results
3.a. Geologic mapping
Mapping and structural transects were conducted and compiled from INGEMMET (1999) 1:100000 geologic maps. Fault, fold, stratigraphic and/or bedding data were collected at more than 1200 stations along several transects perpendicular to structural grain. The orientations of these transects change across strike as fault and fold orientations vary. Breaks in section occur on structures that can be mapped along strike. Below we discuss key elements of morphotectonic domains within the study area.
3.a.1. Foreland
Reflection seismic and borehole datasets for the Madre de Dios foreland basin show < 2 km Cretaceous and >4 km Cenozoic sequences unconformably deposited on a lower Palaeozoic succession above a ~2° SW-dipping basement–cover interface (Mathalone & Montoya, Reference Mathalone, Montoya, Tankard, Suárez and Welsink1995). Surface exposures are dominated by Neogene–Quaternary clastic deposits. Modern fluvial traces are often parallel to exposed frontal Subandean structures, suggesting that long-wavelength, low-amplitude folds accommodating deformation guide fluvial channels.
3.a.2. Subandean Zone
The Subandean Zone is characterized by a ~12–13 km wide zone of Cretaceous marine siliciclastic rocks deformed mostly by NW-trending, upright, non-plunging, ~5–6 km spaced folds with ~20–60° bedding dips. Two major thrust faults juxtapose Cretaceous marine siliciclastic rocks on Palaeogene fluvial siltstones and sandstones (INGEOMIN, 1975; Mathalone & Montoya, Reference Mathalone, Montoya, Tankard, Suárez and Welsink1995; Kley, Monaldi & Salfity, Reference Kley, Monaldi and Salfity1999). Local, outcrop-scale intraformational duplexes and tight folds are rare (Fig. 2a, b). These features are considered minor relative to thrust faults that offset the Cretaceous and Cenozoic strata, but suggest that total shortening may be higher than quantified by geologic mapping or cross-section construction. The deepest structural level observed is the Lower Cretaceous Oriente Group exposed in anticlines and thrust fault hanging walls (Mathalone & Montoya, Reference Mathalone, Montoya, Tankard, Suárez and Welsink1995).
Examples of minor tens of metres–scale folding below resolution of mapping and cross-section. (a) Outcrop-scale duplex of Cretaceous rocks from the Subandean Zone. (b) Road-cut of folded Cretaceous rocks from the Subandean Zone. Note highway sign circled for scale is c. 2 m high.

3.a.3. Eastern Cordillera
The frontal Eastern Cordillera exhibits an abrupt change in structural style and >10 km increase in exposed stratigraphic levels across the Main Andean Fault compared to the Subandean Zone. Map patterns define major folds of ~30 km wavelength. The deepest structural level exposed is the Middle Ordovician San Jose Formation, suggesting a regional décollement above the basement contact. At the outcrop scale, rocks exhibit a variety of tight folds over short distances, kilometre-wide panels of similar dips, and bedding orientations that are both parallel to Andean NW–SE trends (~290–300° or 110–120°) or oblique (~350°), similar to patterns observed in the Bolivian Eastern Cordillera (Eichelberger et al. Reference Eichelberger, McQuarrie, Ehlers, Enkelmann, Barnes and Lease2013).
In detail, we observe three zones with discrete stratigraphic levels in the Eastern Cordillera. (1) The ~35 km wide NE zone is characterized by a broad syncline/anticline pair that deforms Middle Ordovician to Silurian–Devonian meta-sedimentary rocks and Triassic plutons. Lateral variations in Ordovician unit thickness suggest original stratigraphic geometries tapered towards the craton. (2) The axial zone (~21 km wide) is separated from the NE zone by a NE-dipping, SW-verging thrust fault that places the Middle Ordovician San Jose Formation on the Upper Ordovician Sandia Formation. The axial zone is characterized by a broad map syncline, with smaller scale internal folds concentrated towards the SW boundary, and a consistent structural level throughout. These Ordovician rocks are metamorphosed near a large Triassic pluton. The axial zone is thrust over the (3) SW zone of Silurian–Devonian rocks (~10 km wide) that are the structurally highest level within the frontal Eastern Cordillera. The SW zone is thrust over the Cordillera de Carabaya/Macusani structural zone by a NE-dipping reverse fault.
3.a.4. Cordillera de Carabaya/Macusani structural zone
The Cordillera de Carabaya is defined by Permo-Triassic plutons that intrude Ordovician–Carboniferous strata (McBride, Robertson & Clark, Reference McBride, Robertson and Clark1983; Clark et al. Reference Clark, Farrar, Kontak, Langridge, Arenas, France, McBride, Woodman, Wasteneys, Sandeman and Archibald1990; Kontak et al. Reference Kontak, Farrar, Clark and Archibald1990; Sandeman, Clark & Farrar, Reference Sandeman, Clark and Farrar1995; Mišković et al. Reference Mišković, Spikings, Chew, Kosler, Ulianov and Schaltegger2009) and smaller, rare Jurassic plutons that intrude Triassic Mitu Group deposits. The plutons are aligned with the NW–SE Andean structural grain. The NE margin of the Macusani structural zone is defined by the SW-directed thrust contact between the Cordillera de Carabaya plutons and the Eastern Cordillera. The SW boundary is the depositional contact with the CABB.
The Macusani structural zone maintains a consistent structural elevation ~50 km across strike. Our mapping confirms three main phases of pre-Andean deformation in the region, which have been proposed previously (Mégard et al. Reference Mégard, Dalmayrac, Laubacher, Marocco, Martinez, Paredes and Tomasi1971; Laubacher, Reference Laubacher1978; Mégard, Reference Mégard1978; Dalmayrac, Laubacher & Marocco, Reference Dalmayrac, Laubacher and Marocco1980; Laubacher & Mégard, Reference Laubacher, Mégard, Pitcher, Atherton, Cobbing and Beckinsale1985; Jimenez, Lopez-Velasquez & Santivañez, Reference Jimenez, Lopez-Velasquez and Santivañez2009). The first phase (known as Eohercynian deformation) occurred during Late Devonian – Early Carboniferous time and folds Silurian–Devonian rocks about NW-trending, shallowing plunging synclines and anticlines (Dalmayrac, Laubacher & Marocco, Reference Dalmayrac, Laubacher and Marocco1980; Laubacher & Mégard, Reference Laubacher, Mégard, Pitcher, Atherton, Cobbing and Beckinsale1985). These folds are truncated by an erosional unconformity and covered by a ~4 km thick succession of Carboniferous–Permian shales, quartzites and carbonates (Fig. 3). These upper Palaeozoic units dominate exposures in the Macusani structural zone beneath Mitu Group deposits. The Carboniferous–Permian rocks preserve faults and folds attributed to a second, late Permian, deformation phase (‘Late Hercynian’). Faults and folds that deform upper Palaeozoic strata often have short map traces (~10 and ~6–7 km) and a ~6–7 km fold wavelength with NW and NE sigmoidal orientations that are conspicuously oblique or nearly perpendicular to regional Andean trends. These have been interpreted as originally NW-trending en échelon folds that formed in a left-lateral shear zone and were refolded, potentially by continued deformation or changing stress orientations (Laubacher, Reference Laubacher1978). Alternatively, similar sigmoidal structures have been interpreted as fold interference patterns related to basement-involved thrusts (Carrera et al. Reference Carrera, Munoz, Sabat, Mon and Roca2006). Non-coaxially deformed upper Palaeozoic strata (~4 km thick) occur only in the Macusani structural zone and are absent from the CABB, Eastern Cordillera and Subandean Zone. A second erosional unconformity separates folded Carboniferous–Permian rocks from the overlying Triassic Mitu Group (Fig. 4). Despite proposed deposition in a Triassic rift environment (Newell, Reference Newell1949; Sempere et al. Reference Sempere, Carlier, Soler, Fornari, Carlotto, Jacay, Arispe, Néraudeau, Cárdenas, Rosas and Jiménez2002; Reitsma, Reference Reitsma2012), only one associated normal fault has been identified at outcrop scale (Fig. 4). The Mitu Group is cut by NNW-trending thrust faults that fold Cretaceous strata and are parallel to late Permian structures likely reactivated during Andean deformation.
Map from Macusani structural zone (see Fig. 1b for location) highlighting multiple pre-Andean deformation phases preserved in the area. Note folds in Silurian–Devonian beneath angular unconformity with overlying Carboniferous; multiple fold orientations in Carboniferous–Permian rocks; Silurian–Permian succession thrust over Triassic Mitu Group and Cretaceous rocks.

Outcrop example of Triassic normal fault accommodating synrift accumulation of Mitu Group rocks. Note folded Permian carbonates unconformable below Mitu Group rocks, attributed to late Permian shortening. See location in Figure 1b.

3.a.5. Central Andean Backthrust Belt
The CABB is a ~50 km wide NW-trending fold–thrust system dominated by Cretaceous rocks. The NE margin is defined by a depositional contact between Upper Jurassic to Lower Cretaceous Muni Formation rocks, and Triassic Mitu Group to upper Palaeozoic rocks of the Macusani structural zone. Faults and folds in the CABB are developed mostly in Cretaceous strata and verge to the SW. Faults are spaced ~1–3 km apart and field relationships suggest an imbricate fan, as no evidence of a roof thrust is preserved. Isolated erosional windows in anticline cores expose Lower Cretaceous Muni Formation rocks capping thin (< 300 m) accumulations of Triassic Mitu Group rocks on top of Silurian–Devonian strata. In the CABB, the Mitu Group preserves evidence for pre-Cretaceous folding and spaced penetrative fabric formation (Fig. 5). The nature and distribution of such deformation remains unclear.
Road-cut example of penetrative foliation development and minor folds in Triassic Mitu Group rocks beneath angular unconformity overlain by Cretaceous rocks. Note yellow field notebook for scale is 19 cm long.

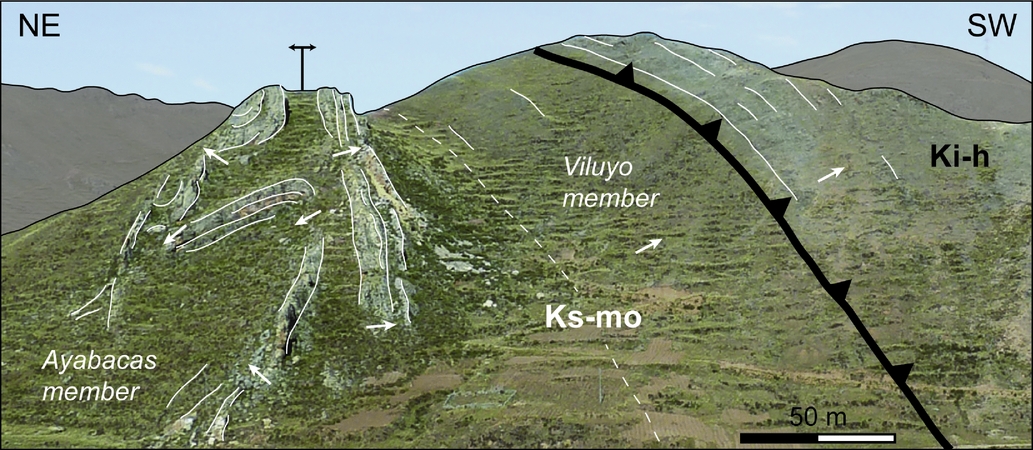
Thrust fault hanging walls juxtapose Lower Cretaceous Muni Formation or Huancane Formation rocks on younger Cretaceous strata. Most hanging wall cutoffs are eroded. Fold limbs may be moderate (20–30°) to steeply dipping (70–80°). Map and field relationships suggest rounded, concentric folds rather than fault-bend folds. Tight, disharmonic folds are observed in some exposures of Lower Cretaceous Ayavacas Formation carbonates (Fig. 6). Other outcrop and map-scale examples of complex fold patterns have been interpreted as features of slump and mass-wasting deposits (Callot, Odonne & Sempere, Reference Callot, Odonne and Sempere2008; Callot et al. Reference Callot, Odonne and Sempere2008).
Outcrop example of non-harmonic folds typical of Cretaceous Ayavacas Formation exposures in the Central Andean Backthrust Belt. White arrows show direction of stratigraphic younging. These rocks are in the footwall of a thrust, and local exposures of gypsum suggest folding is tectonically driven. Ks-Mo – Upper Cretaceous Moho Group; Ki-h – Lower Cretaceous Huancane Formation.
The SW zone of the CABB exposes deeper structural levels in lower Palaeozoic rocks across a ~15 km wide region of E- and W-verging faults. An E-directed thrust along the NE margin of this narrow zone thrusts Carboniferous Ambo Formation quartzites on Cretaceous rocks. Within this zone, localized exposures of Carboniferous and Silurian–Devonian rocks are thrust over thin accumulations of Lower Cretaceous rocks of unknown original thickness. The SW CABB boundary is the Ayaviri fault (Sempere et al. Reference Sempere, Herail, Oller and Bonhomme1990; Carlotto, Reference Carlotto2013) with Middle Ordovician Calapuja Formation rocks in the hanging wall. In this ~15 km wide zone, Cretaceous rocks are deposited over Triassic or Silurian–Devonian rocks, resulting in a locally variable subcrop relationship.
3.a.6. Altiplano
Up to 3 km of fluvial and alluvial fan deposits of the Oligocene Puno Group and Miocene Tinajani Formation rocks fill the Ayaviri basin (Rodriguez, Flores & Marocco, Reference Rodrıguez, Flores and Marocco1999; Ibarra et al. Reference Ibarra, Mamani, Rodriguez, Sempere, Carlotto, Carlier, Jacay and Sempere2004; Rousse et al. Reference Rousse, Gilder, Fornari and Sempere2005; Carlotto, Reference Carlotto2013; Perez & Horton, Reference Perez and Horton2014). The basin is bounded to the NE and SW by the Ayaviri backthrust and the Pasani thrust, respectively, and folded into a NW-trending asymmetric syncline, with NE limb dips generally 10–15° SW and SW limb dips ~50–70° NE. Footwall growth strata constrain motion along the Ayaviri and Tinajani faults to Oligocene and middle Miocene time, respectively, and suggest hybrid trishear and fault-propagation fold kinematics (Perez & Horton, Reference Perez and Horton2014).
3.b. Cross-section
Balanced cross-sections provide potential subsurface structural geometries, estimates of regional strain and kinematic insights on crustal structure development (Bally, Gordy & Stewart, Reference Bally, Gordy and Stewart1966; Dahlstrom, Reference Dahlstrom1969; Boyer & Elliott, Reference Boyer and Elliott1982; Elliott, Reference Elliott1983; Woodward, Boyer & Suppe, Reference Woodward, Boyer and Suppe1989). The technique has been applied throughout the Andes and other fold–thrust belts to estimate bulk shortening and crustal thickening, and to evaluate fault kinematics and rift inversion (Beach, Reference Beach, McClay and Price1981; Price, Reference Price, McClay and Price1981; Boyer & Elliot, Reference Boyer and Elliott1982; Roeder, Reference Roeder1988; Baby et al. Reference Baby, Sempere, Oller and Herail1992; Kley, Reference Kley1996; Baby et al. Reference Baby, Rochat, Mascle and Herail1997; Kley & Monaldi, Reference Kley and Monaldi1998; McQuarrie, Reference McQuarrie2002a ; Teixell et al. Reference Teixell, Arboleya, Julivert and Charroud2003; Elger, Oncken & Glodny, Reference Elger, Oncken and Glodny2005; Mora et al. Reference Mora, Parra, Strecker, Kammer, Dimate and Rodriguez2006; McQuarrie, Barnes & Ehlers, Reference McQuarrie, Barnes and Ehlers2008; Gotberg, McQuarrie & Carlotto, Reference Gotberg, McQuarrie and Caillaux2010; Giambiagi et al. Reference Giambiagi, Mescua, Bechis, Martinez and Folguera2011; Eichelberger et al. Reference Eichelberger, McQuarrie, Ehlers, Enkelmann, Barnes and Lease2013; Eude et al. Reference Eude, Roddaz, Brichau, Brusset, Calderon, Baby and Soula2015). These examples rely mostly on sinuous-bed and line-length balancing techniques, which assume no out-of-plane motion, no metamorphism and volume conservation throughout deformation.
Some limitations of line-length balancing include poorly defined uncertainty estimates, limited constraints regarding how subsurface space is filled and the length of eroded hanging wall cutoffs projected above the surface. In addition, Judge & Allmendinger (Reference Judge and Allmendinger2011) showed that the original stratigraphic thickness is the largest source of error. They proposed area balancing as an alternative technique because it provides improved ability to analyse uncertainties. However, by only determining an area-balanced solution, the proposed errors cannot be assessed to ensure viability (Eichelberger et al. Reference Eichelberger, McQuarrie, Ehlers, Enkelmann, Barnes and Lease2013). Our cross-section does not restore to a stratigraphic wedge with a uniform taper that is the default for the area-balancing technique. Instead, the restoration supports a graben geometry that reflects rapid changes in stratigraphic thickness associated with Triassic rifting and faults offsetting basement. Therefore, we rely on our line-length balanced section to provide shortening estimates rather than the area-balance technique outlined by Judge & Allmendinger (Reference Judge and Allmendinger2011).
The cross-section was constructed from a 1:250000 geologic map compiled from 1:100000 maps and honours map patterns, faults, folds, changes in structural level and bedding orientation. We have identified five changes in structural elevation that are variably achieved by duplexes in Palaeozoic stratigraphy, basement thrust ramps and inverted Triassic normal faults. Because variable exposure and access do not permit a single cross-section line, we chose to create multiple section lines to accurately capture the maximum information. During our mapping, we did not observe any strike-slip faults, supporting our assumption of minimal out-of-plane motion. Transport directions are perpendicular to the dominant structural grain, which shifts gradually from ~310° in the Altiplano to ~290° in the Subandean Zone. Strike directions in the Macusani structural zone of ~340° and 040° force us to use section lines of variable orientations.
3.b.1. Subandean Zone
The narrow structural spacing and lack of pre-Cretaceous Subandean rocks suggest a detachment at the base of the Cretaceous. The structural elevation of exposed Subandean Cretaceous rocks above the adjacent 4–5 km thick Cenozoic foreland basin fill is best achieved by duplexing the ~4 km thick Devonian–Ordovician succession. No Palaeozoic rocks are exposed in the Subandean Zone of southern Peru. Multiple major structures in the Eastern Cordillera have hanging wall flats in the Ordovician, suggesting the horizon is an important regional detachment. We use this detachment to create the three horses in the hinterland-dipping duplex, and structurally elevate the Cretaceous. The space occupied by this duplex could have also been filled with a basement thrust sheet, but this configuration would not have allowed sufficient space to shorten the Palaeozoic the same amount as the Cretaceous, or support structures imaged on adjacent reflection seismic lines (W. F. Gil Rodriguez, unpub. Ph.D. thesis, Univ. Paul Sabatier, Reference Gil Rodriguez, Baby and Ballard2001). We proposed that the frontal thrust has ~13 km of slip. This slip is necessary to balance shortening in the Palaeozoic duplex at depth. Subandean folds are formed by ramp-flat deformation along the Cretaceous detachment, or by the subsurface duplex. Shortening of the Cretaceous rocks exposed at the surface and matching shortening of the Palaeozoic duplex at depth is accommodated by slip on the frontal basement thrust sheet (B1, Fig. 1c).
3.b.2. Eastern Cordillera
The Eastern Cordillera represents a second major increase in structural relief and is characterized by a > 50 km wide structural high exposing Ordovician–Devonian strata intruded by Triassic plutons. The SW-dipping Main Andean Thrust juxtaposes a syncline developed in Ordovician–Devonian strata against Cretaceous rocks. Map relationships show that the strata exposed on the NE syncline limb is thinner than the SW limb. We propose that the SW increase in Palaeozoic map thickness is structural and suggest a second flat near the top of the Middle Ordovician San Jose Formation. This thinner section of Ordovician rocks exposed in the hanging wall restores to a footwall cutoff and flat proposed on the westernmost horse in the Subandean duplex. Structural elevation of Ordovician rocks above Cretaceous rocks is achieved by motion of a 10 km thick basement thrust sheet over a basement ramp and an increase of the basement dip to 4°. Slip on this frontal basement thrust is accommodated by shortening of the duplex and Cretaceous thrust faults in the Subandean Zone and slip on the Main Andean Fault. The frontal section of the Eastern Cordillera is comprised of a single, ~30 km wide thrust sheet elevated above the basement thrust. Some deformation of this upper thrust sheet is achieved by folding over the proposed footwall fault geometry, and folding of the westernmost Subandean horse into a syncline, with the western limb tilted by the basement thrust sheet.
Within the Eastern Cordillera structural high, three structural levels become successively shallower towards the hinterland corresponding with increasing surface elevation. We modelled this pattern as a décollement horizon that climbs up from the base of the middle Ordovician, to the base of the upper Ordovician, and to the base of the Silurian–Devonian. A small duplex with a W-verging sense of displacement elevates the upper Ordovician, and repeated Silurian–Devonian rocks achieve the third, structurally shallowest zone of the Eastern Cordillera. Although this zone of the cross-section now appears as a large passive roof duplex over the underlying basement thrust sheet B1, we note that slip on B1 is fed to the Main Andean Thrust and the Subandean Zone, not the Eastern Cordillera. Rather, we suggest that slip into this zone of backthrusts in the Eastern Cordillera is restored to a basement thrust sheet B2 that was thrust onto the frontal basement sheet B1. We suggest map exposures of Triassic plutons have been translated to the NE owing to motion of basement thrust B1 (Fig. 1b, c). After restoration of the cross-section, we projected schematic pluton roots at depth presently situated beneath the Macusani structural zone.
3.b.3. Macusani structural zone
The Cordillera de Carabaya plutons were carried in the hanging wall of SW-verging thrust faults over Triassic and upper Palaeozoic rocks along the NE Macusani structural zone margin. The Macusani structural zone exhibits shallower structural elevation than the Eastern Cordillera. We propose that the Eastern Cordillera exposure levels are deeper because they have travelled over the frontal basement ramp, whereas Macusani structural zone exposure levels are shallower because they have not been translated over the frontal basement ramp.
We honour some pre-Andean deformational geometries by showing faults and folds in Carboniferous–Permian rocks preserved beneath Triassic Mitu Group deposits in the deformed section, but do not attempt to restore pre-Triassic shortening in the restored section. We do not attempt to model deformational geometries associated with pre-Carboniferous deformation because of limited Ordovician–Devonian exposures. Instead the Ordovician–Devonian rocks are depicted as continuous parallel units, although they preserve pre-Andean deformation fabrics and were probably the main décollement levels for late Permian deformation.
Field and map data demonstrate deformation of Cretaceous and Triassic Mitu Group rocks and reveal key Andean thrust fault locations that are often aligned with late Permian compressional structures, but have longer map traces, suggesting they have reactivated and further propagated existing structural features. Thrust spacing is ~15–16 km. Slip along individual faults is generally <5 km. The broad folds, wide thrust fault spacing and thick deformed sedimentary cover suggests basement-involved thick-skinned shortening within the Macusani structural zone.
3.b.4. Central Andean Backthrust Belt
Field and map data demonstrating close fault spacing (1–3 km), Lower Cretaceous rocks consistently in thrust fault hanging walls and tight folds suggest the décollement probably occupies the Lower Cretaceous Muni Formation, which is a fine-grained marine siltstone. The thin-skinned structural style of the CABB contrasts with the thick-skinned style of the Macusani structural zone. A secondary detachment at the base of the Ayavacas Formation (lower Moho Group) may locally utilize evaporite deposits and create tight, disharmonic folds in the footwalls of some thrust faults (Fig. 6). The Cretaceous section thins from ~2 km to <1 km to the SW. The NE margin of the CABB is more highly deformed with tighter folds and multiple thrust faults, whereas the SW margin is deformed by open folds and fewer thrust faults. This suggests that deformation propagated from the NE to SW, creating an in-sequence imbricate fold–thrust belt that transferred displacement from the Eastern Cordillera to the Altiplano.
Cretaceous rocks in the CABB are deposited with an angular unconformity on thin (<300 m) Triassic Mitu Group deposits, which are disconformable with the underlying Silurian–Devonian strata. In general, we suggest that the CABB was mostly a high-standing, eroding block during Triassic rifting. Nearly all Carboniferous–Permian rocks that may have been present were eroded, and only thin accumulations of synrift Mitu Group deposits were preserved in the hanging walls of minor normal faults.
Shortening of the Cretaceous rocks is achieved by duplexing and equivalent shortening of the Ordovician to Devonian strata. Here, we model two detachments to accommodate Palaeozoic shortening. At the NE CABB margin, beneath the more tightly deformed Cretaceous rocks, one detachment at the base of the Ordovician creates a SW-verging duplex. The décollement ramps up to the base of the Silurian–Devonian beneath the zone of the more broadly folded Cretaceous rocks. In one horse of this Silurian–Devonian duplex, a thin carapace of Carboniferous Ambo group rocks is preserved beneath thin Cretaceous deposits. The frontal thrust of the CABB is the Ayaviri fault, which utilizes the main décollement at the base of the Ordovician.
3.b.5. Shortening magnitudes
Our line-length balanced cross-section has a deformed length of 210 km measured between the Ayaviri fault and the foreland pin line and a restored length of 340 km, yielding 130 km or 38% of shortening. This includes 31 km in the narrow Subandean Zone, 24 km in the frontal Eastern Cordillera, 30 km in the Macusani structural zone and 45 km in the CABB.
The shortening estimates are similar to the preferred estimate of 123 km (40%) reported by Gotberg, McQuarrie & Carlotto (Reference Gotberg, McQuarrie and Caillaux2010) for a section 100–150 km along strike to the NW. In northern Bolivia, A. J. Rak (unpub. M.S. thesis, Univ. Pittsburgh, 2015) and McQuarrie, Barnes & Ehlers (Reference McQuarrie, Barnes and Ehlers2008) documented 242 km (43%) and 276 km (40%) of shortening, respectively, further highlighting the along-strike gradient in total shortening from Bolivia to Peru (Gotberg, McQuarrie & Carlotto, Reference Gotberg, McQuarrie and Caillaux2010).
3.c. Detrital zircon U–Pb geochronology
U–Pb geochronology of foreland basin fill provides insights into sediment routing pathways, depositional ages and the tectonic evolution of orogens (Dickinson & Gehrels, Reference Dickinson and Gehrels2003; Horton et al. Reference Horton, Saylor, Nie, Mora, Parra, Reyes-Harker and Stockli2010; Lawton & Bradford, Reference Lawton and Bradford2011; Gehrels, Reference Gehrels, Busby and Azor2012). We investigate the provenance of the Cretaceous–Cenozoic stratigraphic sections preserved in the CABB/Altiplano and Subandean Zone. Today, the two regions are separated by >100 km across the Eastern Cordillera, where proposed Cenozoic and Cretaceous deposits are restricted to thin, localized exposures. By defining the Cretaceous–Cenozoic provenance signatures from both regions, we evaluate whether the depocentres represent two long-lived, separate basins or a once-continuous basin that was partitioned during Eastern Cordillera uplift. For detailed methods, see online Supplementary Material available at http://cambridge.journals.org/geo.
3.c.1. Overview
We present detrital zircon U–Pb results from 11 Altiplano/CABB samples and 9 Subandean Zone samples (n = 1997 grains) (Fig. 7). We note distinct differences in zircon provenance between the two regions since at least Early Cretaceous time. The Cretaceous to Cenozoic record in the Altiplano/CABB is characterized by detrital zircon age populations that reflect distinctive Eastern and Western Cordillera sources. Detrital zircon ages from Altiplano/CABB Cretaceous rocks are characteristic of Eastern Cordillera sources, whereas Altiplano/CABB Cenozoic rocks reflect principally Western Cordillera contributions. In contrast, Subandean Zone Cretaceous to Cenozoic rocks record long-lived cratonic sediment sources rather than the Andean Cordilleras.
Comparison of U–Pb detrital zircon geochronologic analyses of Cretaceous through Cenozoic rocks from the Subandean Zone and Altiplano/CABB. Subandean rocks have strong cratonic signatures and lack Western Cordillera zircons (see map) whereas Altiplano/CABB rocks have strong Eastern and Western Cordillera provenance, but lack characteristic cratonic populations.

3.c.2. Altiplano and CABB
Five Cretaceous samples (Muni, Huancane, Vilquechico, Auzangate and Viluyo formations) were collected from marine sandstones exposed in the CABB (n = 504 grains). All five samples exhibit detrital zircon age populations that are found in Palaeozoic rocks of the Eastern Cordillera (~400–800 Ma, ~900–1200 Ma, > 1300 Ma). However, we consider the presence of Gondwanide zircons (~350–160 Ma) (Mišković & Schaltegger, Reference Mišković and Schaltegger2009), which are characteristic of plutons exposed in the Eastern Cordillera, as diagnostic of a strong Eastern Cordillera provenance during Cretaceous deposition. Few (n < 10) Cretaceous age zircons have been analysed from the five samples. Six previously reported Cenozoic samples (Puno/San Jeronimo Groups and Tinajani formations) from the northern Altiplano reveal a transition to a dominantly Western Cordillera sediment source (Perez & Horton, Reference Perez and Horton2014; Horton et al. Reference Horton, Perez, Fitch and Saylor2015). Cenozoic detrital zircon ages dominate the six samples (n > 100), with a lesser contribution from Cretaceous detrital zircon ages (n = 30). The high proportion of Cretaceous and Cenozoic grains in the Cenozoic rocks suggests E-directed sediment transport sourced from the Western Cordillera. Some Cenozoic samples from the Altiplano also contain zircon populations that are characteristic of an Eastern Cordillera provenance, suggesting zircon recycling or continued sediment source areas in the Eastern Cordillera.
3.c.3 Subandean Zone
Three Cretaceous samples (Vivian and Oriente formations) from the Subandean Zone (n = 317 grains) lack Cretaceous and Gondwanide zircons characteristic of the Western and Eastern Cordilleras, respectively. The 400–800 Ma population is a minor component of the Cretaceous Subandean Zone population. Unlike Cretaceous rocks from the CABB, most detrital zircon ages from Cretaceous rocks of the Subandean Zone compose a broad distribution of 1600–900 Ma zircons, with a key peak between 1400–1300 Ma. This zircon age population is very minor throughout Western and Eastern Cordillera rocks, but is characteristic of the Rondonia/San Ignacio cratonic block of Bolivia. We suggest that Cretaceous rocks from the Subandean Zone record W-directed sediment transport sourced primarily from cratonic blocks because they lack diagnostic Andean zircon ages.
Six Cenozoic samples (Pozo and Chambira formations) from the Subandean Zone and foreland basin (n = 617) record persistent cratonic source areas and the appearance of Andean detrital zircon ages. A broad population of 1600–900 Ma zircons is present, characterized by a dominant peak between 1400–1300 Ma. The abundance of 700–500 Ma zircons is higher than in Cretaceous Subandean samples. The appearance of Gondwanide zircons and five Cretaceous zircons suggests that the Subandean Zone received a minor contribution from Andean sources during Cenozoic deposition. No Cenozoic detrital zircons have been analysed from Cenozoic samples in the Subandean Zone or foreland basin. We interpret the ~1400–1300 Ma detrital zircon population as continued sediment derived from cratonic sources, but the minor appearance of Andean zircons (Gondwanide and Cretaceous ages) in Cenozoic sediments suggests a transition to mixed Eastern Cordillera sediment contributions.
3.d. Thermochronology
Apatite and zircon (U–Th)/He thermochronologic methods (AHe and ZHe) constrain the timing of cooling below closure temperatures of ~60°C and ~180°C, respectively, corresponding to crustal depths between ~2 and 6 km (Ehlers et al. Reference Ehlers, Chaudhri, Kumar, Fuller, Willett, Ketcham, Brandon, Belton, Kohn, Gleadow, Dunai and Fu2005). In detail, closure temperatures correspond to a range of temperatures (partial retention zone, PRZ), above which He is not retained in the mineral and below which He retention is complete. For additional details regarding (U–Th)/He thermochronometry see existing reviews (Farley, Reference Farley, Porcelli, Ballentine and Wieler2002; Ehlers & Farley, Reference Ehlers and Farley2003; Reiners, Reference Reiners2005; Flowers et al. Reference Flowers, Ketcham, Shuster and Farley2009). Cooling ages from samples collected over a range of elevations can provide constraints on exhumation rates and magnitudes. For our study in the Cordillera de Carabaya, we collected samples from elevations of 3710–4764 m above sea level (asl), including seven samples of medium-grained granodiorite and monzodiorite of the Permo-Triassic Coasa pluton along the Rio Achasiri and Rio Tambillo gorges and one sample of the Carboniferous Ambo Formation quartzite along the SW Coasa pluton margin. Three additional samples were collected from sandstones of the Cretaceous Vivian and Oriente formations in the Subandean Zone. At least three single grain aliquots were analysed from each sample. Samples can be characterized as reset, partially reset or non-reset. Reset samples have aliquot ages that cluster together and are younger than the depositional or intrusive age of the rock and are interpreted as exhumed from temperatures greater than the PRZ. Partially reset samples exhibit a range of individual grain aliquot ages potentially younger and older than the depositional age and are interpreted as exhumed from the PRZ. Non-reset samples display individual grain aliquot ages older than or equal to the depositional age and are interpreted to be exhumed from above the PRZ. A lack of correlation between effective U concentration (eU) and age, as well as grain size and age, suggests that variations in He retention, grain composition and size do not significantly influence thermochronologic results (online Supplementary Material available at http://journals.cambridge.org/geo). Thus, we can more confidently interpret the presence or absence of PRZ in the data.
3.d.1. Overview
We report AHe and ZHe cooling ages to define the timing of exhumational cooling along the Subandean Zone (Fig. 8) and Cordillera de Carabaya (Figs 9, 10, 12, 13). Seven ZHe samples from the Coasa pluton have Oligocene–middle Miocene mean sample ages. Eight AHe samples from the Coasa pluton reveal two clusters of late Oligocene and middle Miocene ages that are younger than the corresponding ZHe ages. Three AHe samples from the Subandean Zone have ages that decrease towards the foreland, suggesting onset of cooling by middle Miocene time. Although these new results provide constraints on the timing of exhumation of select structures, existing data do not permit calculation of precise shortening rates throughout the duration of Andean deformation.
Age–distance relationship for apatite (U–Th)/He samples from Cretaceous sandstones in the Subandean Zone. Distance along profile is measured in kilometres from the frontal thrust (Fig. 1b), with foreland situated to the right and hinterland to the left. Average apatite (U–Th)/He age shown with 2σ error.

Geologic map of Cordillera de Carabaya showing location and ages of apatite and zircon (U–Th)/He samples from this study and Lease & Ehlers (Reference Lease and Ehlers2013). Gray dashed line from Farrar et al. (1988) showing boundary of Zongo-San Gaban Zone. This boundary separates >26 Ma AHe ages to the south from <~17 Ma ages to the north. Map units and symbols the same as Figure 1b.

Elevation versus age plot of apatite and zircon (U–Th)/He results from the Coasa pluton (see Fig. 9 for location). Short dashed line emphasizes trend among ZHe ages. Long dashed line emphasizes inflection point observed in AHe ages.

3.d.2. Subandean Zone
The cooling histories of three samples from Cretaceous sandstones exposed in the Subandean Zone were determined using AHe thermochronology. The structurally shallowest sample situated towards the hinterland exhibits high uncertainty (14.6±16.4 Ma) owing to individual grain ages of 3.0 Ma, 3.8 Ma, 13.1 Ma and 38.2 Ma. The large spread in grain ages may suggest the sample is partially reset. Two additional samples from structurally lower positions in the Cretaceous stratigraphy situated towards the foreland are more consistent, with ages of 5.8±3.2 Ma and 5.7±2.9 Ma, respectively (Fig. 8) that we interpret as fully reset ages.
3.d.3. Coasa pluton
Seven samples were collected along a ~20 km long transect in NE-trending incised canyons in the Coasa pluton. An additional sample was collected from Carboniferous Ambo Formation quartzite host rock ~300 m SW of the pluton contact (Fig. 9). All eight samples were analysed for AHe, and seven were analysed for ZHe. Samples analysed for ZHe cooling ages span elevations between 4764 and 3710 m that increase to the SW. Mean ZHe sample ages range from 18.6±1.0 Ma to 34.3±4.4 Ma (Fig. 10). These ages plot along a single age versus elevation trend.
Eight AHe samples reveal two groups of ages. The two highest elevation samples have ages of ~30 and 26.5 Ma, and plot near the trend line defined by ZHe sample ages. The remaining six lower elevation AHe samples have ages between ~17 and 11 Ma, and fall along a similarly steep age elevation trend that is younger than the corresponding ZHe ages from the same samples (Fig. 10).
4. Discussion
4.a. Inversion of pre-Andean normal faults
Previous workers have shown segments of the Andes dominated by thin-skinned (Roeder, Reference Roeder1988; Kley, Gangui & Kruger, Reference Kley, Gangui and Kruger1996; Zapata & Allmendinger, Reference Zapata and Allmendinger1996; Baby et al. Reference Baby, Rochat, Mascle and Herail1997; McQuarrie, Reference McQuarrie2002a ), thick-skinned (Grier, Salfity & Allmendinger, Reference Grier, Salfity and Allmendinger1991; Kley & Monaldi, Reference Kley and Monaldi1998; Giambiagi et al. Reference Giambiagi, Mescua, Bechis, Martinez and Folguera2011) or hybrid thin- and thick-skinned deformation (Jordan & Allmendinger, Reference Jordan and Allmendinger1986; Dengo & Covey, Reference Dengo and Covey1993; Cooper et al. Reference Cooper, Addison, Alvarez, Coral, Graham, Hayward, Howe, Martinez, Naar, Peñas, Pulham and Taborda1995; Roeder & Chamberlain, Reference Roeder, Chamberlain, Tankard, Suárez Soruco and Welsink1995; Kley et al. Reference Kley, Muller, Tawackoli, Jacobshagen and Manutsoglu1997; Mora et al. Reference Mora, Parra, Strecker, Kammer, Dimate and Rodriguez2006). Fault reactivation has been proposed for multiple segments of the Peruvian Andes (Hermoza et al. Reference Hermoza, Brusset, Baby, Gil, Roddaz, Guerrero and Bolanos2005; Scherrenberg, Holcombe & Rosenbaum, Reference Scherrenberg, Holcombe and Rosenbaum2014; Chapman et al. Reference Chapman, Ducea, McQuarrie, Coble, Petrescu and Hoffman2015; Eude et al. Reference Eude, Roddaz, Brichau, Brusset, Calderon, Baby and Soula2015) although fault geometries may vary. Field and map relationships enabled construction of a balanced cross-section and demonstrated the location of pre-Andean normal faults. These normal faults control some of the major changes in structural elevation, and contributed to a mix of thin- and thick-skinned deformation. The restored cross-section demonstrates that the two main detachments are likely linked to rheology. Phanerozoic rocks detach at the basement–cover interface at ~10 km and contributed to thin-skinned deformation. The deeper detachment accommodating motion of basement thrust sheets originated at ~23–24 km depth, consistent with models of lithospheric strength profiles suggesting a strong upper crust situated above a weak middle and lower crust, e.g. Bürgmann & Dresen (Reference Bürgmann and Dresen2008) and previous cross-sections (Chapman et al. Reference Chapman, Ducea, McQuarrie, Coble, Petrescu and Hoffman2015; Eude et al. Reference Eude, Roddaz, Brichau, Brusset, Calderon, Baby and Soula2015). Some of these basement-involved faults control thick-skinned deformation, or guided thin-skinned deformation.
We identify four pre-Andean normal faults selectively reactivated as thrust faults during Andean shortening (Fig. 11) defined by subcrop relationships and rapid sediment thickness changes across each fault. All examples preferentially preserve pre- or synrift rocks in hanging walls that were eroded or not deposited from the corresponding footwall. Thrust reactivation of the SW-dipping basement thrust B2 (Fig. 1c) is interpreted as the deeper segment of a pre-Andean normal fault that fed displacement into the backthrusts of the Eastern Cordillera. The NE-dipping basement thrust B3 is considered an inverted conjugate normal fault of B2, together defining a Triassic graben. The graben preserves >6 km of upper Palaeozoic rocks and Triassic synrift Mitu Group deposits and suggests these two faults may have controlled rift evolution. Two Andean thrust faults from the CABB are interpreted as inverted pre-Andean normal faults, but thin accumulations of pre- or synrift rocks suggest these are likely minor normal faults within the Triassic rift. Isolated exposures of Lower Carboniferous Ambo Group rocks from the Pz1 thrust hanging wall (Fig. 1c) are not observed across the fault in the corresponding footwall. The Ayaviri fault (AF, Fig. 1c) is also interpreted as an inverted pre-Andean normal fault because exposures of Triassic synrift Mitu Group deposits are common along strike in the Ayaviri fault hanging wall, but are not observed in the footwall.
Restored cross-section overlain by proposed geometries for Triassic normal faults before reactivation during Cenozoic Andean shortening.
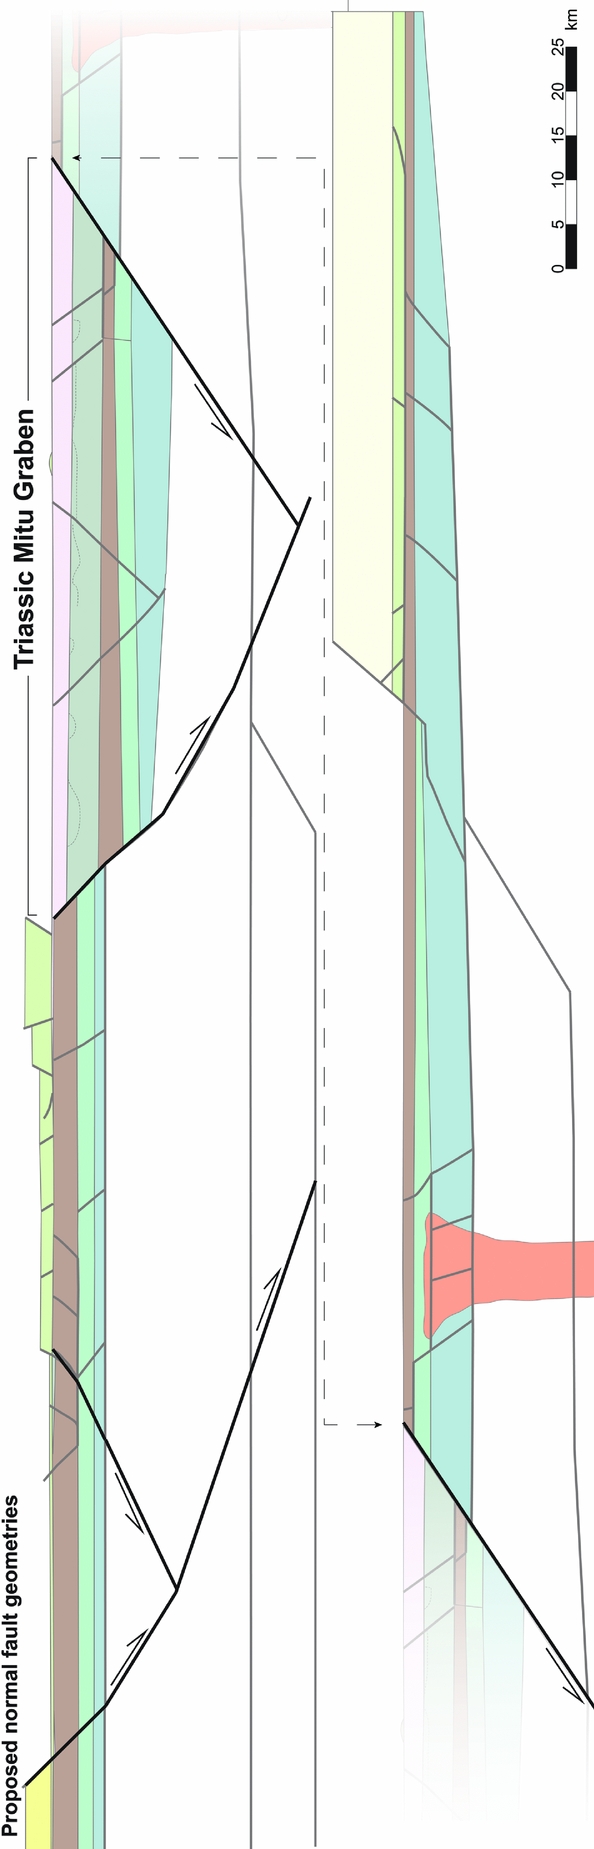
The Macusani structural zone is interpreted as an inverted graben that subsided during Triassic rifting and Mitu Group deposition (Figs 1c, 11). A ~3–4 km thick Carboniferous–Permian sequence in the Macusani structural zone is attributed to preservation in the subsiding graben. Equivalent deposits were likely eroded from the horst flanks. Some exposures of Mitu Group conglomerate deposits near the margins of the Macusani structural zone are composed of Permian limestone clasts, suggesting that erosion of Permian Copacabana Formation from the uplifted footwall was a primary sediment source.
Selective reactivation of these faults played key roles in the regional kinematic history. The B2 fault marks the NE limit of observed structural geometries inherited from pre-Andean deformational events. To the SW, inversion of the basement-involved B3 normal fault fed displacement upsection into the lower Palaeozoic and Cretaceous rocks of the CABB. The inherited orientation of the B3 fault was key in defining the location and vergence direction of the CABB. The Ayaviri fault is part of a larger fault system that persists for ~400 km along strike (Sempere et al. Reference Sempere, Herail, Oller and Bonhomme1990). If the entire length of the structure represents an inherited feature, the development of the Altiplano may be linked to reactivation of pre-Andean structures, or structures that nucleated from inherited basement structures. Each of these structures marks a significant boundary between structural zones and is parallel to the modern Andean structural grain. Moderate fault dips were likely key to allowing inversion of these favourably oriented structures (Sibson, Reference Sibson1985, Reference Sibson1990). We suggest that reactivation of these inherited features contributed to structural compartmentalization of the Eastern Cordillera, establishing zones with distinct deformation styles such as the Macusani structural zone and the CABB (Giambiagi et al. Reference Giambiagi, Mescua, Bechis, Martinez and Folguera2011; Iaffa et al. Reference Iaffa, Sabat, Bello, Ferrer, Mon and Gutierrez2011).
4.b. Timing of deformation
4.b.1. Structural control on exhumation
Thermochronology datasets constrain the timing of cooling due to erosion, rock uplift or post-igneous thermal relaxation. In actively shortening orogens that lack volcanic activity, thrust motion can promote topographic development and exhumational cooling (Farrar et al. Reference Farrar, Clark, Kontak and Archibald1988; Barnes et al. Reference Barnes, Ehlers, McQuarrie, O'Sullivan and Pelletier2006, Reference Barnes, Ehlers, McQuarrie, O'Sullivan and Tawackoli2008; Gillis, Horton & Grove, Reference Gillis, Horton and Grove2006; Ege et al. Reference Ege, Sobel, Scheuber and Jacobshagen2007; McQuarrie, Barnes & Ehlers, Reference McQuarrie, Barnes and Ehlers2008; Lease & Ehlers, Reference Lease and Ehlers2013; Eichelberger et al. Reference Eichelberger, McQuarrie, Ehlers, Enkelmann, Barnes and Lease2013). We document exhumational cooling in the Coasa pluton and Subandean Zone using AHe and ZHe thermochronometers and integrate these with previous thermochronometer datasets.
Previous studies of the Coasa pluton and Cordillera de Carabaya identified a narrow zone (Zongo-San Gabán Zone) yielding discordant biotite and muscovite K–Ar ages, and 40Ar–39Ar age spectra with biotite 40Ar–39Ar ages as young as 37±1 Ma (Kontak et al. Reference Kontak, Farrar, Clark and Archibald1990). These data were interpreted as evidence for an Eocene phase of rapid heating attributed to burial by thick, potentially basement-involved, backthrust sheets (Martinez, Reference Martinez1980; Farrar et al. Reference Farrar, Clark, Kontak and Archibald1988) that is older than proposed ~30–24 Ma wedge advance in northern Peru (Eude et al. Reference Eude, Roddaz, Brichau, Brusset, Calderon, Baby and Soula2015). The structure that achieved this burial has not yet been identified. We suggest that reactivation of the basement-involved SW-dipping normal fault (‘B2’ in Fig. 1c) fed displacement forward to lower Palaeozoic rocks in the Eastern Cordillera. Motion on the EC1 backthrust (7.8 km thick lower Palaeozoic hanging wall) would have buried Cordillera de Carabaya plutons to a minimum ~10–11 km depth. This does not incorporate an unknown, potentially > 5 km thick, accumulation of post-Devonian to Eocene rocks possibly eroded from the Eastern Cordillera, which would increase burial depth to ~15–16 km. Assuming a 27°C km−1±20% geothermal gradient (Barnes et al. Reference Barnes, Ehlers, McQuarrie, O'Sullivan and Pelletier2006), burial by the EC1 backthrust (Fig. 1c) could sufficiently heat the Cordillera de Carabaya and Coasa plutons to the 350±50°C proposed previously (Farrar et al. Reference Farrar, Clark, Kontak and Archibald1988).
Previous workers have established a two-phase cooling history in the Cordillera Real of Bolivia, which occupies a structural position similar to the Cordillera de Carabaya in southern Peru. The first phase is cooling from 45–25 Ma with a second pulse from 17 Ma to present (Gillis, Horton & Grove, Reference Gillis, Horton and Grove2006). Our ZHe and AHe results reveal Oligocene to middle Miocene cooling of the Coasa pluton in the Cordillera de Carabaya (Fig. 10). We interpret all ZHe samples as reset. The lack of partially reset and non-reset samples is evidence for no PRZ, suggesting exhumation from depths greater than ~6 km. ZHe sample ages fall along a steep age versus elevation relationship that suggests the Coasa pluton cooled during rapid late Oligocene – early Miocene deformation in the Eastern Cordillera (Fig. 10). Late Oligocene (~30 and 26 Ma) and middle Miocene (~17–11 Ma) AHe ages are spatially separated across the boundary to the Zongo-San Gabán Zone (Farrar et al. Reference Farrar, Clark, Kontak and Archibald1988). We interpret all samples as reset. Late Oligocene ages are from the highest elevation samples and plot along the age versus elevation trend defined by ZHe ages. The remaining lower elevation samples record AHe ages that are younger than their corresponding ZHe ages, but plot along a similar age versus elevation trend (Fig. 10).
We suggest that duplexing of Ordovician rocks at depth, driven by insertion of the B2 basement thrust sheet, is the structural driver for the first phase of exhumational cooling. This phase exhumed all samples above the ZHe PRZ to crustal levels such that the highest two elevation samples were above the AHe PRZ. Reactivation of the normal fault that controlled Mitu Graben subsidence during Triassic extension defines the B2 thrust sheet hanging wall, demonstrating the role of selective reactivation on exhumation of the Eastern Cordillera. Subsequent exhumation recorded by our ZHe and AHe results from the Coasa pluton is linked to movement translation over the B1 basement ramp that drove exhumation of the remaining six lower elevation AHe samples above the PRZ.
AHe results from Cretaceous rocks of the Subandean Zone are interpreted as a mix of partially reset and reset samples (Fig. 8). The two reset samples have ages of 5.8±3.2 Ma and 5.7±2.9 Ma, are situated towards the foreland and come from structurally lower sections of the Cretaceous rocks. These two ages require onset of deformation by ~6 Ma, but permit deformation onset as early as the partially reset sample age at ~15 Ma (Fig. 8). This is consistent with other workers who suggest Subandean Zone deformation in Bolivia and Peru did not initiate until after ~25–20 Ma (Horton, Reference Horton2005; Barnes et al. Reference Barnes, Ehlers, McQuarrie, O'Sullivan and Pelletier2006, Reference Barnes, Ehlers, McQuarrie, O'Sullivan and Tawackoli2008; Espurt et al. Reference Espurt, Barbarand, Roddaz, Brusset, Baby, Saillard and Hermoza2011; Eude et al. Reference Eude, Roddaz, Brichau, Brusset, Calderon, Baby and Soula2015). In general, we interpret middle to late Miocene AHe cooling ages from Cretaceous rocks in the Subandean Zone as thrust-related exhumational cooling initiated by middle Miocene time. Because deformation into the Subandean Zone is fed by displacement on the B1 fault, these ages also place constraints on the timing of motion of this basement thrust sheet. However, these results do not permit resolving the precise onset or rate of Subandean shortening.
4.b.2. Along-strike variations in exhumation
Here we compare our ZHe and AHe results from the Coasa pluton with samples collected from similar lithologies and structural levels but at lower elevations from the Rio San Gabán transect ~40 km NW along strike (Lease & Ehlers, Reference Lease and Ehlers2013) (Fig. 9). As such, this comparison helps define along-strike patterns in exhumation and reveals potential elevation controls on thermochronologic ages.
ZHe results from the Coasa pluton and Rio San Gabán transect define an age versus elevation relationship with an inflection point at ~15–16 Ma (Fig. 12). We interpret this as potentially synchronous, structurally driven exhumation along strike through the ZHe PRZ. Initial interpretations from the age versus elevation relationship of our AHe data from the Coasa pluton is consistent with onset of rapid cooling at ~15 Ma (Fig. 10). However, results from ~40 km NW along strike demonstrate ~4 Ma AHe ages (Lease & Ehlers, Reference Lease and Ehlers2013). Combining AHe results from both studies reveals an age versus elevation relationship that defines a younger inflection point at ~4–5 Ma (Fig. 13). Lease & Ehlers (Reference Lease and Ehlers2013) interpreted ~4 Ma AHe cooling ages along the Rio San Gabán transect as evidence for focused incision driven by Pliocene climate change. Whereas the Rio San Gabán samples were collected at lower elevations from a deeply incised canyon, our Coasa pluton samples are situated at higher elevations at the edge of the Eastern Cordillera plateau. The Coasa pluton has not been affected by a similar magnitude of canyon incision as the Rio San Gabán transect. Clear age versus elevation relationships among our data and results from Lease & Ehlers (Reference Lease and Ehlers2013) suggest a regional control on exhumation has persisted since Miocene time, although the driver remains debated.
Elevation versus age relationship combing ZHe results from this study and Lease & Ehlers (Reference Lease and Ehlers2013). Note age of inflection point, suggesting ~15 Ma rapid cooling.

Elevation versus age relationship for AHe results from this study and Lease & Ehlers (Reference Lease and Ehlers2013). Note age of inflection point for combined data is ~4–5 Ma, whereas inflection point observed in Coasa pluton data (this study, Fig. 10) is less distinct.

Previous biotite and muscovite K–Ar and 40Ar–39Ar results from the Cordillera de Carabaya and Cordillera Real of Peru and Bolivia establish the onset of exhumational cooling associated with deformation at ~40–45 Ma (Benjamin, Johnson & Naeser, Reference Benjamin, Johnson and Naeser1987; Farrar et al. Reference Farrar, Clark, Kontak and Archibald1988; Gillis, Horton & Grove, Reference Gillis, Horton and Grove2006; Barnes et al. Reference Barnes, Ehlers, McQuarrie, O'Sullivan and Pelletier2006). We interpret the combined thermochronologic studies as evidence for protracted exhumation in the Eastern Cordillera since Eocene time. In our study area, exhumation is located at the edge of the Mitu Graben and driven by basement thrust sheets, some of which are defined by reactivated Triassic normal faults. This highlights the role of inherited structural framework on the temporal and spatial patterns of exhumation during subsequent orogenesis.
4.b.3. Role of strike-slip deformation
Our new thermochronologic results provide temporal constraints on the exhumation history associated with shortening in the Eastern Cordillera and Subandean Zone. The timing of potential strike-slip deformation remains poorly constrained. Our cross-section construction assumes minimal out-of-plane motion because we did not identify strike-slip faults in the study area. Counterclockwise (CCW) vertical axis rotations in southern Peru (northern limb of Bolivian orocline) determined from palaeomagnetic studies have been interpreted as evidence for significant Cenozoic strike-slip deformation (Roperch et al. Reference Roperch, Sempere, Macedo, Arriagada, Fornari, Tapia, Garcia and Laj2006; Arriagada et al. Reference Arriagada, Roperch, Mpodozis and Cobbold2008) and are critical for orocline reconstruction. Rousse et al. (Reference Rousse, Gilder, Fornari and Sempere2005) conducted a palaeomagnetic study of Miocene clastic deposits in the Ayaviri basin (Ayaviri fault footwall) that remains the only constraint within our study area. Complex demagnetization results are equivocal, suggesting either minor CCW rotation or post-depositional remagnetization. Those authors attributed vertical axis rotation to left-lateral strike-slip motion along the Ayaviri fault that they argue was kinematically linked to the left-lateral Cochabamba fault of Bolivia (Eichelberger & McQuarrie, Reference Eichelberger and McQuarrie2015). Whereas piercing points have not been identified demonstrating strike-slip offset of the Ayaviri fault, the timing and magnitude of late Oligocene reverse Ayaviri fault motion is constrained by footwall growth strata (Perez & Horton, Reference Perez and Horton2014) and our cross-section. The few additional strike-slip faults proposed in Peru are situated outside our study area and depicted as either parallel or oblique to Andean structural grain (Gilder et al. Reference Gilder, Rousse, Farber, McNulty, Sempere, Torres and Palacios2003; Rousse et al. Reference Rousse, Gilder, Fornari and Sempere2005; Carlotto et al. Reference Carlotto, Tintaya, Cárdenas, Carlier and Rodríguez2006; Roperch et al. Reference Roperch, Sempere, Macedo, Arriagada, Fornari, Tapia, Garcia and Laj2006; Arriagada et al. Reference Arriagada, Roperch, Mpodozis and Cobbold2008; Mišković et al. Reference Mišković, Spikings, Chew, Kosler, Ulianov and Schaltegger2009). Reconstructions suggest overlap between the timing of vertical axis rotations and exhumation in southern Peru, including fore-arc rotation before ~25 Ma (Roperch et al. Reference Roperch, Sempere, Macedo, Arriagada, Fornari, Tapia, Garcia and Laj2006) and ~18–5 Ma rotations in the Eastern Cordillera (Rousse et al. Reference Rousse, Gilder, Fornari and Sempere2005). Arriagada et al. (Reference Arriagada, Roperch, Mpodozis and Cobbold2008) used these rotations as support for significant Eocene–Oligocene age oroclinal bending of the fore-arc. Oroclinal bending of the Eastern Cordillera and Subandean Zone is notably less (10–15°) and more recent (~15 Ma to present) (Arriagada et al. Reference Arriagada, Roperch, Mpodozis and Cobbold2008; Eichelberger & McQuarrie, Reference Eichelberger and McQuarrie2015). Although strike-slip faults are likely important to orocline kinematics in southern Peru, existing constraints support minimal strike-slip deformation within our study area.
4.c. Pre-Andean structural control on Altiplano and Subandean basin provenance
In addition to controlling the kinematic and exhumational history of the central Andes, the structural evolution of the Eastern Cordillera may have implications for basin evolution in the northern Altiplano. U–Pb detrital zircon geochronologic results from the Cretaceous–Cenozoic stratigraphy preserved in the Altiplano/CABB and Subandean Zone show two key provenance differences. Cretaceous rocks from the Altiplano/CABB zone are characterized by Western and Eastern Cordillera provenance. In contrast, the Cretaceous rocks of the Subandean Zone show mostly cratonic (Rondonia/San Ignacio of Bolivia) affinities, and lack characteristic Western and Eastern Cordillera zircon populations, suggesting W-directed sediment transport. The Cenozoic rocks of the Subandean Zone retain a dominant cratonic detrital zircon signal, with additional minor Eastern Cordillera contributions and no Cenozoic Western Cordillera arc detrital zircon ages. In contrast, Cenozoic Altiplano rocks are dominated by Cenozoic and Cretaceous (Western Cordillera arc) detrital zircons. The strong cratonic signal present in the Subandean Zone is different from the dominant Andean (Eastern/Western Cordillera) signal that characterizes the Altiplano/CABB. We investigate two potential palaeogeographic reconstructions that could contribute to these provenance records.
The first option mimics models proposed for the Central Andes of Bolivia (DeCelles & Horton, Reference DeCelles and Horton2003; Horton, Reference Horton, Busby and Azor2012). This model suggests that development of a volcanic arc and an early fold–thrust belt created topography in the Western Cordillera during Cretaceous time (Chong, Reference Chong1977; Vicente, Reference Vicente, Ericksen, Cañas Pinochet and Reinemund1990; Horton et al. Reference Horton, Yin, Spurlin, Zhou and Wang2002; Arriagada, Cobbold & Roperch, Reference Arriagada, Cobbold and Roperch2006) and the flanking eastern foreland basin was partitioned by Eocene uplift of the Eastern Cordillera (Fig. 14a) (Benjamin, Johnson & Naeser, Reference Benjamin, Johnson and Naeser1987; Farrar et al. Reference Farrar, Clark, Kontak and Archibald1988; DeCelles & Horton, Reference DeCelles and Horton2003; McQuarrie et al. Reference McQuarrie, Horton, Zandt, Beck and DeCelles2005; Gillis, Horton & Grove, Reference Gillis, Horton and Grove2006). In this scenario, the Western Cordillera and South American craton would have been the main potential sources for detrital zircons during Cretaceous time, and the Eastern Cordillera could not have been a sediment source until exhumation in Eocene time.
Two potential scenarios to explain provenance variation between the Altiplano/CABB and Subandean Zone. Scenario (a) represents a two-phase development of the foreland and hinterland basins proposed for Bolivia. In Cretaceous time, the Eastern Cordillera had not developed, and the two basins were contiguous. Cenozoic uplift of the Eastern Cordillera partitioned the contiguous basin into separate hinterland and foreland depocentres. The resulting provenance record would suggest similar sediment sources for Cretaceous deposits, but Cenozoic rocks would reflect unique provenance signatures for each basin after Eastern Cordillera uplift. Scenario (b) is similar to what has been proposed for central and northern Peru with a long-lived structural high. This suggests that a proto-Eastern Cordillera always separated the hinterland and foreland depocentres. The resulting provenance record would suggest sediment sources unique to each depocentre.

The second scenario is similar to proposed palaeogeographic reconstructions of central and northern Peru and emphasizes two separate depocentres (West and East Peruvian troughs) separated by a structural high (Marañon geanticline) (Benavides-Caceres, Reference Benavides-Caceres1956; Wilson, Reference Wilson1963; Dalmayrac, Laubacher & Marocco, Reference Dalmayrac, Laubacher and Marocco1980; Mégard, Reference Mégard1984; Benavides-Caceres, Reference Benavides-Caceres and Skinner1999; Jaillard, Bengtson & Dhondt, Reference Jaillard, Bengtson and Dhondt2005; Scherrenberg et al. Reference Scherrenberg, Jacay, Holcombe and Rosenbaum2012) (Fig. 14b). Although the drivers and timing of the proposed structural high remain poorly constrained, it could have acted as a barrier to sediment transport, and been a sediment source throughout Cretaceous and Cenozoic deposition. The South America craton and Cretaceous–Cenozoic Western Cordillera rocks were also potential sediment sources throughout deposition.
Based on the strong Eastern Cordillera detrital zircon provenance signature present in the Cretaceous rocks of the Altiplano, we suggest the Eastern Cordillera may have had a topographic expression in Cretaceous time. Furthermore, the lack of distinctive zircon populations sourced from the Rondonia/San Ignacio craton in the Altiplano depocentres suggests W-directed palaeoflow was blocked from reaching the Altiplano, potentially by the Eastern Cordillera. Finally, the long-lived absence of Western Cordillera detrital zircons in the Subandean Zone can also be explained by the presence of the Eastern Cordillera that could have blocked E-directed palaeoflow. We interpret scenario two as a better candidate to explain our initial provenance records. This scenario may be at odds with the K–Ar and 40Ar–39Ar thermochronologic datasets from the Eastern Cordillera, which demonstrate Eocene exhumation from ~10 km depths. To satisfy both the provenance and thermochronologic datasets requires that the Eastern Cordillera plutons remained at ~10 km depths until Eocene time. This requires the presence of a similarly thick total accumulation of Triassic Mitu Group, Jurassic and Cretaceous deposits in the Eastern Cordillera. Inversion and erosion of this Jurassic depocentre may explain the anomalous absence of Jurassic deposits in southern Peru, despite their presence throughout the rest of Peru (Rosas, Fontbote & Tankard, Reference Rosas, Fontbote and Tankard2007).
The structural framework and along-strike correlation of the proposed topographic boundary is unclear. In central Peru, the proposed Marañon high is flanked to the west by the Eocene E-vergent Marañon fold–thrust belt (Mégard, Reference Mégard1984), whereas an equivalent structural setting has not been demonstrated in southern Peru. One potential scenario could be that a persistent rift shoulder inherited from the Triassic rift that controlled Mitu Group deposition created a topographic barrier that blocked sediment transport between the Altiplano and Subandean depocentres. Alternatively, minor Early Cretaceous inversion of Triassic normal faults could have created a topographic barrier responsible for provenance variations between the two depocentres. Penetrative foliation observed in some Triassic Mitu Group deposits (Fig. 5) but not observed in overlying Cretaceous rocks of the CABB also suggests poorly constrained compression before Cretaceous time.
5. Conclusions
(1) Total shortening of 130 km (38%) was constrained from balanced cross-section construction across the Eastern Cordillera and Subandean Zone from southern Peru. This estimate is consistent with total shortening estimates from transects near Cusco, and less than estimates in northern Bolivia, thus is broadly consistent with the proposed northward decrease in total shortening of the central Andes.
(2) Structural compartmentalization of the Eastern Cordillera is linked to reactivation of inherited Triassic normal faults. Preferential vergence direction of structures within the CABB is linked to the orientation of an inverted Triassic normal fault.
(3) Zircon (U–Th)/He ages from the Coasa pluton in the Eastern Cordillera are reset and record cooling ages between ~34 and 18 Ma. Apatite (U–Th)/He ages from the Coasa pluton are reset and reveal a group of late Oligocene and middle Miocene ages that are spatially separated by the Zongo-San Gaban boundary.
(4) Apatite (U–Th)/He ages demonstrate cooling in the Subandean Zone had initiated by ~6 Ma and possibly as early as ~15 Ma.
(5) By identifying inverted pre-Andean normal faults, we define the Mitu Graben and propose a mechanism to explain thermochronologic records of Eocene burial by thrust sheets and exhumation in the Eastern Cordillera. Continued interaction with basement ramps likely controlled the Eocene to Miocene exhumation history.
(6) Combining our ZHe and AHe ages with previously reported results from Lease & Ehlers (Reference Lease and Ehlers2013) reveals age versus elevation relationships that are consistent with protracted exhumation in the Eastern Cordillera, likely linked to continued shortening initiated at the margin of the Mitu Graben since Eocene time.
(7) A comparison of U–Pb detrital zircon geochronologic analyses records protracted Eastern and Western Cordillera sediment contribution to the Altiplano/CABB basins. In contrast, Subandean rocks preserve a dominant cratonic detrital signal, with a minor Andean detrital signal appearing only during Cenozoic time. This may reflect a long-lived structural high in the Eastern Cordillera that partitioned two depocentres and blocked mixing of zircon populations from the Western Cordillera or craton, or may reflect variable sediment contribution signatures from the margins of a large continuous foreland basin.
Acknowledgements
This research was supported by a National Science Foundation (NSF) grant (B.K.H., EAR-0908518), (N.M. EAR-0908972), (T.A.E. EAR-0907817), NSF Graduate Research Fellowship (N.D.P.), ExxonMobil Geoscience Grant (N.D.P.), Geological Society of America Graduate Student Research Grant (N.D.P.), American Association of Petroleum Geologists Grants-in-Aid (N.D.P.), and support from the Jackson School of Geosciences at the University of Texas at Austin. Franco Bedoya and family were instrumental in logistical assistance and success in Peru. The staff at the University of Arizona LaserChron Center is thanked for their assistance with U-Pb geochronology. This manuscript benefited from discussions with K. Constenius, S. Gulick, M. Helper, R. Marrett, A. Mora, D. Stockli and A. Teixell. We appreciate comments and critiques from Michel Sébrier and an anonymous reviewer that improved the quality of the manuscript.
Supplementary material
To view supplementary material for this article, please visit http://dx.doi.org/10.1017/S0016756816000121.


