
1 Introduction
European democracies have made remarkable progress toward gender equality in political power and resources. The evidence for this is grounded in the steep decades-long rise in women’s presence in the formal political arena, including running for office, winning seats in national parliaments, and occupying executive positions in their respective governments (IPU 2025). Despite these strides in influence and representation at the highest levels of politics, research across various democracies reveals a persistent gender gap in citizens’ political participation, indicating that women tend to be less politically engaged than men (e.g., Beauregard Reference Beauregard2014, Reference Beauregard2017, Reference Beauregard2018; Burns Reference Burns2007; Burns et al. Reference Burns, Schlozman and Verba1997; Hinojosa and Kittilson Reference Hinojosa and Kittilson2020; Norris Reference Norris2002; Paxton et al. Reference Paxton, Kunovich and Hughes2007; Schlozman et al. Reference Schlozman, Burns and Verba1999; Espinal and Zhao Reference Espinal and Zhao2015). Given that democracy relies on the engaged participation of its citizenry in politics to reflect the will of the people, the ongoing gender disparity in women’s and men’s participation indicates a fundamental weakness in democratic systems and provides the impetus for this Element.
Understanding gender inequality in participation takes on added urgency in the current political climate. After years of progress toward and mobilization for gender equality in formal politics and large cultural shifts toward gender-egalitarian attitudes (Inglehart and Norris Reference Inglehart and Norris2003; Welzel Reference Welzel2013), a counter-wave of mobilization against gender equality has appeared in politics and the public discourse. Conservative, authoritarian, and populist voices in numerous democracies are currently challenging the notion of equal participation of men and women in society, framing their opposition as a “war on gender ideology” (Graff Reference Graff2014; Kantola and Lombardo Reference Kantola and Lombardo2021; Kuhar and Patternote Reference Kuhar and Paternotte2017). Even Sweden, widely recognized as the most gender-egalitarian nation in Europe, has seen a rise in anti-gender equality political mobilization (Towns et al. Reference Towns, Karlsson and Eyre2014). Thus, improving our understanding of gender and political participation is timely and of ongoing significance. With a more comprehensive perspective over time and across European nations, we are better prepared to engage with new questions about how to address ongoing gender inequalities and enhance and build upon gains that may have occurred.
Therefore, the core research question of this Element asks, over time and cross-nationally: how do women and men participate as democratic political citizens?
This research question rests on four dimensions relevant to inequalities in political participation: (1) gender differences in types of participation, (2) gender differences in levels and effects of socio-demographic and political resources, (3) change over time, and (4) cross-national context. Here we briefly introduce these issues.
First, we reject generalizing claims that equate the gender gap in political participation with men always participating more than women. Instead, we argue that politics itself has been defined to privilege men and masculine ways of engaging, often overlooking the theoretical possibility that women participate differently (Bourque and Grossholtz Reference Bourque, Grossholtz and Phillips1998; Burns Reference Burns2007; Kittilson and Schwindt-Bayer Reference Kittilson and Schwindt-Bayer2012; Marien et al. Reference Marien, Hooghe and Quintelier2010; Sarvasy and Siim Reference Sarvasy and Siim1994; Young Reference Young, Anderson and Siim2004). This was the central finding of our research using one year of cross-national data (Coffé and Bolzendahl Reference Bolzendahl2010). We found that men tend to dominate the most public, collective, and resource-intensive forms of participation (e.g., party membership, contacting politicians), while women engage in the more private, individual, or less resource-intensive forms of participation (e.g., buying goods for political reasons, signing petitions). We also showed that women outvote men. Thus, so-called gender “gaps” in participation may also reflect women’s greater participation relative to men. We can only discover this by taking a more wide-ranging look at various types of participation.
Second, binary gender remains the most ubiquitous source of categorical inequality worldwide (Alexander et al. Reference Alexander, Bolzendahl and Jalalzai2017; Epstein Reference Epstein2007). Gender is (re)enforced at the individual, interactional, and structural levels (Acker Reference Acker1990; Ridgeway Reference Ridgeway2011; Risman Reference Risman2004; Young Reference Young1994). Consequently, findings regarding women’s lower levels of political participation relative to men emerge from these processes of gender distinction and inequality, and specifically, gender differences in socio-economic and demographic resources (income, education, parental status) and political attitudes (e.g., political interest) (Bolzendahl and Myers Reference Bolzendahl and Myers2004; Burns Reference Burns2007; Fraile and Gomez Reference Fraile and Gomez2017). The latter are tied especially to gendered socialization into expectations of femininity (caregiving, nurturing, and communal roles) for girls and masculinity (assertiveness, leadership, and competitive behaviors) for boys (Ellemers Reference Ellemers2018; García-Albacete and Hoskins Reference García-Albacete and Hoskins2025; Hines Reference Hines, Lerner and Lamb2020; Weeks Reference Weeks2022). These gendered expectations can influence women’s perceptions of their own capabilities in political arenas and their levels of political participation (Atkeson and Rapoport Reference Atkeson and Rapoport2003; Bos et al. Reference Bos, Greenlee, Holman, Oxley and Lay2021; Rapoport Reference Rapoport1981). As a result of gender socialization and the inequalities that emerge gender, women and men typically possess different levels of socio-economic and demographic resources (e.g., work, education) and hold different political attitudes (Kittilson and Schwindt-Bayer Reference Kittilson and Schwindt-Bayer2012). Thus, it is important to control for these average differences and to understand how these characteristics may differentially shape women’s and men’s participation.
Third, we need to understand changes in the gender gap in political participation over time. Given women’s increasing economic empowerment (i.e., more working full-time, earning higher wages, higher levels of education) and political empowerment (i.e., growing descriptive representation in elected and executive office), we would anticipate greater gender equality in political participation over time. In studies of voting, for example, over time women have gone from voting less than men to now voting as much or more than men in national elections (Dassonneville and Kostelka Reference Dassonneville and Kostelka2021; Smets and van Ham Reference Smets and van Ham2013). Though U.S. research found little change over time in various measures of political participation (Burns et al. Reference Burns, Schlozman, Jardina, Shames, Verba, McCammon and Banaszak2018), we know relatively little about the change in gender gaps over time in Europe overall and by type of participation. Current trends, such as the retreat of democratic norms, the primacy of neoliberal economic reforms, and the cultural backlash to gender equality, and LGBT+ rights, may make change and the reduction of gender gaps in political participation less likely than expected.
Fourth, European nations make up a diverse landscape of patterns of gender inequality, and thus, it is important to understand how contextual country-level factors influence gender differences in participation. Scholars have long been concerned with understanding how country context relates to women’s political engagement (Duverger Reference Duverger1955). Overall, multilevel approaches demonstrate the value and importance of understanding differences across countries and suggest that the political context matters for women’s and men’s political participation (Hansen and Goenaga Reference Hansen and Goenaga2021; Kittilson and Schwindt-Bayer Reference Kittilson and Schwindt-Bayer2012). Many studies find that in countries where women have more formal political power, there is more equality in political participation (Beauregard Reference Beauregard2017, Reference Beauregard2018; Desposato and Norrander Reference Desposato and Norrander2009; Liu and Banaszak Reference Liu and Banaszak2017; Pyeatt and Yanus Reference Pyeatt and Yanus2017). Beyond political contextual factors, evidence shows that women’s economic and social empowerment contributes to greater gender equality in political participation (e.g., Fraile and Gomez Reference Fraile and Gomez2017; Inglehart and Norris Reference Inglehart and Norris2003; Lister Reference Lister2003; Orloff Reference Orloff1993). Little work has, however, compared the impact of contextual gender equality in political, economic, and social spheres. We will investigate the effect of contextual gender equality in these three different spheres to determine which aspects have the strongest impact on the gender gap in political participation.
In sum, in this Element, we look at four intersecting dimensions to describe gender differences in political participation: type of activity, individual-level explanations for participation, patterns over time, and cross-national differences. To investigate these different dimensions, we use data from ten rounds (2002–2020) of the European Social Survey (ESS) across twenty-six European democratic nations.Footnote 1 We provide a detailed comparative analysis of gender patterns in political participation over time and across countries. Political participation refers to a range of activities through which individuals seek to influence political decisions, institutions, or policies, such as voting, protesting, campaigning, or contacting elected officials. In contrast, political engagement encompasses a broader set of attitudes and orientations toward politics, including interest, awareness, and a sense of civic duty. While engagement reflects a citizen’s psychological and cognitive involvement in political life, participation involves the translation of that engagement into concrete action. In this study, we focus specifically on political participation and examine eight distinct forms: voting, boycotting, signing a petition, posting online, contacting a politician, demonstrating, working for a political party, and displaying a badge or sticker. These forms of participation encompass various modes of political participation, including individual and collective participation, formal political participation, and activist participation. This will provide the most comprehensive examination of patterns and types of political participation in European democracies over time and cross-nationally to date.
The Element is organized as follows. Section 2 provides a theoretical and empirical overview of the literature in this field, establishing the expectations to guide the empirical results presented in later chapters. Section 3 provides an overview of the data and methods used for the various types of analyses. Section 4 descriptively analyzes gendered patterns of participation over time and across nation. Section 5 provides a comprehensive test of the individual-level characteristics that help us understand differences in women’s and men’s levels of engagement in these political activities and whether these characteristics differentially affect women’s and men’s participation. In Section 6, we examine multilevel model results to test whether country-level gender equality shapes the size of the gender gap comparatively. Finally, in Section 7, we provide a review of our findings and discuss the implications of our results for future research and efforts to support gender equality in political participation.
2 Explanations for Gendered Inequality in Political Participation
Active public participation is fundamental to democratic responsiveness and a core democratic value (Dalton Reference Dalton2008, Reference Dalton2022; Gallego Reference Gallego2015; Verba Reference Verba1996). Consequently, persistent and systematic disparities in participation, particularly along existing social stratification lines, such as gender, pose significant threats to both political equality and the effectiveness of democratic governance (Dalton Reference Dalton2022; Gallego Reference Gallego2015). This section outlines the theoretical relevance of and empirical evidence for understanding women’s and men’s political participation along the previously outlined dimensions: type of activity, individual-level explanations for participation, patterns over time, and cross-national differences.
2.1 Conceptualizing Gendered Patterns of Political Participation
A shortcoming in many popular narratives about women’s lower levels of political participation compared with men’s is the failure to acknowledge that politics itself has been defined to privilege men and masculine ways of engaging, overlooking differences in types of participation (e.g., Beckwith Reference Beckwith2005; Burns Reference Burns2007). However, women’s and men’s different engagement as political citizens is influenced by historical discrimination in access to politics and the gendered dynamics of socialization and access to resources and opportunities, which facilitate certain types of participation over others. When distinguishing different types of activities, we see that “gender gaps” in participation sometimes reflect women’s greater participation in an activity than men’s. In our work, we found that women participate more in private, individual, or noninstitutional forms, and men participate more in expressive contact, collective, and resource-intensive forms (Coffé and Bolzendahl Reference Bolzendahl2010).
Researchers who have previously examined gender differences in types of political activities echo the need to distinguish between types of activities. Conceptualizations of participation types include, for example, differentiating between institutional, noninstitutional, and expressive (Pfanzelt and Spies Reference Pfanzelt and Spies2019); political, community, and online (Grasso and Smith Reference Grasso and Smith2022); traditional, individual, collective (Beauregard Reference Beauregard2017); and individual, collective, formal, and activist (Ekman and Amnå Reference Ekman and Amnå2012). Our work (Coffé and Bolzendahl Reference Bolzendahl2010) and subsequent work (Bode Reference Bode2017; Carreras Reference Carreras2018; Grasso and Smith Reference Grasso and Smith2022; Pfanzelt and Spies Reference Pfanzelt and Spies2019; Quaranta and Dotti Sani Reference Quaranta and Dotti Sani2018) have borne out the theoretical argument for understanding gender differences in types of participation.
Among traditional electoral forms of participation, such as working for a campaign, donating, or attending meetings, research has often continued to find lower levels of women’s participation than men (Burns et al. Reference Burns, Schlozman, Jardina, Shames, Verba, McCammon and Banaszak2018; Bolzendahl and Coffé Reference Bolzendahl2010; Kittilson and Schwindt-Bayer Reference Kittilson and Schwindt-Bayer2012; Sartori et al. Reference Sartori, Tuorto and Ghigi2017; Quaranta and Dotti Sani Reference Quaranta and Dotti Sani2018). Voting is an exception, as recent research consistently shows that women vote as much, and perhaps more than, men (Carreras Reference Carreras2018; Coffé and Bolzendahl Reference Bolzendahl2010; Kostelka et al. Reference Kostelka, Blais and Gidengil2019; Smets and van Ham Reference Smets and van Ham2013). Other research shows that women are less likely than men to attend political discussion meetings or contact politicians (Beauvais Reference Beauvais2020; Coffé and Bolzendahl Reference Bolzendahl2010; Grasso and Smith Reference Grasso and Smith2022). However, women tend to participate more in activities such as signing petitions and engaging in political consumerism (buying or boycotting goods for political reasons) (Coffé and Bolzendahl Reference Bolzendahl2010; Stolle, et al. Reference Stolle, Hooghe and Micheletti2005). Gender patterns of online political participation show mixed patterns. Some research finds that women may participate less than men (Abendschön and García-Albacete Reference Abendschön and García-Albacete2021; Heger and Hoffmann Reference Heger and Hoffmann2021), but others show small overall gaps (Bode Reference Bode2017). Yet, once again, this research indicates women and men are participating politically online quite differently. Bode (Reference Bode2017) shows that men are more active in visible types of online behaviors, but women engage in less visible or less-likely-to-offend political behaviors. Looking in the Czech Republic, Vochocová et al. (Reference Vochocová, Štětka and Mazák2016) similarly find that women and men do not differ much in the less visible types of behavior, while men are more likely to take on actions that require more effort and exposure, especially posting campaign-related comments.
To explain why these gendered patterns of political participation exist, we can identify several interrelated mechanisms. However, underlying all these patterns is the social construction of gender and its implications for how persons are socialized, rewarded, and socially conceptualized. While individuals, framed as “women” and as “men”, are not monolithic social groups with each holding unique shared interests and identities (Celis and Childs Reference Celis and Childs2023), the ubiquity and reinforcement of binary gender as a social identity and its implications for political outcomes are clear (Alexander et al. Reference Alexander and Jalalzai2018; Ridgeway Reference Ridgeway2011). Through the influence of individual experiences, social interactions, and broader structural forces, many women (and men) develop gendered interests or identities that reflect a shared group identity or consciousness (Reingold and Foust Reference Reingold and Foust1998; Stout et al. Reference Stout, Kretschmer and Ruppanner2017; Young Reference Young1994). In addition, the power of gender categories reflects the construction of gender as seriality (Weldon Reference Weldon2011; Young Reference Young1994) and social fact (Risman Reference Risman1998, Reference Risman2004; West and Zimmerman Reference West and Zimmerman1987) outside the need for any particular woman (or man) to see themselves as part of a cohesive group.
As part of the social (re)enforcement of gender, women are socialized to express or embody femininity, and such traits are associated with expressive, other-oriented qualities, meaning women are socialized to be less confrontational and not engage in conflict-prone modes of participation as compared with men (Coffé and Bolzendahl Reference Coffé and Bolzendahl2017, Reference Coffé and Bolzendahl2021; Grasso and Smith Reference Grasso and Smith2022; Hooghe and Stolle Reference Hooghe and Stolle2004). Men are socialized and valued for traits of masculinity that emphasize leadership, competition, public roles, autonomy, and self-reliance (Connell, Reference Connell1995; Fox and Lawless Reference Fox and Lawless2004; Schrock and Schwalbe Reference Schrock and Schwalbe2009). These are not essential aspects of being men and women, but to the extent that society continues to enforce and utilize these frameworks, such gendered constructions have major consequences for their life course experiences, identities, values, and material outcomes (Diekman et al. Reference Diekman, Steinberg, Brown, Belanger and Clark2017; Ridgeway Reference Ridgeway2011; Sartori et al. Reference Sartori, Tuorto and Ghigi2017).
Research has demonstrated that gendered patterns of political socialization start very young and intensify over time (Bos et al. Reference Bos, Greenlee, Holman, Oxley and Lay2021; García-Albacete and Hoskins Reference García-Albacete and Hoskins2024; Lay et al. Reference Lay, Holman and Bos2021). Additionally, societal expectations for women to focus on the “private” sphere may contribute to gender variations in participation, with women engaging in less visible and more individual ways that are also easier to incorporate in their lives (Lister Reference Lister2003; Lovenduski Reference Lovenduski1998; Risman Reference Risman1998). Relatedly, women’s greater share of the mental load – where they are expected to “manage” the household – is tied to their lower political interest and public engagement (Helgøy and Weeks Reference Helgøy and Weeks2025). Materially, women are, on average, also at a disadvantage. Though women have begun to outearn men in the receipt of college degrees in many democracies (EIGE 2020), women’s comparatively lower levels of socio-economic resources may hinder their participation in time-consuming, costly, or highly skilled forms of activities, such as actively campaigning for a political candidate (Burns Reference Burns2007; Lister Reference Lister2003; Paxton et al. Reference Paxton, Kunovich and Hughes2007). Women might find it more feasible to participate in activities that can be integrated into daily life without straining their already (relatively) limited resources, opting for more “private” forms of involvement (Stolle et al. Reference Stolle, Hooghe and Micheletti2005).
Gender socialization and traditional role expectations may also influence how women and men participate differently in democratic processes by shaping their democratic priorities. Hansen and Goenaga (2019) found, in a study of twenty-nine countries, that while women and men express equal support for democracy, they tend to prioritize different democratic institutions. Women placed less emphasis on institutional factors, such as representative institutions, intermediary bodies, and interpersonal deliberation, than men. Instead, they prioritized democratic institutions less affected by gendered power asymmetries, such as direct participation and public justification, or those aimed at challenging those imbalances, like equal protection of civil, political, and social rights. These findings align with others, showing that, as democratic citizens, women place significantly greater emphasis than men on civil and social responsibilities and political, civil, and social rights (Bolzendahl and Coffé Reference Bolzendahl and Coffé2009).
The role of violence against women in politics (VAWP) is also crucial in understanding gendered patterns of political participation. Women’s entry into the traditionally masculine world of politics has long been a site of implicit and explicit violence for women (Bardall Reference Bardall2018). Historically, during the first wave of feminism in Western countries, women fighting for the right to vote endured assaults, torture, and imprisonment, and electoral violence continues to affect women globally today (Bardall Reference Bardall2013; Krook Reference Krook2020). The United Nations now recognizes VAWP as a human rights violation as it prevents the realization of women’s political rights (Ballington Reference Ballington2018; Krook Reference Krook2020). The negative effects of such violence – including psychological, sexual, physical, and verbal abuse – are well-documented from the testimonies of women who engage in political life as activists, journalists, commentators, electoral candidates or elected officials (Krook Reference Krook2020). However, as detailed in the UN report (2018), VAWP is not only aimed at public figures but also linked to women’s lower overall political participation (see also Biroli Reference Biroli2018; Restrepo Sanín Reference Restrepo Sanín2020).
This VAWP is deeply tied to the enforcement of traditional gender roles. As outlined in the UN Report on VAWP (2018), the aim of violence against women in politics is to preserve traditional gender roles and stereotypes and maintain structural and gender-based inequalities, contributing to a broader culture in which VAWP is normalized and tolerated (Section III.B.13–16). Such violence is reinforced by pervasive stereotypes that depict politics as irrelevant to women’s daily lives and needs and portray women as incapable and ineffective leaders. Krook (Reference Krook2020) describes this as cultural violence, noting that “by denigrating and disparaging women who enter the public sphere, these cultural tropes warn other women to stay away or else face similar degrading treatment” (p. 100). This marginalization of women’s voices persists in contemporary journalism and online media and has expanded in new modes of violence, such as doxxing (Carlson and Witt Reference Carlson and Witt2020; Eckert and Metzger-Riftkin Reference Eckert and Metzger-Riftkin2020; Mantilla Reference Mantilla2013; Rego Reference Rego2018).
In addition to aligning with socialized gender role expectations, differences in women’s and men’s patterns of participation may reflect the threats inherent in pursuing “role incongruent” forms of participation (Abendschön and García-Albacete Reference Abendschön and García-Albacete2021; Krook Reference Krook2020). Specifically, public and confrontational forms of participation that are more popular for men are the types that women may see as increasing their likelihood of assault (e.g., at a demonstration), harassment (e.g., public comments online), or attack (e.g., working for a political organization). Conversely, signing a petition, boycotting goods, and voting are collective actions that are often anonymous and thus pose less of a risk of violence.
2.2 Gendered Paths to Political Participation
To understand gender differences in political participation, we distinguish between two broad categories of resources: socio-economic and demographic resources, and political attitudes. This approach greatly simplifies a variety of intersecting experiences and identities. However, it also allows us to highlight the importance of material and ideological resources in affecting women’s and men’s political participation. We consider how differences in the levels of different socio-economic, socio-demographic, and political resources contribute to gender gaps in participation and how the effects of these same resources may matter differently in shaping women’s and men’s political participation.
2.2.1 The Gender Gap in Political Participation: Levels of Resources
Gender differences in political participation are strongly related to and dependent on gender differences in resource levels (Coffé and Bolzendahl Reference Bolzendahl2010; Grasso and Smith Reference Grasso and Smith2022; Kittilson Reference Kittilson2016).Here, we review some of the key findings regarding why gender differences in key demographic, economic, and political resources matter for understanding and explaining women’s and men’s levels of political participation.
Economically, a large body of research shows women are disadvantaged relative to men in terms of employment, high prestige, autonomous careers, and wages (England et al. Reference England, Levine and Mishel2020; OECD 2023; World Economic Forum 2024). Men are more likely than women to work full-time, which is known to positively affect political participation (Gallego Reference Gallego2007; Schlozman et al. Reference Schlozman, Burns and Verba1994). This may disadvantage women in terms of political participation. On the one hand, lower access to material resources can make it more difficult to afford some forms of political participation (Sartori et al. Reference Sartori, Tuorto and Ghigi2017). On the other hand, being less engaged in public roles (e.g., employment) may undermine women’s public efficacy and political knowledge. For example, Schlozman et al. (Reference Schlozman, Burns and Verba1994, Reference Schlozman, Burns and Verba1999) find that (full-time) employment is positively correlated with political participation and information.
Although women now outperform men in postsecondary educational completion (European Institute for Gender Equality, 2023), they tend to receive fewer returns on their education partly due to gender differences in chosen fields of study (Black et al. Reference Black, Haviland, Sanders and Taylor2008; Hägglund and Leuze Reference Hägglund and Leuze2021; Jacob et al. Reference Jacob, Iannelli, Duta and Smyth2020). In addition, as girls move through the educational system, they are socialized into less political ambition and interest than boys (Bos et al. Reference Bos, Greenlee, Holman, Oxley and Lay2021; Lay et al. Reference Lay, Holman and Bos2021). In their study of German youth, Pfanzelt and Spies (Reference Pfanzelt and Spies2019) show the importance of political socialization for driving gender gaps in institutional participation. Discussing politics with family and friends, at school, being civically engaged, and being a club member all relate to more participation.
Socio-demographically, it is well established that women take on a disproportionate amount of domestic and parental labor (Baxter and Tai Reference Baxter, Tai, Connerley and Wu2016; Campaña et al. Reference Campaña, Gimenez-Nadal and Velilla2023; Mencarini and Sironi Reference Mencarini and Sironi2012). This is clearly tied to lower economic resources, but also directly shapes the political activities available to women and men. For example, suppose women do more shopping for the household. In that case, political consumerism is a convenient way to engage. If men have lower expectations to care for other household members, it is easier for them to attend political demonstrations or meetings. Without a measure of time spent on housework, studies have instead looked at how controlling for being married/partnered or having children in the household may help explain gender gaps (Coffé and Bolzendahl Reference Bolzendahl2010; Naurin et al. Reference Naurin, Stolle and Markstedt2023; Quaranta Reference Quaranta2016; Quaranta and Dotti Sani Reference Quaranta and Dotti Sani2018; Voorpostel and Coffé Reference Voorpostel and Coffé2012). Recent research has examined the detrimental effects of women’s greater mental load – the work of anticipating, fulfilling, and monitoring household needs – and found that this is linked to their lower levels of political interest and public political participation (Helgøy and Weeks Reference Helgøy and Weeks2025). For the most part, this research has aimed to understand how such factors disproportionately affect women’s participation, which we will discuss in more detail (see paragraph 2.2.2).
Studies show that women are more religious than men, at least among Christians (Loewenthal et al. Reference Loewenthal, MacLeod and Cinnirella2002; Schnabel Reference Schnabel2015). Arguably, congregations provide opportunities to participate in governance and organizational leadership, and thus, it would seem to be the ideal institution to help close the gender gap in participation (Friesen and Djupe Reference Friesen and Djupe2017). Generally, religious attendance is positively associated with political participation (Bolzendahl et al. Reference Bolzendahl, Schnabel and Sagi2019). Though messages vary, most major religions tend to emphasize essential socially constructed differences between women and men and reinforce traditional messages about women’s and men’s roles in society (Raday Reference Raday2003). Thus, research indicates that women may participate less because of their greater religious identification and involvement (Coffé and Bolzendahl Reference Bolzendahl2010).
Finally, political attitudes are a resource that elucidates gender gaps in political participation. Women’s lower levels of political information, interest, and efficacy compared with men’s serve as important explanations for the gender gap in political participation, independent of socio-economic and demographic characteristics (Coffé and Bolzendahl Reference Bolzendahl2010, Reference Coffé and Bolzendahl2017; Dassonneville and Kostelka 2020; Kittilson and Schwindt-Bayer Reference Kittilson and Schwindt-Bayer2012; Verba et al. Reference Verba, Burns and Schlozman1997). Higher levels of political interest and efficacy are an important resource for driving political participation, but again, gender socialization leads women to lag men in such political resources (Burns Reference Burns2007; Coffé Reference Coffé2013; Coffé and Bolzendahl Reference Bolzendahl2010; Fraile and Gomez Reference Fraile and Gomez2017; Lovenduski Reference Lovenduski2005; Rapoport, Reference Rapoport1981; Verba et al. Reference Verba, Burns and Schlozman1997). Specifically, politics is typically characterized by conflict and portrayed as risky and competitive (Hibbing et al. Reference Hibbing, Ritchie and Anderson2011; Klofstad et al. Reference Klofstad, Sokhey and McClurg2013; Schneider et al. Reference Schneider, Holman, Diekman and McAndrew2016; Ulbig and Funk Reference Ulbig and Funk1999), which directly counters women’s socialization into communal traits and aligns with men’s socialization into agentic traits. Men are thus rewarded for high-risk/conflict types of participation as fulfilling masculine expectations, while women may be punished for failing to express appropriate femininity and find that communal approaches are not valued in “politics” as conventionally defined. Indeed, risk-taking and comfort with conflict are positively associated with being active in politics (Coffé and Bolzendahl Reference Coffé and Bolzendahl2017; Fraile and Miguel Moyer Reference Fraile and de Miguel Moyer2022). In sum, a key factor in understanding gender differences in participation overall, and types of participation, is in the attitudes women and men differentially hold toward politics, including factors such as efficacy, interest, and trust.
2.2.2 The Gender Gap in Political Participation: Effects of Resources
Accounting only for inequalities in the levels of women’s and men’s resources as a basis for understanding their differences in political participation fails to account for differences in the gendered effects of these resources. Even when women and men hold the same level of a resource, that resource may influence women’s and men’s decisions to participate differently. This was a key finding in our previous research (Coffé and Bolzendahl Reference Bolzendahl2010) and, as we review in the following, reflects a solid body of related research.
Socio-economic factors comprise various experiences that may differentially shape women’s versus men’s participation. Social/demographic roles are often highly gendered. This is the case for family roles in particular, such that experiences of pregnancy, parenthood, and being a partner come with different expectations, behaviors, and attitudes that differentially impact women’s and men’s political participation (Naurin et al. Reference Naurin, Stolle and Markstedt2023; Quaranta Reference Quaranta2016; Quaranta and Dotti Sani Reference Quaranta and Dotti Sani2018; Voorpostel and Coffé Reference Voorpostel and Coffé2012). Various scholars have highlighted that women’s domestic responsibilities significantly influence their public lives by making political participation more challenging and costly (Burns et al. Reference Burns, Schlozman and Verba2001; Iversen and Rosenbluth Reference Iversen and Rosenbluth2006; Sapiro Reference Sapiro1982; Sartori et al. Reference Sartori, Tuorto and Ghigi2017; Teele et al. Reference Teele, Kalla and Rosenbluth2018). Swiss data show that following a separation, women vote less than similar men, while separated men tend to increase some types of participation (Voorpostel and Coffé Reference Voorpostel and Coffé2012). In Finland and Spain, wives and mothers have less political knowledge than husbands and fathers (Ferrín et al. Reference Ferrín, Fraile, García-Albacete and Gómez2020). In one of the most gender-egalitarian nations, Sweden, Naurin et al. (Reference Naurin, Stolle and Markstedt2023) find that when women become pregnant, they reduce their political participation, and the effect lasts until the child grows older. Finally, looking at data across twenty-seven European nations, Quaranta and Dotti Sani (Reference Quaranta and Dotti Sani2018) similarly find that “family intensive” life course stages such as parenthood tend to have a stronger negative effect on women’s political involvement than men’s.
Other important social factors to consider are age and cohort differences. Some research has worked to try to disentangle these, relying on longitudinal panel data. Cross-sectional survey data cannot do this, but cohort and age differences can likely be combined. Generally, younger cohorts have had more exposure to politically powerful women role models and global norms supporting gender equality (Inglehart and Norris Reference Inglehart and Norris2003). These experiences can be transformative for both women and men. However, due to women’s shared experiences with patriarchal disadvantage, the transformative impact will likely be more profound among women (Inglehart and Norris Reference Inglehart and Norris2003). Therefore, differences across age cohorts are expected to influence women’s participation more than men’s. As a result, the difference in levels of participation between younger and older women is anticipated to be greater than the difference between younger and older men. This also implies that the gender difference in political participation – particularly in those where women tend to be underrepresented – is smaller among younger age cohorts. Alexander and Coffé (Reference Alexander, Coffé, Alexander, Bolzendahl and Jalalzai2017) show an overall decline in gender differences in political participation, with men and women being more likely to engage at a similar level among younger compared with older cohorts. Similarly, among young people in nine European nations, young women typically participate more or as much as young men (Grasso and Smith Reference Grasso and Smith2022) across all types of political and community participation except online participation.
Although some studies suggest that religiosity increases political participation (Arikan and Bloom Reference Arikan and Bloom2019; Bolzendahl et al. Reference Bolzendahl, Schnabel and Sagi2019; Norris Reference Norris2002; Norris and Inglehart Reference Norris and Inglehart2011), there is little evidence that women’s higher levels of religiosity enhance their political participation relative to men. Greater religiosity has been found to decrease women’s participation while encouraging men’s (Coffé and Bolzendahl Reference Bolzendahl2010; Friesen and Djupe Reference Friesen and Djupe2017). Overall, major European religions tend to promote traditional gender roles, reinforcing femininity and masculinity as essential aspects of being a woman or a man. Because of this focus on traditional gender roles, we expect higher levels of religious involvement to affect women’s and men’s participation differently, with a stronger and more positive impact on men’s political engagement compared with women’s. In the U.S., studies have found that church or mosque attendance has a stronger positive effect on men’s political engagement and participation than women’s (Read Reference Read2007; Robnett and Bany Reference Robnett and Bany2011).
Labor force participation and occupation may have different implications for women’s and men’s political participation. U.S. research indicates that employment outcomes reflect different opportunities and accumulated advantages for men (Schlozman et al. Reference Schlozman, Burns and Verba1999). Cross-nationally, it is evident that women in industrialized democracies spend more time on housework than their men, even when both work full-time (Batalova and Cohen Reference Batalova and Cohen2002; Knudsen and Waerness Reference Knudsen and Waerness2008). Consequently, employment may negatively impact women’s participation due to accumulated indirect disadvantages and a direct lack of leisure time that may not affect men’s participation as strongly. Supporting this, Schlozman et al. (Reference Schlozman, Burns and Verba1999) find that women’s political participation declines with increased work hours, whereas men’s does not (see also Coffé and Bolzendahl Reference Bolzendahl2010). Regarding occupation, professional roles generally boost political participation (Verba et al. Reference Verba1995), but may have different effects on women than men, as attaining a professional occupation is rarer and more challenging than for men. In our 2010 publication (Coffé and Bolzendahl Reference Bolzendahl2010), we found that women’s employment in professional and technical occupations has a stronger positive correlation with both private/individual and collective activism. Thus, women’s advancement into more powerful positions may further enhance their political participation and, in some cases, help close the gap with men.
Finally, there is strong evidence that the impact of political resources varies greatly by gender. Work shows that when deciding to pursue elected office, women tend to set higher standards for themselves compared with men (Fox and Lawless Reference Fox and Lawless2005; Fulton et al. Reference Fulton, Maestas, Maisel and Stone2006; Lawless and Fox Reference Lawless and Fox2010). Women, thus, tend to evaluate their qualifications differently than men, setting higher standards for themselves before engaging in political participation. This perception of needing to excel can contribute to a pattern where women may accumulate more political experience and expertise before entering politics than men. Translating this to the general decision to participate in politics leads to the expectation that political resources such as interest, trust, and knowledge matter more for women than men. Prior research finds such evidence. In our cross-national study, we found that political interest and political efficacy mattered more positively for women than men’s likelihood to vote and private/individual activism, respectively (Coffé and Bolzendahl Reference Bolzendahl2010). Looking at political knowledge in the U.S., Ondercin and Jones-White (Reference Ondercin and Jones-White2011) show that while low political knowledge depresses women’s participation in politics, the gender gap disappears at higher levels of political knowledge. At high levels of knowledge, women are even more likely than men to vote, wear a political button or work for a political campaign. Lilleker et al. (Reference Lilleker, Koc-Michalska and Bimber2021) demonstrate that although the feeling of external efficacy is important for online participation regardless of gender, women seem to require a higher level of perceived competence to engage with online political content, particularly when it comes to sharing and commenting, compared with men. Overall, this suggests that political resources have a stronger and more positive effect for women’s political participation than men.
2.3 Change Over Time in Gender Differences in Political Participation
For gender differences in political activity to evolve over time, some of the underlying factors explaining the disparity in political participation must change. Over the past few decades, we have witnessed shifts in women’s social, political, and economic positions, including, for example, the expansion of women’s education, women’s formal political representation, and labor market participation, factors known to positively affect political participation (Burns et al. Reference Burns, Schlozman, Jardina, Shames, Verba, McCammon and Banaszak2018; Desposato and Norrander Reference Desposato and Norrander2009; Inglehart and Norris Reference Inglehart and Norris2003; Liu and Banaszak Reference Liu and Banaszak2017). Over a longer time period, these changes may have resulted in a closing gender gap in those types of participation where women have traditionally been underrepresented. Supporting this view, a recent U.S.-focused study finds that gender gaps in most forms of political participation have largely disappeared – with the exception of political donations. The authors attribute this shift primarily to women’s relative gains in education and income, which enhance participatory resources and reduce the costs of political engagement (Shames et al. Reference Shames, Morell, Jardina, Schlozman and Burns2025).
Modernization theories have assumed that women’s increased participation would happen linearly, toward ever more gender-equal democratic participation (Inglehart and Norris Reference Inglehart and Norris2003). Recent changes and trends, however, suggest that this progression may not be as straightforward. In the past decade, we have observed a retreat of democratic norms and the cultural backlash to immigration, gender equality, and LGBT+ rights, attitudes that are closely tied to the growing electoral success of populist radical right parties (Coffé et al. Reference Coffé, Fraile, Alexander, Fortin-Rittberger and Banducci2023; Kováts Reference Kováts, Michaela Köttig and Petö2017; Paternotte and Kuhar Reference Paternotte and Kuhar2018). These trends also may make change and shrinking gender gaps in political participation less likely than would be expected based on the modernization theory.
Surprisingly, few studies have investigated changes over time in gender differences in political participation. Perhaps the most consistent finding over time has been the narrowing (even disappearance) of the gender gap in voter turnout (Dassonneville and Kostelka 2020; Smets and van Ham Reference Smets and van Ham2013). For this reason, we would expect to see little change in overall gender equality in voter turnout. Comparing cross-national European data from 1974 with 2002 data, Stolle and Hooghe (Reference Stolle and Hooghe2011) demonstrate that in the 1970s, the acts of signing petitions and boycotting all showed the typical gender gap of women being less likely to engage in these activities than men. Yet, by 2002, the gender gap had been reversed, with women engaging more in these activities than men. The gender gap in protesting did not reverse but declined significantly between 1974 and 2002. Partisan and institutional activities, such as party membership and contacting politicians, remained men-dominated activities. They found similar patterns based on Dutch data from 1971 to 1998. In France, over a shorter time span, 1981–2008, Durovic (Reference Durovic2017) finds that French men are more likely than women to demonstrate and boycott, though women petition more. Descriptively, this gap has narrowed over time, though it has not disappeared. Though focused on U.S. data, covering the mid-1970s to 2012, Burns et al. (Reference Burns, Schlozman, Jardina, Shames, Verba, McCammon and Banaszak2018) did not find a narrowing gender gap in political participation among the American public.
Another way of estimating the relative persistence of gender gaps is to consider the pattern of findings over the years. Our 2010 publication used 2004 data and found an uneven pattern of gaps across different types of participation (Coffé and Bolzendahl Reference Bolzendahl2010), which updated older research demonstrating small but persistent gaps in women participating less than men (Burns Reference Burns2007; Inglehart and Norris Reference Inglehart and Norris2003; Norris Reference Norris2002; Parry et al. Reference Parry, Moyser and Day1992; Schlozman et al. Reference Schlozman, Burns, Verba and Donahue1995, Reference Schlozman, Burns and Verba1999; Verba et al. Reference Verba, Burns and Schlozman1997). Yet, because the oldest research rarely distinguished between types of participation, conclusions are difficult to draw. Work published since 2010, however, tends to replicate the patterns of inequalities we found across types of participation (i.e., women participating more, less, or evenly to men depending on how participation is measured) (Bode 21017; Carreras Reference Carreras2018; Grasso and Smith Reference Grasso and Smith2022; Pfanzelt and Spies Reference Pfanzelt and Spies2019; Quaranta and Dotti Sani Reference Quaranta and Dotti Sani2018). Thus, gender gaps of various sorts may not have changed markedly in recent decades.
2.4 Cross-National Differences in Gender Differences in Political Participation
The global landscape of political participation reveals a striking variation in gender gaps across different countries (Beauregard Reference Beauregard2018; Kittilson and Schwindt-Bayer Reference Kittilson and Schwindt-Bayer2012; Liu and Banaszak Reference Liu and Banaszak2017). The degree to which women are engaged in political processes differs significantly, underscoring the importance of the unique contexts and challenges that shape women’s political participation in different countries.
Previous research has confirmed that gender equality at the country level matters in shaping the political participation of women and men as individuals (Alexander et al. Reference Alexander and Jalalzai2018; Beauregard Reference Beauregard2018; Burns Reference Burns2007; Desposato and Norrander Reference Desposato and Norrander2009; Kittilson and Schwindt-Bayer Reference Kittilson and Schwindt-Bayer2012; Liu and Banazak Reference Liu and Banaszak2017). As a reflection of the vibrancy and equality in access to democracy for the average citizen, it makes sense that gender inequality in various types of political participation will be linked to women’s and men’s overall level of inequality in society. This argument has long roots and support. In his article examining eight nations and women’s lower political participation at the time, Jennings (Reference Jennings1983) explained that “key institutions in such domains as education, the economy, and the law are configured to deny women the same opportunities, benefits, and protection that are accorded men. The result is that women occupy structural niches that are less conducive to robust political activity” (pg. 364).
Our study focuses on the implications of political, economic and social gender equality. We will thus investigate the influence that societal gender equality in different spheres (political, economic, and social) can have on shaping a more equal gender participation in politics.
A substantial body of research has investigated the link between women’s descriptive political representation and its impact on women’s political engagement and participation (Beauregard Reference Beauregard2017, Reference Beauregard2018; Desposato and Norrander Reference Desposato and Norrander2009; Dassonville and Kostelka 2020; Liu and Banaszak Reference Liu and Banaszak2017; Pyeatt and Yanus Reference Pyeatt and Yanus2017). Broadly, substantive and symbolic representation are the two mechanisms by which women’s descriptive electoral representation increases women’s political participation. The substantive representation mechanism starts from the finding that issues relevant to women’s empowerment gain greater attention in the policy-making process when more women hold representative roles (Bolzendahl Reference Bolzendahl2010, Reference Bolzendahl2011; Bolzendahl and Brooks Reference Bolzendahl and Brooks2007; Childs and Whithey Reference Childs and Whithey2004; Swers Reference Swers2002; Wängnerud Reference Wängnerud2009). Schwindt-Bayer and Mishler (Reference Schwindt-Bayer and Mishler2005), for example, show that where more women are elected to government, the legislative process delves more deeply into questions of gender equality and social welfare policies that align with women’s preferences. Weeks (Reference Weeks2022) concludes that women politicians play a crucial role in advancing leave policies toward gender equality at home and in the workplace, in line with women’s interests. Women candidates are also inclined to focus their campaigns on issues relevant to women (Dabelko and Herrnson Reference Dabelko and Herrnson1997; Herrnson et al. Reference Herrnson, Lay and Stokes2003; Larson Reference Larson2001). A similar substantive effect is the possibility that women’s greater representation transforms (“regenders”) the political institutions themselves, making them more welcoming to women citizens who, therefore, participate more (Hawkesworth Reference Hawkesworth2003; Liu and Banaszak Reference Liu and Banaszak2017) possibly because women in office engage in politics with an approach that is more open, collegial, and inclusive compared with men (Kathlene Reference Kathlene1995; Rosenthal Reference Rosenthal1998).
Symbolically, the inclusion of women politicians in the electoral process conveys signals to women in the electorate that “politics is not just a man’s game” (Karp and Banducci Reference Karp and Banducci2008; Sapiro Reference Sapiro1981; Verba, Burns, and Schlozman Reference Verba, Burns and Schlozman1997). An increase in the number of women running for and successfully attaining political office has the potential to communicate to women citizens that they can engage in politics, increasing their levels of engagement and participation, and consequently narrowing the participation gender gap. Alexander (Reference Alexander2012) found that a higher percentage of women in the legislature is associated with an increased belief among women in their capacity to govern. The symbolic effect also asserts that increasing the proportion of women included among political candidates or elected to office contributes positively to the legitimacy of the political system, especially in the eyes of women citizens (Mansbridge Reference Mansbridge1999). Witnessing a more equitable representation of women and men in the political process might lead more women to perceive the political system as fair, transparent, and accessible, consequently fostering higher levels of political participation among women. Schwindt-Bayer and Mishler (Reference Schwindt-Bayer and Mishler2005) show that greater representation of women enhances confidence in legislation among women, though the positive effect of the proportion of women in the legislature was not limited to women (see also Karp and Banducci Reference Karp and Banducci2008). With greater confidence in the system, women may see increased political ambition and overall participation (Liu and Banaszak Reference Liu and Banaszak2017). Overall, higher levels of confidence and trust in political institutions among women through an increased representation of women will boost women’s participation, thereby reducing the gender differences in political participation.
While most research tends to support the correlation between women’s descriptive representation and increased participation among women, there are important contextual nuances.Footnote 2 Using module 2 (2001–2006) Comparative Study of Electoral Systems data, Beauregard (Reference Beauregard2018) and Kittilson and Schwindt-Bayer (Reference Kittilson and Schwindt-Bayer2012) find a limited overall impact of the presence of women in the legislature on gender gaps in political participation when measured as voting, campaign activity, working for a party, or contacting politicians. Beauregard (Reference Beauregard2018), however found that the presence of women in the legislature is related to smaller gender gaps for protest. The studies showed women’s significantly lower participation than men in all these activities except for voting. Thus, despite theoretical and empirical evidence supporting an effect, it may vary substantially across types of participation.
Moving beyond political gender equality, we also investigate the impact of economic and social gender equality on gender differences in political participation. Overall, and similar to political gender equality, we anticipate finding smaller gaps in countries with higher levels of social and economic gender equality. This expectation is grounded in the idea that economic and societal conditions and opportunities significantly influence individuals’ ability and willingness to engage in political activities. In countries with greater gender equality in social and economic spheres, women typically have increased access to education, employment, and economic resources (Duflo Reference Duflo2012). This enhanced socio-economic status empowers women, making them more likely to participate in various aspects of public life, including politics (Kenworthy and Malami Reference Kenworthy and Malami1999). Research has suggested that the large-scale entry of women into the workforce spurs greater women’s political engagement and participation. Iversen and Rosenbluth (Reference Iversen and Rosenbluth2008) posit that as women join the labor market, they become part of networks and organizations, such as unions, exposing them to political discourse and advocacy, consequently fostering interest and political participation.
Higher levels of social and economic gender equality often indicate a more inclusive and supportive societal environment. In such contexts, women are likely to face fewer societal barriers, stereotypes, and discriminatory practices that might otherwise deter them from participating in political processes (Alexander and Welzel Reference Alexander and Welzel2011, Reference Alexander and Welzel2015). Recent evidence also suggests that more progressive societal norms around gender equality and freedom of sexuality are associated with greater opposition to political leadership rooted in hegemonic masculine dominance, indicating that normative support for gender equality can reinforce democratic engagement and participation (Alexander and Off Reference Alexander and Off2025). Research finds a positive relationship between aggregate gender equality (Fraile and Gomez Reference Fraile and Gomez2017), cultural gender equality (Dassonneville and Kostelka Reference Dassonneville and Kostelka2021), and a smaller gender gap in political interest. Countries invested in gender equality thus facilitate a greater sense of political interest among women, and this is likely to increase their political participation as well.
2.5 Section Summary
In this section, we reviewed the theoretical and empirical evidence for the four major aspects of gendered political participation we analyze. There are compelling reasons grounded in previous theories and research to closely consider gender differences in participation types and the factors that explain why women and men may participate unequally and differently.
Gender, as a social construction, creates and maintains inequality between women and men. Thus, we expect differences in how women and men participate politically. Sometimes, we expect women to participate more than men: private/individual and less institutionalized forms (e.g., signing petitions, boycotting). In other cases, we expect men to participate more than women: public and institutionalized forms (e.g., political contact, demonstrating, working for a party). Controlling for underlying inequalities in women’s and men’s socio-economic and political resources may help explain such gaps. However, these may also matter differently for women and men in shaping how and how much they participate. We also considered evidence for changes in political participation gender gaps over time. Despite, on the one hand, the growth in structural gender equality in Europe and, on the other hand, a recent trend in politics to include more conservative, authoritarian, and gender-traditional views, there is no strong evidence that gaps have changed markedly.
Finally, comparative variation across Europe is important and demands a close investigation of where and how gendered participation varies comparatively. We expect to see differences in women’s and men’s political participation across nations descriptively, and prior research suggests such differences may reflect the varying contexts of gender inequality in each nation. Gender equality supports women’s political participation overall (Alexander et al. Reference Alexander and Jalalzai2018; Alexander and Welzel Reference Alexander and Welzel2011, Reference Alexander and Welzel2015), and we anticipate that women’s participation relative to men’s will be significantly higher in nations where women have greater political, economic, and social empowerment.
3 Data and Measurements
3.1 Data
Our analysis uses data from twenty-six European democracies across ten waves of the European Social Survey (ESS) (Appendix Table A1 lists all countries and years).Footnote 3 The data are collected every two years and range from 2002 to 2020. The ESS is the only cross-national dataset with a large sample of European democracies and sufficient variation in the types of participation measured. This high-quality, academically driven survey has been conducted across Europe since its establishment in 2001 and is organized bi-annually. It goes through rigorous tests for translatability and reliability and is every two years conducted through face-to-face interviews with newly selected, cross-sectional sample.
3.2 Variables
3.2.1 Dependent Variables: Political Participation
Eight different modes of political participation are examined, which span the most institutionalized form of participation, voting, and a variety of more and less individual and/or resource-intensive styles of participation.
Respondents were asked (yes/no) whether they had participated in the following activities:
▪ Vote: Some people don’t vote nowadays for one reason or another. Did you vote in the last [country] national election in [month/year]?
There are different ways of trying to improve things in [country] or help prevent things from going wrong. During the last twelve months, have you done any of the following? Have you …
▪ Contact: contacted a politician, government or local government official?
▪ Petition: signed a petition?
▪ Boycott: boycotted certain products?
▪ Demonstrate: taken part in a public demonstration?
▪ Display: worn or displayed a campaign badge/sticker?
▪ Work Party: worked in a political party or action group? (2002–2018)
▪ Post: posted or shared anything about politics online, for example on blogs, via email or on social media such as Facebook or Twitter? (2016–2020)
An advantage of examining disaggregated forms of participation is allowing any gender differences we find to be emergent from the data rather than creating predetermined typologies of participation (Reingold and Swers Reference Reingold and Swers2011).
3.2.2 Independent Variables
Our main variable of interest, gender, is a dichotomous variable distinguishing (1) women and (0) men.Footnote 4 In our multivariate analyses, we control for a set of socio-demographic and economic variables known to influence political participation and gender differences therein: age cohort, partner, children, education, occupation, working mother, church attendance, rural/urban living, citizenship, minority ethnic background. We also include two political attitudes: political interest and political trust. We present descriptive information, broken down by gender, for all independent variables included in our analyses in Section 5 in our examination of how these resources explain gender gaps in participation (Table 3).
At the contextual level, we measure political, economic, and social gender inequality, relying on data from the Gender Inequality Index (GII) for the United Nations Human Development Report (Gaye et al. Reference Gaye, Klugman, Kovacevic, Twigg and Zambrano2010). In addition to testing the overall GII, which is an aggregate measure of gender inequality, we also test the component measure separately. These include political gender inequality is measured by the percentage of seats held by women in the respective national parliament; economic gender inequality measured by the percentage of women in the labor force; socio-economic inequality measured by the percentage of women with some secondary education, and social gender inequality is measured by maternal mortality ratio and adolescent birth rate among women. Descriptive statistics for these variables are available in Section 6 (Table 4).
3.3 Analytic Strategy
We present descriptive analyses (Section 4) detailing overall participation in various types of political participation and the associated gendered patterns therein. We also examine changes over time and cross-national differences in gender disparities. All descriptive statistics are based on weighted data from a weight provided by the European Social Survey.
We then proceed to multivariate logit regression analyses (Section 5) to investigate the extent to which individual socio-demographic and economic variables, along with political attitudes, explain gender differences across different types of participation. All models use the survey-provided weights, robust standard errors clustered by country, country fixed-effects, and controls for change over time. Models were tested with a linear and year-fixed effect approach, which produced similar results, and a linear control is used in the final models. We test all explanatory variables for interactions with gender to determine whether effects vary for women and men. When significant, these are extrapolated into graphs of their marginal predicted probabilities across the values of interest.
In a final set of analyses (Section 6), we address cross-national differences in the gender gap. Through multilevel logit analyses utilizing cross-level interactions, we investigate to what extent and how political, economic, and social gender equality at the societal level affect gender differences in political participation. Models using cross-level interactions with gender always allow the slope of the gender effect to vary across country-year.
4 Winds of Change, Patterns of Difference
In this section, we investigate the descriptive patterns in our data. This illustrates how much European citizens are overall participating in the different types of political activities and how this has changed over time. We also show what basic gender differences emerge, and whether these gender differences are changing over time. Comparative maps showing the variation in gender differences across different types of participation in Europe provide initial evidence of the importance of cross-national differences, reinforcing the value of further investigating multilevel models.
4.1 Descriptive Patterns of (Gendered) Participation
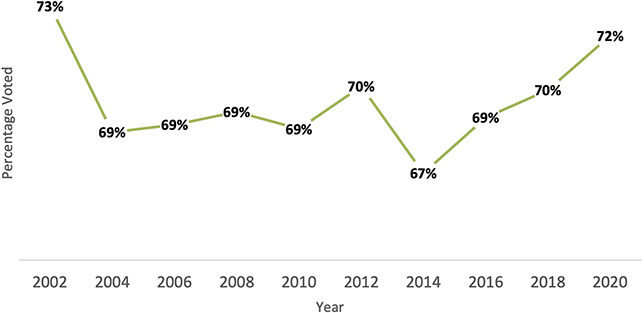
Starting with an overview of overall rates of political participation, voting stands apart from other forms of participation. As commonly found in voting research, most respondents claim they voted, as shown in Figure 1. Voting rates tend to be overstated (see, e.g., McAllister and Quinlan Reference McAllister and Quinlan2022), but have remained relatively stable, consistently around an average of about 70 percent.
Percent of respondents who reported voting in the last national election
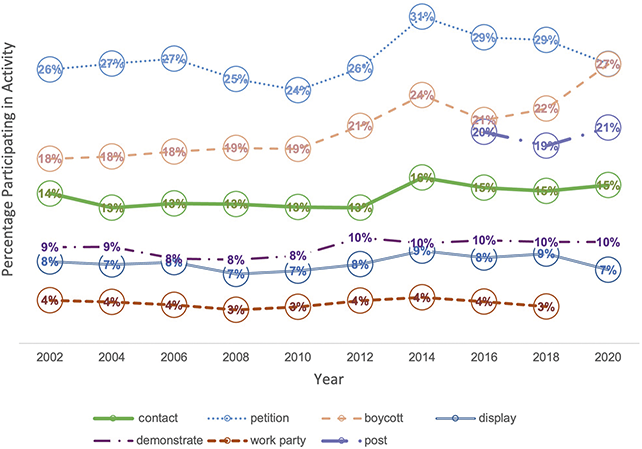
Conversely, most respondents do not report engaging in nonvoting participation methods, as illustrated in Figure 2. The most popular activity is signing petitions, followed by boycotting goods. More recently, the ESS started measuring online posting, the third most popular activity. There has been a consistent trend with roughly 15 percent of respondents contacting politicians, but only seven to 10 percent report demonstrating or displaying campaign material. By far, the least common activity is working for a political party. Similarly to voting, patterns of participation are largely stable over time. However, there is evidence that boycotting products has become more popular in recent years, as well as signing petitions. In the base model, both show a significant increase in participation over the time period (see Appendix Table A2). However, the significant increase in signing petitions disappears in full models, but the positive trend toward boycotting products remains.
Percent of respondents who reported participating in a variety of non-voting activities
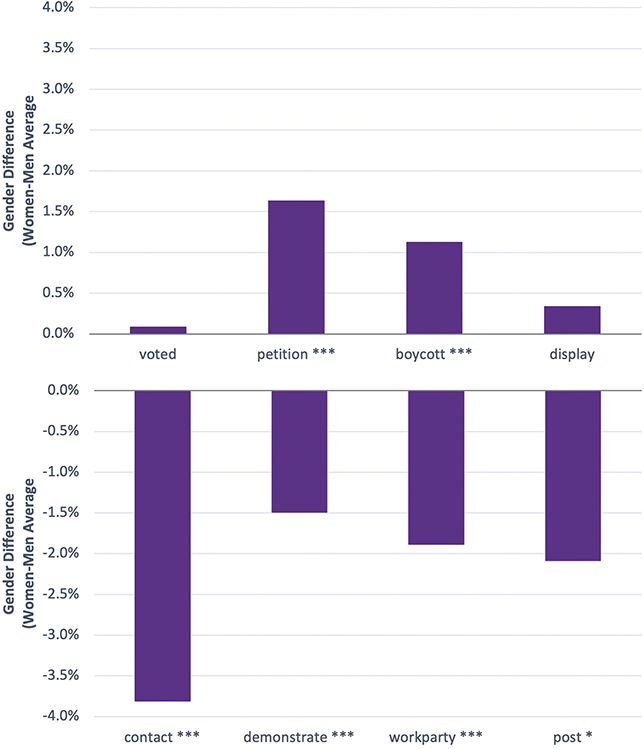
Given what we know from previous research, we expect women and men to engage in various types of participation at different rates. Looking at the average gender gaps in Figure 3 (combining all waves), we can see that the size and direction of these gaps differ between the types of participation. The top panel shows average gaps for all modes that favor women’s participation, and the bottom panel shows average gaps for all modes that favor men’s participation. The numbers are based on subtracting men’s average from women’s average. A score above zero (0) thus indicates greater participation of women than men; a negative score suggests greater participation of men than women. Women and men generally vote and display campaign material at similar rates. Men are more likely to contact politicians, but women are more likely to petition and boycott products. Men, more than women, demonstrate, work for parties, and post politically online. When tested in regression models, we found that all the gender gaps were statistically significant (p < 0.05), except for voting and displaying campaign material.
Average gender differences in participation: Women’s average minus men’s average. A score above zero (0) thus indicates greater participation of women than men; a negative score suggests greater participation of men than women. (*p < 0.05; **p < 0.01; p < 0.001, two-tailed tests; weighted data)
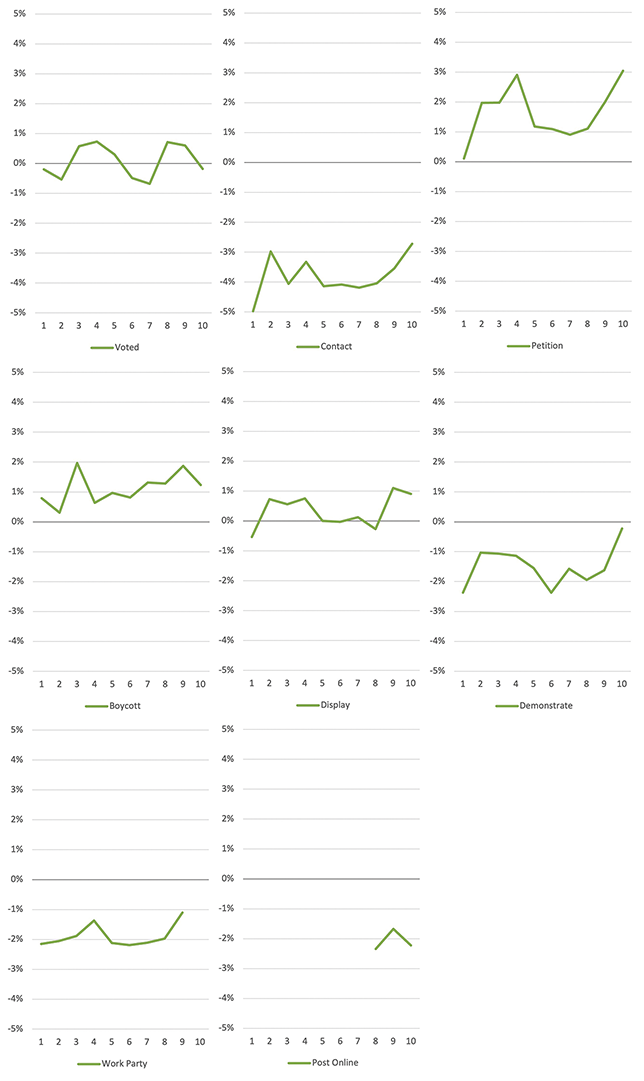
Finally, a key question that remained unanswered based on previous research is the extent to which gender gaps in different types of participation have changed over time. The movement toward greater gender equality (Inglehart and Norris Reference Inglehart and Norris2003) would suggest these gaps should be shrinking. However, we see no evidence for this. Gender gaps in political participation have remained relatively stable over time (Figure 4). This stability is confirmed by analyses that include only gender, ESS round, and an interaction between both. The gender interactions are not significant, showing stability over time in the pooled gender gaps (see Appendix Table A2).
Variation in gender differences in political participation over time. The numbers on the x-axis refer to the survey year, from 1 (2002) to 10 (2020).
4.2 Cross-National Variation in Gendered Participation
We now turn to considering variation across the countries in our sample. European countries form a diverse group, varying widely in political, economic, and social gender equality. Nordic nations are generally recognized as having made the greatest progress toward gender equality, and Southern, Central, and Eastern European nations are seen as lagging behind. Related to political gender equality, for example, in 2020, women in Nordic nations were 44 percent of elected representatives, but only 30 percent in Southern Europe and 24 percent in Central and Eastern Europe (International Parliamentary Union) (data.ipu.org).
To get a first impression of the cross-national variation in women’s and men’s participation across nations, Figures 5–8 present maps of the gender gaps in all types of participation. The darker the shade, the more women participate compared with men; the lighter the shade, the more men participate compared with women. In each map, the gender gap-range is kept consistent for comparison, ranging from a high of women doing that activity on average 10 percent more than men to a low of women doing that activity 10 percent less than men.
Maps of Europe illustrating gender gaps in voting and contacting politicians on a standardized range from –10 to 10, where higher values indicate higher levels of women’s participation relative to men’s.
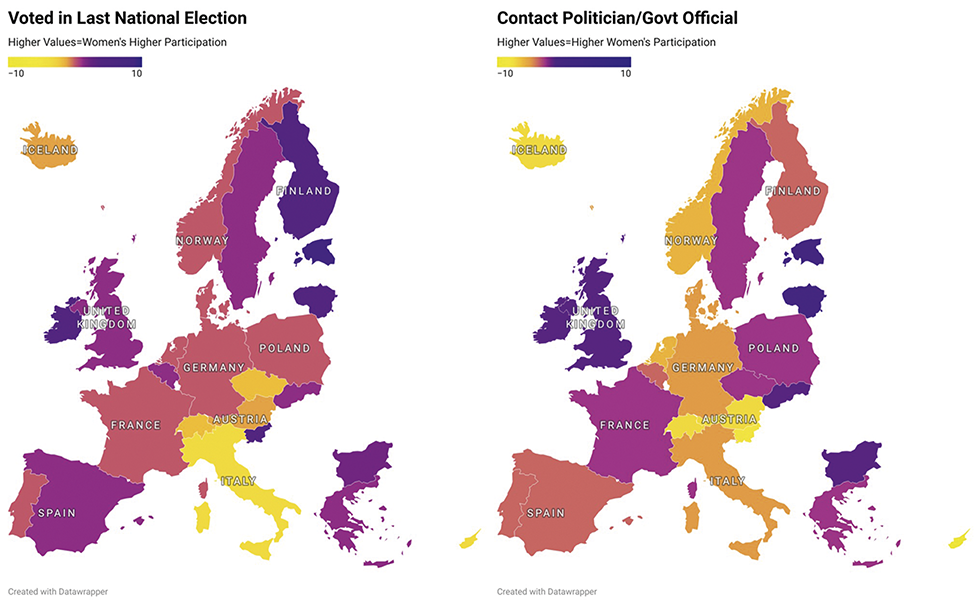
In Figure 5, the left map for gender gaps in voting illustrates that in most nations, women and men vote at very similar rates or that women vote more than men. Notably, women vote significantly more than men in in Estonia (9 %). In contrast, the gap is negative in Italy and Cyprus, indicating that women’s turnout is slightly lower than men’s (by 3 % points). The propensity by gender to contact a political official (right map in Figure 5) is quite different. Women consistently do this activity less than men. This gap is especially pronounced in Southern Europe, where Cypriot men do this 10 percent more than women, and Slovenian, Swiss, and Austrian men 7 to 8 percent more than women.
The left map of Figure 6 indicates that women consistently sign petitions more than men in most nations. The gender difference is most pronounced in the Nordic nations – for example, in Finland and Sweden, women petition at 9 and 8 percentage points higher than men, respectively. While the gap favors men in some countries, it is never strongly reversed. Slovakia stands out as the country where men are most likely to sign a petition compared with women, with men petitioning about 3 percent more than women. The map of boycotting products (right map in Figure 6) shows that women participate in this activity more than men or that gender gaps are minimal. Swiss and Swedish women have higher rates relative to men (6–8%), while Cypriot men are an exception, being 3 percent more likely to boycott than women.
Maps of Europe illustrating gender gaps in signing petitions and boycotting products on a standardized range from −10 to 10, where higher values indicate higher levels of women’s participation relative to men’s.

The map for displaying campaign materials (Figure 7 left map) shows a wide cross-national variation in gender differences. This activity is particularly popular among Northern European women, who do this on average 8 to 10 percent more than men. Conversely, men in Austria and Cyprus tend to do this about 3 percent more than women. Gender gaps in demonstrating (Figure 7 right map) are consistently small, though they tend to favor men’s greater participation, around 1 to 3 percent. The highest gap is in Italy, where men demonstrate about 4 percent more than women. Iceland is an anomaly, with women demonstrating 4 percent more than men.Footnote 5
Maps of Europe illustrating gender gaps in wearing or displaying campaign materials and demonstrating on a standardized range from –10 to 10, where higher values indicate higher levels of women’s participation relative to men’s.

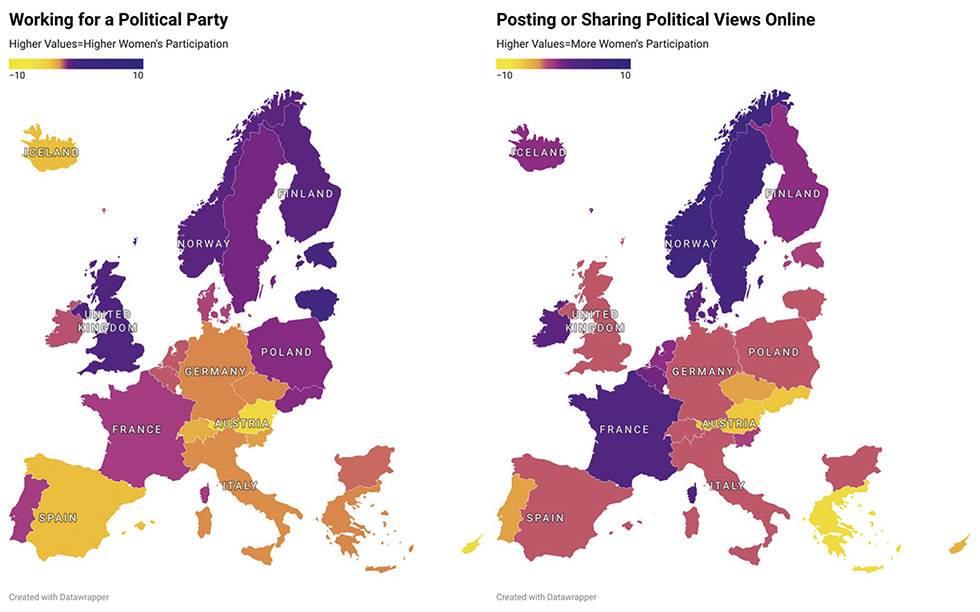
Figure 8 (left map) illustrates the low variation in gender gaps around working for a party . It is a highly unpopular form of participation, and women do not engage in this activity more than men in any country. Many nations hover around a men’s advantage of 1 to 2 percent. Exceptions are Austria and Cypress, where men do this about 5 percent more than women. Posting online (right map in Figure 8) shows more significant gender variation across countries. In some Nordic nations and France, women do more of this activity, but in many nations, men dominate this form of participation. In Austria, Cyprus, Greece, and Slovakia, for example, men post online 5 to 6 percent more than women.
Maps of Europe illustrating gender gaps in working for a party and posting online on a standardized range from –10 to 10, where higher values indicate higher levels of women’s participation relative to men’s.
Gender gaps vary the most regarding displaying campaign material, with men generally engaging more in this type of participation than women. The next largest gaps are shown for posting online and signing a petition. In almost all nations, men post more online than women, while women tend to be more likely to sign a petition than men.
4.3 Section Summary
Table 1 summarizes the key findings from the section, highlighting general participation levels, gender differences, and cross-national patterns across the eight forms of political activity. On a positive note, most respondents report voting in the last election. High voting rates, a necessary but insufficient indicator of a thriving democracy, are unfortunately not matched but similarly high rates of other types of participation. The most popular activity is signing petitions, followed by boycotting goods. Both are the easiest to incorporate in day-to-day life and the least resource-demanding. The most resource-demanding activities, working for a party and attending a demonstration, are among the least popular. Further, although few respondents display or wear campaign material, posting politically only has become relatively popular and is highly accessible to the vast majority of respondents.
| Type of participation | Average participation | Time trend | Gender gap | Cross-national variation |
|---|---|---|---|---|
| Vote | High (70%) | Stable | No significant gap | In most nations, women and men vote at similar rates. |
| Contact | Low (14%) | Stable | Men > Women | Men dominate in all countries, and especially in Southern Europe. |
| Petition | Moderate (27%) | Increase | Women > Men | Women dominate in most nations, and especially in Nordic countries. |
| Boycott | Moderate (21%) | Increase | Women > Men | Women dominate in most countries. |
| Display | Low (8%) | Stable | No significant gap | Wide variation. Women dominate in Northern Europe; men in Austria, Cyprus. |
| Demonstrate | Low (9%) | Stable | Men > Women | Small gaps, with men dominating, in most countries. |
| Work party | Very low (4%) | Stable | Men > Women | Men dominate in all countries. |
| Post online | Moderate (20%) | Stable | Men > Women | Wide variation. Men dominate in most countries, but women lead in some Nordic countries and France |
The patterns for the gender gaps in participation echo findings from previous work (Coffé and Bolzendahl Reference Bolzendahl2010, Reference Coffé and Bolzendahl2021). Women are more likely to participate in the least resource-intensive and/or collective activity styles. Notably, the two most popular forms of nonvoting activism are signing petitions and boycotting products – activities women are much more likely to engage in. In contrast, men dominate in contacting politicians, demonstrating, working for a party, and posting online. It is also notable that the two activities men engage in most – contacting and posting – can be interpreted as more confrontational, aligning with findings that men are more comfortable with political conflict than women (Coffé and Bolzendahl Reference Coffé and Bolzendahl2017).
Cross-nationally, our maps highlight a few important points. First, they reiterate visually that gender gaps in some forms of participation are small but consistently favor women’s or men’s greater participation despite cross-national variation. Second, some anticipated regional patterns are reflected, including women’s greater participation in Nordic nations and lower participation in Southern or Central-Eastern nations. Third, not all types of participation are the same; gendered country patterns are variable enough to indicate the value of controlling for country fixed-effects in pooled regression models and better measuring country-level contextual effects in multilevel models.
5 Explaining Individual-Level Gendered Political Participation
Having described gendered patterns in political participation, we now move on to explain these patterns. In Section 2, we reviewed the strong theoretical and empirical basis for investigating gender gaps in political participation, considering differences in socio-economic, socio-demographic, and political resources. Our investigation allows us to competitively test three aspects of the gender gap in the form of political participation. First, if the types of gender gaps we see in Section 4 through descriptive patterns are primarily due to differences in these resources, controlling for those differences should illuminate what, if any, patterns of participation can be assessed as accruing independently to robust gaps in gendered participation. Second, we can examine how some resources may differentially shape women’s and men’s participation. Given the relatively limited change over time in gendered patterns in political participation (see Section 4.1), we will not focus on these changes in the multivariate analyses presented in the following. However, we take the longitudinal aspect of the data into account in our analysis.
5.1 Resources Matter
To this point, bivariate pooled patterns indicate women are as likely or a bit more likely than men to engage in private, individual, low-conflict, and low-resource forms of participation: signing petitions, boycotting, displaying campaign material, and voting. Men, however, are much more likely to contact politicians, demonstrate, work for a party, or post online than women. This reflects masculine norms around being a public figure, taking subject-centered roles, and taking risks. Regression models that control for some of the differences in socio-demographic, economic, and political resources that accrue to women and men may explain these differences. To understand why and how gender differences in resources may matter, we present descriptive statistics for all control variables in Table 2. This table shows that women and men vary significantly in many cases, as represented by the results of bivariate significance testsFootnote 6 in the right-hand column.
All statistics in Table 2 derive from weighted data and thus more closely represent population averages; however, sampling variation is inevitable. In the case of age cohorts, men are somewhat more over-represented among the youngest ages and early middle-ages, but women are more prevalent than men in cohorts older than 60. Especially among older cohorts, this accurately represents that women live longer lives than men (see, e.g., Sanderson and Scherbov Reference Sanderson and Scherbov2016). Likely related to the gendered aging process, more men are partnered than women.
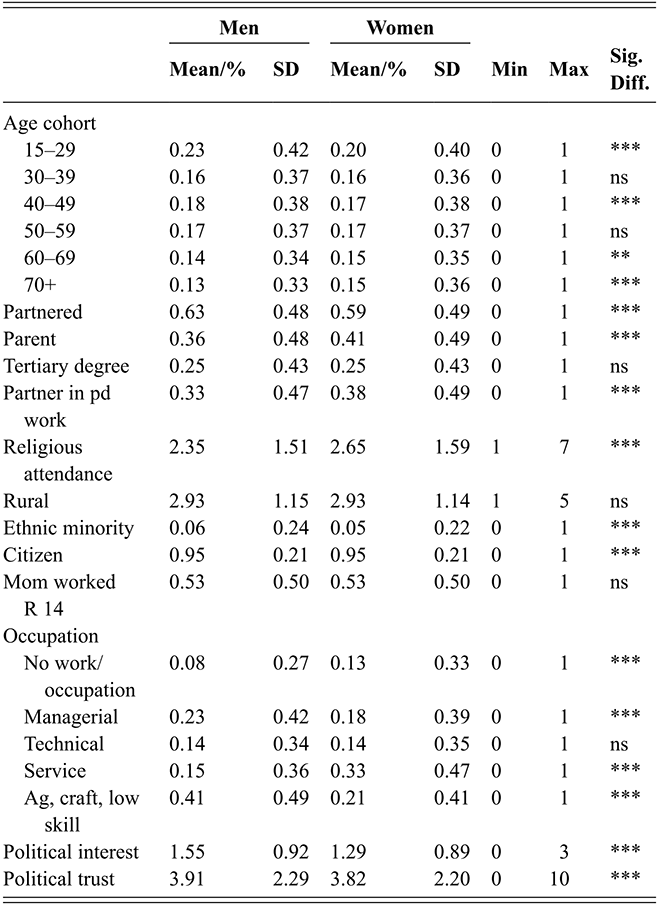
Table 2 Long description
Columns include Mean or Percentage, Standard Deviation (SD), Minimum, Maximum, and significance of gender differences. Below for each category and each level of that category we have from left to right: the variable and level of that variable being measured, the mean or proportion for men, with the standard deviation in parentheses, the mean or proportion for women, with the standard deviation in parentheses, the values of the minimum and maximum, and asterisks that indicate whether the gender differences are significant. We note that three asterisks mean that the p values of the comparison of gender differences are significant at p<0.001, two asterisks mean significant at p<0.01, ns = not significant. All tests are two-tailed tests and we use weighted data.
Age Cohort:
◦15–29: Men 0.23 (SD 0.42), Women 0.20 (SD 0.40), Min 0, Max 1, ***
◦30–39: Men 0.16 (0.37), Women 0.16 (0.36), ns
◦40–49: Men 0.18 (0.38), Women 0.17 (0.38), ***
◦50–59: Men 0.17 (0.37), Women 0.17 (0.37), ns
◦60–69: Men 0.14 (0.34), Women 0.15 (0.35), **
◦70+: Men 0.13 (0.33), Women 0.15 (0.36), ***
Partnered: Men 0.63 (0.48), Women 0.59 (0.49), ***
Parent: Men 0.36 (0.48), Women 0.41 (0.49), ***
Tertiary Degree: Men 0.25 (0.43), Women 0.25 (0.43), ns
Partner in Paid Work: Men 0.33 (0.47), Women 0.38 (0.49), ***
Religious Attendance: Men 2.35 (1.51), Women 2.65 (1.59), Min 1, Max 7, ***
Rural: Men 2.93 (1.15), Women 2.93 (1.14), Min 1, Max 5, ns
Ethnic Minority: Men 0.06 (0.24), Women 0.05 (0.22), ***
Citizen: Men 0.95 (0.21), Women 0.95 (0.21), ***
Mom Worked at Age 14:Men 0.53 (0.50), Women 0.53 (0.50), ns
Occupation:
No Work/Occupation: Men 0.08 (0.27), Women 0.13 (0.33), ***
Managerial: Men 0.23 (0.42), Women 0.18 (0.39), ***
Technical: Men 0.14 (0.34), Women 0.14 (0.35), ns
Service: Men 0.15 (0.36), Women 0.33 (0.47), ***
Agricultural/Craft/Low Skill: Men 0.41 (0.49), Women 0.21 (0.41), ***
Political Measures:
Political Interest: Men 1.55 (0.92), Women 1.29 (0.89), Min 0, Max 3, ***
Political Trust: Men 3.91 (2.29), Women 3.82 (2.20), Min 0, Max 10, ***
Notes: **p < 0.01 ***p < 0.001 ns = not significant; two-tailed tests; weighted data
Women are more likely to have children at home, reflecting their greater likelihood of being single parents. There are no gender gaps in holding a tertiary education degree; women are more likely to have a partner in the paid labor force and attend religious services more than men. Women and men do not differ in their residence’s urban/rural nature. Men are more likely to have a minority ethnic background than women,Footnote 7 but there are no gender differences in citizenship status. Men are more likely to work than women, and they are more likely to be in the highest (managerial) and lowest (agricultural, craft, low skill) occupational categories. Women are more likely to be in service-oriented occupations (which also often involve more emotional labor), but there are no gender differences in the technical occupation category.
Turning to political resources, men express significantly higher levels of political interest and trust than women. As previous research has established, both political resources are strongly related to political participation (see e.g., Coffé and Bolzendahl Reference Bolzendahl2010; Coffé Reference Coffé2013; Fraile and Gomez Reference Fraile and Gomez2017; Fraile and Moyer 2020; Ferrín et al. Reference Ferrín, Fraile, García-Albacete and Gómez2020).
Having shown gender differences in resources known to relate to political participation, below (Figures 9–12) we present predicted probabilities of participating in all forms of political participation based on three models. These probabilities represent the likelihood that women and men would do this activity, with all other variables in a given model held at their mean. All models control for country-fixed effects, survey round (linear), and include a survey-provided weighting factor and robust standard errors clustered by country. The first probabilities show the base level difference in women’s and men’s participation with no controls (“base”); second, we control for all socio-economic and demographic traits (“demographic”); and third, we add political interest and political trust (“political”). The full regression models are presented in Appendix Tables A3–A10.
Predicted probabilities of voting and contacting a political official for men and women from binary logit regression analyses across base, demographic, and political models (*p < 0.05; ***p < 0.001; two-tailed tests)

In the model explaining voting (see Figure 9 (left hand graph), the gender difference is insignificant in the base model. Both men and women have a predicted probability of 70 percent of having voted in the last national election. However, the gap grows when we control for economic and demographic resources and we find that men are slightly but statistically significantly more likely to vote in the demographic model. In this case, models show that older cohorts are significantly more likely to vote than younger cohorts. Since women are over-represented among the oldest cohorts, controlling for age cohort reveals a small voting advantage for men. In demographic models, men have a 75 percent predicted probability of having voted in the last national election, as compared to 73 percent of women.
However, when we control for gender differences in political resources, a significant gender gap emerges such that women are statistically significantly, but substantively only marginally, more likely to vote than men (women 76%; men 75%). In other words, once we account for women’s lower political interest and trust, we see that women are more likely to vote than men. In all cases, the substantive gaps are not large, which may indicate a great deal of gender parity in voting and substantiate claims that the gender gap in voting, at least in national elections, has largely disappeared.
The story differs for political contact (right panel in Figure 9). Women are always significantly less likely to do this than men, and while controls for demographic and political resource differences shrink that gap, the gap remains statistically significant. This means that men are significantly more likely than women to contact political officials regardless of demographic and material resources and even political interest.
As shown in Figure 10 left hand graph, at a base level, women are statistically significantly more likely to sign a petition (about 2 percent more than men). Controlling for differences in demographic and material resources, this gap shrinks slightly (1 percent) but remains statistically significant. However, once we consider political resources, the gender gap widens again, with women significantly more likely to sign petitions by about 4 percent. Women are also more likely to boycott products for political reasons (right panel of Figure 10), and this gap is statistically significant regardless of the model. Yet, when controlling for women’s lower political resources, it becomes clear that, at the same level of resources, women are nearly 3 percent more likely to boycott than men. In the base model, although statistically significant, women only have a 1 percent greater probability of boycotting.
Predicted probabilities of signing a petition and boycotting a product for men and women from binary logit regression models across base, demographic, and political models (**p < 0.01; ***p < 0.001; two-tailed tests)

In the base and demographic models, the probability of wearing or displaying campaign materials (Figure 11 left hand graph) does not vary by gender. However, a significant gap emerges when controlling for political resources, with women being a bit over 1 percent more likely to wear or display campaign materials than men. Such change is notable given the overall very low likelihood of any participation in this activity. The story flips for demonstrating (right panel in Figure 11). Men are approximately 1 percent more likely to do this in base and demographic models. Yet, if women had levels of political interest and trust similar to men, the gender gap in the likelihood of demonstrating would disappear. More specifically, political interest is positively linked to demonstrating, meaning women’s lower political interest dampens their likelihood of demonstrating. Political trust is negatively linked to demonstrating. Since women have lower political trust, accounting for this also reduces the gender gap in demonstrating.
Predicted probabilities of displaying campaign material and demonstrating for men and women from binary logit regression models across base, demographic and political models (***p < 0.001; two-tailed tests)

Interpreting the findings from Figure 12 left hand graph, models show that men are always significantly more likely to have worked for a political party or organization, with about a 2 percent higher probability in the base and demographic models. Though men remain statistically significantly more likely to work for a political party or organization even when controlling for political resources, the gap shrinks to slightly more than half a percentage point. Given the very low probability that anyone engages in this activity, it is substantial to see that men are doing this institutional activity so much more than women. Finally, men are more likely to post their political thoughts online than women (right panel of Figure 12) and do so regardless of demographic characteristics. However, when controlling for political resources, the gender difference is no longer statistically significant, gender gaps in probabilities of posting shrink noticeably. Political interest and trust influence online posting similarly to their impact on demonstrating, so controlling for these differences largely explain the gender gap in posting online.
Predicted probabilities of working for a party or posting online for men and women from binary logit regression models across base, demographic, and political models (*p < 0.05; ***p < 0.001; two-tailed tests)
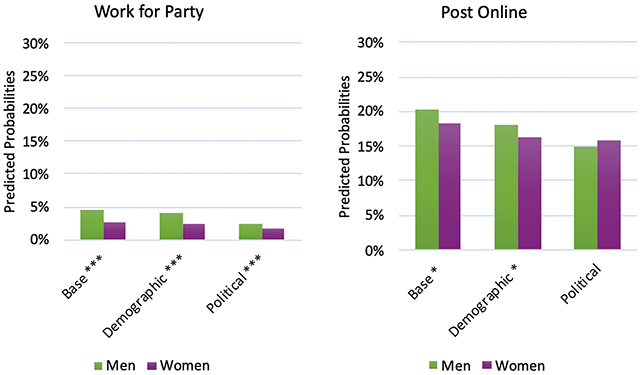
A few conclusions emerge from these findings. First, socio-economic and socio-demographic controls rarely explain or change our understanding of descriptive, bivariate gender gaps in political participation. In part, this may be a function of a sample focusing on European democracies, where, in general, women hold comparatively strong economic rights and social protection. Various socio-economic resources and socio-demographic characteristics are significantly linked to participation, but for the most part, these do not seem to be the primary driver of any gender difference in political participation. Second, political resources are strongly tied to participation and gender differences therein. Women hold significantly lower levels of political interest, which is often a major explanatory factor in understanding why women do not participate more or revealing that they are even stronger participants than we may give them credit for. For example, if women had the same levels of political interest, they would demonstrate and post online as much as men. Further, accounting for women’s lower political interest, women are significantly more likely than men to vote and display campaign material. Finally, women are significantly more likely to engage in boycotting and petitioning, and this disparity would be even greater if they possessed the same levels of political interest as men.
5.2 Explaining Patterns of (Gendered) Participation: Different Effects of Resources
In this section, we examine how the effects of resources differ by gender. More specifically, by interacting each independent variable with gender, we can evaluate whether some resources matter differently for women and men in explaining engagement in various types of political participation. Specifically, we want to identify whether some socio-demographic and economic characteristics and political resources are consistently and substantively meaningful for gendered participation.
Next, we review the major findings by resource type. Note that in the figures, significant interactions are illustrated differently depending on whether the independent variable is categorical or continuous. For categorical variables, significant interactions are marked with asterisks in the label of that category. For example, in Figure 13, being a manager or in a technical occupation (as opposed to a service job) increases men’s political contact behavior significantly more than women’s. This gender difference is not observed in any other occupational category. When the interaction is with a linear independent variable, the significance of the gender gap may vary across levels of the variable. In this case, the easiest way to denote that is through confidence intervals. For example, in Figure 19, in the youngest age groups, women are significantly more likely than to sign petitions, but this gender gap disappears above age 60, as seen by the overlapping confidence intervals. An overview of the significance of all interactions can be found in Appendix Tables A11–A14.
Predicted probabilities for the gendered effect of occupation on contacting a political official (* p < 0.05; ***p < 0.001; two-tailed tests; service=reference)
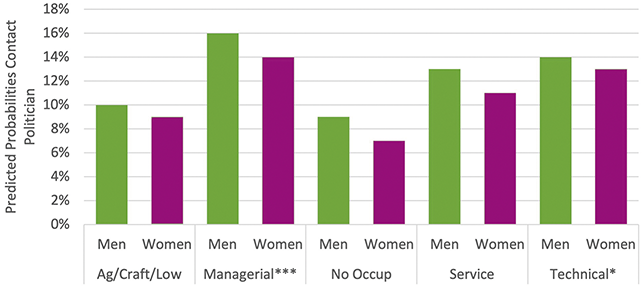
Gendered occupational segregation and women’s lower levels of employment are well-known in the research. As seen in Table 2, men are more likely to be in professional and managerial occupations and agriculture, craft, and low-skill occupations than women. In contrast, women are more likely to be in service-oriented jobs and less likely to be employed or have an occupation. In some cases, these occupational differences matter differently for women’s and men’s political participation. In the case of voting, those without an occupation (not working) vote less than those with an occupation, but this effect is weaker among women than men. Namely, men with no occupation have a 49% probability of voting, while women have a 57% probability. This likely reflects that being without an occupation is less stigmatizing for women than for men.
Occupation also matters in different ways for women and men when it comes to contacting a politician, petitioning, boycotting, displaying campaign material, demonstrating, and working for a party. Next, we detail additional findings in shifting probabilities of participation. All significance tests use service occupations as the reference category.
In general, men contact more than women, but, as can be seen in Figure 13, the gender gap is significantly weaker for those in managerial and technical occupations, shrinking down to only 2 percent, as compared with service occupations, where the gap is a bit larger. Overall, occupation seems to matter more for women’s likelihood to contact a politician than men’s.
The pattern is similar in Figure 14 for sharing or signing a petition. Women are more likely to engage in such activity than men, and this likelihood is even greater when women are in managerial or technical occupations.
Predicted probabilities for the gendered effect of occupation on sharing or signing a petition (* p < 0.05; ***p < 0.001 two-tailed tests; service=reference)
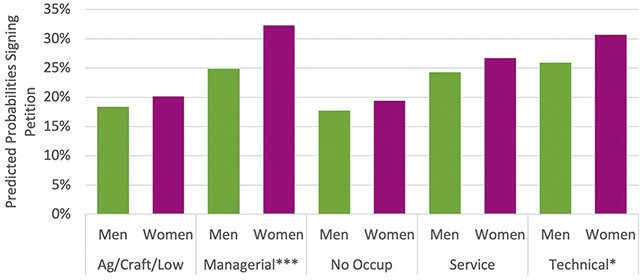
Looking at boycotting goods for political reasons in Figure 15, we see that, again, women’s tendency to engage in this activity is significantly greater when they are in managerial or technical occupations compared with other occupations. The gender gap is also largest among those in managerial positions and smallest among those in agricultural, craft, or low-skill occupations.
Predicted probabilities for the gendered effect of occupation on boycotting goods (** p < 0.01; ***p < 0.001 two-tailed tests; service=reference)
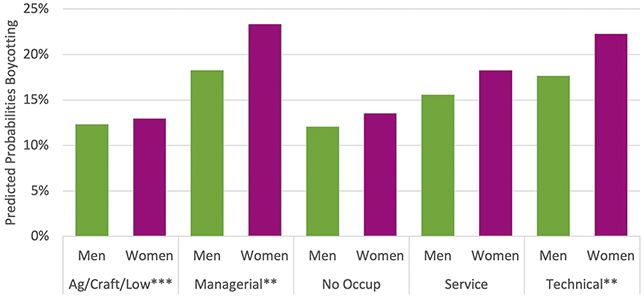
Overall, women display campaign materials more than men and, as seen in Figure 16, do so even more when they are in managerial and technical occupations. The gender gap is the largest among this occupational group.
Predicted probabilities for the gendered effect of occupation on displaying campaign materials (* p < 0.05; ***p < 0.001 two-tailed tests; service=reference)

Occupational categories tell us something interesting about gendered participation patterns in demonstrations (see Figure 17). In base and demographic models, men participate more in demonstrations than women, but that gap disappears once we control for political interest and trust. The gap reappears when we look at women outside of service occupations and agriculture/craft/low-skill occupations – with women participating more in demonstrations than men. Women are the most likely to be in service occupations, and men in those occupations are likelier to demonstrate than women. However, compared, women in managerial, technical, and no occupation are more likely than men to demonstrate.
Predicted probabilities for the gendered effect of occupation on participating in a demonstration (** p < 0.01; ***p < 0.001 two-tailed tests; service=reference)
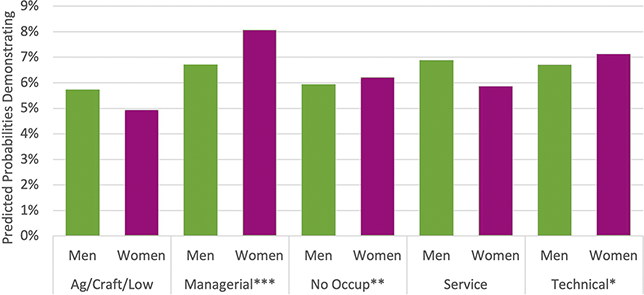
The probability of working for a party is low overall, and men’s greater likelihood of doing this activity is the same across occupations, with two exceptions where the gender gap is even greater. Men in technical and agriculture/craft/low-skill occupations have a significantly greater probability of doing this than women, relative to service occupations. Finally, there are no significant gender differences in the effect of occupation on posting politically online.
Altogether, these findings suggest important gendered class and economic cleavages. When women, regardless of their education, enter occupations associated with power or autonomy and higher salaries (e.g., managerial, professional, and technical occupations), it bolsters their involvement in many types of participation (petitions, boycotts). It significantly ameliorates or reverses the gender gap in others (contact, demonstrating).
As a socio-economic resource, a tertiary degree is significantly positively related to all forms of political participation. However, the effect of holding a tertiary degree tends to vary somewhat for women’s and men’s participation in contacting, petitioning, boycotting, displaying, and demonstrating (see Figure 18). In every case, holding a tertiary degree matters more for women than men. In our sample, women are not more likely than men to hold a tertiary degree, but our results suggest that when women do hold a tertiary education, they are more likely to rely on their degree to drive participation than men.
Predicted probabilities for the gendered effect of holding a tertiary degree on types of political participation
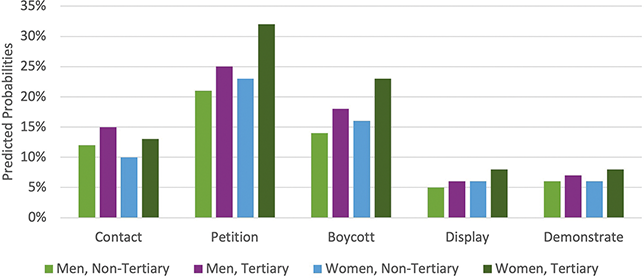
Age cohorts matter across all types of participation, but effects can be nonlinear and vary by form of participation. In Figure 19, we present predicted probabilities by age cohort. We present findings for all types of participation, given that each has some level of significant age cohort effect. The youngest group (age 15–29) was the reference category for all interaction effects. For voting, substantive differences are small, but regression analyses indicate that the gender gap is significantly larger for 40s, 50s, 60s age cohorts as compared with the youngest age cohort. In other words, women outvote men at middle age, which may explain why women are often found to vote more in general than men.
Predicted pobabilities gendered age cohort effects on types of political participation
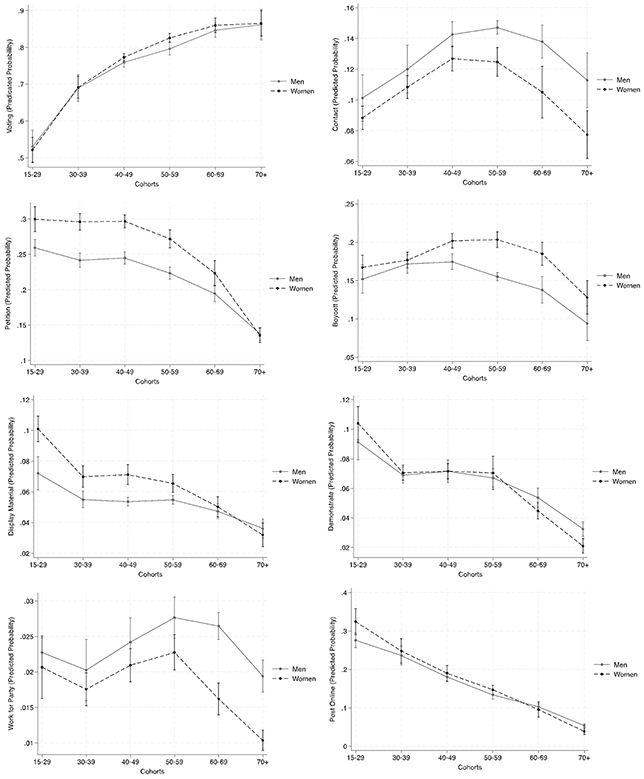
In contrast, men’s greater engagement in contact forms of participation was the largest among the oldest age cohorts (50+) and small or nonexistent among those aged 15–49. If this is a cohort effect, we may expect this gender gap to disappear in the future. However, if it is aging, we would expect young women to significantly reduce their contacting participation relative to men as they age.
Women’s greater likelihood of signing petitions is significantly larger than men’s at all stages except 60+, and the gap is particularly large in early middle age (30–49). By comparison, women are more likely to boycott than men, and this gender difference emerges more strongly among middle-to-early older ages (40–69). Gaps among the youngest and oldest are insignificant.
To the extent that women are more likely to display campaign material, this is mainly among the youngest cohorts, being largest for 15–29 year olds. Though women and men do not differ in the likelihood of demonstrating, interaction effects show they have a different age cohort trajectory. Women start with higher probabilities of demonstrating than men in younger cohorts and lower than men in the oldest cohorts. Consequently, although there are more women in the oldest cohort, men in that age cohort are significantly more likely to demonstrate.
Similarly to contacting, men’s greater likelihood of working for a party is confined to the oldest cohorts. There is no significant gender gap among those 15–59, but the gap is very large for those 60+. Again, the future of the gender gap in this measure may depend on whether there are aging or cohort effects driving participation. Finally, full models (Appendix Table A10) indicate no gender gap in posting online, but models including gender and age-cohort interactions show that the age cohort trajectory is somewhat different for women and men. Women are significantly more likely to post than men at the youngest ages, and this gap disappears in middle age, only to reemerge among the oldest age cohorts, with men significantly more likely than women to post. If young women continue to post at high rates as they age, the gap will remain insignificant or could favor women.
Having a partner (Figure 20) and being a parent (Figure 21) have gendered relationships to participation. We divide voting probabilities by four to make them easier to interpret in the figures. Women with a partner are more likely to vote and boycott than men with a partner. However, for women, having a partner tends to depress their participation in activities such as displaying campaign material, demonstrating, working for a party, or posting online. This is especially notable for posting. Having a partner does not affect men’s probability of posting about politics online, but for women, it decreases their posting probability by 2 percent.
Predicted probabilities for the gendered effect of having a partner

Predicted probabilities for the gendered effect of being a parent

Having at least one child at home shows gendered participation in a few activities. In Figure 21, women parents have a significantly (if not substantively) greater likelihood of voting than women nonparents. In contrast, there is no significant difference in the likelihood of voting between men with and without children. Being a parent has a stronger positive effect on men’s (already greater) contact behavior than on women’s and a stronger positive effect on women’s (already greater) petitioning behavior than on men’s.
Religious attendance (Figure 22) has often been linked to greater political participation but with gendered effects (Coffé and Bolzendahl Reference Bolzendahl2010; Friesen and Djupe Reference Friesen and Djupe2017). Similarly, we find that greater religious service attendance is positively related to voting, contacting, and working for a party. However, it is negatively related to posting online. Our results also reveal that the effect of religious attendance varies by gender in four types of participation, all of which show a more positive effect of religious attendance on men’s participation compared with women’s.
Predicted probabilities for the gendered effect of religious service attendance on types of political participation

We identify some gender-specific patterns based on whether a respondent belongs to a minority ethnic group in their country (Figure 22). As the group of ethnic minorities is small, with only 6 percent of the total sample, these results should be interpreted with caution. In full models, belonging to a minority ethnic group is significantly negatively related to voting and signing petitions but positively associated with demonstrating, working for a party, and posting online. As seen in Figure 23, there are statistically significant, but substantively small, differences in how minority ethnic group membership matters for women and men for five different types of political participation. First, for contacting, the gap between minority/nonminority group members among women is significantly larger than it is among men. Although there is not a significant main effect, women in minority groups “out-contact” their nonminority counterparts. The effect of minority group membership varies by gender in boycotting. For men, being a minority slightly increases the probability of boycotting, but for women, it slightly decreases the probability. There is no difference by minority/nonminority membership among women in displaying campaign material, but men who are members of a minority group are much more likely than nonminority men to display campaign material. Finally, the positive effect of being an ethnic minority group member on working for a party is slightly greater among women than among men.
Predicted probabilities for the gendered effect of ethnic minority group on types of political participation

Finally, regarding political resources, we saw strong evidence that these matter a great deal in understanding gender gaps in participation types. Political interest is always significantly and positively associated with political participation, but the strength of the effect varies by gender for four different types of political participation, as illustrated in Figure 24.
Predicted probabilities for the gendered effect of political interest on types of political participation

On the one hand, men are more likely to contact political officials, and the more politically interested they are, the more they do this, significantly more so than women. On the other hand, women petition and boycott more, and greater political interest further drives these behaviors, significantly more so than men. Finally, there is no gender gap in demonstrating, but higher levels of political interest tend to increase women’s participation in demonstrations a bit more than men’s. Consequently, though women’s probability of demonstrating is lower than men’s among those with no political interest, it is greater than men’s at the highest levels of political interest, explaining a significant interaction effect even if, substantively, the differences are not large.
Overall, political trust increases the propensity to vote and work for the party but is otherwise negatively linked to many types of participation (petitioning, boycotting, demonstrating, posting). Effects of political trust do not vary by gender except for contacting and boycotting. With higher levels of trust, women’s engagement in contacting political officials drops significantly while men’s remain stable. For boycotting, higher levels of political trust depress men’s likelihood of boycotting more than women’s.
5.3 Section Summary
Based on the patterns identified descriptively in Section 4, one might conclude that men are much more politically active than women. Of the eight types of participation we examine, men are significantly more likely to do four of these (contact, demonstrate, work for a party, and post politically online), but women are only more likely to do two: sign petitions and boycott goods for political reasons. There was no gender gap in voting or displaying campaign material. However, we explained in Section 2 that such patterns mask important gender inequalities in social, economic, and political resources. If women had the same access to such resources as men, what would we find? This section answers that question.
First, women participate more once gender differences in resources are taken into account. From pooled models controlling for a wide range of demographic, socio-economic, and political resources, we found that, on average, women petition, boycott, and display campaign material more than men. Men are still more likely than women, on average, to contact politicians and work for parties. The gender gap in voting tends to favor women in full models but any differences are substantively small, and there are no gender gaps in demonstrating and posting online. This suggests that women’s participation is often underestimated.
Second, resources often matter differently for women’s and men’s participation. Women’s participation is often accelerated when they have good jobs (managerial) and a good education (tertiary degree). Religiosity may benefit some democratic norms, but its effect is quite gendered. It depresses participation among women and boosts it for men. Younger cohorts of women are often significantly more likely to participate than their men counterparts. Political interest is significantly lower among women and often matters much more for women’s participation than men. However, many effects vary depending on the type of participation being examined. Interestingly, when a resource does matter much more for women or men, it tends to exacerbate (not undermine) the gendered patterns in participation from the main models. That is, when women have more resources, they are even more likely to petition, boycott, and display materials, and men are more likely to contact politicians and work for a party.
Table 3 summarizes the main findings related to gender gaps in various forms of political participation, including the baseline gender differences, the effects of demographic and political resource controls on these gaps, and significant gender interactions. For clarity of presentation, we restrict the section on gender interactions to listing those variables that show statistically significant interactions with gender, without detailing the direction or nature of these effects, which are presented in the figures above.
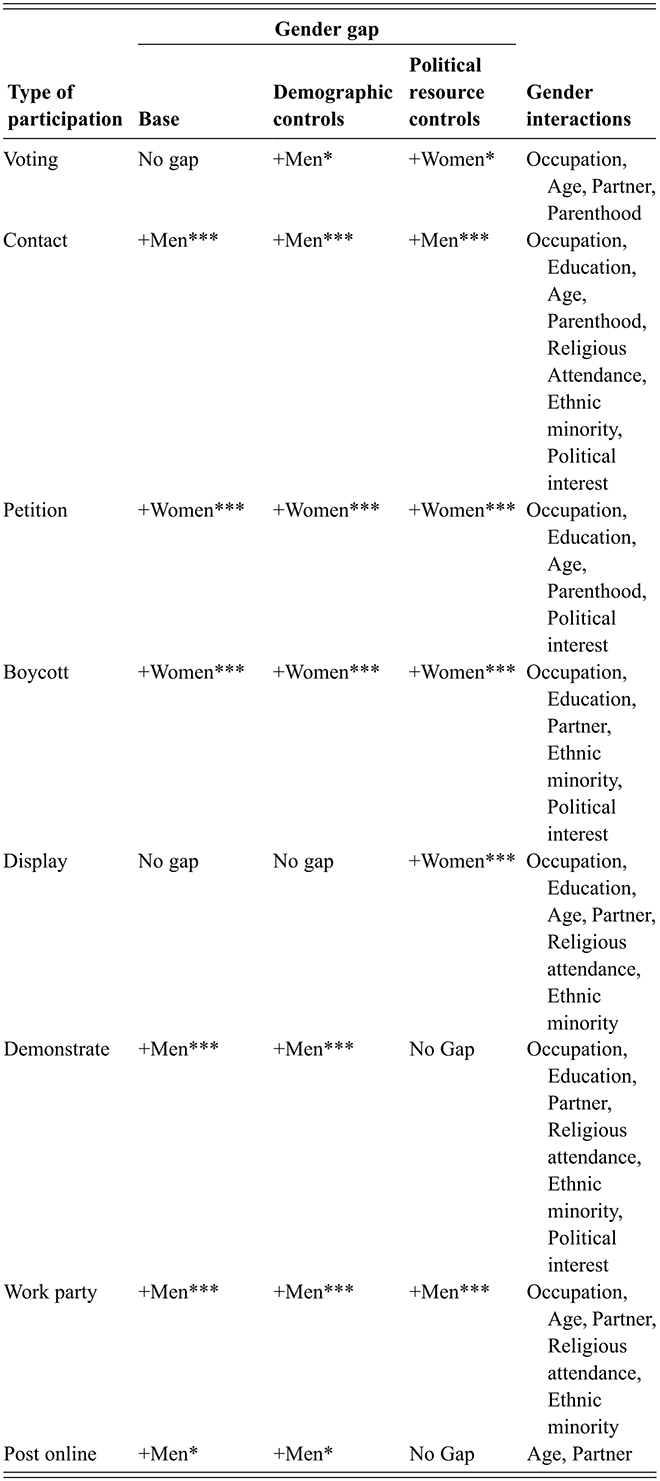
Table 3 Long description
The table has three main columns: Gender Gap (with base models, demographic control models, and political resource controls) and Gender Interactions (listing significant factors). Below for each type of participation, we detail gaps at the base level, gaps that emerge when we add demographic controls, and gaps when we add political resource controls. We also list which interactions between gender and our controls were significant. In describing significant effects, a + or a – indicates if the gender effect was positive or negative. For example “+ Men” means that men did that activity more than women. The number of asterisks refers to the significance level of the effect. One asterisk means that the p-value was less than 0.05, two asterisks mean significant at p<0.01, three asterisks mean that the p-values are significant at p<0.001. “No gap” means that gender differences were not significant in that model. All tests are two-tailed tests and we use weighted data.
Voting: No gap at base; +Men* with demographic controls; +Women* with political resource controls. Interactions include occupation, age, partner status, and parenthood.
Contact: +Men*** across all three models. Interactions include occupation, education, age, parenthood, religious attendance, ethnic minority status, and political interest.
Petition: Petition: +Women*** across all three models. Interactions include occupation, education, age, parenthood, and political interest.
Boycott: +Women*** across all three models. Interactions include occupation, education, partner status, ethnic minority status, and political interest.
Display: No gap at base or demographic controls; +Women*** with political resource controls. Interactions include occupation, education, age, partner status, religious attendance, and ethnic minority status.
Demonstrate: +Men*** at base and demographic controls; no gap with political resource controls. Interactions include occupation, education, partner status, religious attendance, ethnic minority status, and political interest.
Work Party: +Men*** across all three models. Interactions include occupation, age, partner status, religious attendance, and ethnic minority status.
Post Online: +Men* at base and demographic controls; no gap with political resource controls. Interactions include age and partner status.
Notes: * p < 0.05 ***p < 0.001 No Gap = not significant; +Women = more women’s than men’s participation; +Men = more men’s than women’s participation; two-tailed tests; weighted data
In sum, equalizing resources by gender may help shift some aggregate gender gaps toward women’s participation. Controlling for these shows that women display more campaign material than men and demonstrate and post online as much as men. However, other gendered participation patterns seem more intractable, with women much more heavily involved in informal activities such as petitioning and boycotting, and men in more formal or institutional activities such as contacting politicians and working for a party. Such patterns continue regardless of, and may be exacerbated by, access to resources.
6 Understanding Cross-National Differences in Gendered Political Participation
The maps in Section 4 highlighted the cross-national variation in gender differences in political participation. For example, our general finding is that women participate more than men on average in petitions or boycotts, but this is not the same in every nation. In the Nordic nations, on average, women do this much more than men, and in some southern European nations, men petition or boycott more than women. Thus, in concluding our overview of cross-national patterns, we stated that despite the consistency in the general patterns, some anticipated comparative patterns were evident. These included women’s greater participation in Nordic nations and lower participation in Southern or Central-Eastern nations. However, the variation in women’s and men’s participation across nations differs depending on the type of participation. The findings above control for country-fixed effects, but we now look specifically at measuring the context of gendered political, economic, and social empowerment across nation-years and how individual-level gendered patterns in participation may be shaped by these contextual empowerment measures.
6.1 Contextual Measures of Gender Inequality
As reviewed in Section 2 and with the data introduced in Section 3, we consider an aggregate measure of gender inequality but also measures across different domains since previous research suggests that women’s political and economic empowerment may be the main drivers of any contextual effects in our sample (Section 2.4). There are few sources of data available for all countries and all time points included in our study. The most complete and comprehensive is the Gender Inequality Index (GII) created by the United Nations (UN) for its Human Development Report (Gaye et al. Reference Gaye, Klugman, Kovacevic, Twigg and Zambrano2010).Footnote 8 As defined by the UN, the GII “reflects gender-based disadvantage in three dimensions – reproductive health, empowerment, and the labor market – …It shows the loss in potential human development due to inequality between female and male achievements in these dimensions.”
In Table 4, we show the descriptive statistics for all contextual measures of gender inequality across all countries and years. Each of these measures represents the two-year lagged value. We lag all country-level variables to better account for the non-simultaneity of these institutional factors (see, e.g., Beauregard Reference Beauregard2018).
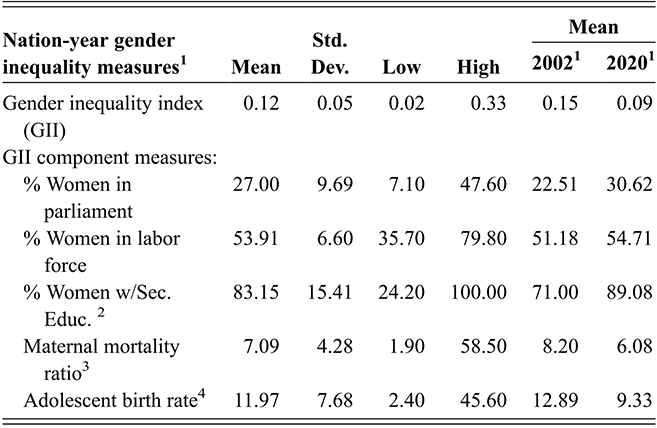
Table 4 Long description
Columns include Mean, Standard Deviation (Std. Dev.), Low, High, and mean values for 2002 and 2020. It compares gender inequality and empowerment indicators across countries over time, showing improvements in education and representation and declines in maternal mortality and adolescent birth rates between 2002 and 2020. All measures use two-year lagged values, and the data source is the United Nations Human Development Reports.
Gender Inequality Index (GII):Mean 0.12, Std. Dev. 0.05, range 0.02–0.33, 2002 mean 0.15, 2020 mean 0.09.
GII Component Measures:
◦% Women in Parliament: Mean 27.00%, Std. Dev. 9.69, range 7.10–47.60, 2002 mean 22.51%, 2020 mean 30.62%.
◦% Women in Labor Force: Mean 53.91%, Std. Dev. 6.60, range 35.70–79.80, 2002 mean 51.18%, 2020 mean 54.71%.
◦% Women with Secondary Education (age 25+): Mean 83.15%, Std. Dev. 15.41, range 24.20–100.00, 2002 mean 71.00%, 2020 mean 89.08%.
◦Maternal Mortality Ratio (deaths per 100,000 live births): Mean 7.09, Std. Dev. 4.28, range 1.90–58.50, 2002 mean 8.20, 2020 mean 6.08.
◦Adolescent Birth Rate (births per 1,000 women age 15–19): Mean 11.97, Std. Dev. 7.68, range 2.40–45.60, 2002 mean 12.89, 2020 mean 9.33.
1 All measures presented here are from two-year lagged values; 2 Percent of women over 25 with at least some secondary education; 3 Deaths per 100,000 live births; 4 Births per 1,000 women age 15–19; Source: United Nations Human Development Reports
The GII is constructed such that zero (0) indicates complete gender equality and one (1) complete inequality; thus, the average score of 0.12 reflects a sample with a great deal of gender equality. Across countries and years, the lowest level (thus most gender equal) is 0.02 (Denmark 2020), and the highest (thus least gender equal) is 0.33 (Bulgaria 2002). The GII has substantially decreased over time, reflecting a movement in our sample toward greater gender equality.
The first component of the GII, the percentage of women in parliament, has an overall average of 27 percent over time and across countries but shows gains in women’s representation over time. It ranges from a low of 7.1 percent (Cyprus 2002) to a high of 47.6 percent (Iceland 2018).
The percentage of women in the labor force has an overall average of almost 54 percent, indicating high levels of economic participation and showing modest increases over time. However, significant differences occur comparatively, with women’s labor force participation ranging from a low of 35.7 percent (Italy 2002) to a high of 79.8 percent (Iceland 2018).
Next, the percentage of women over age 25 with at least some secondary education reflects social and economic pathways to empowerment. Overall, this percentage is high (83.15 percent overall average) and has only increased in the period. The lowest value is 24 percent (Portugal 2002), and the highest is 100 percent (Austria 2018, 2020). Portugal is a minor outlier with comparably low percentages, but removing it from the sample does not change the patterns below.
Access to high-quality maternal health care and delayed transitions to childbirth are hallmarks of Western industrialized democracies. They represent core social equality for women in family and body-autonomy-relevant domains that may otherwise diminish their empowerment (Orloff 1992). Overall, both measures indicate that, on average, women experience low levels of maternal mortality and that levels of childbirth by adolescent girls are low across Europe. Both negative outcomes are also improving over time. Yet the variation is striking. Maternal mortality drops to as low as 1.9 deaths per 100,000 women (Poland 2020) to a high of over 58 deaths (Cyprus 2020). Cyprus is an outlier in this measure, and when we exclude it, the highest remaining level is 24.8 (Estonia 2002). Women adolescents giving birth have declined over time, and the lowest percentage of women giving birth aged 15–19 is 2.4 (Switzerland 2020), while the highest was 45.6 (Bulgaria 2010). In this measure, Bulgaria is an outlier. Removing it, the highest is 29.1 (Great Britain 2002).Footnote 9
Most of the contextual measures of gender equality tend to have strong, substantive, significant correlations. This supports the GII’s power to capture broad trends in gendered contextual inequality, but some differences between the various measures also highlight the importance of considering their individual impact in the following models. The full correlation matrix is available in Appendix Table A15.
Using these measures, we test whether and how the country’s level of gender inequality and women’s political, economic, and social empowerment may affect gender differences in our eight modes of political participation. We accomplish this by running multilevel mixed-effects logistic regressions for each type of participation. Models include all individual-level controls and survey-provided weightsFootnote 10 and allow the slope of gender to vary randomly within all gender interaction models (Giesselmann and Schmidt-Catran Reference Giesselmann and Schmidt-Catran2019; Heisig and Schaeffer Reference Heisig and Schaeffer2019).
6.2 Contextual Effects of Gender Inequality on Women’s and Men’s Differential Political Participation
Our primary goal of the multilevel models is to examine whether gender differences in women’s or men’s levels of participation are due to the context of gender inequality. For example, given our finding that women sign petitions more than men, can this be significantly attributed to a context where women have more equality overall? If so, the gender difference petition signing should be larger in countries with more gender equality. This is tested with cross-level interactions, and when significant, we illustrate these patterns with marginal predicted means. We are less interested in how national levels of gender equality relate to overall average levels of participation, but full results for all country-level findings are available in Appendix Tables A16–A23.
Before presenting the results from the multilevel models, it is worthwhile to understand how these country-level characteristics are related to the average gender differences in participation across the different measures of political participation. This represents an initial descriptive exploration of the extent to which institutional gender inequality is related to individual-level gender inequality. We do this by examining the correlations between our country-level measures and the gender differences we find descriptively between women’s and men’s average levels of participation over time in each country. The results are in Table 5.
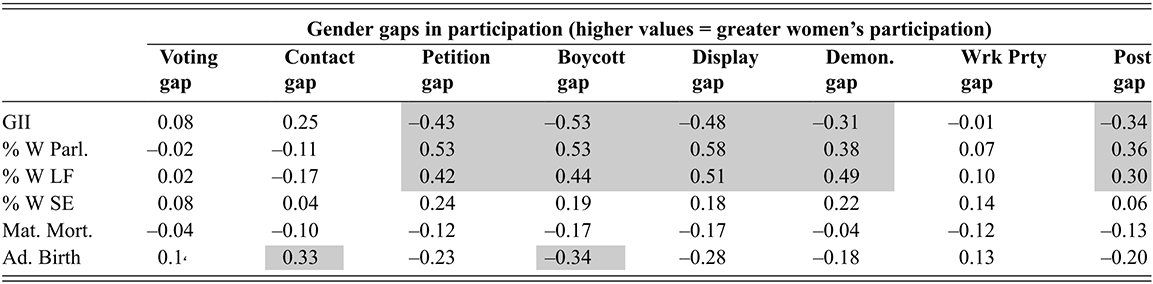
Table 5 Long description
Columns represent gender gaps for eight participation types: Voting, Contact, Petition, Boycott, Display, Demonstrate, Work Party, and Post Online. Rows represent country-level measures: Gender Inequality Index (GII), % Women in Parliament, % Women in Labor Force, % Women with Secondary Education, Maternal Mortality Ratio, and Adolescent Birth Rate. Below, we provide the list of correlation values between each country-level indicator and the average gender gaps in types of political participation. Higher positive values mean greater women’s participation relative to men.
GII: Voting 0.08; Contact 0.25; Petition -0.43; Boycott -0.53; Display -0.48; Demonstrate -0.31; Work Party -0.01; Post -0.34.
% Women in Parliament: Voting -0.02; Contact -0.11; Petition 0.53; Boycott 0.53; Display 0.58; Demonstrate 0.38; Work Party 0.07; Post 0.36.
% Women in Labor Force: Voting 0.02; Contact -0.17; Petition 0.42; Boycott 0.44; Display 0.51; Demonstrate 0.49; Work Party 0.10; Post 0.30.
% Women with Secondary Education: Voting 0.08; Contact 0.04; Petition 0.24; Boycott 0.19; Display 0.18; Demonstrate 0.22; Work Party 0.14; Post 0.06.
Maternal Mortality Ratio: Voting -0.04; Contact -0.10; Petition -0.12; Boycott -0.17; Display -0.17; Demonstrate -0.04; Work Party -0.12; Post -0.13.
Adolescent Birth Rate: Voting 0.14; Contact 0.33; Petition -0.23; Boycott -0.34; Display -0.28; Demonstrate -0.18; Work Party 0.13; Post -0.20.
In the table we use shaded cells to indicate the highest correlations, where the absolute value of r is .30 or more. Summarizing those patterns, we find that structural gender equality indicators (% women in parliament and labor force) strongly predict women’s greater participation in expressive forms (petition, boycott, display, demonstrate). The index of gender inequality (GII) and adolescent birth rates show inverse patterns, reducing women’s participation in these same activities.
Note: Shaded cells have correlations greater than or equal to r = 0.30.
All individual-level gaps are measured as women’s average participation minus men’s average participation in each year and country (weighted data). Focusing on correlations of r = 0.30 or higher (shaded cells in Table 5), which indicate a moderate relationship between variables, we find that an aggregate measure of gender inequality (GII), along with the percentage of women in parliament and in the labor force, are the most consistently related to higher levels of women’s political participation. The percentage of women with some secondary education and maternal mortality ratios are very weakly correlated with gender differences in political participation. The birth rate among adolescent women is positively related to contact among women but negatively related to their boycotting behavior. Gender differences in voting and working for a party are not substantively related to any of the country-level measures of gender inequality. These descriptive correlations lay the groundwork for better understanding of the inferential results from the multilevel models.
Moving on to the multilevel analyses and starting with a focus on voting, we find no significant interaction between gender and country-level characteristics. This finding is expected, given the lack of correlation between gender differences in voting and the country-level measures of gender inequality in Table 5. In other words, the context of gender inequality in a country does not differentially affect women’s or men’s voting behavior.
As we saw above, men are more likely to contact political officials, and although country-level gender equality does seem to help with overall contact behavior (see Appendix Table A17, it rarely shapes the size of the gender gap. Only one country-level factor shapes the size of the gap: women with secondary education. Figure 25 illustrates that while the percentage of women with some secondary education does not significantly affect overall contact behavior, there is a small significant effect on women’s participation. When a higher proportion of women have some secondary education, women’s contacting behavior increases somewhat more than men’s. However, women are still less likely to engage in this behavior than men.
Marginal predicted means for women’s and men’s contact participation based on the level of women with some secondary education
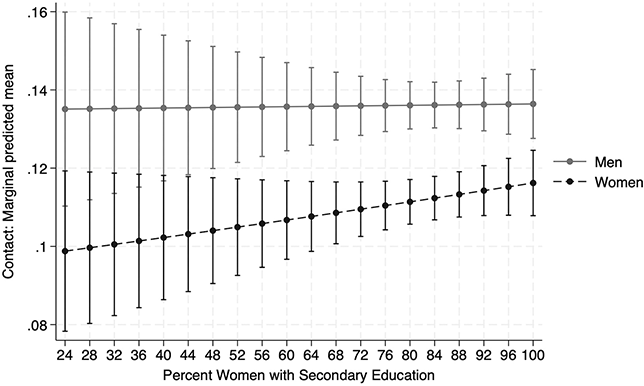
In full models, women are shown to sign petitions more than men, but women’s greater participation in this activity varies significantly based on contextual measures. First, higher levels of GII are linked to lower participation in signing petitions, but this has a significantly stronger negative effect on women than men. In other words, the lower the level of overall gender inequality, the more women outperform men in signing petitions. Similarly, countries with more women in parliament have higher rates of signing petitions overall, and this particularly boosts women’s participation in petition signing. When women make up more than 30 percent of parliament, women are significantly more likely to sign petitions, but below that, there is no gender gap. These two gender interactions are presented in the top left and right panels of Figure 26 (a) and (b). This same pattern, with positive overall effects but significantly more positive effects on women’s participation than men’s, is also found for the percentage of women in the labor force and the percentage of women with some secondary education. These relationships are illustrated at the bottom left and right panels of Figure 26.
Marginal predicted means for women’s and men’s petition signing based on the level of the gender inequality index (top left), the percentage of women in parliament (top right), percentage of women in the labor force (bottom left), percentage of women with secondary education (bottom right)

We found that women are significantly more likely than men to boycott goods for political reasons, and this relationship is strengthened when women have more structural equality in the nation. As shown in Figure 27 the upper left figure, when the GII is lower, everyone participates more, but this is particularly the case for women. When there are more women in parliament, overall boycotting activity increases and does so more strongly for women than men (top right panel). Higher births by adolescent women are negatively related to boycotting, and when adolescent birth rates are high this has a significant negative effect on women’s boycotting in particular. The latter relationship is seen in the bottom panel of Figure 27.
Marginal predicted means for women’s and men’s boycott participation based on the level of the gender inequality index (top left), the percentage of women in parliament (top right), and the birth rate among adolescent women (bottom)
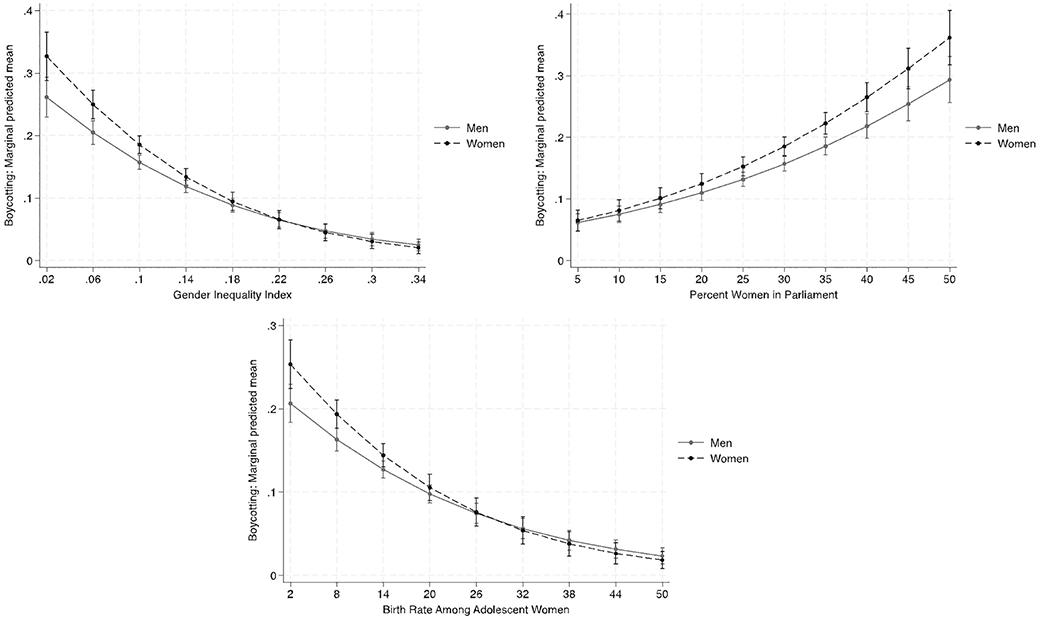
The country maps indicated some sizable cross-national gender differences in wearing or displaying campaign material. On average, women tend to do this more than men, but women’s participation relative to men is largest in the Nordic nations. These are also the most gender-egalitarian nations, and we find that lower GII and greater women’s parliamentary and labor force representation boost this activity in general, but especially for women (see Figure 28). Interestingly, at very high levels of women in parliament (approaching parity), women are much more likely to display campaign materials, which may reflect an increase in women’s overall investment in electoral politics when women are better represented. In general, higher maternal mortality and women adolescents giving birth are negatively related to displaying campaign material, but the effect does not vary by gender.
Marginal predicted means for women’s and men’s displays of campaign material based on level of GII (top panel) and based on the percentage of women in parliament (bottom left) and the percentage of women in the labor force (bottom right)

When controlling for all individual characteristics, we found that women and men were equally likely to participate in a lawful demonstration. Yet, in multilevel models, we also see that country context matters (see Figure 29). Greater levels of gender inequality depress overall engagement in demonstrations, but this effect is stronger for women. The percentage of women in parliament or the labor force is not significantly related to the likelihood of demonstrating in general, but when there are more politically and economically empowered women in the country, this empowerment is significantly and positively related to women’s greater of demonstrating than men’s.Footnote 11 As more women join the labor force, the likelihood of women participating in demonstrations increases significantly, while the likelihood for men decreases. Finally, in contexts of higher birth rates among adolescent women, there are lower levels of demonstrating by everyone, but this is particularly depressive for women’s participation in demonstrations.
Marginal predicted means for women’s and men’s participation in demonstrations based on the level of the gender inequality index (top left), the percentage of women in parliament (top right), percentage of women in the labor force (bottom left), birth rate among adolescent women (bottom right)

Working for a political party is one of the least popular activities, but, on average, men do this significantly more than women. We only find a significant gender interaction with a contextual variable for women’s labor force participation (see Figure 30). In countries where women’s labor force participation is highest, women are likelier to work for a political party, while men’s participation tends to decrease.
Marginal predicted means for women’s and men’s likelihood of working for a political party based on the level of women in the labor force
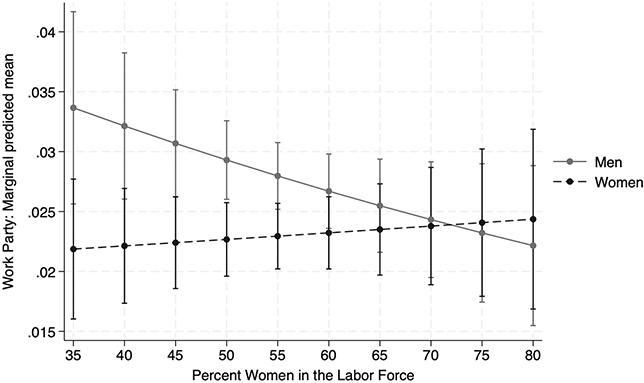
Finally, in Section 5, our full models find that women and men are similar in their participation in posting politically online. Women, however, do significantly more of this relative to men when they live in a context of greater gender equality, with more women in parliament, and with more women in the labor force. The relationships are shown in Figure 31. Greater gender equality (top left) and more women in parliament (top right) are linked to higher levels of posting online for all respondents, but significantly more so for women than men. A context of more women in the labor force does not increase posting behavior overall, but it does have a significantly greater effect on women’s posting relative to men’s (bottom left). Higher birth rates among adolescent women are linked to less online posting for everyone but with larger negative effects on women than men’s likelihood of posting online (bottom right).
Marginal predicted means for women’s and men’s likelihood of posting politically online based on the level of the gender inequality index (top left), the percentage of women in parliament (top right), percentage of women in the labor force (bottom left), birth rate among adolescent women (bottom right)

6.3 Section Summary
Altogether, these findings based on multilevel models with cross-level interactions present additional insight into the cross-national variation in gender gaps in participation. Why might women’s participation in petitions or demonstrations be so much greater in one country, or men’s participation in contacting politicians or posting on like be greater in another country? We posited that the country-level context of gender equality – particularly women’s political, economic, and social empowerment – should help us understand this cross-national variation. Our findings confirm, in most cases, that context matters.
To aid our discussion of the complex pattern of results, we distill our findings into Table 6. While interaction effects can only be fully interpreted by looking at the figures above (see also Tables A16-A23 in the appendix for associated model coefficients), in every instance where a significant contextual interaction effect with gender emerged in our study, it indicated a stronger positive effect of contextual gender equality on women’s average individual-level participation in that country. Based on this understanding, a few conclusions emerge.
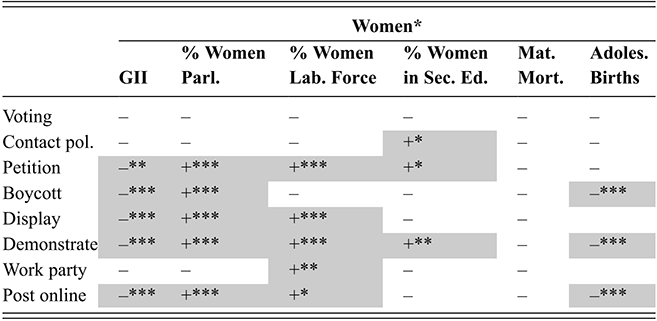
Table 6 Long description
Columns represent country-level gender equality measures. These measures are: the Gender Inequality Index (GII), % Women in Parliament, % Women in Labor Force, % Women in Secondary Education, Maternal Mortality, and Adolescent Births. Rows represent participation types: Voting, Contact Political, Petition, Boycott, Display, Demonstrate, Work Party, and Post Online. Symbols indicate significance. One asterisk means that the p-value was less than 0.05, two asterisks mean significant at p<0.01, three asterisks mean that the p-values are significant at p<0.001. A long em-dash (–) means not significant. A plus (+) or a minus (-) symbol indicates whether the effect was positive or negative.
Patterns by participation type:
Voting: No significant interactions across all measures.
Contact Political: Significant only for % Women in Secondary Education (+*).
Petition: Negative with GII (-*), positive with % Women in Parliament (+), % Women in Labor Force (+), and % Women in Secondary Education (+).
Boycott: Negative with GII (-), positive with % Women in Parliament (+), negative with Adolescent Births (-***).
Display: Negative with GII (-), positive with % Women in Parliament (+), % Women in Labor Force (+***).
Demonstrate: Negative with GII (-), positive with % Women in Parliament (+), % Women in Labor Force (+), % Women in Secondary Education (+**), negative with Adolescent Births (-).
Work Party: Positive only with % Women in Labor Force (+**).
Post Online: Negative with GII (-), positive with % Women in Parliament (+), % Women in Labor Force (+), negative with Adolescent Births (-**).
The patterns support the following summary interpretation:
GII: Consistently negative for expressive participation (Petition, Boycott, Display, Demonstrate, Post Online), indicating that higher inequality reduces women’s relative participation.
% Women in Parliament: Strong positive across most expressive forms (Petition, Boycott, Display, Demonstrate, Post Online), suggesting representation boosts women’s engagement.
% Women in Labor Force: Positive for Petition, Display, Demonstrate, Work Party, and Post Online, linking labor force equality to broader participation.
Adolescent Birth Rate: Negative for Boycott, Demonstrate, and Post Online, indicating higher adolescent birth rates suppress women’s participation in these activities.
% Women in Secondary Education: Positive but weaker, significant for Contact, Petition, and Demonstrate.
Maternal Mortality: No significant effects across participation types.
Notes: * p < 0.05; **p < 0.01; ***p < 0.001, – not significant, two-tailed tests
First, men and women report voting at very similar rates, and this finding is regardless of the level of gender inequality or women’s empowerment in our sample of European democracies. Given that women have only held the right to vote for about one hundred years in the earliest nations to pass suffrage and much less in other nations,Footnote 12 this equalization of women’s and men’s reporting rates is, overall, good news.
Second, activities that men report doing more than women (contacting politicians and working for a party; see Section 5) are largely unaffected by the level of women’s empowerment in a country. This is quite similar to the findings by Beauregard (Reference Beauregard2018) and Kittilson and Schwindt-Bayer (Reference Kittilson and Schwindt-Bayer2012) showing that the proportion of women in parliament does not affect gender gaps in these types of actions. Men’s greater likelihood of contacting political officials (Figure 9) does not vary by level of gender inequality, women in parliament, or women in the labor force. However, improving women’s access to secondary education may boost women’s participation in this activity more than men’s. This result complements our earlier finding (Figure 17) which shows an overall stronger effect of having a tertiary degree for women in predicting contact behavior. Similarly, men are generally more likely to report working for a party (Figure 12), but only women living in a country where more women are in the paid labor force see a slight boost in their likelihood of working for a party. All other contextual characteristics matter similarly for women and men.
Third, for those activities where women participate more or as much as men (as shown in the full models in Section 5), the country’s context of gender equality greatly supports women’s participation. These activities include signing petitions (Figure 10), boycotting goods (Figure 10), displaying campaign material (Figure 11), demonstrating (Figure 11), and posting politically online (Figure 12). Women who live in contexts of greater gender inequality (GII) see their participation significantly increased relative to men’s. This effect is largely attributable to women’s political (women’s percentage in politics) and economic (women’s percentage in the labor force) empowerment within these contexts. These two factors are highly correlated, but where women have more political and economic power, we see that individual women are even more likely to petition, boycott, display materials, demonstrate, and post online. Less powerful or consistent findings emerge for contexts of greater women’s secondary education and lower adolescent birth rates. Altogether, this shows a strong link between gains in societal gender equality and improvements in women’s overall participation.
Fourth, our focus in this section was not on the relationship between country-level gender equality and the overall participation rate for all respondents in political activities. However, in many cases, we see that greater gender equality and more women’s political, economic, and social empowerment are related to overall higher rates of political participation across the various types. Indeed, in every activity except for voting and working for a party, a lower gender inequality index level is significantly related to greater overall participation. Thus, we additionally argue that contexts of greater women’s empowerment and gender equality are good for all citizens, in addition to strengthening women’s participation in particular.
7 Conclusion
In the many decades since scholars began studying gender differences in political participation (e.g., Duverger Reference Duverger1955; Almond and Verba Reference Almond and Verba1963; Verba, et al. Reference Verba, Nie and Kim1978), much has changed. Activist, engaged citizenship has become a mainstay of political participation in liberal democracies (Dalton Reference Dalton2008, Reference Dalton2022), and sweeping claims that women are less engaged than men no longer hold. Such a conclusion only emerged from years of cumulative scholarship as theories, data, and empirical evidence have advanced emergent patterns. Yet, this scholarship often reflects a patchwork of countries, types of participation, and years of data, often making it difficult to extrapolate toward a larger view of the issue.
With this in mind, we have focused on one core research question using a consistent sample of European democracies: Over time and cross-nationally, how do women and men participate as democratic political citizens? We answered this by examining eight types of political participation across four intersecting dimensions to describe gender gaps in political participation: type of activity, individual-level explanations for participation, patterns over time, and cross-national differences. Our analyses delved into the nuanced ways that gender shapes different forms of political involvement.
In this final section, we start by reviewing and summarizing the key findings across these four studied dimensions. In doing so, we return to the theoretical expectations outlined in Section 2 and the results presented in Sections 4–6. We then discuss the broader implications of our findings and suggestions for efforts to support gender equality in political participation.
7.1 The Four Dimensions of Gendered Political Participation
In Section 2, we introduced theoretical insights and earlier empirical evidence relevant to understanding gendered patterns in political participation and changes over time and cross-national variation therein. Returning to these theoretical ideas and previous empirical studies, we now outline our findings across the four dimensions of our study.
7.1.1 Gender Differences in Participation Types
There was strong theoretical and empirical support for expecting women and men to engage in different types of activities (Beckwith Reference Beckwith2005; Bode Reference Bode2017; Burns Reference Burns2007; Carreras Reference Carreras2018; Coffé and Bolzendahl Reference Bolzendahl2010; Grasso and Smith Reference Grasso and Smith2022; Pfanzelt and Spies Reference Pfanzelt and Spies2019; Quaranta and Dotti Sani Reference Quaranta and Dotti Sani2018). At a base level, we find that women are more likely than men to sign petitions, and boycott goods, but there is no gender gap in voting or displaying campaign material. Women are less likely than men to contact politicians, work for a party, or post political content online. These patterns provided important initial insights in support of a differentiation model of gendered participation. Indeed, socialized into feminine traits (expressive, communal, less conflictual), women would be expected to value modes of participation contributing to a broader social cause. In contrast, men socialized into traits of masculinity that reward leadership, competition, public roles, autonomy, and self-reliance would be expected to do the kinds of public, agentic actions we see in these patterns. In our previous work, we also found that women participate more in private, individual, or noninstitutional forms, and men participate more in expressive contact, collective, and resource-intensive forms (Coffé and Bolzendahl Reference Bolzendahl2010).
Overall, gender differences may appear small at first glance. Yet, even seemingly modest gender gaps warrant serious consideration – especially when they are persistent over time and remain robust despite the inclusion of numerous controls. This persistence suggests that these differences reflect meaningful gender differences in political participation. Given that women and men each make up roughly 50% of the population, even a small but persistent gender gap in political participation can amount to significant imbalances To illustrate, in Germany, with an adult population of approximately 79.5 million, a two-percentage point gender difference in political participation translates into a notable imbalance. For example, in 2020, about 21% of German respondents reported posting political content online (roughly 16.7 million people). If 20% of women (around 7.95 million) and 22% of men (approximately 8.75 million) engaged in this activity, that means nearly 800,000 more men than women were posting political content online – a significant and substantial difference and highlighting the real-world impact of a seemingly small gap.
These pernicious gaps suggest a real and cumulative effect of women’s and men’s different patterns of participation. Women consistently engage more in boycotting and petitioning than men. Conversely, men consistently spend more time contacting political officials and working for parties or political organizations. These patterns, which endure across time periods, contribute to broader, systematic differences in political experience between women and men.
7.1.2 Individual Resources and Gendered Political Participation: Levels and Effects
The descriptive and aggregate patterns of difference between women and men are, however, incomplete. The social construction of gender is not (only) about socialization but also about the real differences that accumulate to women and men in terms of socio-economic and political resources. By considering these differences and controlling for their effects, we can further explore whether and how ongoing experiences of inequality in work, family, and political resources may explain the gaps we see.
To that end, we analyzed the impact of two broad categories of resources: socio-economic and demographic resources and political attitudes. This approach greatly simplifies a variety of intersecting experiences and identities. However, it also allowed us to highlight the importance of material and ideological resources both in terms of the levels of different socio-economic, socio-demographic, and political resources and how the effects of these resources mattered differently in shaping women’s and men’s political participation.
Descriptively, women and men had differences in socio-economic (or “demographic”) resources we expected based on previous resources. Women were more likely than men to be parents, have a partner in paid work, attend religious services more often, and be in service occupations, while men were more likely than women to be partnered and be in managerial or ag, craft, or low-skill occupations. Models that controlled for these differences, however, did not alter the fundamental gender gaps identified in the base models above. There was one exception: voting. When controlling for socio-economic resources, it became apparent that men tend to vote more than women. Further analysis revealed that this reflected women’s tendency to live longer than men and for older persons to vote at higher rates than younger.
Overall, the results tell us that among European nations, levels of socio-economic resources do not drive ongoing gender gaps in participation. However, the story is quite different concerning political resources. Our next models accounted for women’s lower political interest and trust than men’s. These results confirm the primacy of such factors, and we find that women are more likely than men to vote and display campaign material, in addition to the ongoing differences in signing petitions and boycotting once political resources are taken into account. Previous gender gaps in demonstrating and posting online disappeared. Nevertheless, men remain more likely than women to contact politicians and work for a party, two of the most stable gender gaps found in other prior work (e.g., Beauregard Reference Beauregard2018; Kittilson and Schwindt-Bayer Reference Kittilson and Schwindt-Bayer2012; Bolzendahl and Coffé Reference Bolzendahl2010).
Turning to interaction models, we considered differences in the effects of socio-economic and political resources for shaping women’s and men’s participation in detail. Previous research provided strong expectations of differential effects, and we found many such differences. Among the myriad findings, a few are particularly notable. Women’s participation is often accelerated when they have good jobs (managerial) and a good education (tertiary degree). Religiosity tends to depress participation among women and boosts it for men. Younger cohorts of women are often significantly more likely to participate than their men counterparts. Political interest is significantly lower among women and often matters much more for women’s participation than men. Interestingly, when the effect of a given resource matters more for women or men, it tends to exacerbate (not undermine) the gendered patterns in participation from the main models. That is, when women have as much or more resources as men, they are even more likely to petition, boycott, and display materials, and men are more likely to contact politicians and work for a party. This suggests that small, persistent gender gaps in participation reflect deeper structural disparities that call for greater attention.
In sum, we find strong evidence for a gender differentiation model of political participation. Regardless of socio-economic resources, women are more likely than men to sign petitions and boycott and as likely to vote and display campaign material. Men are more likely to contact politicians, demonstrate, work for a party, and post online. However, political resources are crucial. If women held the same level of political interest as men, they would demonstrate and post online as much as men. This raises several questions about such relationships, which we will explore.
7.1.3 (Un)Changing Patterns Over Time
Our European cross-national study, spanning from 2002 to 2020, reveals relatively little change in gender differences in participation over time. Prior evidence for change over time was scant and inconsistent, but it may be that change only emerges over much longer time frames and social processes (e.g., modernization). Aggregate over time differences may not be evident from the data given countervailing trends toward shifting gender (in)egalitarian commitments and slow changes to gender inequality in economic, political, and social realms. We find gender differences remain relatively stable over time, with no significant shift in gender gaps but also no sign of a potential increase in gender disparities because of a gender backlash.
7.1.4 Comparative Patterns in Gendered Participation
In contrast to minimal over-time differences, we observed strong descriptive cross-national variation in political participation between men and women. To understand why these differences occur, we investigated the effect of political, economic, and social gender equality across countries. Our analyses show that overall, countries with greater gender equality tend to have higher levels of political participation from both women and men, but also reveal that gender equality at the contextual level plays a crucial role in shaping cross-national variation in gender differences in political participation. In particular, the percentage of women in parliament and the labor force significantly influences gender differences in political participation, especially in types of participation where women are as likely, or even more likely, to engage than men. In countries where women are better represented in politics and the workforce, gender differences tend to widen in these forms of participation, reinforcing women’s already higher likelihood of involvement. This suggests that greater gender equality not only levels the playing field but also amplifies women’s voices in areas where they are traditionally more active.
7.2 Different and Unequal? Why Gender Differentiation in Political Participation Matters
The experiences of citizens in modern democracies are shaped by a variety of social categories, identities, experiences, values, and relationships. The gender categorization of citizens as women and men continues to form the basis for ongoing difference, oppression, and power inequalities. Focusing on issues of women’s political empowerment, Alexander et al. (Reference Alexander and Jalalzai2018) discuss such empowerment as a transformative process that shifts women from positions of limited agency to greater opportunity and effectiveness. They emphasize that this empowerment occurs over time as part of a political process, rather than at a single moment, and that it redistributes power more evenly between men and women while challenging patriarchal social structures (pp. 5–6).
Referring to this approach, can we say that women are politically empowered citizens? The answer, as usual, is “it depends.” Counter to the narrative that frames women as political laggards relative to men, we find that women are engaging as much or more so than men in many areas. This supports a gender differentiation model of political participation and highlights the long-standing call to understand the “political” as far beyond the more narrow bounds of activities men do most (Beckwith Reference Beckwith2005; Burns Reference Burns2007; Coffé and Bolzendahl Reference Bolzendahl2010; Harrison and Munn Reference Harrison and Munn2007). Nevertheless, women remain less likely to engage in some of the more direct forms of activism and voice: contacting political officials, working for parties, demonstrating, and posting politically online. If we account for women’s lower political interest, we see that women are doing as much demonstrating and posting as men, but this finding suggests further challenges.
First, the conclusion that women are less politically interested than men is ubiquitous. Arguably, women caring less about what is happening in politics than men could be seen as a major challenge to women’s political empowerment. However, some research suggests the story is more complex. Politics and political speech tend to reflect issues women care less about than men (Delli Carpini and Keeter Reference Delli Carpini and Keeter1996; Dolan Reference Dolan2011; Ferrín et al. Reference Ferrín, Fraile, García-Albacete and Gómez2020; Fraile and Marinova Reference Fraile and Marinova2024). In this case, women’s and men’s differential values regarding “politics” may shape their interest differences. Similarly, Hansen and Goenaga (2019) found women placed lower importance than men on institutional factors such as representative institutions, intermediary bodies, and interpersonal deliberation) and more priority on democratic institutions that are less exposed to gendered power asymmetries (i.e., direct participation and public justification) or that try to subvert them (i.e., equal protection of civil, political, and social rights). We also previously found that, as democratic citizens, women place significantly greater emphasis than men on civil and social responsibilities and political, civil, and social rights (Bolzendahl and Coffé Reference Bolzendahl and Coffé2009). In this case, women may refrain more from direct contact activism and have lower political interest because the politics being presented to them do not reflect their priorities.
Second, inconsistencies in how political interest matters for some forms of participation more than others and differentially shapes women’s and men’s participation raise questions of how political interest reflects other gendered experiences. We see that women’s preference for petitions and boycotts, and men’s preference for political contact (and political party workFootnote 13), are persistent and only grow as political interest increases. In these cases, gendered participation gaps may reflect gendered social role expectations (communal versus agentic), such that political interest and participation in these forms become a reinforcing cycle, which starts early in life (Bos et al. Reference Bos, Greenlee, Holman, Oxley and Lay2021; García-Albacete and Hoskins Reference García-Albacete and Hoskins2024). In other words, women and men learn from an early age that these forms of participation are “appropriate” for their gender, and greater political interest only reifies this internalized norm.
This is inversely related to the danger that gender “nonnormative” participation may invoke, especially for women. More specifically, in Section 2, we noted the complex relationship between the social reinforcement of stereotypical gender norms and violence against women in politics (VAWP) (see also Krook Reference Krook2020). Boycotting and signing petitions reflect relatively “safe” ways for women to participate, while posting online may be seen as a “riskier” action. A substantial body of research highlights that digital participation poses unique threats to women, often conveying the message that they are unwelcome (Abendschön and García-Albacete Reference Abendschön and García-Albacete2021; Eckert and Metzger-Riftkin Reference Eckert and Metzger-Riftkin2020; Mantilla Reference Mantilla2013). Concerns over VAWP may also explain why it is only the most politically engaged women who demonstrate as much as men (Figure 24). Demonstrating is risky for women, as crowd members may assault them, and it could be that implicit or explicit concerns about VAWP dissuade all but the most politically interested women from demonstrating as much as men.
Third, we may still be failing to measure political interest adequately. Campbell and Winters (Reference Campbell and Winters2008) illustrate how men and women differ with respect to the issues that interest them. Their analyses, based on an internet survey among 2,890 British respondents, indicate that women are more interested in domestic political issues (health, education, law and order) than men. In turn, men are more likely to be interested in general politics, foreign policy and partisan politics. Likewise, Coffé (Reference Coffé2013) found no gender gap in political interest in local issues, and the gap in general political interest stemmed from respondents associating politics primarily with national politics – an area where women report significantly less interest than men. Findings like these underscore the need to broaden our conceptualization of political interest by incorporating more diverse concepts, frameworks, and methodological approaches. Similarly, we should continue challenging how political participation is defined and measured. Women may be more likely to engage politically in less visible ways, such as through local initiatives or children’s activities – activities often overlooked in (cross-national) surveys. The nature of specific political issues may also shape gendered patterns of participation. For example, education is typically seen as a women’s issue, and women are well-represented on school boards, suggesting that education may motivate women politically, in ways that differ from men (Verba et al. Reference Verba, Burns and Schlozman1997). Women have also been found to be active in peace-oriented activities (Justino et al. Reference Justino, Mitchell and Müller2018) and in environmental behavior and activities (Zelezny et al. Reference Zelezny, Chua and Aldrich2000). Addressing these conceptual issues in measuring political interest and participation may call for a renewed emphasis on qualitative research, such as interviews and ethnographies, to inform and improve survey design. Additionally, greater attention to the online sphere is also called for, where new inequalities are emerging, and research strategies must continue to innovate.
Fourth, while we focused on gender differences overall in this study, we take seriously the call to problematize binary gender categories. Theoretically, claims about women’s and men’s socialization into gender role expectations related to stereotypical notions of femininity and masculinity are presumed to be a key driver of the differences we observe. These average differences between women and men mask our ability to understand how internalized gender norms may help us understand the patterns we see. Survey instruments increasingly offer more nuanced measures of gender/sex identity, allowing respondents to identify across a variety of configurations as well as indicate their social traits of femininity and masculinity (Alexander et al. Reference Alexander and Wängnerud2021; Westbrook and Saperstein Reference Westbrook and Saperstein2015).Footnote 14 Other scholars have also utilized psychological gender trait scales to gain a deeper understanding of how socially constructed traits associated with masculinity and femininity can inform our understanding of gendered political participation (Abendschön and García-Albacete Reference Abendschön and García-Albacete2021; Coffé Reference Coffé2018; Coffé and Bolzendahl Reference Coffé and Bolzendahl2021; McDermott Reference McDermott2016). Such options were not available for this study but are crucial for further research. Along these lines, scholars have long emphasized the fallacy of assuming that women (or men) are part of a cohesive social group with similar interests. As called for by intersectionality scholars, understanding the lived experiences of women and men emergent from multiple lines of identity and stratification will only enrich and improve research in this area (Celis and Childs Reference Celis and Childs2023; Christoffersen and Siow Reference Christoffersen and Siow2024). We find, for example, that ethnic minority women contact politicians and work for parties at a higher rate than nonminority women; though this small sample should be treated cautiously, it is suggestive that gender patterns may vary by ethnic minority status in Europe.
Finally, we leave with the question of whether all types of participation are equal. The title of this Element asks us to consider: is the participation of women and men just different, just unequal, or both? Our answer is clearly both, but we also note that it is difficult, if not impossible, to measure the impact of a given type of participation. Conceptually, some may argue that electoral-oriented participation is the most important in a democracy (voting, contacting elected officials, joining and working for parties or campaigns), but to our knowledge, other than the importance of voting, this has not been proven. Democratic politics are awash with messy signals, poor data, shifting frames, and changing officials (Jacobs and Shapiro Reference Jacobs and Shapiro2000). Establishing a voice in the political wilderness is difficult, but signing a petition or voting are overall easy things the average person can do to impact their own lives and make their voice present in some small ways. So, yes, women in Europe, on average over twenty years, participate differently than men, and yes, important inequalities remain, but in societies with greater gender equality, everyone participates more, and in such societies, women increase participation at a higher rate than men. This is good news for democracy and good news for women’s political empowerment.
Acknowledgement
The authors received helpful feedback from participants at workshops and panels where they presented their work, including the 2024 European Conference of Politics and Gender, the University of Bergen (Department of Government), and the University of Konstanz (Cluster of Excellence- Politics of Inequality Group), the University of Oregon (Department of Sociology), and the Institute of Public Goods and Policies (IPP) in the Spanish Scientific Research Institute, CSIC (Consejo Superior de Investigaciones Científicas). We thank Peng Siyun for his excellent methodological assistance. We thank many others for helpful advice, including David Brady, Clem Brooks, Ana Catalano Weeks, Kaitlin Senk, and Brea Perry. Finally, we thank the two anonymous reviewers and the series editors, Diana O’Brien and Tiffany Barnes, for their excellent suggestions and guidance.
University of Texas at Austin
Tiffany D. Barnes is Professor of Political Science at the University of Texas at Austin. She is the author of Women, Politics, and Power: A Global Perspective (Rowman & Littlefield, 2007) and, award-winning, Gendering Legislative Behavior (Cambridge University Press, 2016). Her research has been funded by the National Science Foundation (NSF) and recognized with numerous awards. Barnes is the former president of the Midwest Women’s Caucus and founder and director of the Empirical Study of Gender (EGEN) network.
Washington University in St. Louis
Diana Z. O’Brien is the Bela Kornitzer Distinguished Professor of Political Science at Washington University in St. Louis. She specializes in the causes and consequences of women’s political representation. Her award-winning research has been supported by the NSF and published in leading political science journals. O’Brien has also served as a Fulbright Visiting Professor, an associate editor at Politics & Gender, the president of the Midwest Women’s Caucus, and a founding member of the EGEN network.
About the Series
From campaigns and elections to policymaking and political conflict, gender pervades every facet of politics. Elements in Gender and Politics features carefully theorized, empirically rigorous scholarship on gender and politics. The Elements both offer new perspectives on foundational questions in the field and identify and address emerging research areas.


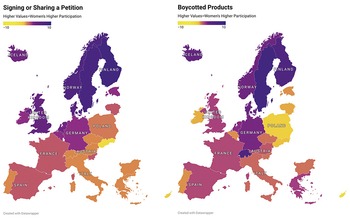
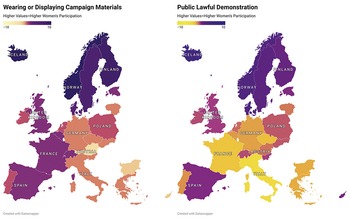


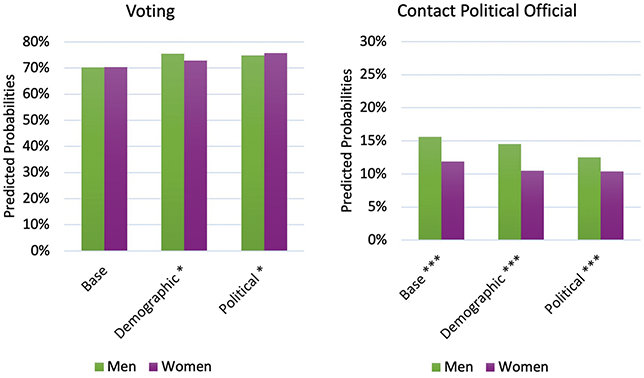
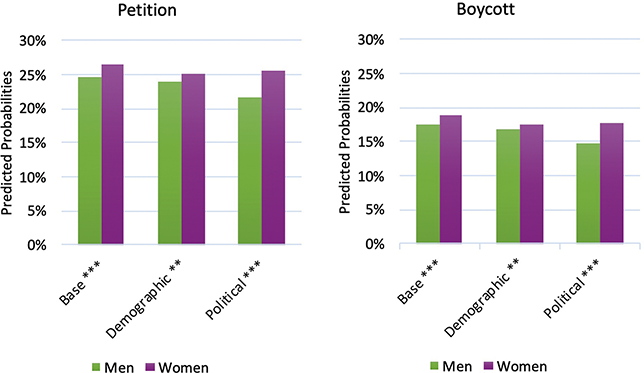
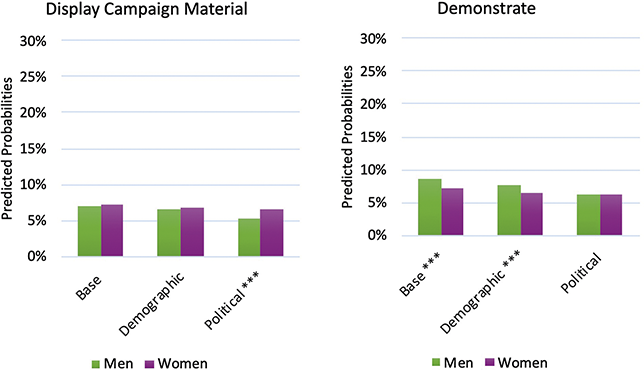


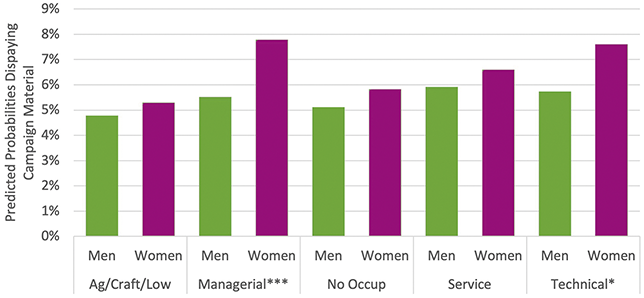


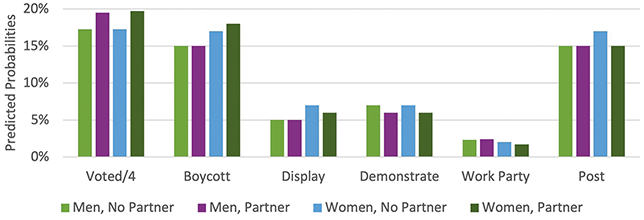
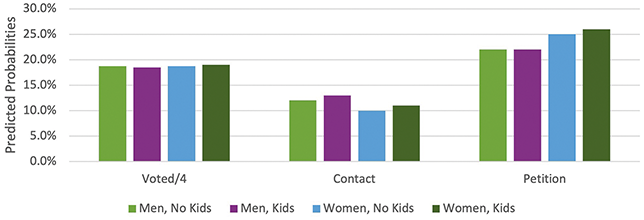
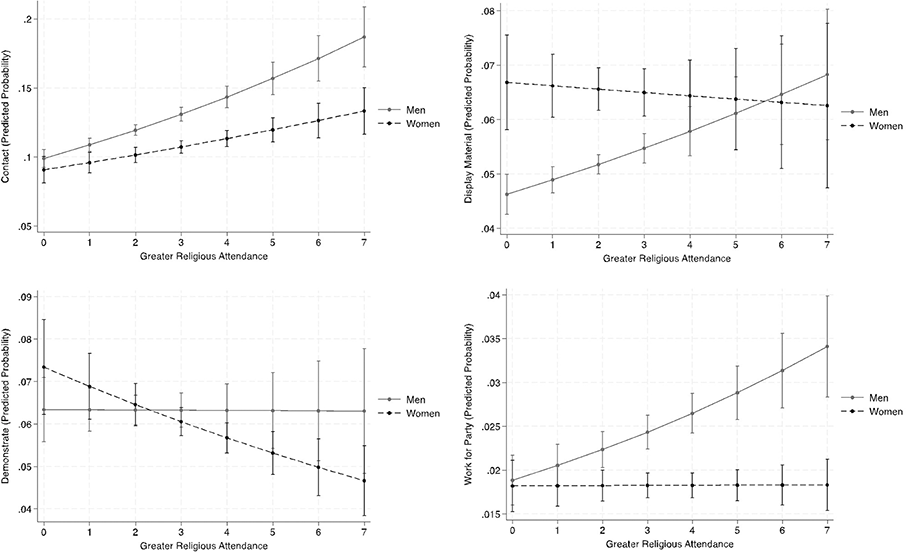
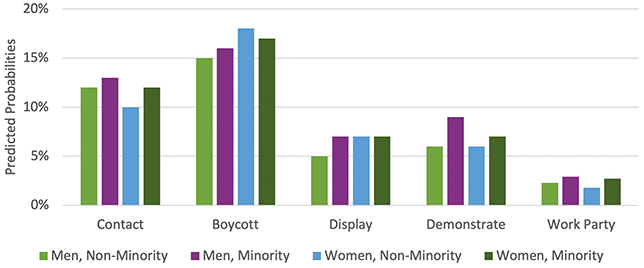
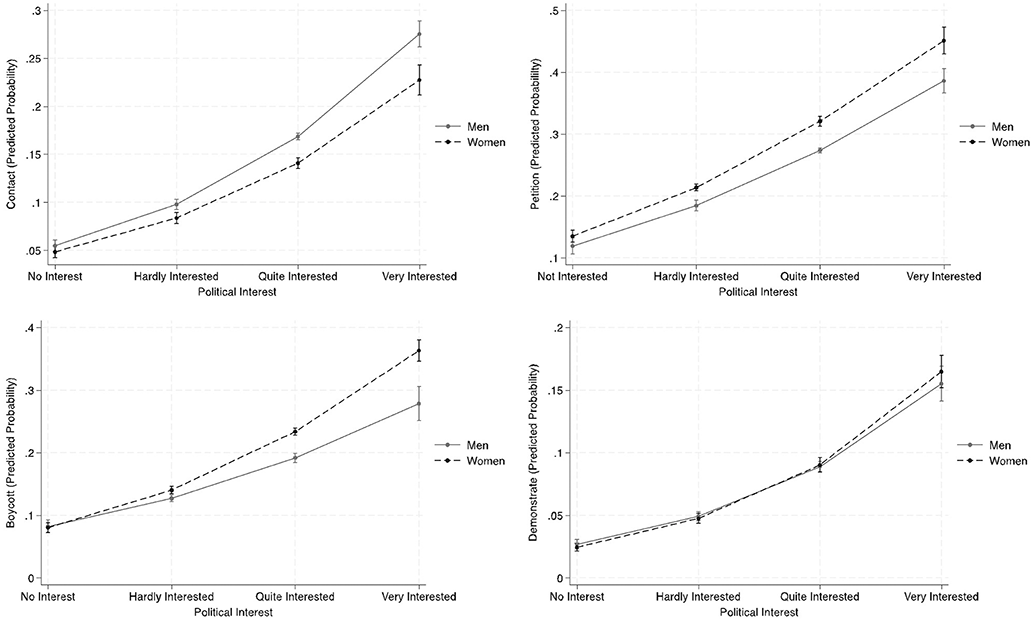


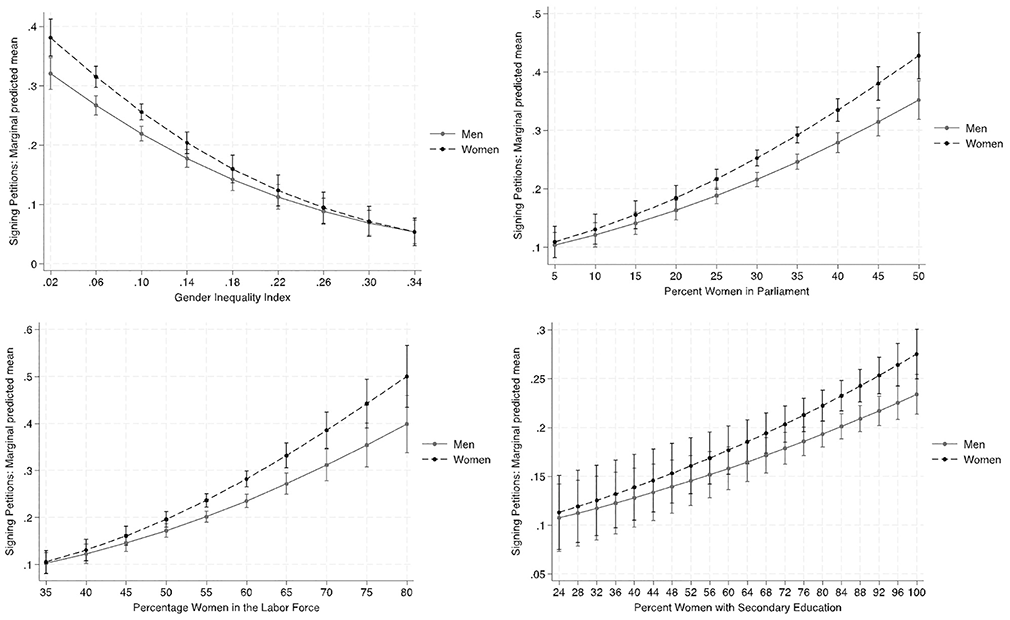

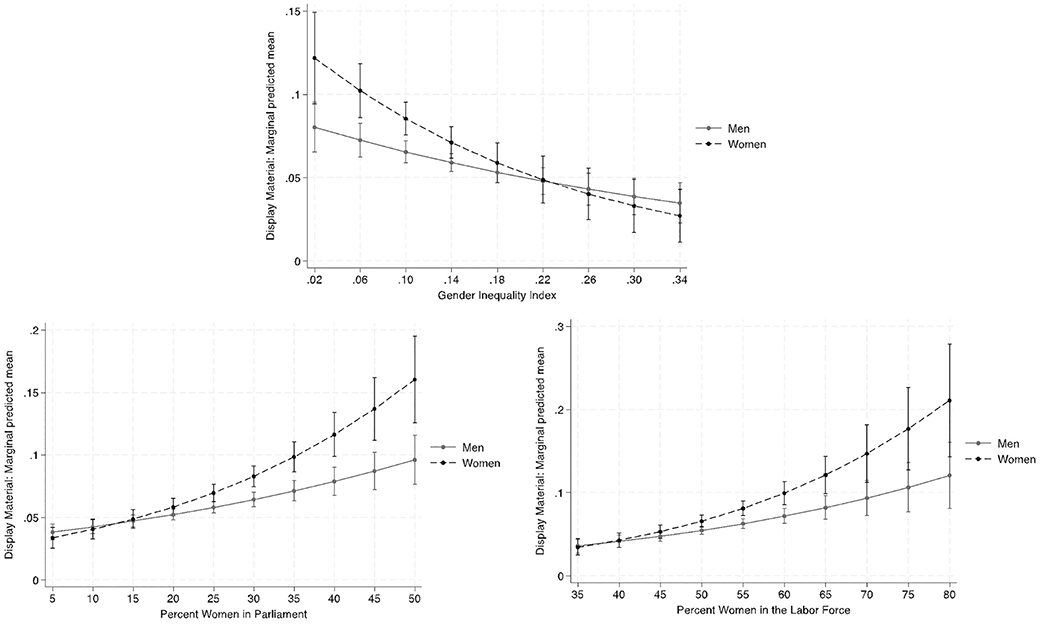
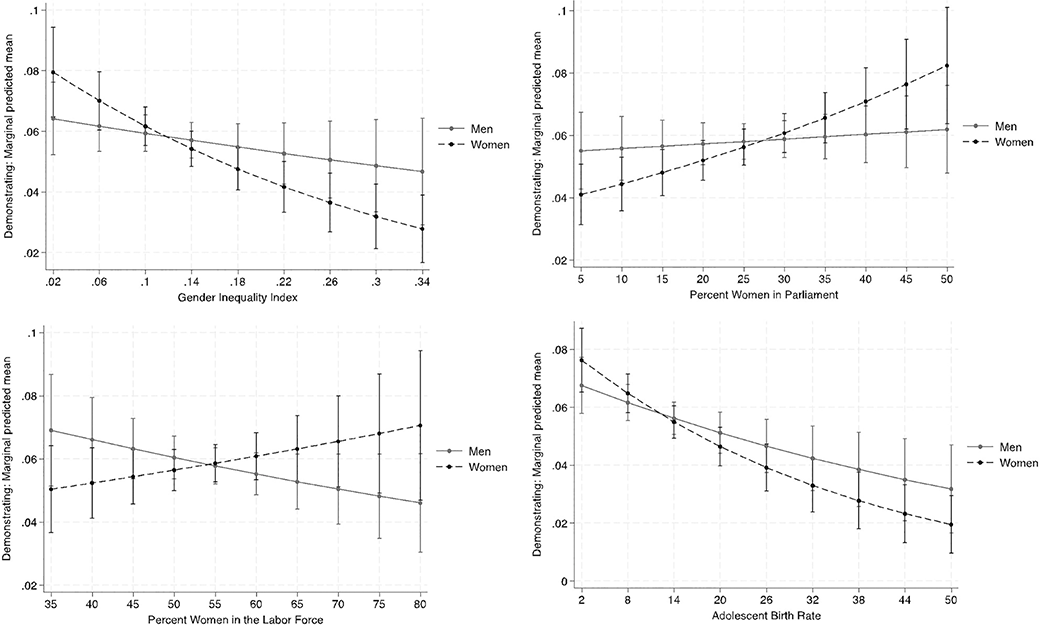

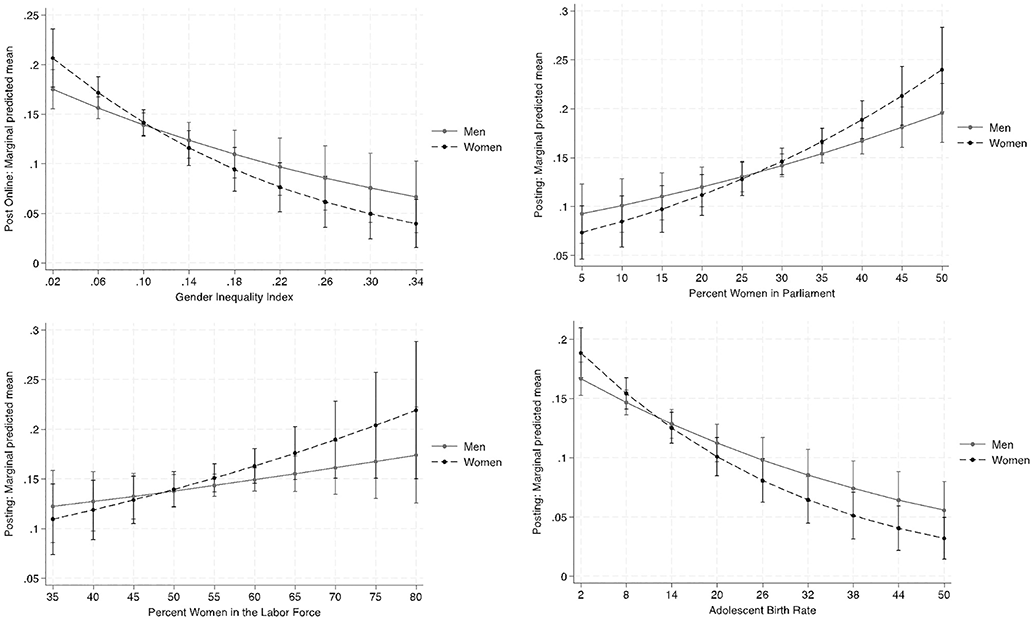


 Open access