

INTRODUCTION
The mechanisms and risk factors involved in the transmission of pathogens from one livestock farm to another are poorly understood. The infectious process is complex and apart from host, pathogen and environmental factors, successful transmission of an infectious organism among hosts depends on effective contact between infectious and susceptible individuals within a population.
Between-farm contacts may occur via movement of animals, which are considered to be a critical factor in the spread of infectious diseases within farm populations [Reference Woolhouse and Donaldson1]. In the UK, sheep and cattle movements played an important role in the dissemination of the foot-and-mouth virus over long distances during the early stages of the epidemic in 2001 [Reference Woolhouse and Donaldson1]. In this country, the mandatory reporting of animal movements has provided researchers with an invaluable source of contact data, in particular of cattle movements between holdings, for which data at the individual animal level have been available since 2001 [Reference Bourn2]. Animal movement data have been incorporated into mathematical models using different approaches to investigate the spread of diseases such as foot-and-mouth disease [Reference Green, Kiss and Kao3, Reference Kao4], tuberculosis [Reference Gilbert5] and scrapie [Reference Kao4].
Network analysis has become popular in recent years for the study of risk-potential networks (i.e. networks where links between nodes can transmit infection provided that there is a pathogen within the network [Reference Friedman and Aral6]) using data derived from livestock movements [Reference Christley7–Reference Webb11]. One of the advantages of the network approach, over more traditional modelling methods such as homogenous mixing modelling, is that the relationships (e.g. animal movements) between individual farms are taken into account, enabling the characterization and analysis of the underlying contact structure of the population, and its effect on the spread of infectious diseases [Reference Webb10]. However, the effective use of this approach to predict transmission events depends on whether recorded animal movement data adequately capture the structure of the risk-potential network for disease spread between farms, and therefore whether these data are sufficient to parameterize predictive network-based models.
Apart from reported animal movements, other inter-farm contacts via visitors or collection companies, which are not compulsorily reported by farmers, may contribute to the transmission of pathogens from one holding to another. Networks constructed from farm-to-farm relationship data other than reported animal movements have been considered previously. Brennan et al. [Reference Brennan, Kemp and Christley12] concluded that there is considerable variation in the types of contacts occurring on cattle farms. Green et al. [Reference Green13] showed that a large proportion of bovine tuberculosis infections on farms (75%) within high-risk areas in the UK is likely to be due to factors other than cattle movements. Ortiz-Pelaez & Pfeiffer [Reference Ortiz-Pelaez and Pfeiffer14] considered multiple risk factors (e.g. cattle movements, environmental factors and farming systems) to classify Welsh farms based on their risk for presence of disease. There has been relatively little work to describe or evaluate the effect of different types of contacts between farms on disease transmission. More realistic risk-potential networks might consider these non-reportable contacts and analyse the effect of these relationships on disease spread using observed pathogen data.
The lack of real pathogen data with which to test models for disease spread has restricted our understanding of the disease dynamics in the context of a network of contacts. Testing model performance with data from outbreak situations presents limitations. A ban on livestock movements in the UK is one of the first control measures enacted to contain notifiable infectious diseases when a diagnosis is confirmed. The behaviour of farmers changes during the course of an outbreak due to increased risk perception. This often leads to stricter on-farm bio-security measures and a reduction in risk-taking behaviour [Reference Ferguson15]. A spatio-temporal study of a non-notifiable infectious pathogen overcomes these limitations.
In this study, bovine mastitis has been chosen as an exemplar of infectious disease. Specifically, we have selected Staphylococcus aureus strain types, isolated from bulk milk samples, as markers for pathogen spread between dairy farms. Mastitis is one of the most common and economically important diseases in dairy cattle in the UK [Reference Bradley16], with S. aureus being the third most common pathogen causing clinical mastitis and the second most common major pathogen causing subclinical mastitis after Streptococcus uberis [Reference Bradley and Green17, Reference Bradley18]. Although the prevalence of S. aureus within herds can be relatively low (⩽5% of mastitis cases) [Reference Bradley and Green17–Reference Breen, Bradley and Green19], the percentage of farms affected by this pathogen can be large (83%) [Reference Bradley and Green17]. Once S. aureus infection is established on a farm, it can be difficult to eliminate because of its poor response to antibiotics and the potential for emergence of antibiotic-resistant strains [Reference Gruet20]. Transmission of S. aureus from infected to susceptible quarters is generally assumed to occur during the milking process, with infected cows' quarters considered to be the primary reservoir of S. aureus [Reference Blowey and Edmondson21]. Subclinical and chronic forms of infection predominate [Reference Bradley16]. Subclinical cases represent a herd health burden as they are difficult to identify due to the absence of clinical signs and also provide a source of infection for the rest of the herd.
In this paper, we present a novel multi-disciplinary approach, where field data collection on pathogen dynamics, questionnaire data and nationally recorded cattle movement data are combined to investigate the use of network-based models as tools to predict disease spread within livestock populations. The characteristics of the risk-potential networks linking the study dairy farms via reported cattle movements and non-reportable local contacts are described. A method to compare the relative exposure of newly infected and persistently susceptible farms to the pathogen via risk-potential links from other farms is proposed.
METHODS
Network components and analysis
Experimental and network data were collected from 44 dairy farms located in Somerset (UK) over a 5-month period from May 2007 to October 2007. Nodes were defined to be the study farms, and edges to be any relationship between a given pair of farms which could potentially result in the transmission of a S. aureus strain from one farm to another. Attribute (i.e. presence or absence of each strain) and network data for each relationship were imported into UCINET version 6.2 (Analytic Technologies; http://www.analytictech.com) for analysis. Network graphs were created and visualized using NetDraw version 2.081 (Analytic Technologies). The quadratic assignment procedure (QAP) correlation function was used to test the association between each pair of observed networks [Reference Brennan, Kemp and Christley12].
Node attributes
Data on the observed S. aureus strain distributions within the study population at two time-points, t 1 (May 2007) and t 2 (October 2007), were obtained from the analysis of bulk milk samples collected from each study farm. A protocol to capture the S. aureus strain profile within a farm using milk collected from the bulk tank was developed [Reference García Álvarez22]. The protocol combined the use of two well-established typing techniques, random amplified polymorphic DNA (RAPD) assay [Reference Pereira23] and multi-locus sequence typing (MLST) [Reference Enright24], to maximize the chance of identifying all S. aureus strains present on a farm, while minimizing sample collection and processing time and cost, to enable a greater number of farms to be included in the study. Phenotypic identification [25] and species confirmation by polymerase chain reaction (PCR) [Reference Phuektes26] of S. aureus isolates from milk samples were performed according to standard procedures. Two millilitres of each bulk milk sample were cultured, and up to 15 confirmed S. aureus colonies per sample were selected for RAPD typing. One isolate of each RAPD type was then selected for MLST [Reference García Álvarez22]. The most prevalent sequence (strain) types (ST) (ST151, ST1074, ST425) identified within the study population are included in this analysis (Fig. 1).
Staphylococcus aureus MLST sequence types (ST) identified on the 44 study farms sampled in May 2007 (▪) and October 2007 (![]() ).
).
Risk-potential linkages
Reported cattle movement data at the individual animal level were provided by the Department for Environment, Food and Rural Affairs (Defra, UK) via the Rapid Analysis and Detection of Animal-related Risks database (RADAR). Two cattle movement networks were extracted, with and without livestock markets as common source locations, to test the impact of the assumption that the risk of transmission of S. aureus strains between animals from different sources while they are in a market is negligible. These networks were built using the individual movement histories of all the animals present on the study farms during the study period. A link was assumed when either (i) a study farm purchased cattle which at some point in their lifetime had been on another study farm (type I link), or (ii) two or more study farms purchased cattle which had at some point (not necessarily the same time period) been on a common location (source location) outside the study population (type II link). These animals may have acquired the same S. aureus strain type(s) on that common location, and subsequently acted as a source of infection for the rest of the animals on the destination farms. Any of these contacts may have occurred prior to the study period. However, these contacts could still explain the occurrence of a new strain on a study farm at t 2 as S. aureus can be intermittently shed by infected quarters [Reference Smith27]. The relationship between the in-degree of the study farms (i.e. the number of edges onto study farms from common source locations) and the presence/absence of specific S. aureus strains during the study period was tested using a Mann–Whitney test.
Two-mode networks were created, for which one mode was a set of nodes (study farms) and the other mode was a set of events (source locations). These two-mode networks were transformed to one-mode networks for the study farms using the ‘affiliations’ function in UCINET v. 6.2 to obtain the number of source locations in common to both study farm i and study farm j. The matrices were dichotomized: a value of 0 if there was no link between a pair of study farms, and a value of 1 if there was one or more links between two study farms. The total number of animals moved was not considered in this analysis.
Non-reportable local contacts among the study farms were collected via questionnaire. These links comprised of relationships between the study farms via on-farm visitors (relief milkers, companies servicing milking equipment, milk hauliers, milk companies, veterinary practices, foot trimmers, feed consultants, semen supply companies and waste collectors); same group of farms (i.e. farms under the same management, sharing agricultural equipment, grazing land and/or field boundaries); and location of prepartum heifers [i.e. heifers kept on other study farm(s) or on a shared location with other study farm(s) prior to calving]. Two-mode networks were constructed, for which one mode was the set of nodes (study farms) and the other mode was a set of events (e.g. veterinary practices). An affiliation matrix was created containing all the relationship variables, with each row representing a study farm and each column a specific relation. From the matrix, one-mode undirected adjacency networks were created for each relationship.
Model development
To test the hypothesis that the transmission of S. aureus strain types within the study population can be explained by the observed contacts between the study farms, theoretical random-generated networks were constructed. The random networks contained the same number of nodes and edges as the observed networks, but with the edges randomly permuted between the nodes. A total of 1000 replicates for each random network were simulated using R software [28]. The node state was fixed for all networks using the observed S. aureus strain data.
The node (farm) state for a given strain was defined according to whether or not that strain was detected in the bulk milk. The state at t 2 incorporates information on the state at t 1 to distinguish between farms that were newly infected and those that were infected at t 1 (Table 1).
Definition of node (study farm) state for a given strain type at each sampling point
Note the node state at t 2 depends on the state at t 1. The terms susceptible, infected and recovered are used as per convention established in the mathematical biology literature to represent the states of the nodes.
The modelling unit was a dyad. The potential dyads were [S PS], [S R], [S NI], [S PI], [I PS], [I R], [I NI], [I PI] (see Table 1 for definition of abbreviations). In order to assess the relationship between the network structure and the observed distribution of a given strain, we compared the mean exposure to infection of newly infected farms (NI) and persistently susceptible farms (PS). We defined exposure (E ij) for each study farm at t 2 as the in-degree of edges from farms that were infected at t 1. The exposure for farm j is Σi=1,i≠jnE ij, where n is the number of study farms, and E ij=1 if there is an edge from i to j, and i was infected at t 1; otherwise E ij=0.
The mean exposure to infection of NI farms (E NI) is given by:
where δj=1 if farm j is NI at t 2; otherwise δj=0. Thus, Σj=1nδj is the number of NI farms at t 2.
Similarly, the mean exposure to infection of PS farms (E PS) is:
where γj=1 if farm j is PS at t 2; otherwise γj=0. Thus, Σj=1nγj is the number of PS farms at t 2.
This approach estimates the ‘amount’ of infection that farms are potentially exposed to from other farms within the study group (exposure). If a strain is transmitted from observed contacts, it would be expected that the study farms that are newly infected at t 2, were exposed to more infection than those that remained susceptible (i.e. E NI>E PS). In addition, NI study farms at t 2 would be expected to be more exposed to infection in the observed than in the random networks. Similarly, the PS study farms at t 2 should be exposed to the same or less infection in the observed than in the random networks (Fig. 2).
Examples of model outputs: observed contact networks vs. random networks (1000 replicates). In the left column, a schematic diagram of the model output is given. Obs, observed value (black arrow); Sim, simulated values range (grey bar). In the right column, the mean exposure to infection of persistently susceptible (PS) farms vs. newly infected (NI) farms for a subset of the models (excluding markets as source locations) and strain types tested are given. The random simulations are coloured in grey, the median of the simulations is represented as a black square, and the value calculated for the observed contact network as a black circle. (a) The state of the study farms at t 2 can be explained by the observed contact network: cattle movement network and ST151. (b) The state of the study farms at t 2 can be explained by the observed contact network: cattle movement network and ST1074. (c) There is no relationship between the network structure and the strain distribution, and the observed network is not better at predicting strain spread than random networks: milk haulier network and ST151.
Spatial analysis
The Cuzick & Edwards k-nearest neighbour test [Reference Pfeiffer29] was used to determine whether there was any evidence of spatial clustering of the S. aureus isolates within the study population.
RESULTS
Characteristics of the risk-potential networks linking the study farms
The cattle tracing system data contained 31 reported batch movements (type I links), of which 28 were direct movements between the study farms. Two of these occurred during the study period and ten occurred <5 months before the start of the study. The dichotomized network consisted of five components (i.e. subgroups of farms which are connected to one another but disconnected from other subgroups within the network), which contained 2, 2, 2, 3 and 7 farms, respectively. A larger number of type II links were identified (512 including markets and 242 excluding markets), with >80% of study farms linked via common cattle source locations outside the study population.
Ten two-mode networks were constructed from the non-reportable local contacts. Data on holdings within the same group of farms was excluded as only two farms were identified within this category. A median of eight companies or farming-related visitors per study farm (range 5–15) were identified. We found that the same milk haulier collected milk for more than one milk company, and several milk hauliers worked for the same milk company. Thus, it is important to distinguish between milk hauliers and milk companies when considering their role on disease spread. The networks of the non-reportable contacts varied according to whether a few companies visited a large number of farms or a large number of companies visited fewer study farms. The semen supply network was represented by a single connected component where each node can be reached from any other node within the network. Other networks were more disconnected (milk hauliers and veterinarians), and some networks were highly fragmented (foot trimmer network) (Fig. 3).
Two-mode networks for (a) semen supply companies, (b) milk hauliers, (c) veterinarians, and (d) foot trimmers. The black squares represent the events and the circles the study farms. Colours of study farms represent the infectious states at time-point 2 for ST151: white is persistently susceptible; light grey is recovered; grey is newly infected; black is persistently infected.
Significant correlations were found between cattle movements and other relationships identified from questionnaires completed by the study farms: foot trimmers (P=0·006), relief milkers (P=0·01), prepartum heifer location (P=0·01), veterinarians (P=0·04), and companies servicing milking equipment (P=0·05). The density (ρ) of the networks for relief milkers (ρ=0·003) and prepartum heifer location (ρ=0·002) were, however, much lower than that of the cattle movement network (ρ=0·13). Holdings using the same veterinary practice were more likely to use the same foot trimmer (P<0·001) and relief milkers (P=0·03). Other networks were also significantly correlated, including the milk company and the milk haulier networks (P<0·0001), and the milk company and feed consultant network (P=0·007).
Modelling real pathogen data within dynamic networks
The reported cattle movement network, excluding livestock markets as source locations, appeared to play a role on the transmission of ST151 and ST1074 (Fig. 2 a, b). Incorporating livestock markets did not change the result (Fig. 4). For both ST151 and ST1074, <0·1% of the simulations on the exposure to newly infected farms were equal or greater than the observed value, suggesting that there is an association between import of cattle and the occurrence of ST151 and ST1074 on a farm. We found no evidence of association between cattle movements and the strain distribution of ST425 within the study population. The study farms with the highest in-degree were more likely to be infected by ST151 (P=0·12) and ST1074 (P=0·04), but not by ST425 (P=0·42).
Model outputs: observed cattle movement network (including markets) vs. random networks (1000 replicates). The random simulations are coloured grey, the median of the simulations is represented as a black square, and the value calculated for the observed contact network as a black circle. (a) Cattle movement network and ST151. (b) Cattle movement network and ST1074.
Two risk-potential networks, built using non-reportable local contacts between the study farms, were also found to be associated to certain strain distributions: feed consultant network vs. ST151, and the veterinarian network vs. ST425. The observed mean exposures to infection of ST151 and ST425 newly infected farms within these networks were >90% of the simulations in both cases. For the other local contacts reported by the study farms, the observed networks were no better at predicting the strain distribution than the random simulations (e.g. milk haulier network vs. ST151) (Fig. 2 c).
The transmission of the most prevalent S. aureus strains between farms was not linked to spatial proximity
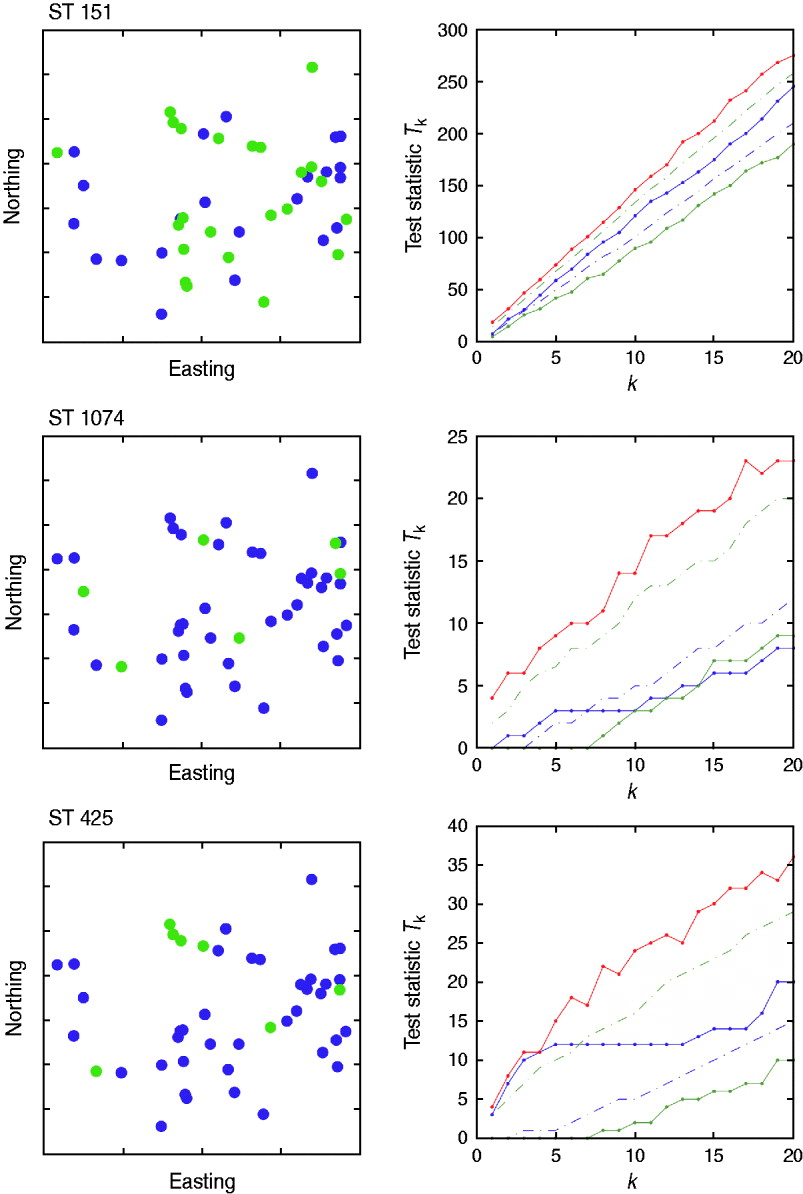
There was no evidence of spatial clustering of cases (i.e. presence of a specific strain on a farm) in the study population at any time-point for any of the sequence types tested, apart from a small cluster detected for ST425 in October (Fig. 5) for which the test statistic T k was above the 95th percentile of the random simulation for values of k<5.
Cuzick & Edwards k-nearest neighbour test results for October 2007. Three sequence types (ST151, ST1074, ST425) were considered. The northing and easting coordinates of the farms positive to strain (green) and negative to strain (blue) are represented in the left-hand panels. The study area covered 3516 km2, with an approximate maximum distance of 60 km from North to South, and 105 km from East to West. The values of the test statistic T k according to the number of nearest neighbours considered (k) are provided in the right-hand panels. Solid red line=maximum of the random values; dashed green line=95th percentile of the random values; solid blue line=observed values; dashed blue line=5th percentile of the random values; solid green line=minimum of the random values.
DISCUSSION
This study has established the value of incorporating multiple sets of contact data for dairy farms besides cattle movements as a backbone for network analysis; illustrates the importance of using real-pathogen data to parameterize models for disease spread; and has shown the feasibility of this approach for future larger-scale studies investigating disease transmission within a network of contacts.
An essential element for efficient transmission of pathogens between cattle herds is the exposure of susceptible to infected animals. This exposure can arise from direct or indirect contact resulting from cattle movements, contact with people, or use of shared resources. It seems unlikely that any effective control measures to limit the spread of disease can be implemented without some understanding of the underlying contact structure. The farms in this study were not spatially proximate, although they were in the same geographical region (county), and yet a large number of links between them were identified. These links included not only reported cattle movements but also non-reportable contacts, which may constitute important routes of transmission for some pathogens.
The presence of S. aureus in bulk milk was identified in a large proportion of study farms (82%). A diversity of strain types was observed within the study population, and changes over the study period indicated a dynamic process. The most prevalent S. aureus strain was ST151, which was isolated from the bulk milk of >50% of the farms at both time-points. ST151 is a representative subtype of one of the most important S. aureus bovine-associated clones (ET3), to which a large number of cases of bovine mastitis worldwide have been attributed [Reference Fitzgerald30]. ST1074 and ST425 have previously been isolated from milk samples collected from infected quarters [Reference García Álvarez22].
The number of type I links (i.e. when cattle present on a farm during the study period had been purchased from another study farm) connecting the study farms was relatively small, and were not identified as an important source of a new S. aureus strain type on a farm in this study. This is not surprising as the study farms were linked to a large number of farms outside the study population. Over 80% of the study farms were connected via type II links (i.e. when cattle present on two or more study farms during the study period had been sourced from the same holding located outside the study population). Access to RADAR data enabled the identification of these source locations completing the network of contacts for the study population. We included as indirect links animals purchased from the same source location at different time-points. These are valid links due to the characteristics of S. aureus infections. S. aureus has been shown to persist for over 10 years on farm if left untreated [Reference Anderson and Lyman31].
The role of markets in disease transmission depends on the specific disease and its transmissibility, as well as the nature of the contact between groups of animals from different origins permitted by the market [Reference Robinson and Christley32]. Transmission of S. aureus is generally assumed to occur from infected to susceptible animals during the milking process [Reference Blowey and Edmondson21]. All livestock have to be moved from a market within 48 h after arrival and the animal areas have to be cleaned and disinfected after each trading day to minimize disease spread [Reference Kiss, Green and Kao9]. It is therefore unlikely that S. aureus is transmitted between cattle from different farms at markets. Including connections at markets in the risk-potential network did not affect the overall results, suggesting that the livestock markets do not play a significant role in the transmission of S. aureus strains between livestock. However, a larger scale study is required to confirm this.
In addition to reported cattle movements, multiple non-reportable local contacts between the study farms were identified. These contacts displayed different network structures for the study population, from a highly connected network to more fragmented structures. The identification of connected and disconnected components within a network is important in terms of disease transmission. Infection introduced in a node within the larger connected component would have a different effect on the spread of disease throughout the network than if the node infected is part of a disconnected component [Reference Webb10]. Others have also reported that these types of contacts can be numerous, with social visits representing a large number of the links, and 25% of the visitors having contact with animals [Reference Nielen33]. Brennan et al. [Reference Brennan, Kemp and Christley12] found similar network patterns to the ones reported here. A study investigating risk factors associated with the introduction of the bovine herpesvirus 1 on Dutch cattle farms [Reference van Schaik34] showed that farms with visitors in the barn and temporary workers, such as relief milkers, were more likely to be positive for presence of the virus than those without these visitors.
The use of cattle movement data alone is unlikely to capture the complete dynamics of infectious diseases, and could lead to an underestimation of the potential for disease spread, especially of the likely degree of local spread. As determined by the QAP correlation function, the cattle movement network was associated with some non-reportable networks for the study farms but not with others, such as the feed consultant network. Some of these non-reportable contacts could therefore explain localized spread of disease among holdings even when animal movements have been banned.
The description of the spatial pattern and the detection of clusters of infection within a population can aid the identification of localized environmental risk factors, which may play a role in transmission events [Reference Pfeiffer29]. The observed strain distributions for the most prevalent strain suggested that the spatial spread of S. aureus could not be explained by the nearest-neighbour model based on spatial location. This was confirmed by the Cuzick & Edwards k-nearest neighbour test, which did not identify any clusters of cases. It is concluded, based on the available data, that the transmission of S. aureus strains at farm level is not linked to spatial proximity. This was not surprising, as the spread of S. aureus mainly occurs at or around the time of milking. However, this conclusion must be treated with caution since there were a large number of dairy farms in the study region that did not participate in the study. Larger scale studies would provide additional evidence for the role of these risk factors in farm-level transmission of S. aureus strains.
Visual comparison of the networks connecting livestock farms is difficult due to the large number of different types of links. More sophisticated methods are therefore required to assess the role of different relationships in pathogen spread. We developed a stochastic model using a Monte-Carlo simulation to compare the predictive value of the observed networks connecting the study farms with randomly generated networks. The model was tested using field-collected pathogen data. The reported cattle movements linking the study farms were correlated with the occurrence of certain strains of S. aureus. This dataset also highlights the potential role of humans visiting the farms in pathogen spread. A larger scale study incorporating more farms and with repeated sampling over a longer time period is required to explore this further.
Previous studies have reported that human and bovine S. aureus strains appear to be largely host-adapted [Reference Smith35, Reference Zadoks36]. However, humans and cattle on farm have been found to share S. aureus strains [Reference Juhasz-Kaszanyitzky37], and S. aureus predominantly associated with humans have also been isolated from cattle [Reference Smyth38]. Milkers' hands [Reference Smith35] and milking equipment, specifically teat liners [Reference Smith35, Reference Zadoks36], have been identified to play a role in the transmission of S. aureus strains from cow to cow at milking. S. aureus has been occasionally isolated from the environment of dairy farms [Reference Smith35] and from body sites and mammary secretions of heifers prior to calving [Reference Roberson39].
Theoretical random-generated networks have been previously used to better understand the effect of movements on disease spread. Kiss et al. [Reference Kiss, Green and Kao9] constructed random networks with the same number of nodes as an observed sheep movement network but randomly allocated the edges between the nodes. The degree distribution of the farms was maintained in order to investigate the impact of the network linking pattern on the spread of disease. This approach enables the effect of the total number of links a farm has to be separated from ‘who are you linked to?’ to untangle the importance of the precise network over node in-degree. In this study we were only able to sample from a small section of the complete network over a relatively short time-frame. Thus, while some nodes may have a small in-degree for this sub-network, they may have had contacts with a large number of farms which were not common source locations in the study group. Further analysis of the dataset could, however, consider a modified approach for the generation of random networks as suggested by Kiss et al. [Reference Kiss, Green and Kao9].
Due to the trading of cattle through markets, the UK cattle movement network is highly connected. The selection and sampling of a set of farms representing a complete trading network is not feasible, especially for the study of non-notifiable diseases such as bovine mastitis. Thus, the infectious state of only a small subset of nodes can be captured, resulting in a degree of uncertainty due to the unknown infectious state of farms outside the study group. Even within the study farms, there are other factors that add to the variability, which is an intrinsic characteristic of this type of study. The presence of S. aureus bacteria in milk samples can pass undetected if the bacteria are intermittently excreted by the infected quarters or if the number of bacteria in the bulk milk is below the threshold of detection for the diagnostic method.
The principles and analytical tools presented in this paper can be employed in a larger scale study, undertaken for a longer period of time, to investigate the precise role of cattle movements and other farm relationships in disease spread. Although the selection of a particular model depends on the pathogen of interest, the specific dynamics of infection and the amount of quantitative data available [Reference Keeling and Rohani40], this modelling framework offers enough flexibility to be adapted to other infectious diseases with a different epidemiology to that of S. aureus bovine mastitis. Importantly, a simplification of the farming contact structure without considering all the connections can undermine our understanding of the transmission events at the farm level, and result in a misuse of resources in seeking to prevent disease spread.
ACKNOWLEDGEMENTS
This work has been part of a Ph.D. project funded by the Cambridge Infectious Diseases Consortium (CIDC), based at the Department of Veterinary Medicine (University of Cambridge), through their sponsors, the Department for Environment Food and Rural Affairs (Defra) and the Higher Education Funding Council for England (HEFCE) under the Veterinary Training Research Initiative (VTRI). We thank Miss Heather Lindsay for her technical support in the laboratory. We also thank members of the Rapid Analysis and Detection of Animal-Related Risks (RADAR) team at Defra for their assistance with the cattle movement data. We are grateful to all the dairy farmers who participated in this study.
DECLARATION OF INTEREST
None.


