

Introduction
Increases in the speeds of some outlet glaciers in Greenland and West Antarctica in response to recent atmospheric and oceanic warming highlight the important role of glacier speed-ups in future sea-level rise (e.g. Reference StockerStocker and others, 2013). The veracity of modeling efforts to simulate these speed-ups (e.g. Reference Larour, Seroussi, Morlighem and RignotLarour and others, 2012; Reference NickNick and others, 2013) depends on accurately characterizing sliding speed. Theories of glacier surging (e.g. Reference KambKamb, 1987; Reference Fowler, Murray and NgFowler and others, 2001) face the same challenge. Sliding speed also controls the rate of bedrock erosion by glaciers (e.g. Reference HalletHallet, 1979; Reference IversonIverson, 2012) and thus needs to be calculated in numerical models aimed at simulating the long-term topographic evolution of glaciated mountain belts and their constituent landforms (Reference Egholm, Nielsen, Pedersen and LesemannEgholm and others, 2009; Reference Herman, Beaud, Champagnac, Lemieux and SternaiHerman and others, 2011).
Intensive theoretical effort, beginning with Reference WeertmanWeertman (1957), has gone into characterizing the relationship between drag on the bed and sliding speed. Central to recent theoretical efforts for the case of glacier sliding over a rigid bed is separation of ice from leeward surfaces of bed undulations. Resultant cavities between the ice and bed initiate where the minimum compressive normal stresses on surfaces associated with sliding are overcome by water pressure (Reference LliboutryLliboutry, 1987). For sinusoidal beds commonly considered in theories (Reference LliboutryLliboutry, 1968, Reference Lliboutry1979, Reference Lliboutry1987; Reference FowlerFowler, 1986, Reference Fowler1987; Reference KambKamb, 1987; Reference SchoofSchoof, 2005), the point of separation occurs at the inflection point of the leeward bed surface (Reference LliboutryLliboutry, 1987). At progressively higher steady sliding speeds, cavities are larger, and drag on the bed increases until cavities extend down-glacier beyond the inflection point of the adjacent stoss (up-glacier-facing) bed segment. The maximum drag that the bed can support – commonly called Iken’s bound (Reference FowlerFowler, 1986, Reference Fowler1987; Reference SchoofSchoof, 2005) – is predicted to decrease if sliding speed and cavity size increase further because the maximum drag that a stoss segment of the bed can support is proportional to its maximum slope in contact with ice (Reference IkenIken, 1981; Reference SchoofSchoof, 2005). For consistency with many past studies, we call this a ‘double-valued’ drag relationship, bearing in mind, of course, that drag is double-valued only when it, rather than sliding speed, is considered to be the independent variable.
Field studies of modern glaciers have not provided the necessary test of this double-valued drag relationship or any other sliding rule. In field studies both drag on the bed, which generally differs locally from the glacier driving stress (e.g. Reference Cuffey and PatersonCuffey and Paterson, 2010), and bed properties are poorly known, even where boreholes allow access to the bed. Bed conditions also vary in time and space. Thus, efforts to empirically determine sliding rules from field measurements have yielded inconsistent relationships (e.g. Reference Raymond and HarrisonRaymond and Harrison, 1987).
To circumvent the complications of field measurements, we have used a new laboratory device (Reference Iverson and PetersenIverson and Petersen, 2011) to provide the first test of modern sliding theories that consider a rigid sinusoidal bed, no regelation, and the effect of ice/bed separation. In doing so, we adopt essentially the same reductionist viewpoint that has driven pioneering theoreticians to formulate physically based sliding models (e.g. Reference WeertmanWeertman, 1957, Reference Weertman1964; Reference LliboutryLliboutry, 1968, Reference Lliboutry1979, Reference Lliboutry1987; Reference NyeNye, 1969, Reference Nye1970; Reference KambKamb, 1970; Reference MorlandMorland, 1976; Reference FowlerFowler, 1981, Reference Fowler1986, Reference Fowler1987, Reference Fowler2010; Reference IkenIken, 1981; Reference SchoofSchoof, 2005): that secure understanding of slip over simplified beds is a prerequisite for confident application of sliding rules to realistic glacier beds. We begin by discussing past relevant laboratory experiments, which have either not isolated the important effects of regelation and ice/bed separation or have been insufficient to yield steady-state relationships among sliding speed, basal drag, effective pressure and ice/bed separation.
Previous Experimental Studies
There have been relatively few laboratory studies of sliding and none that provides a test of recent sliding models (Reference FowlerFowler, 1986, Reference Fowler1987; Reference SchoofSchoof, 2005; Reference Gagliardini, Cohen, Råback and ZwingerGagliardini and others, 2007) that emphasize ice/bed separation and neglect regelation. Motivation for emphasizing ice/bed separation comes from both extensive evidence of cavities on formerly glaciated bedrock (e.g. Reference Walder and HalletWalder and Hallet, 1979; Reference Hallet and AndersonHallet and Anderson, 1980; Reference Hooyer, Cohen and IversonHooyer and others, 2012) and their centrality in models of glacier surging (Reference KambKamb and others, 1985; Reference KambKamb, 1987), hydrology (Reference WalderWalder, 1986; Reference KambKamb, 1987; Reference SchoofSchoof, 2010) and bedrock erosion (Reference HalletHallet,1996; Reference IversonIverson, 2012). Motivation for neglecting regelation comes from the common scarcity on formerly glaciated bedrock of obstacles sufficiently small to be accommodated mainly by regelation (Reference KambKamb, 1970; Reference HookeHooke, 2005), which probably reflects the tendency for small obstacles to be worn flat by abrasion (Reference HookeHooke, 2005).
Two widely cited sets of laboratory experiments explored relationships between shear stress, normal stress and sliding speed for ice dragged over surfaces with irregular microscopic to sub-centimeter roughness elements (Reference Barnes, Tabor and WalkerBarnes and others, 1971; Reference Budd, Keage and BlundyBudd and others, 1979). Many of these experiments were conducted at sub-freezing temperatures (Reference Barnes, Tabor and WalkerBarnes and others, 1971). In experiments with temperate ice, partitioning between regelation and viscous deformation of ice was unknown, but the small sizes of obstacles, with thermal conductivities either equal to or greater than rock, made regelation difficult to preclude, if not likely. Cavity formation in Reference Budd, Keage and BlundyBudd and others (1979), if it occurred, was of unknown extent, and the degree to which water pressure at the sliding interface may have reduced the effective normal stress to values below the applied normal stress was unknown. Worth noting is that Reference Barnes, Tabor and WalkerBarnes and others (1971) measured a double-valued sliding relationship, but decreasing drag with increasing speed occurred at speeds that greatly exceeded those relevant to glacier sliding and for reasons unrelated to ice/bed separation.
In subsequent experiments with better temperature control, larger, laterally adjacent streamlined obstacles (15 mm high, 60 mm wide, 160 mm long) were pushed under a temperate block of ice held fixed and under a steady normal stress (Reference Hooke and IversonHooke and Iverson, 1985). Although there was no regelation, heat transfer inward from the perimeter of the apparatus caused melting on the up-glacier sides of the bumps that accounted for 25% of the total motion. Although cavities formed in lee of the obstacles, whether they reached a steady size was unknown because the volume of the ice-cavity system was not measured. In addition, the obstacles were isolated longitudinally; thus, the fundamental interaction between cavities and the stoss surfaces of obstacles immediately downstream, which gives rise to the double-valued sliding relationship of some theoretical models (Reference LliboutryLliboutry, 1968, Reference Lliboutry1979, Reference Lliboutry1987; Reference FowlerFowler, 1986, Reference Fowler1987; Reference SchoofSchoof, 2005), was not studied.
The most ambitious previous laboratory study of glacier sliding used the Couette-type viscometer, ‘Penelope’, to rotate a ring of ice around a central cylinder, which was mildly elongated to form two diametrically opposed and symmetrical bumps (∼30mm high with circumferential lengths of ∼500 mm) (Reference BrepsonBrepson, 1979; Reference MeyssonnierMeyssonnier, 1989). In experiments conducted with temperate ice (Reference BrepsonBrepson, 1979), cavities formed. Whether they reached a steady size was unknown, and steady drags at a particular sliding speed were not achieved. No relationship between sliding speed and bed shear stress was determined. In later experiments with the same device, steady cavity sizes and bed shear stresses were achieved, but experiments were conducted at sub-freezing temperatures (–0.5 to –1.0°C) (Reference MeyssonnierMeyssonnier, 1989). No relationship between sliding speed and bed shear stress was reported.
Methodology
We have built and used a major new laboratory device to study subglacial processes, with an initial focus on ice/bed separation (Reference Iverson and PetersenIverson and Petersen, 2011) during sliding and the relationship between sliding speed and drag on the bed. The device rotates a ring of ice at its pressure-melting temperature across a rigid or sediment bed under a prescribed effective pressure. Capabilities of the device include unlimited slip displacement, temperature control of the ice and bed to 0.01°C, free movement of ice normal to the bed associated with ice/bed separation, and development of ice with a structure like the basal ice of glaciers (Reference Iverson and PetersenIverson and Petersen, 2011). Either sliding speed or basal drag is controlled while the other variable is measured. We use the device in both of these modes to develop a drag rule for glacier sliding over a rigid sinusoidal bed (Fig. 1) subject to cavity formation in the lee sides of bed undulations and negligible regelation. Also, a flat bed is used to measure minor background drag resulting from boundary effects unrelated to bed geometry.
Schematic of the ice ring and sinusoidal bed. An annular plate with teeth grips the upper surface of the ring and drags it across the bed. The ring also slides along smooth walls that confine it along its sides. See Reference Iverson and PetersenIverson and Petersen (2011) for more details.

Device
A ring of ice, 0.90m in outside diameter, 0.20m wide and ∼0.21 m thick, is contained within a U-shaped chamber and dragged at its upper surface across the bed (Fig. 1). A vertical stress, held steady to within 2%, is applied to the ice with a hydraulic ram, and the ram contracts or extends to accommodate cavity expansion or contraction, respectively, at the bed. This extension or contraction is measured and allows cavity volume to be determined. Cavities are connected to drains that can be held open at atmospheric pressure or closed, so that the bed can be pressurized with water. The upper surface of the ice ring is rotated at either a constant speed or a constant drag. Two video cameras look through windows in the outside walls to track markers placed in the ice that record sliding displacement and speed. The apparatus resides in a cold room kept at 1 ± 10.5°C. To keep the ice ring at the pressure-melting temperature while minimizing melting and thereby optimizing the durations of experiments, the temperature of the ice chamber is controlled to ∼0.01°C using a glycol/water mixture that circulates in a bath around the chamber. A fluid circulator outside the cold room both pumps the fluid and regulates its temperature. Thermistors, calibrated to 0.01°C, record temperatures in the bed and lateral walls of the chamber. After sliding is finished and experiments are over, a winch allows the ice ring to be withdrawn from the chamber fully intact, so that the ice can be analyzed. Mechanical components are held rigid in a 2.9 m high aluminum-andsteel loading frame. Other details of the device and its function can be found in Reference Iverson and PetersenIverson and Petersen (2011).
Bed
The bed for these experiments is designed to test theories of sliding that idealize glacier beds as sinusoids with wavelengths sufficiently large to make regelation negligible, so that ice moves past undulations mainly by enhanced creeping flow (Reference LliboutryLliboutry, 1968, Reference Lliboutry1979; Reference FowlerFowler, 1986, Reference Fowler1987; Reference SchoofSchoof, 2005). At the center line of the experimental sinusoidal bed, its wavelength is 183 mm and amplitude is 15.3 mm. To inhibit regelation past these undulations, the bed is made of polyoxymethylene plastic (Delrin®), which has a low thermal conductivity (0.33 W m–1 °C–1) relative to rocks. Based on the sliding theory of Reference KambKamb (1970), the controlling wavelength for the plastic bed, below which regelation is expected to be dominant, is 6–55 mm, for bounding sliding speeds of these experiments of 400– 0.5ma–1, respectively, at the ice-ring center line. Thus, minimal regelation is expected experimentally. The wavelength and amplitude of the experimental bed decrease from the outside to the inside wall of the annulus to keep the slopes of the sinusoid uniform across the width of the annulus. The slope of stoss surfaces controls the drag in theories of glacier sliding with ice/bed separation (Reference IkenIken, 1981; Reference SchoofSchoof, 2005; Reference Gagliardini, Cohen, Råback and ZwingerGagliardini and others, 2007).
Procedure
An ice ring is constructed by adding millimeter-scale, crushed deionized ice particles in successive layers (∼15 mm thick) to the chamber and saturating each layer with deionized water, so that randomly oriented crystals grow as the water in each layer is allowed to freeze (Reference BrepsonBrepson, 1979; Reference Iverson and PetersenIverson and Petersen, 2011). Plastic beads are frozen into the ice to track its displacement and internal deformation during sliding. Once the ice ring is built, a toothed, horizontal polyoxymethylene plate (upper platen) is lowered onto the ring’s upper surface and frozen into place. A vertical stress of ∼250 kPa is applied to the ice, and over a period of ∼4 days the ice ring is brought to the pressure-melting temperature by incrementally fine-tuning the temperature of the circulating glycol/water mixture. Once temperatures recorded by thermistors and contraction of the ice chamber induced by melting indicate that the ice is at the pressure-melting temperature, the vertical stress is then increased to its ultimate value: 500 kPa in these experiments. The associated decrease in temperatures recorded by thermistors in the bed and chamber walls provides independent confirmation that the ice is at the pressure-melting temperature (Reference Cuffey and PatersonCuffey and Paterson, 2010; Reference Iverson and PetersenIverson and Petersen, 2011).
Sliding is started by rotating the upper platen either at a steady rate, while recording the associated bed shear stress with a torque sensor, or at a steady bed shear stress, while measuring rotation rate and the associated sliding speed. The device can operate in rate-controlled mode down to centerline sliding speeds of 7.25 m a–1; at lower speeds, bed shear stress is controlled and speed is measured. Two to 14 days elapse as the uncontrolled variable – bed shear stress or sliding speed – approaches a steady time-averaged value (Fig. 2). Expansion of the ice chamber due to cavity growth during the transient phase halts once steady cavity sizes are achieved, as indicated by a slow, steady rate of ice-chamber contraction due only to melting of the ice-ring perimeter. Valves that regulate water flow from the bed are left open in these experiments, so that water pressure in cavities is atmospheric, and effective stress is equal to the total vertical stress. Once steady-state sliding at a steady cavity size is achieved, either the rotation rate or bed shear stress is again incremented, followed by the eventual attainment of a new steady state. Sliding speed is sometimes decremented to demonstrate that subsequent steady-state values of bed shear stress are not dependent on the sign of the change in sliding speed.
Evolution to a steady shear stress. Raw data demonstrating the development of steady drag following an increase in sliding speed from 14.5 m a–1to 29 m a–1.After an increase in speed (denoted by the arrow), there is a sudden increase in shear stress, with an additional 2–14 days to evolve to a new steady value.

After experimental durations of 2–3 months, sliding is stopped, the upper platen retracted, and the ice ring withdrawn from the chamber for analyses. Total strain in the basal ice is measured from displacements of beads. The geometry of the sole of the ice ring is measured along circumferential transects to evaluate the steady cavity geometry that persisted during the final phase of the experiment. Ice is cut into thin sections for crystal-fabric analyses with a universal stage (Reference LangwayLangway, 1958). A total of three experiments were necessary to gather these data with development of the apparatus over the previous 6 years.
Results
In experiments, depending upon whether sliding speed or shear stress is controlled, either steady shear stresses (Fig. 2) or steady sliding speeds develop with sufficient sliding displacement as cavities attain a steady size. At higher sliding speeds, steady cavities are larger and extend farther up the stoss bed segment immediately downstream (Fig. 3). In some cases, cavities extend well beyond the point of maximum slope of the stoss surface (Fig. 3), within the range in which Iken’s bound on drag should decrease with increasing sliding speed. At the ends of experiments cavity geometry is measured directly and predicted well using the ice/bed separation theory of Reference KambKamb (1987) (Fig. 3), as adapted for an appropriate power-law ice rheology. This theory, therefore, provides the basis for estimating cavity shapes and positions in Figure 3 from measured volumes of cavities (see Appendix).
Cavities at the bed due to sliding. Longitudinal profiles of cavities at the ice-ring center line at sliding speeds of 2.6, 7.25 and 290 ma– 1 (gray lines), under a total vertical stress of 500kPa and atmospheric pressure in cavities. Cavity geometry at 290 m a–1 was both measured directly (crosses) and fitted (gray line) using the theory of Reference KambKamb (1987), as described in the Appendix. Error bars indicate ± 1σ of variability based on measurements of multiple cavities. Note the exaggerated vertical scale.

Measured values of steady shear stress (bed-parallel drag force divided by bed area) supported by the sinusoidal bed demonstrate a double-valued drag response as a function of sliding speed (Fig. 4). At low sliding speeds (<7.3ma–1) cavities are small (Fig. 3), and drag increases with speed. At progressively larger steady speeds (up to 350ma– 1) and cavity sizes, there is a marked decrease in drag, of up to 50% if cavities cover ∼93% of the bed (Fig. 3). Cavity size at the speed at which drag peaks (Fig. 3) is close to the threshold size at which Iken’s bound is predicted to start declining with further increases in speed (Reference SchoofSchoof, 2005). Background drag measured with a flat bed is small (∼9 kPa) and independent of sliding speed (Fig. 4).
Drag on the bed. Mean steady shear stress as a function of sliding speed for a sinusoidal bed and a flat bed. Error bars indicate ± 1σ from the mean, once a time-averaged steady stress or speed was reached (e.g. Fig. 2). The speeds (2.6, 7.25 and 290m a–1) correspond to the cavity geometries of Figure 3. The solid line is the sum of the shear stress estimated using a theory of sliding in the presence of cavities (Reference LliboutryLliboutry, 1968, Reference Lliboutry1979) and the background shear stress measured with the flat bed.

Highly deformed ice near the bed exhibits fabrics with preferentially aligned c-axes, as expected for ice at the pressure-melting temperature subjected to strain approximating simple shear (Reference Cuffey and PatersonCuffey and Paterson, 2010) (Fig. 5). The c-axis orientations have a unimodal distribution around the vector normal to the roughly horizontal shear plane. Initially c-axes were nearly randomly oriented and likely developed preferred orientation at low strains (<1) (Reference Iverson and PetersenIverson and Petersen, 2011). The grains have an average diameter of 7 mm and have undergone extensive recrystallization, as demonstrated by their polygonal shape and triple-point junctions (Reference Alley, Gow and MeeseAlley and others, 1995). Thus, although the experimental ice is synthetic, at strains required for steady-state sliding ice has begun tertiary creep and is structurally similar to ice near glacier beds.
Ice crystal fabric. (a) A horizontal thin section of ice from an experiment, under cross-polarized lenses. Ice was collected from ∼1 mm above the cavity ceiling after a total sliding displacement at the ice-ring center line of 6.51 m. The grid squares are 10mm. (b) The c-axis orientations of 150 crystals on a lower-hemisphere, equal-area plot, with a contour interval of 20σ. The c-axes are centered on the vector normal to the shear plane. Both panels are oriented with respect to the sense of shear indicated.

Discussion
Theory
Although many theories of glacier sliding address ice/bed separation (Reference LliboutryLliboutry, 1968, Reference Lliboutry1979, Reference Lliboutry1987; Reference FowlerFowler, 1986, Reference Fowler1987; Reference SchoofSchoof, 2005), we use the analysis of Lliboutry because he first emphasized the effect of ice/bed separation on sliding (Reference LliboutryLliboutry, 1959, Reference Lliboutry1965) and provided an explicit estimation of drag on a single sinusoid (Reference LliboutryLliboutry, 1968, Reference Lliboutry1979). A sinusoid of amplitude a is considered, of sufficient wavelength, λ, that regelation is negligible and a ≪ λ, as in our experiments. The sinusoid is considered to be smooth, and the ice is considered to contain no rock debris, so that the local slope of the bed supports only stresses normal to it. The bed considered is two-dimensional (2-D), so it differs from the bed of the experiment that has amplitude increasing towards the outer wall of the sample chamber (Fig. 1). However, the key variable that influences drag – the local bed slope – is uniform radially in the experiment, so the 2-D theory should approximate the relationship between drag and speed at the ice-chamber center line.
For a sinusoid of angular frequency (i.e. wavenumber), ω = 2π/λ, and in a direction, x, parallel to the regional bed slope, the bed shear stress (drag force per unit bed area), τ, is
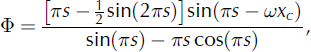
(Reference LliboutryLliboutry, 1979, eqn 88). N is equal to the effective pressure of the experiments, and Φ is a coefficient dependent on the fraction, s, of the bed in contact with ice and on the position, xc , where ice separates from the bed:
with xc obtained from

(Reference LliboutryLliboutry, 1968, modified from eqns 14 and 9, respectively, therein). We estimate s in these equations as a function of sliding speed using the theory of Reference KambKamb (1987), as described in the Appendix.
Lliboutry’s theory, together with Reference KambKamb’s (1987) model to estimate ice/bed separation, provides an approximate fit to the experimental double-valued drag relationship (Fig. 4). Parameter values of the experimental bed at the center line of the ice-chamber annulus and flow-law parameter values for temperate ice used in the theory are listed in Table 1. The background drag measured with the flat bed, resulting from boundary effects unrelated to drag on the sinusoid, was added to the theoretical result to allow an appropriate comparison with the measured drag on the sinusoid.
Parameter values from the experiment

Implications
This demonstration of a double-valued drag relationship (Fig. 4) reinforces results of some analytical and numerical sliding models, including those that incorporate more complex 2-D bed geometries (Reference LliboutryLliboutry, 1968, Reference Lliboutry1979, Reference Lliboutry1987; Reference FowlerFowler, 1986, Reference Fowler1987; Reference SchoofSchoof, 2005; Reference Gagliardini, Cohen, Råback and ZwingerGagliardini and others, 2007): above a certain sliding speed, any further increase in speed will result in a reduction in basal drag. The sliding speed at which drag begins to decrease will, of course, increase with increasing effective pressure. This ‘rate-weakening’ is in contrast with the Weertman-style sliding rule that is commonly used in numerical models of glaciers and ice sheets (Reference HuybrechtsHuybrechts, 1993; Reference PattynPattyn and others, 2008), in which basal drag is assumed to increase monotonically with increasing sliding speed (Reference WeertmanWeertman, 1957; Reference FowlerFowler, 2010). Thus, if changes in glacier boundary conditions, such as break-up of ice shelves (Reference Scambos, Bohlander, Shuman and SkvarcaScambos and others, 2004) or decreases in effective pressure at the bed due to increased surface-water input (Reference Zwally, Abdalati, Herring, Larson, Saba and SteffenZwally and others, 2002; Reference Bartholomaus, Anderson and AndersonBartholomaus and others, 2011), drive increases in sliding speed, models do not generally account for potentially increased ‘slipperiness’ of beds or bed patches consisting of either rock or rigid, immobile sediment.
An obvious and important question is whether more realistic bed geometries would also result in a double-valued drag relationship. The rate weakening of this relationship ultimately requires that higher sliding speeds and larger cavities cause ice to be in contact with progressively lower sloping stoss surfaces. Given that the stoss surfaces of bumps on deglaciated bedrock surfaces are usually convex (e.g. Reference Benn and EvansBenn and Evans, 2010), larger cavities will indeed tend to cause ice to be in contact with generally smaller local slopes at higher sliding speeds, even for major departures from a sinusoidal geometry. On the other hand, the three-dimensionality of real glacier beds will tend to reduce the degree to which bumps line up along a flowline, thereby limiting the degree to which cavities ‘drown’ stoss surfaces immediately down-glacier. This effect, applied to bumps with convex stoss surfaces, will likely reduce the degree of rate weakening from that displayed in Figure 4 but not eliminate it. Another complexity of real glacier beds is that a variety of wavelengths is present, unlike in the experiments, but Reference SchoofSchoof (2005) has shown that this variety does not eliminate rate-weakening drag. Thus, there is reason to believe that a double-valued drag rule, albeit possibly different in its details from the one in Figure 4, might apply to real glacier beds or parts of them.
Implications of this decreased drag with increasing sliding speed could be profound (Reference SchoofSchoof, 2005; Reference Cuffey and PatersonCuffey and Paterson, 2010). For a glacier with the downslope component of its weight resisted solely by drag on a rough, rigid bed, a spatially uniform increase in sliding speed could promote unbounded glacier acceleration and associated ice avalanching, which occurs but rarely (e.g. Reference IkenIken, 1977). Much more commonly the gravitational driving force for flow must be supported elsewhere, such as by slow-moving ice or valley walls at the glacier’s sides, by ice shelves, or by other parts of the bed that for geometrical or hydrological reasons can support increased drag. The result of this stress transfer will be increased strain rates balanced by larger longitudinal and lateral deviatoric stresses that will promote even more rapid glacier flow. Thus, given this potential importance of rate-weakening drag at the bed and the possibility that it applies to realistic bed geometries, experimenting with double-valued drag rules in ice-sheet models seems well motivated.
Acknowledgements
We thank T. Herrman and D. Jones of the US Department of Energy Ames Laboratory for their help designing and fabricating the device, and I. McBrearty for laboratory assistance. We also thank C. Schoof for his help clarifying aspects of his sliding theory. Construction and use of the device were made possible by grants from the US National Science Foundation: ANT-0618747 and EAR-1023586. The data from these experiments are archived at Iowa State University.
Appendix: Ice/Bed Separation
Cavity geometries for two bed types, stepped (staircase-like with horizontal treads) and sinusoidal, can be estimated using the models of Reference KambKamb (1987). The models balance closure rate of cavities by ice creep with their opening by sliding to estimate their steady geometries. Estimates for each bed type were compared with the geometries of cavities measured at the completion of sliding.
Estimates derived from Kamb’s sinusoidal-bed model result in a poor fit between predicted and measured cavity geometries (rms misfit = 0.006), whereas Kamb’s cavity model for a stepped bed, adapted approximately for a nonlinear ice rheology, provides an order-of-magnitude improvement to the fit with measured data (rms misfit = 0.0002) (Fig. 3). For the case of a cavity in the lee of an isolated step, Kamb determined the cavity height g(x) as function of the bump height, h, and cavity length, l, where x is the distance downstream from the step riser along the horizontal bed:

where 0 < x < l. Kamb determined the cavity length for the case of a linear-viscous rheology but suggested an approximation for the power-law rheology of ice. For the case of negligible melting of cavity roofs by water – applicable to the experimental results – the approximation is

where v is the sliding speed, N is the effective pressure (ambient ice pressure minus cavity water pressure) and B is the viscosity parameter in Glen’s power-law flow rule for ice creep, with stress exponent n (Reference Iverson and PetersenIverson and Petersen, 2011). Equations (A1) and (A2) are used to estimate cavity geometry for the sinusoidal bed of the experiment by considering h to be twice the amplitude of the sinusoid and extending the cavity roof as predicted by Eqn (A1) until it is truncated by the ascending limb of the sinusoid immediately downstream. Thus, the cavity lengths for the sinusoidal bed (Fig. 3) are smaller than indicated by Eqn (2), which applies to a flat, horizontal tread. Parameter values from the experiment (Table 1) are h = 30.6 mm and N = 500 kPa, with n = 3, the widely accepted value (Reference Cuffey and PatersonCuffey and Patterson, 2010), and B = 6.3 × 10⁷ Pa s1/3, a value that optimizes the fit of Eqn (A1) to measured cavity roofs and is close to the value advocated for clean, glacier ice at its pressure-melting temperature (B = 7.5 × 10⁷ Pa s1/3; Reference Cuffey and PatersonCuffey and Paterson, 2010).
The Kamb stepped-bed model of cavities provides a better fit to the data likely because, unlike the sinusoidal-bed model, it is not predicated on an assumption about the distribution of normal stress between ice and the bed where they are in contact. Given the good fit to the data provided by the stepped-bed model (Fig. 3), it is used to determine cavity shape and position from measured volumes of cavities prior to the ends of experiments when cavity geometries could not be measured directly. As such, it is also used to estimate drag on the bed from the theory of Reference LliboutryLliboutry (1968, Reference Lliboutry1979).


