


1. Introduction
Ice shelves play a central role in the dynamics of marine ice sheets, serving as buffers that regulate the discharge of grounded ice into the ocean. Following the pioneering work of MacAyeal (Reference MacAyeal1989), ice shelves are most commonly modeled as thin membranes of ice that spread horizontally in response to gravitational driving stress. This so-called Shallow Shelf Approximation (SSA), has been widely used to model the flow of ice shelves at scales of tens to hundreds of kilometers, with most modern continent-scale models employing this approximation over ice shelf regions (Seroussi and others, Reference Seroussi2020). SSA does not, however, capture all observed types of ice shelf deformation. Although it has been appreciated for decades that flexural motion occurs at ice fronts (Reeh, Reference Reeh1968), this topic has taken on new importance as recent work has related flexure to catastrophic ice shelf collapse through hydrofracture (Banwell and others, Reference Banwell, Willis, Stevens, Dell and MacAyeal2024).
Ice shelf flexure has profound implications for ice shelf stability (Robel and Banwell, Reference Robel and Banwell2019; Coffey and others, Reference Coffey, MacAyeal, Copland, Mueller, Sergienko, Banwell and Lai2022), as evidenced by the catastrophic breakup of the Larsen B Ice Shelf in 2002 (Scambos and others, Reference Scambos, Bohlander, Shuman and Skvarca2004). During this event, the rapid drainage of surface meltwater lakes induced flexural stresses, propagating fractures and triggering a chain reaction of lake drainage (Banwell and others, Reference Banwell, MacAyeal and Sergienko2013; Robel and Banwell, Reference Robel and Banwell2019). These processes not only culminated in the disintegration of the shelf within weeks (Scambos and others, Reference Scambos, Hulbe and Fahnestock2003), but also caused a measurable acceleration in ice flow, amplifying the impact on upstream ice dynamics (Rignot and others, Reference Rignot, Casassa, Gogineni, Krabill, Rivera and Thomas2004; Scambos and others, Reference Scambos, Bohlander, Shuman and Skvarca2004). Similar mechanisms are believed to threaten the structural integrity of the Larsen C Ice Shelf (Buzzard and others, Reference Buzzard, Feltham and Flocco2018), where surface melt and ponding has been observed (Hubbard and others, Reference Hubbard2016; Bevan and others, Reference Bevan, Luckman, Hendon and Wang2020; Banwell and others, Reference Banwell, Wever, Dunmire and Picard2023). Ice shelf flexure also plays a role in rumple formation where ice flow is stabilized against pinning points (LaBarbera and MacAyeal, Reference LaBarbera and MacAyeal2011; Still and others, Reference Still, Campbell and Hulbe2019), surface adjustments to basal melting (Adusumilli and others, Reference Adusumilli, Fricker, Medley, Padman and Siegfried2020) or basal channel formation (Chartrand and others, Reference Chartrand, Howat, Joughin and Smith2024), and ice-shelf motion caused by long-period ocean swell (Lipovsky, Reference Lipovsky2018; Massom and others, Reference Massom, Scambos, Bennetts, Reid, Squire and Stammerjohn2018).
MacAyeal and others (Reference MacAyeal, Sergienko, Banwell, Macdonald, Willis and Stevens2021) developed the theoretical groundwork for a coupled flow-flexure model by combining the SSA with the Kirchoff-Love approximation for thin-plate flexure (Braess, Reference Braess2007). Henceforth referred to as the “M21 model,” this framework offers a computationally efficient approach to exploring flow-flexure interactions with reasonable accuracy, albeit under simplifying assumptions. The M21 model is an example of a viscoelastic beam-column model in that it accounts for both in-plane stresses and out-of-plane flexure (Biot, Reference Biot1961). MacAyeal and others (Reference MacAyeal, Sergienko, Banwell, Macdonald, Willis and Stevens2021) demonstrate that their model is able to capture a range of the flexural behaviors discussed above.
The M21 model has several limitations. MacAyeal and others (Reference MacAyeal, Sergienko, Banwell, Macdonald, Willis and Stevens2021) rely on the proprietary software COMSOL, which restricts reproducibility and accessibility due to cost and licensing constraints. This reliance limits broader adoption within the glaciology community and presents challenges for integrating the model into open-source, large-scale ice sheet modeling frameworks. Additionally, the M21 model does not incorporate fracture mechanisms, which are critical for capturing the evolution of ice shelves under cascading lake-drainage scenarios like that which caused the collapse of the Larsen B. Finally, beam-column models like M21 are well known to exhibit a buckling instability whereby in-plane compression results in unstable out-of-plane motion (Budiansky, Reference Budiansky1974). While M21’s capacity to produce buckling is a desirable feature—allowing the representation of ice shelf rumples as compressional structures near pinning points—the associated instability, in practice, prevents these setups from running over the decades-long timescales relevant to much of glaciological research (as discussed by MacAyeal and others, Reference MacAyeal, Sergienko, Banwell, Macdonald, Willis and Stevens2021, in their Appendix A).
To address these limitations, we present a modified version of the M21 model that leverages freely available Python libraries, including Firedrake (Rathgeber and others, Reference Rathgeber2016) and icepack (Shapero and others, Reference Shapero, Badgeley, Hoffman and Joughin2021). Our key modification is the inclusion of a fracture mechanism, improving on the M21 model by expanding it into a coupled flow-flexure-fracture framework, hereafter referred to as the “3F model.” Ice shelf fracture has been described in many different ways, including using linear elastic fracture mechanics (Lai and others, Reference Lai2020; Lipovsky, Reference Lipovsky2020; Zarrinderakht and others, Reference Zarrinderakht, Schoof and Peirce2024), continuum damage (Borstad and others, Reference Borstad, Rignot, Mouginot and Schodlok2013; Sun and others, Reference Sun, Cornford, Moore, Gladstone and Zhao2017; Huth and others, Reference Huth, Duddu, Smith and Sergienko2023), and geometric approaches (Levermann and others, Reference Levermann, Albrecht, Winkelmann, Martin, Haseloff and Joughin2012). We choose to model distributed fracture by incorporating plasticity into the constitutive relation of ice. This approach assumes that stresses are bounded by a finite yield envelope (Figure 1). A plastic response of ice is well documented in laboratory studies (Schulson and Duval, Reference Schulson and Duval2010, Ch. 12). Bassis and Walker (Reference Bassis and Walker2012) considered a specific type of plasticity, Coulomb plasticity, to describe near-terminus fracture that gives rise to fundamental limits on the thickness of marine ice cliffs. We modify this treatment to allow plastic deformation elsewhere on the ice shelf, not just at the front.
Our choice of describing fracture via plasticity is largely motivated by the ability of this mechanism to simultaneously address the numerical instability of the M21 model in rumpling regimes, while also providing a representation of hyrofracture—the process which motivated the development of ice shelf flow-flexure models in the first place. Where MacAyeal and others (Reference MacAyeal, Sergienko, Banwell, Macdonald, Willis and Stevens2021) introduced heuristic approaches to circumvent the buckling instability (for example, by cutting off inflow to prevent rumples from exponentially increasing in amplitude), plasticity provides a natural means of limiting the flexural stresses which would otherwise permit uncontrolled rumple growth. Meanwhile, modeling distributed fractures with plasticity establishes a physically motivated link between material failure and lake drainage, as plastic deformation enhances permeability through shear dilatancy, allowing enhanced drainage (Segall and Rice, Reference Segall and Rice1995).
We begin by describing the governing equations of the original M21 model and the extension to the 3F model through the introduction of plasticity. We then evaluate the model’s performance through idealized test cases that represent key ice shelf behaviors, providing insight into the dynamics of flow, flexure, and fracture without oversimplifying critical processes. Finally, we discuss the broader implications of these findings for ice shelf modeling and identify directions for future research.
2. M21 viscous flow theory
The theory for the coupled dynamics of viscoelastic flow and flexure in ice shelves was presented by MacAyeal and others (Reference MacAyeal, Sergienko, Banwell, Macdonald, Willis and Stevens2021). Here, we specialize the viscoelastic M21 model to the purely viscous case by neglecting elastic effects, thereby focusing on longer timescales. In this section, we highlight key aspects of the M21 model, with modifications tailored to incorporate plasticity. We closely follow the original derivations, employing vector-tensor notation and introducing slight redefinitions where beneficial. A glossary of all symbols used can be found in Appendix A (Table A1).
We denote the horizontal coordinates as x and y; for convenience, we use two vertical coordinates: ζ, whose zero value lies at the vertical midpoint of the shelf, and z, whose zero value lies at sea level. The shelf has thickness  $H(x, y, t)$, so the position of the ice shelf surface and base correspond to $\zeta = \frac{H}{2}$ and $\zeta = -\frac{H}{2}$, or z = s and z = b. We denote the horizontal velocity vector $\vec{u} = [u_x(x, y, t), u_y(x, y, t)]$ and note that horizontal velocities are depth-invariant under the SSA. We denote the vertical deflection $\eta(x, y, t)$ and the corresponding deflection rate $\dot{\eta}(x, y, t) = \frac{\partial\eta}{\partial t}$, and we note that deflections are depth-invariant in the thin-beam approximation used in M21.
The effective dynamic viscosity, ν, is taken to be identical in the constitutive relations for both flow and flexure, and its value is a nonlinear function of the flow stress (as described by Glen’s Flow Law with n = 3). For simplicity, we assume isothermal ice (i.e.,  $\nu = \overline{\nu}$, where the overline denotes depth-averaged quantities). While this assumption is not essential, and more general relationships can be derived by following the procedures detailed in M21, our simplification aligns with the numerical implementations therein.
2.1. Constitutive relation
We consider a nonlinear viscous constitutive relation that relates the deviatoric stress to the strain rates from both in-plane flow and vertical flexure (Equation 14 from M21)
 \begin{equation}
\boldsymbol{\tau} = 2\nu\dot{\boldsymbol{\varepsilon}} - 2\nu\zeta\dot{\boldsymbol{\kappa}}.
\end{equation}
\begin{equation}
\boldsymbol{\tau} = 2\nu\dot{\boldsymbol{\varepsilon}} - 2\nu\zeta\dot{\boldsymbol{\kappa}}.
\end{equation} In this expression, τ denotes the 2D deviatoric stress tensor, and  $\boldsymbol{\dot{\varepsilon}} = \frac{1}{2}\nabla\vec{u} + \frac{1}{2}\nabla^T\vec{u}$ denotes the strain rate tensor from the in-plane flow field. In a purely viscous material, $\dot{\boldsymbol{\kappa}}$ is the Hessian of the vertical deflection rate, with $\dot{\boldsymbol{\kappa}} = \nabla\nabla\dot{\eta}$. The diagonal entries of $\dot{\boldsymbol{\kappa}}$ correspond to pure bending along the axes, while the off-diagonal terms correspond to torsion. The first term on the right represents the deviatoric stress from in-plane flow, while the second term on the right corresponds to the deviatoric stress induced by vertical deflections from bending.
Since we are considering the case where an ice shelf has vertically homogeneous viscosity, we assume an isothermal structure without any variability in crystal fabric or other complicating factors. In this case, the only term in Equation 1 that varies vertically is the vertical coordinate ζ itself. This allows for a simplified expression for the depth-averaged deviatoric stress, which will later be used in deriving the SSA. By symmetry of vertical integration from the basal elevation  $\zeta = -\frac{H}{2}$ to the surface elevation $\zeta = \frac{H}{2}$, all terms linear in ζ vanish upon depth-averaging, resulting in
 \begin{equation}
\overline{\boldsymbol{\tau}} = 2\overline{\nu}\dot{\boldsymbol{\varepsilon}}.
\end{equation}
\begin{equation}
\overline{\boldsymbol{\tau}} = 2\overline{\nu}\dot{\boldsymbol{\varepsilon}}.
\end{equation}Thus, the flexural contribution to the deviatoric stress does not matter in a depth-averaged sense.
2.2. Pressure
We assume that the vertical force balance follows the hydrostatic approximation (Greve and Blatter, Reference Greve and Blatter2009). That is, neglecting the bridging terms  $\frac{\partial}{\partial x}\tau_{xz}$ and $\frac{\partial}{\partial y}\tau_{yz}$, we depth-integrate the vertical momentum balance from arbitrary ζ to the surface $\zeta = \frac{H}{2}$, obtaining pressure as
 \begin{equation}
p = \rho_ig\left(\frac{H}{2} - \zeta\right) + s_{zz},
\end{equation}
\begin{equation}
p = \rho_ig\left(\frac{H}{2} - \zeta\right) + s_{zz},
\end{equation} where  $s_{zz} = \sigma_{zz} + p$ is the vertical normal deviatoric stress. This term can be recovered from the horizontal deviatoric stress tensor via $s_{zz} = -\operatorname{tr}(\boldsymbol{\tau})$. Taking the trace of Equation 1, it follows that
 \begin{equation}
p = \rho_ig\left(\frac{H}{2} - \zeta\right) - 2\nu \operatorname{tr}(\dot{\boldsymbol{\varepsilon}}) + 2\nu\zeta\operatorname{tr}(\dot{\boldsymbol{\kappa}}).
\end{equation}
\begin{equation}
p = \rho_ig\left(\frac{H}{2} - \zeta\right) - 2\nu \operatorname{tr}(\dot{\boldsymbol{\varepsilon}}) + 2\nu\zeta\operatorname{tr}(\dot{\boldsymbol{\kappa}}).
\end{equation} This expression will later be used in evaluating the bending moment. Toward constructing the SSA under a flow-flexure regime, we also record the depth-averaged pressure,  $\overline{p}$, below. As previously noted, all terms linear in ζ vanish upon depth-averaging, giving
 \begin{equation}
\overline{p} = \rho_ig\frac{H}{2} - 2\overline{\nu}\operatorname{tr}(\dot{\boldsymbol{\varepsilon}}).
\end{equation}
\begin{equation}
\overline{p} = \rho_ig\frac{H}{2} - 2\overline{\nu}\operatorname{tr}(\dot{\boldsymbol{\varepsilon}}).
\end{equation}2.3. Horizontal momentum balance: shallow shelf approximation (SSA)
The horizontal momentum balance can be expressed in terms of stresses as (M21, Equation 42)
 \begin{equation}
\nabla\cdot H(\overline{\boldsymbol{\tau}} - \overline{p}\mathbf{I}) = -\rho_{sw}gb\nabla b,
\end{equation}
\begin{equation}
\nabla\cdot H(\overline{\boldsymbol{\tau}} - \overline{p}\mathbf{I}) = -\rho_{sw}gb\nabla b,
\end{equation}where I is the two-by-two identity, ρsw is the density of seawater, and b is the basal elevation. Under the typical assumption of isostatic equilibrium, b would be expressed in terms of either the thickness H or the surface elevation s. However, to accommodate small vertical deflections, we eschew this common simplification, leaving the right-hand side in terms of the basal elevation.
Using the expressions for  $\overline{\boldsymbol{\tau}}$ and $\overline{p}$ derived earlier (Equations 2 and 5), the SSA can be expressed directly in terms of the velocity field (noting that all flexural terms have vanished):
 \begin{equation}
\begin{cases}
\nabla\cdot 2\overline{\nu}H\left[\dot{\boldsymbol{\varepsilon}} + \operatorname{tr}(\dot{\boldsymbol{\varepsilon}}\mathbf)\mathbf{I}\right] = \rho_igH\nabla H - \rho_{sw}gb\nabla b\\
\dot{\boldsymbol{\varepsilon}} = \frac{1}{2}\left(\nabla + \nabla^T\right)\vec{u}.
\end{cases}
\end{equation}
\begin{equation}
\begin{cases}
\nabla\cdot 2\overline{\nu}H\left[\dot{\boldsymbol{\varepsilon}} + \operatorname{tr}(\dot{\boldsymbol{\varepsilon}}\mathbf)\mathbf{I}\right] = \rho_igH\nabla H - \rho_{sw}gb\nabla b\\
\dot{\boldsymbol{\varepsilon}} = \frac{1}{2}\left(\nabla + \nabla^T\right)\vec{u}.
\end{cases}
\end{equation}The occurrence of flexural terms means that the surface and basal elevations cannot be inferred directly from thickness alone. Instead, the surface and basal boundaries evolve separately, with dynamic thickening and thinning described in two parts,
 \begin{equation}
\dot{s} = -\nabla\cdot(\vec{u}s),
\end{equation}
\begin{equation}
\dot{s} = -\nabla\cdot(\vec{u}s),
\end{equation}and
 \begin{equation}
\dot{b} = -\nabla\cdot(\vec{u}b).
\end{equation}
\begin{equation}
\dot{b} = -\nabla\cdot(\vec{u}b).
\end{equation}This treatment interprets s and b as conserved quantities, which is a fair approximation for shallow ice shelves, in which mass does not move vertically through the horizontal plane at sea level. While we must include small vertical deflections, these are added as incremental adjustments to surface and basal evolution as described at the end of Appendix section B.1.4, in a process akin to adding a mass balance term to a conserved quantity.
2.4. Bending moment
The rank-2 bending moment tensor M is evaluated as (Equation 18 from M21)
 \begin{equation}
\mathbf{M} = \int\limits_{-\frac{H}{2}}^{\frac{H}{2}}(\boldsymbol{\tau} - p\mathbf{I})\zeta d\zeta.
\end{equation}
\begin{equation}
\mathbf{M} = \int\limits_{-\frac{H}{2}}^{\frac{H}{2}}(\boldsymbol{\tau} - p\mathbf{I})\zeta d\zeta.
\end{equation} We make substitutions for τ and p with reference to Equations 1 and 4, again noting that all terms in  $\dot{\boldsymbol{\varepsilon}}$ will vanish since they are linear in ζ. We further omit the overburden part of Equation 4 in our calculation, reasoning, as in M21, that this term contributes to bending only where an ice shelf has substantial surface curvature or depth-dependent ice density (see their Equations 33 and 57f). These steps give the simplified integral expression
 \begin{equation}
\mathbf{M} = -2\overline{\nu}\int\limits_{-\frac{H}{2}}^{\frac{H}{2}}\zeta^2\left[\dot{\boldsymbol{\kappa}} + \operatorname{tr}(\dot{\boldsymbol{\kappa}})\mathbf{I}\right]d\zeta.
\end{equation}
\begin{equation}
\mathbf{M} = -2\overline{\nu}\int\limits_{-\frac{H}{2}}^{\frac{H}{2}}\zeta^2\left[\dot{\boldsymbol{\kappa}} + \operatorname{tr}(\dot{\boldsymbol{\kappa}})\mathbf{I}\right]d\zeta.
\end{equation}We then evaluate this integral and express the result in the simplified form
 \begin{equation}
\mathbf{M} = -\mathcal{D}(\dot{\boldsymbol{\kappa}}),
\end{equation}
\begin{equation}
\mathbf{M} = -\mathcal{D}(\dot{\boldsymbol{\kappa}}),
\end{equation} where we have defined the operator  $\mathcal{D}$ via
 \begin{equation}
\mathcal{D}(\dot{\boldsymbol{\kappa}}) = 2\overline{\nu}\frac{H^3}{12}\left[\dot{\boldsymbol{\kappa}} + \operatorname{tr}(\dot{\boldsymbol{\kappa}})\mathbf{I}\right].
\end{equation}
\begin{equation}
\mathcal{D}(\dot{\boldsymbol{\kappa}}) = 2\overline{\nu}\frac{H^3}{12}\left[\dot{\boldsymbol{\kappa}} + \operatorname{tr}(\dot{\boldsymbol{\kappa}})\mathbf{I}\right].
\end{equation}2.5. Conservation of angular momentum
The balance of forces in a bending, viscously-flowing ice shelf is expressed in M21 as (their Equations 46 and 57, with M expressed as in Equation 12):
 \begin{equation}
\begin{cases}
-\nabla\cdot\nabla\cdot\mathcal{D}(\dot{\boldsymbol{\kappa}}) - \rho_{sw}gh_{ab} + \nabla\nabla\eta : H\overline{\boldsymbol{\sigma}} = 0\\
\dot{\boldsymbol{\kappa}} = \nabla\nabla\dot{\eta},
\end{cases}
\end{equation}
\begin{equation}
\begin{cases}
-\nabla\cdot\nabla\cdot\mathcal{D}(\dot{\boldsymbol{\kappa}}) - \rho_{sw}gh_{ab} + \nabla\nabla\eta : H\overline{\boldsymbol{\sigma}} = 0\\
\dot{\boldsymbol{\kappa}} = \nabla\nabla\dot{\eta},
\end{cases}
\end{equation} where hab is the height above buoyancy at each point of the shelf (which may be nonzero where there is vertical flexure),  $\overline{\boldsymbol{\sigma}} = \overline{\boldsymbol{\tau}} - \overline{p}\mathbf{I}$ is the depth-averaged net (Cauchy) stress tensor, and the accumulated deflection η is calculated as detailed in Equation B.3 in Appendix B. The colon operator (:) is the tensor double-dot product, also called the inner product, in which the product of two tensors is a scalar value.
In summary, our implementation of M21 model is given by the horizontal momentum balance of the SSA (Equation 7), the evolution equations for the top and bottom ice shelf surfaces (Equations 8 and 9), and the conservation of angular momentum (Equation 14).
3. 3F viscoplastic flow theory
3.1. Background on plasticity theory
In continuum mechanics, plasticity describes a material’s ability to undergo permanent, irreversible deformation when stresses exceed its yield strength (Hill, Reference Hill1998). Unlike viscous deformation, where even infinitesimal stress induces continuous deformation (as in Glen’s Flow Law for glacier ice), plastic deformation occurs only once a yield criterion is surpassed, marking a threshold beyond which the material undergoes plastic failure. Another key distinction is directional behavior: while the direction of viscous deformation is determined by the deviatoric stress field, the direction of plastic strains is determined by the yield surface (see Figure 1). For glacier ice, a viscous constitutive relation captures long-term creep under low-stress conditions, but plasticity models become essential for describing abrupt material failure, such as ice cliff collapse or glacier calving (Bassis and Walker, Reference Bassis and Walker2012). Our objective is to develop a glaciologically relevant framework that integrates nonlinear viscous and plastic elements to capture the multi-scale behaviors of ice, particularly in dynamic regions where yield-limited flow or brittle failure dominates.
Classic yield criteria define plastic strain rate evolution once the yield strength is exceeded. In our approach, we introduce a plastic curvature rate, which is useful because flexural stress is proportional to curvature in the assumed Kirchoff-Love plate model. This formulation explicitly accounts for plastic deformation driven by bending stresses, making it particularly relevant for the processes discussed in the Introduction, such as flexure-induced lake drainage. Moreover, the buckling instability in M21 arises from unbounded bending stresses and deflection rates; by constraining the curvature rate through a yield criterion, we provide a physically motivated resolution to this issue. We also provide the theory for incorporating plasticity into the flow stress in Appendix C.
3.2. Plasticity in an ice shelf flow-flexure model
We modify the constitutive relation of Equation 1 by imposing an upper bound on the effective curvature rate, limiting  $\dot{\boldsymbol{\kappa}}$ so that
 \begin{equation}
\dot{\boldsymbol{\kappa}} = \nabla\nabla\dot{\eta} - f(\dot{\boldsymbol{\kappa}}).
\end{equation}
\begin{equation}
\dot{\boldsymbol{\kappa}} = \nabla\nabla\dot{\eta} - f(\dot{\boldsymbol{\kappa}}).
\end{equation} Here,  $f(\dot{\boldsymbol{\kappa}})$ represents a correction to the curvature rate due to plastic yielding, with f denoting the yield function, the properties of which we discuss below. This formulation accounts for how plastic yielding depends on the rate of curvature change, which helps ensure realistic material behavior over time (preserving causality) and improves numerical stability in simulations (Rudnicki and Rice, Reference Rudnicki and Rice1975; Dunham and others, Reference Dunham, Belanger, Cong and Kozdon2011).
Because plastic behaviour involves limiting stresses (in this case, via the curvature rate) to some threshold value,  $f(\dot{\boldsymbol{\kappa}})$ must reduce $\dot{\boldsymbol{\kappa}}$ above the chosen threshold rate, and vanish below that threshold. Since the threshold for plasticity should be independent of the reference frame chosen, we describe the yield function in terms of the second tensor invariant, JII. Thus, we define the depth-invariant scalar $\alpha(x, y, t)$ conceptually as
 \begin{equation}
\alpha = \begin{cases}
1 & J_{II}(\dot{\boldsymbol{\kappa}}) \leq \dot{\kappa}_c\\
\frac{\dot{\kappa}_c}{J_{II}(\dot{\boldsymbol{\kappa}})} & J_{II}(\dot{\boldsymbol{\kappa}}) \gt \dot{\kappa}_c,
\end{cases}
\end{equation}
\begin{equation}
\alpha = \begin{cases}
1 & J_{II}(\dot{\boldsymbol{\kappa}}) \leq \dot{\kappa}_c\\
\frac{\dot{\kappa}_c}{J_{II}(\dot{\boldsymbol{\kappa}})} & J_{II}(\dot{\boldsymbol{\kappa}}) \gt \dot{\kappa}_c,
\end{cases}
\end{equation} with  $\dot{\kappa}_c$ the critical value for initiating plasticity. In practice, a slightly modified form is used for computational stability (see Appendix section B.3 for details) but this expression captures the essential mechanics. We propose the following definition for the yield function:
 \begin{equation}
f(\dot{\boldsymbol{\kappa}}) = (\alpha - 1)\dot{\boldsymbol{\kappa}},
\end{equation}
\begin{equation}
f(\dot{\boldsymbol{\kappa}}) = (\alpha - 1)\dot{\boldsymbol{\kappa}},
\end{equation}with this definition in place, we rearrange Equation 15 to find that
 \begin{equation}
\alpha\dot{\boldsymbol{\kappa}} = \nabla\nabla\dot{\eta}.
\end{equation}
\begin{equation}
\alpha\dot{\boldsymbol{\kappa}} = \nabla\nabla\dot{\eta}.
\end{equation} That is, whenever  $J_{II}(\dot{\boldsymbol{\kappa}}) \leq \dot{\kappa}_c$, we recover the original viscous relationship $\dot{\boldsymbol{\kappa}} = \nabla\nabla\dot{\eta}$. On the other hand, if $J_{II}(\dot{\boldsymbol{\kappa}}) \gt \dot{\kappa}_c$, we find that $J_{II}(\nabla\nabla\dot{\eta}) = J_{II}(\alpha\dot{\boldsymbol{\kappa}}) = \alpha J_{II}(\dot{\boldsymbol{\kappa}}) = \dot{\kappa}_c$. Thus, plasticity is activated only when the effective rate of curvature exceeds the critical value $\dot{\kappa}_c$, in which case the tensor is scaled based on the degree of exceedance (see Figure 1).
Conceptual schematic of the plasticity treatment. The second tensor invariant, JII, corresponds to the radial distance from the origin (with  $\dot{\kappa}_{xy}$ omitted for 2D representation). The green region, bounded by the yield curve $r = \dot{\kappa}_c$, corresponds to the viscous flexure regime of M21. When $\dot{\boldsymbol{\kappa}}$ falls outside this boundary, plastic failure is enforced by scaling $\dot{\boldsymbol{\kappa}}$ by α such that $J_{II}(\alpha\dot{\boldsymbol{\kappa}}) = \dot{\kappa}_c$. The red arrow’s magnitude represents the plastic correction, quantified as $(\alpha - 1)J_{II}(\dot{\boldsymbol{\kappa}})$.

An advantage of this simple formulation is that the resulting flow-flexure system retains the structure described in the previous section. Equation 1 is implicitly modified, requiring only that the conservation of angular momentum (Equation 14) be amended to
 \begin{equation}
\begin{cases}
-\nabla\cdot\nabla\cdot\mathcal{D}(\dot{\boldsymbol{\kappa}}) - \rho_{sw}gh_{ab} + \nabla\nabla\eta : H\overline{\boldsymbol{\sigma}} = 0\\
\alpha\dot{\boldsymbol{\kappa}} = \nabla\nabla\dot{\eta}.
\end{cases}
\end{equation}
\begin{equation}
\begin{cases}
-\nabla\cdot\nabla\cdot\mathcal{D}(\dot{\boldsymbol{\kappa}}) - \rho_{sw}gh_{ab} + \nabla\nabla\eta : H\overline{\boldsymbol{\sigma}} = 0\\
\alpha\dot{\boldsymbol{\kappa}} = \nabla\nabla\dot{\eta}.
\end{cases}
\end{equation}3.3. A scalar measure of plastic deformation
The plastic reduction to the curvature field (or stress field) discussed above is driven by distributed fracture within the ice. Consequently, any scalar measure of material failure should correspond to the accumulated plastic curvature reduction,  $\boldsymbol{\kappa}_p$, which, in a Lagrangian framework, is expressed at time t as
 \begin{equation}
\boldsymbol{\kappa}_p = \int\limits_{t_1}^tf(\dot{\boldsymbol{\kappa}})dt,
\end{equation}
\begin{equation}
\boldsymbol{\kappa}_p = \int\limits_{t_1}^tf(\dot{\boldsymbol{\kappa}})dt,
\end{equation} where t 1 marks the start of the simulation. We propose using the second tensor invariant of  $\boldsymbol{\kappa}_p$ to describe a scalar measure of plastic deformation as
 \begin{equation}
\kappa_p = J_{II}(\boldsymbol{\kappa}_p).
\end{equation}
\begin{equation}
\kappa_p = J_{II}(\boldsymbol{\kappa}_p).
\end{equation}The quantity κp may either increase or decrease through time and only evolves when the yield criterion is met. We note that this measure of plastic deformation is distinct from a damage parameter because it does not reduce the effective viscosity e.g., Albrecht and Levermann (Reference Albrecht and Levermann2012).
4. Discussion: simulating ice shelf dynamics using the 3F framework
In this section, we present three illustrative examples showcasing the capabilities of the 3F model to simulate key ice shelf phenomena. The first example focuses on differential surface ablation, demonstrating the development of characteristic surface features such as pedestals and flexural rims under localized melt forcings. The second example examines marginal rumpling in compressive ice shelf flow regimes, where plastic stress reduction resolves the instability associated with excessive deformation under the M21 model. The final example explores the interplay between surface hydrology and ice shelf flexure resulting from meltwater loading, highlighting the cyclic nature of lake filling, fracturing, and drainage. Together, these examples emphasize the versatility of the 3F framework in capturing key ice shelf dynamics and provide insights into the underlying physical mechanisms. All simulations can be reproduced using the accompanying Jupyter notebooks (see the Data Availability Statement section).
4.1. Differential ablation
To validate the 3F model, we replicate the qualitative behavior described by MacAyeal and others (Reference MacAyeal, Sergienko, Banwell, Macdonald, Willis and Stevens2021), which explored flow-flexure interactions under differential ablation. In their simulation, differential ablation was forced by spatial differences in surface albedo, with a supposed patch of debris-covered ice subject to a prescribed ablation rate, while the rest of the domain, composed of clean ice, remained melt-free. Their study demonstrated that localized variations in surface ablation produce characteristic moat-rampart patterns, where a raised pedestal forms due to isostatic adjustment, and flexural stresses generate an elevated rim and surrounding depression. This phenomenon has been observed on the McMurdo Ice Shelf by Banwell and others (Reference Banwell, Willis, Macdonald, Goodsell and MacAyeal2019) and Macdonald and others (Reference Macdonald, Banwell, Willis, Mayer, Goodsell and MacAyeal2019), for example.
We adopt a setup directly analogous to MacAyeal and others (Reference MacAyeal, Sergienko, Banwell, Macdonald, Willis and Stevens2021), with the key distinctions being that our model is formulated in 2D and incorporates material failure due to plastic deformation. Our domain consists of an 8 km by 6 km ice shelf section, in biaxial extension, with an initial thickness of 200 m and a uniform temperature of  $-5^\circ$ C. We impose an inflow velocity of 20 m a−1 in the longitudinal direction and prescribe a lateral velocity boundary condition consistent with the analytic solution for an unconfined ice shelf (Weertman, Reference Weertman1957). Before introducing differential ablation, we first spin-up the model to steady state, allowing the velocity and thickness fields to equilibrate (Figure 2).
Steady-state flow model obtained before introducing differential ablation. (A) Steady state flow speed, calculated as  $|\vec{u}| = \sqrt{u_x^2 + u_y^2}$. (B) Steady state thickness field. The dashed circle represents the high-albedo zone upon which the pedestal will grow.

After spin-up, we apply an ablation rate of 1 m a−1 everywhere outside a circular region of radius 1,500 m (delineated in Figure 2, and to be interpreted as a high-albedo zone of clean ice). In response, the ice within this circular, low-ablation region remains thicker, and the free-floating system adjusts isostatically, forming a raised pedestal. At the same time, flexural stresses resist the pedestal’s formation, producing a moat-rampart pattern at the transition between the different ablation regimes (Figure 3). These results can be directly compared with MacAyeal and others (Reference MacAyeal, Sergienko, Banwell, Macdonald, Willis and Stevens2021) by examining their Figure 2, which shows the development of a similar structure. Additionally, our inclusion of plastic deformation results in two concentric rings of localized weakening, which align with the moat and rampart features. These damaged zones indicate areas of elevated stress that emerge naturally within the simulation. For this simulation, we set the plasticity threshold to 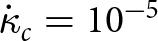 $\dot{\kappa}_c = 10^{-5}$ m−1a−1, which we find sufficient to produce a moderate amount of plastic deformation in the highest-stress regions. We may also interpret this curvature rate threshold in terms of bending stress. Roughly, if effective viscosity is on the order of 108 Pa a and thickness is on the order of 100 m, Equation 1 indicates that our failure threshold corresponds to near-surface bending stresses on the order of 100 kPa.
By reproducing the expected surface deformation patterns and capturing the associated stress concentrations, this experiment demonstrates the model’s ability to represent flow-flexure interactions under differential ablation conditions. Having established this baseline comparison, we next examine ice shelf rumpling.
Differential ablation and the formation of moat-rampart structures after ten years of simulated time. (A) Vertical deflection η. Outside the pedestal, net upward deflection offsets surface ablation, elevating the ice shelf. (B) Surface elevation change along the centerline. A circular depression (moat) extends 2.5 m below the pre-ablation state, while a raised rim (rampart) forms along the pedestal edge. (C) Plastic deformation. Two concentric rings emerge, one at the pedestal boundary and another within the moat. (D) Plastic deformation depicted along the centerline.

4.2. Marginal rumples
Ice rumples-localized zones of elevated surface roughness resulting from compressive stresses-are a prominent feature in ice shelves subject to flow-opposing stresses (LaBarbera and MacAyeal, Reference LaBarbera and MacAyeal2011; Coffey and others, Reference Coffey, MacAyeal, Copland, Mueller, Sergienko, Banwell and Lai2022). Marginal rumples are particularly common in regions where ice shelves interact with grounded ice or are confined by lateral boundaries, resulting in zones of compressional flow. Such regions are also characterized by rift-like patterns and detachment zones, as described by Miele and others (Reference Miele, Bartholomaus and Enderlin2023).
One of the central issues with the original M21 formulation was its tendency to produce unphysical behavior in compressive regimes. As highlighted by MacAyeal and others (Reference MacAyeal, Sergienko, Banwell, Macdonald, Willis and Stevens2021), their M21 model failed to stabilize rumples, often leading to their uncontrolled growth unless artificial constraints, such as halting inflow ice velocities, were imposed. This limitation stemmed from the purely viscous nature of the M21 model, which lacked a mechanism to dissipate the stresses responsible for such instabilities. The result was an unrealistic escalation of deformation, rendering the model unreliable in compressive conditions. Here, we explore marginal rumples within a detachment zone framework, using this setting to test whether the inclusion of plasticity can help stabilize the buckling instability described by MacAyeal and others (Reference MacAyeal, Sergienko, Banwell, Macdonald, Willis and Stevens2021).
To investigate the formation of marginal rumples, we apply our viscoplastic flow-flexure model to a transitional region where ice flows into and then beyond a short zone of increased resistance, replicating detachment zone conditions observed in ice shelves (Thomas, Reference Thomas1973; Matsuoka and others, Reference Matsuoka2015; De Rydt and others, Reference De Rydt, Gudmundsson, Nagler and Wuite2019). Our simulation domain consists of a 6 km by 6 km section of ice shelf, with an initial thickness of 300 m and a uniform temperature of 0∘ C. The ice is subject to an inflow velocity of 50 m a−1 in the longitudinal direction (left-to-right). Lateral (top and bottom) boundaries impose a coefficient of sidewall friction that smoothly ramps from 0 to 0.05 before returning to 0 over the final 2 km of the domain, following the approach of Miele and others (Reference Miele, Bartholomaus and Enderlin2023). The downstream (right) boundary is governed by the stress condition consistent with a floating cliff. We first spin the model up to steady state before introducing flexural forcing. The resulting steady-state velocity and thickness profiles can be seen in the accompanying Jupyter notebook, and similar steady states are documented in Miele and others (Reference Miele, Bartholomaus and Enderlin2023). Following spin-up, we initiate flexure by imposing a −1 m a−1 deflection rate at the terminus midpoint, mimicking the downward bending that naturally occurs at the downstream ends of floating shelves (Reeh, Reference Reeh1968). This prescribed deflection rate smoothly decreases to 0 at either sidewall, so that the sides are no-vertical-slip boundaries.
Figure 4 illustrates the spatial and temporal evolution of ice rumples in our 100-year simulation. With plasticity included (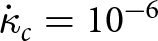 $\dot{\kappa}_c = 10^{-6}$ m−1a−1), the simulation approaches steady state after about 50 years. However, this steady state remains dynamic, with rumples exhibiting periodic evolution rather than static equilibrium (see Figure 4A and B, or the accompanying supplemental movie). Specifically, the model produces periodic, near-margin deformation bands that recur approximately every twelve years. In nature, the timescale of marginal rifting varies widely, but a twelve-year cycle falls well within the observed range. Notably, while previous studies have documented marginal rifting as a natural feature of ice shelf detachment zones (Lipovsky, Reference Lipovsky2020; Miele and others, Reference Miele, Bartholomaus and Enderlin2023), the mechanisms governing its periodicity remain uncertain. Our results suggest that the interaction between horizontal flow and vertical bending stresses can give rise to emergent periodicity in such zones, offering a new perspective on the process. However, a complete explanation likely requires more fully incorporating these interactions alongside the detachment zone framework described by Miele and others (Reference Miele, Bartholomaus and Enderlin2023), who attributed rift formation in these regions primarily to flow stresses, as opposed to flexural effects. While our results suggest that flexural stresses may play a complementary role, a more detailed exploration of their interaction is beyond the scope of this study.
Temporal and spatial evolution of net deflection and plastic deformation over a 100-year simulation. (A) Net deflection along the dashed line indicated in (C) as a function of time. (B) Plastic deformation along the dashed line shown in (D) as a function of time. (C) Spatial distribution of near-terminus net deflection at the end of the 100-year simulation. (D) Spatial distribution of near-terminus plastic deformation at the end of the 100-year simulation.

A critical test of model stability arises when we examine this simulation in the absence of plastic deformation. If we increase the plasticity threshold to a sufficiently high value such as 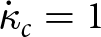 $\dot{\kappa}_c = 1$ m−1a−1—effectively removing plastic deformation from the simulation—the model becomes unstable and fails before reaching steady state. This confirms that our plasticity treatment plays a stabilizing role.
4.3. Surface meltwater induced ice-shelf flexure and fracture
Our final demonstration explores the interaction between surface hydrology and ice-shelf mechanics, focusing on the periodic filling and draining of a supraglacial lake. Such lakes, common on ice shelves and glaciers, can act as hydraulic valves, with their behavior governed by the interplay between ice flexure, fracture mechanics, and hydrological processes. This concept aligns with the valve-like mechanism described by Sibson (Reference Sibson1981), where filling continues until mechanical thresholds trigger drainage, after which filling resumes once the system re-stabilizes. Observations of supraglacial lake dynamics suggest that these processes are strongly coupled, with hydrological and mechanical feedbacks driving cyclic behavior (LaBarbera and MacAyeal, Reference LaBarbera and MacAyeal2011; Banwell and MacAyeal, Reference Banwell and MacAyeal2015).
We model a freshwater melt pond of depth  $d(x, y, t)$ and with freshwater density ρfw. We add a corresponding hydrostatic loading term to the angular momentum balance of Equation 19, which then becomes
 \begin{equation}
\begin{cases}
-\nabla\cdot\nabla\cdot\mathcal{D}(\dot{\boldsymbol{\kappa}}) - \rho_{sw}gh_{ab} - \rho_{fw}gd + \nabla\nabla\eta : H\overline{\boldsymbol{\sigma}} = 0\\
\alpha\dot{\boldsymbol{\kappa}} = \nabla\nabla\dot{\eta}.
\end{cases}
\end{equation}
\begin{equation}
\begin{cases}
-\nabla\cdot\nabla\cdot\mathcal{D}(\dot{\boldsymbol{\kappa}}) - \rho_{sw}gh_{ab} - \rho_{fw}gd + \nabla\nabla\eta : H\overline{\boldsymbol{\sigma}} = 0\\
\alpha\dot{\boldsymbol{\kappa}} = \nabla\nabla\dot{\eta}.
\end{cases}
\end{equation}We model the interaction between plastic yielding and lake drainage by assuming that accumulated plastic deformation increases permeability, similar to the dilatant response of rock during faulting (Segall and Rice, Reference Segall and Rice1995). We adopt a simplified approach in which drainage begins once plastic deformation reaches a critical threshold, κd. We introduce the normalized plastic deformation parameter
 \begin{equation}
\gamma = \frac{\kappa_p}{\kappa_d},
\end{equation}
\begin{equation}
\gamma = \frac{\kappa_p}{\kappa_d},
\end{equation} as the ratio of plastic deformation to the drainage threshold. Whenever  $\gamma \geq 1$, drainage occurs at 100 times the prescribed filling rate. Rapid unloading of the shelf then naturally inverts the flexural stress, which, produces the opposite change in the accumulated plastic deformation κp. Once γ < 1, drainage stops and filling resumes, producing a repeating cycle as an emergent property of the system.
As in previous cases, we first ramp up the system to steady state before introducing flexural stresses. This is done using an ice temperature of 0∘C, an initial thickness of 100 m, and an 8 km by 8 km domain. The shelf is prescribed a longitudinal velocity of 1000 m a−1 under uniaxial extension. The steady-state velocity and thickness fields can be viewed in the accompanying Jupyter notebook. After steady state is attained, we impose a curved surface depression, 0.5 m deep at the center, to allow meltwater to accumulate. To maintain buoyant equilibrium, we include a corresponding basal depression of the necessary size. We then introduce flexural effects by progressively adding meltwater to the surface depression at a rate of 10 cm per day. We set the plasticity threshold to  $\dot{\kappa}_c = 10^{-5}$m−1a−1, and the critical plastic deformation threshold for drainage to $\kappa_d= 10^{-6}$ m−1. These choices are somewhat arbitrary and would benefit from more detailed conduit modeling (Flekkø y and others, Reference Flekkøy, Malthe-Sørenssen and Jamtveit2002; Lipovsky and Dunham, Reference Lipovsky and Dunham2015), but nevertheless illustrates the basic behavior that we intend to capture in our model.
Results show a fill-drain cycle of approximately ten days (Figure 5) as the normalized plastic deformation γ periodically reaches the drainage threshold (panel A). Each drainage event generates concentric ring fractures (panels C and E), which expand outward over time. The expansion of these ring fractures coincides with the drainage-induced reversal of the flexural field, which produces brief upward deflections (shown in red in panels B and F). Notably, these ring fractures extend beyond the water-filled region (panel D), suggesting a possible mechanism for cascading drainage events. This aligns with the hypothesis of Banwell and others (Reference Banwell, MacAyeal and Sergienko2013), who proposed that the ring fractures surrounding one draining lake could weaken adjacent ice, pushing a neighboring lake past its failure threshold and initiating a chain reaction of drainage events. This hypothesis is strengthened by the observation of ring fractures on George VI Ice Shelf (Banwell and others, Reference Banwell, Willis, Stevens, Dell and MacAyeal2024).
Time evolution and spatial patterns of the modeled supraglacial lake. (A) Plastic deformation (bold, black) and water level (thin, blue) where they attain their maxima across the domain Ω, which occurs at the deepest point of the lake. The drainage threshold (γ = 1) is shown by the dotted line. (B–D) Evolution along the centerline (y = 4 km, shown as dashed lines in E and F). (B) Net vertical deflection, showing upward flexure of lake margins after drainage, also visible as a raised ring in (F). (C) Plastic deformation, highlighting post-drainage concentric rings, shown in 2D in (E). (D) Water depth. (E) Plastic deformation at the end, showing concentric rings. (F) Ice flexure at the end of the simulation, showing a raised rim.

5. Conclusions
We introduce the 3F model, a viscoplastic extension of the M21 ice shelf model, which integrates flow, flexure, and fracture processes to enhance our ability to simulate ice-shelf dynamics. By addressing several limitations of the M21 model—including its reliance on a non-open-source solver, instability in compressive regimes, and the absence of fracture mechanics—the 3F framework offers an accessible alternative. The model is implemented using two open-source Python libraries, Firedrake (Rathgeber and others, Reference Rathgeber2016) and icepack (Shapero and others, Reference Shapero, Badgeley, Hoffman and Joughin2021), to ensure reproducibility and accessibility within the research community.
To our knowledge, the 3F model is the first numerical ice shelf flow model that has attempted to incorporate distributed plasticity into the rheology of ice. Bassis and Walker (Reference Bassis and Walker2012) incorporated plasticity into their description of ice rheology, but only accounted for the effect at the ice front. From our results, we conclude that the incorporation of plastic deformations results in a numerically stable and well-posed description of ice shelf flow in the presence of coupled flexural motions.
The 3F model is effective in capturing diverse ice-shelf behaviors, including differential ablation patterns (Macdonald and others, Reference Macdonald, Banwell, Willis, Mayer, Goodsell and MacAyeal2019; MacAyeal and others, Reference MacAyeal, Sergienko, Banwell, Macdonald, Willis and Stevens2021), periodic marginal rumples (Miele and others, Reference Miele, Bartholomaus and Enderlin2023), and supraglacial lake-driven flexure and fracture (Banwell and MacAyeal, Reference Banwell and MacAyeal2015). For example, simulations of marginal rumples illustrate how the viscoplastic framework aligns with observed ice-shelf deformation dynamics (Matsuoka and others, Reference Matsuoka2015; De Rydt and others, Reference De Rydt, Gudmundsson, Nagler and Wuite2019). Similarly, lake-filling and drainage scenarios highlight the role of dynamic feedbacks between surface hydrology and ice mechanics, emphasizing the importance of incorporating meltwater interactions (Banwell and MacAyeal, Reference Banwell and MacAyeal2015; Kingslake and others, Reference Kingslake, Ely, Das and Bell2017; Banwell and others, Reference Banwell, Willis, Stevens, Dell and MacAyeal2024).
Future development of the model could incorporate additional hydrological complexity, such as representing multiple meltwater lakes to simulate cascading drainage events. This would allow the model to better capture chain-reaction processes that have been linked to widespread ice-shelf destabilization (Banwell and others, Reference Banwell, MacAyeal and Sergienko2013; Robel and Banwell, Reference Robel and Banwell2019). Another important step will be to couple the 3F framework with established surface hydrology models, such as MONARCHS (Buzzard and others, Reference Buzzard, Elsey and Robel2024), to further explore interactions between evolving meltwater drainage systems, surface topography, and flexural and structural ice-shelf responses. Incorporating elastic stresses, as the original M21 model did, would allow the investigation of shorter timescale processes (Lipovsky, Reference Lipovsky2018; Olinger and others, Reference Olinger, Lipovsky, Denolle and Crowell2022; Reference Olinger, Lipovsky and Denolle2024).
The upscaling of the 3F model into global frameworks, such as the Ice Sheet System Model (ISSM) (Larour and others, Reference Larour, Seroussi, Morlighem and Rignot2012), represents a logical next step. This coupling would facilitate simulations of real-world ice shelves, allowing for more detailed representations of complex geometries, boundary conditions, and comparisons with observational data. Such advancements would enable more comprehensive assessments of ice-shelf stability and their contributions to sea-level rise under different climate scenarios.
In summary, the 3F model addresses critical limitations of previous frameworks and provides a foundation for future exploration of meltwater-driven instabilities and large-scale ice-sheet interactions. Incorporating multiple meltwater lakes, hydrological feedbacks, and coupling with large-scale models will further enhance its capabilities to simulate complex processes influencing ice-shelf stability.
Supplementary material
The supplementary material for this article can be found at https://doi.org/10.1017/jog.2025.10089.
Data availability statement
The Jupyter notebooks used to run all simulations and create figures are available at https://github.com/chrismiele/weird_flex/tree/main/manuscript_notebooks.
Acknowledgements
Chris Bézu and Bradley P. Lipovsky were funded by the US National Science Foundation (NSF) grant OPP2213705 awarded to the University of Washington. Alison F. Banwell was funded by NSF grant OPP2332480 awarded to the University of Colorado Boulder. Daniel Shapero was funded by NSF OAC1835321, NASA 80NSSC20K0954, and NASA 80NSSC21K1003. The authors thank Sammie Buzzard, Joshua Cuzzone, Douglas MacAyeal, Mattia Poinelli, and Nicole Schlegel for useful discussions and feedback regarding model development.
Appendix A. Glossary of symbols
Glossary of symbols used in this paper, grouped by category, with definitions, units, and references to the equation or in-text location where they first appear.

Appendix B. Computational formulation and numerical implementation
In this appendix, we outline the computational framework used to implement the governing equations. First, we present the numerical solution strategy as a structured four-step progression. Next, we derive the variational form of the fundamental equations governing viscoplastic deformation, which is the form solved by Firedrake. Finally, we refine the definition of the yield function introduced in the main text, incorporating modifications necessary for computational stability.
B.1. Iterative solution procedure
The time integration of the 3F model is implemented using operator splitting, where updates to velocity, surface and basal elevations, flexure, and material transport are performed sequentially. The simulation framework leverages two key computational tools: the Firedrake finite element library and the icepack package. Firedrake provides the numerical framework for solving the flow-flexure equations from their variational formulations, while icepack is used for solving flow equations and for advecting material properties such as plastic deformation, curvature, and flexural displacement. Below, we describe the numerical methodology in four steps.
The superscript  $[t]$ denotes the current timestep in the simulation, while $[t - 1]$ represents the values from the previous timestep. The full variational forms of the flow-flexure problem are provided in the next subsection of this appendix.
B.1.1. Step 1: Solve the SSA
The SSA is solved using Newton’s method. Icepack formulates the SSA problem as a variational principle, minimizing an action functional that incorporates gravitational driving forces, membrane stresses, and boundary conditions at the ice shelf’s terminus. By default, icepack’s action functionals for the ice shelf problem assume buoyant equilibrium, in which  $b = -\frac{\rho_i}{\rho_w}H$ and $s = \left(1 - \frac{\rho_i}{\rho_w}H\right)$, reducing Equation 7 to
 \begin{equation}
\begin{cases}
\nabla\cdot 2\overline{\nu}H\left[\dot{\boldsymbol{\varepsilon}} + \operatorname{tr}(\dot{\boldsymbol{\varepsilon}})\mathbf{I}\right] = \rho_igH\nabla s\\
\dot{\boldsymbol{\varepsilon}} = \frac{1}{2}\left(\nabla + \nabla^T\right)\vec{u}.
\end{cases}
\end{equation}
\begin{equation}
\begin{cases}
\nabla\cdot 2\overline{\nu}H\left[\dot{\boldsymbol{\varepsilon}} + \operatorname{tr}(\dot{\boldsymbol{\varepsilon}})\mathbf{I}\right] = \rho_igH\nabla s\\
\dot{\boldsymbol{\varepsilon}} = \frac{1}{2}\left(\nabla + \nabla^T\right)\vec{u}.
\end{cases}
\end{equation}In order to solve the more general form of Equation 7, we modify icepack’s gravity and terminus modules so that the driving stress and terminus boundary condition are consistent with Equations 44 and 45 from MacAyeal and others (Reference MacAyeal, Sergienko, Banwell, Macdonald, Willis and Stevens2021). The specifics of these modifications are presented in the accompanying Jupyter notebooks.
With these modifications, the velocity field,  $\vec{u}^{[t]}$, is computed by solving the diagnostic SSA equation:
 \begin{equation}
\begin{cases}
\nabla\cdot2\overline{\nu}H^{[t - 1]}\left[\dot{\boldsymbol{\varepsilon
}}^{[t]} + \operatorname{tr}\left(\dot{\boldsymbol{\varepsilon}}^{[t]}\right)\mathbf{I}\right] = \rho_igH^{[t - 1]}\nabla H^{[t - 1]} - \rho_{sw}gb^{[t - 1]}\nabla b^{[t - 1]}\\
\dot{\boldsymbol{\varepsilon}}^{[t]} = \frac{1}{2}\left(\nabla + \nabla^T\right)\vec{u}^{[t]},
\end{cases}
\end{equation}
\begin{equation}
\begin{cases}
\nabla\cdot2\overline{\nu}H^{[t - 1]}\left[\dot{\boldsymbol{\varepsilon
}}^{[t]} + \operatorname{tr}\left(\dot{\boldsymbol{\varepsilon}}^{[t]}\right)\mathbf{I}\right] = \rho_igH^{[t - 1]}\nabla H^{[t - 1]} - \rho_{sw}gb^{[t - 1]}\nabla b^{[t - 1]}\\
\dot{\boldsymbol{\varepsilon}}^{[t]} = \frac{1}{2}\left(\nabla + \nabla^T\right)\vec{u}^{[t]},
\end{cases}
\end{equation} and the evolution of the upper and lower surfaces,  $s^{[t]}$ and $b^{[t]}$, is computed by separately solving Equations 8 and 9. This step uses icepack’s diagnostic-prognostic coupling, where each prognostic surface evolution is computed using implicit time-stepping schemes to maintain numerical stability.
B.1.2. Step 2: Update flow-related variables
With the updated velocity and surface and basal elevation fields, both strain rate  $\dot{\boldsymbol{\varepsilon}}^{[t]}$ and thickness $H^{[t]}$ are calculable directly (with any surface mass balance also included in this step, if applicable). This permits the calculation of both the depth-averaged deviatoric stress $\overline{\boldsymbol{\tau}}^{[t]}$ (Equation 2) and pressure $\overline{p}^{[t]}$ (Equation 5), which together give the depth-aveged net stress tensor, $\overline{\boldsymbol{\sigma}}^{[t]}$. This stress field bridges the flow and flexure components of the 3F model by serving as input for computing the flexural response computation in the next step.
B.1.3. Step 3: Solve the flexure problem
Before solving the viscoplastic flexure problem of Equation 19, we first introduce some further approximations to reduce the number of unknowns. For example, the present accumulated deflection,  $\eta^{[t]}$, represents an unknown in addition to $\dot{\eta}^{[t]}$. However, we must have that $\eta^{[t]}$ is approximately
 \begin{equation}
\eta^{[t]} = \eta^{[t - 1]} + \dot{\eta}^{[t]}\Delta t.
\end{equation}
\begin{equation}
\eta^{[t]} = \eta^{[t - 1]} + \dot{\eta}^{[t]}\Delta t.
\end{equation}Likewise, the present height above buoyancy must be approximately
 \begin{equation}
h_{ab}^{[t]} = h_{ab}^{[t - 1]} + \dot{\eta}^{[t]}\Delta t.
\end{equation}
\begin{equation}
h_{ab}^{[t]} = h_{ab}^{[t - 1]} + \dot{\eta}^{[t]}\Delta t.
\end{equation}By inserting these approximations directly into the coupled system of Equation 19, we end up with a system in only two unknowns, solving
 \begin{equation}
\begin{cases}
& -\nabla\cdot\nabla\cdot\mathcal{D}\left(\dot{\boldsymbol{\kappa}}^{[t]}\right) - \rho_{sw}g\left(h_{ab}^{[t - 1]} + \dot{\eta}^{[t]}\Delta t\right)
+ \left(\nabla\nabla\eta^{[t - 1]}
\right.\\ &\left. + \nabla\nabla\dot{\eta}^{[t]}\Delta t\right):H^{[t]}\overline{\boldsymbol{\sigma}}^{[t]} = 0 \\
& \alpha\dot{\boldsymbol{\kappa}}^{[t]} = \nabla\nabla\dot\eta^{[t]},
\end{cases}
\end{equation}
\begin{equation}
\begin{cases}
& -\nabla\cdot\nabla\cdot\mathcal{D}\left(\dot{\boldsymbol{\kappa}}^{[t]}\right) - \rho_{sw}g\left(h_{ab}^{[t - 1]} + \dot{\eta}^{[t]}\Delta t\right)
+ \left(\nabla\nabla\eta^{[t - 1]}
\right.\\ &\left. + \nabla\nabla\dot{\eta}^{[t]}\Delta t\right):H^{[t]}\overline{\boldsymbol{\sigma}}^{[t]} = 0 \\
& \alpha\dot{\boldsymbol{\kappa}}^{[t]} = \nabla\nabla\dot\eta^{[t]},
\end{cases}
\end{equation} for  $\dot{\eta}^{[t]}$ and $\dot{\boldsymbol{\kappa}}^{[t]}$. This system is solved using the Firedrake library. The equations are implemented in the weak form presented in the next subsection. The upper and lower surface elevations are now updated once more, with each being offset equally by a distance of $\dot{\eta}^{[t]}\Delta t$ (leaving the thickness, $H^{[t]}$, unchanged).
B.1.4. Step 4: Update and advect flexure-related variables
Material properties such as plastic deformation, curvature, and net deflection are transported with the flow field. Scalar values, such as net deflection η, are first updated in place via Equation B.3, and then advected by solving
 \begin{equation}
\frac{\partial}{\partial t}\eta^{[t]} + \vec{u}^{[t]}\cdot\nabla\eta^{[t]} = 0.
\end{equation}
\begin{equation}
\frac{\partial}{\partial t}\eta^{[t]} + \vec{u}^{[t]}\cdot\nabla\eta^{[t]} = 0.
\end{equation} Icepack solves equations of this form by applying an implicit Lax-Wendroff scheme, balancing computational efficiency with the need to resolve gradients in the advected fields, minimizing numerical diffusion. Tensor quantities, such as the accumulated plastic curvature,  $\boldsymbol{\kappa}_p$, are advected componentwise using the same technique.
After completing the advection of all relevant fields, the updated values serve as input for the subsequent iteration, beginning with Step 1 for the next timestep.
B.2. Variational form of Equation B.5
Let  $\dot{n} = \dot{n}(x, y)$ and $\dot{\mathbf{k}} = \dot{\mathbf{k}}(x, y)$ be arbitrary scalar and tensor test functions defined on the domain Ω. Excluding boundary terms for simplicity, the variational form of the system is given by
 \begin{equation}
\begin{cases}
\int\limits_\Omega\nabla\cdot\mathcal{D}\left(\dot{\boldsymbol{\kappa}}^{[t]}\right)\cdot\nabla\dot{n} - \int\limits_\Omega\dot{n}\rho_{sw}g\dot{\eta}^{[t]}\Delta t - \int\limits_\Omega\nabla\dot{\eta}^{[t]}\Delta t \cdot \left(\nabla\cdot\dot{n}H^{[t]}\boldsymbol{\sigma}^{[t]}\right)
=\\
= \int\limits_\Omega \dot{n}\rho_{sw}gh_{ab}^{[t - 1]} + \int\limits_\Omega\nabla\eta^{[t - 1]}\cdot\left(\nabla\cdot\dot{n}H^{[t]}\boldsymbol{\sigma^{[t]}}\right)\\
\\
\int\limits_\Omega \alpha\dot{\boldsymbol{\kappa}}^{[t]} : \dot{\mathbf{k}} + \int\limits_\Omega \nabla\dot{\eta}^{[t]}\cdot\nabla\cdot\dot{\mathbf{k}} = 0,
\end{cases}
\end{equation}
\begin{equation}
\begin{cases}
\int\limits_\Omega\nabla\cdot\mathcal{D}\left(\dot{\boldsymbol{\kappa}}^{[t]}\right)\cdot\nabla\dot{n} - \int\limits_\Omega\dot{n}\rho_{sw}g\dot{\eta}^{[t]}\Delta t - \int\limits_\Omega\nabla\dot{\eta}^{[t]}\Delta t \cdot \left(\nabla\cdot\dot{n}H^{[t]}\boldsymbol{\sigma}^{[t]}\right)
=\\
= \int\limits_\Omega \dot{n}\rho_{sw}gh_{ab}^{[t - 1]} + \int\limits_\Omega\nabla\eta^{[t - 1]}\cdot\left(\nabla\cdot\dot{n}H^{[t]}\boldsymbol{\sigma^{[t]}}\right)\\
\\
\int\limits_\Omega \alpha\dot{\boldsymbol{\kappa}}^{[t]} : \dot{\mathbf{k}} + \int\limits_\Omega \nabla\dot{\eta}^{[t]}\cdot\nabla\cdot\dot{\mathbf{k}} = 0,
\end{cases}
\end{equation} where all terms in unknown quantities ( $\dot{\boldsymbol{\kappa}}^{[t]}$ and $\dot{\eta}^{[t]}$) are grouped on the left, with known terms on the right. Each quantity is interpolated to continuous Galerkin spaces of degree 1, since our treatment of the flow-flexure problem requires, at most, second-order spatial derivatives of all variables.
B.3. Refining the yield function
Because Firedrake sometimes struggles with solution convergence in the presence of sharp discontinuities, the piecewise definition of α in Equation 16 can introduce numerical difficulties. To mitigate this, we introduce a smoothing parameter, β, where  $0 \leq \beta \leq 1$, which effectively “softens” the transition between the two regimes of the yield function. Rather than enforcing an exact threshold at $J_{II}(\dot{\boldsymbol{\kappa}})$, we modify the definition of α to
 \begin{equation}
\alpha = \begin{cases}
1 & J_{II}(\dot{\boldsymbol{\kappa}}) \leq \dot{\kappa}_c\\
\frac{\dot{\kappa}_c + \beta\left[J_{II}(\dot{\boldsymbol{\kappa}}) - \dot{\kappa}_c\right]}{J_{II}(\dot{\boldsymbol{\kappa}})} & J_{II}(\dot{\boldsymbol{\kappa}}) \gt \dot{\kappa}_c.
\end{cases}
\end{equation}
\begin{equation}
\alpha = \begin{cases}
1 & J_{II}(\dot{\boldsymbol{\kappa}}) \leq \dot{\kappa}_c\\
\frac{\dot{\kappa}_c + \beta\left[J_{II}(\dot{\boldsymbol{\kappa}}) - \dot{\kappa}_c\right]}{J_{II}(\dot{\boldsymbol{\kappa}})} & J_{II}(\dot{\boldsymbol{\kappa}}) \gt \dot{\kappa}_c.
\end{cases}
\end{equation} This formulation permits a more gradual transition from the viscous to plastic regime, with the parameter β controlling the sharpness of the transition. When β = 0, we recover the original piecewise definition of Equation 16, where plasticity is strictly enforced beyond  $\dot{\kappa}_c$. In contrast, setting β = 1 removes plasticity entirely, keeping the system fully viscous. Intermediate values produce a smooth transition, mitigating solver instabilities associated with abrupt changes in α. A moderate choice, such as β = 0.5, provides a balance between numerical stability and adherence to idealized plasticity constraint.
Appendix C. Incorporating plasticity into the flow stress
Analogously to our inclusion of plasticity in the flexural term, we additionally limit the strain rate from flow so that
 \begin{equation}
\dot{\boldsymbol{\varepsilon}} = \frac{1}{2}\left(\nabla + \nabla^T\right)\vec{u} - g(\dot{\boldsymbol{\varepsilon}}),
\end{equation}
\begin{equation}
\dot{\boldsymbol{\varepsilon}} = \frac{1}{2}\left(\nabla + \nabla^T\right)\vec{u} - g(\dot{\boldsymbol{\varepsilon}}),
\end{equation} with g the plastic yield function. As with f in Equation 15, we define g in terms of the second invariant of the relevant tensor. With  $\dot{\varepsilon}_c$ the critical strain rate for initiating plasticity, let $\alpha'$ denote the depth-invariant scalar
 \begin{equation}
\alpha' = \begin{cases}
1 & J_{II}(\dot{\boldsymbol{\varepsilon}}) \leq \dot{\varepsilon}_c\\
\frac{\dot{\varepsilon}_c}{J_{II}(\dot{\boldsymbol{\varepsilon}})} & J_{II}(\dot{\boldsymbol{\varepsilon}}) \gt \dot{\varepsilon
}_c,
\end{cases}
\end{equation}
\begin{equation}
\alpha' = \begin{cases}
1 & J_{II}(\dot{\boldsymbol{\varepsilon}}) \leq \dot{\varepsilon}_c\\
\frac{\dot{\varepsilon}_c}{J_{II}(\dot{\boldsymbol{\varepsilon}})} & J_{II}(\dot{\boldsymbol{\varepsilon}}) \gt \dot{\varepsilon
}_c,
\end{cases}
\end{equation}and define the yield function g such that
 \begin{equation}
g(\dot{\boldsymbol{\varepsilon}}) = (\alpha' - 1)\dot{\boldsymbol{\varepsilon}}.
\end{equation}
\begin{equation}
g(\dot{\boldsymbol{\varepsilon}}) = (\alpha' - 1)\dot{\boldsymbol{\varepsilon}}.
\end{equation}Then
 \begin{equation}
\alpha'\dot{\boldsymbol{\varepsilon}} = \frac{1}{2}\left(\nabla + \nabla^T\right)\vec{u},
\end{equation}
\begin{equation}
\alpha'\dot{\boldsymbol{\varepsilon}} = \frac{1}{2}\left(\nabla + \nabla^T\right)\vec{u},
\end{equation}and the horizontal momentum balance can now be expressed via the system
 \begin{equation}
\begin{cases}
\nabla\cdot 2\overline{\nu}H\left[\dot{\boldsymbol{\varepsilon}} + \operatorname{tr}(\dot{\boldsymbol{\varepsilon}}\mathbf)\mathbf{I}\right] = \rho_igH\nabla H - \rho_{sw}gb\nabla b\\
\alpha' \dot{\boldsymbol{\varepsilon}} = \frac{1}{2}\left(\nabla + \nabla^T\right)\vec{u}.
\end{cases}
\end{equation}
\begin{equation}
\begin{cases}
\nabla\cdot 2\overline{\nu}H\left[\dot{\boldsymbol{\varepsilon}} + \operatorname{tr}(\dot{\boldsymbol{\varepsilon}}\mathbf)\mathbf{I}\right] = \rho_igH\nabla H - \rho_{sw}gb\nabla b\\
\alpha' \dot{\boldsymbol{\varepsilon}} = \frac{1}{2}\left(\nabla + \nabla^T\right)\vec{u}.
\end{cases}
\end{equation}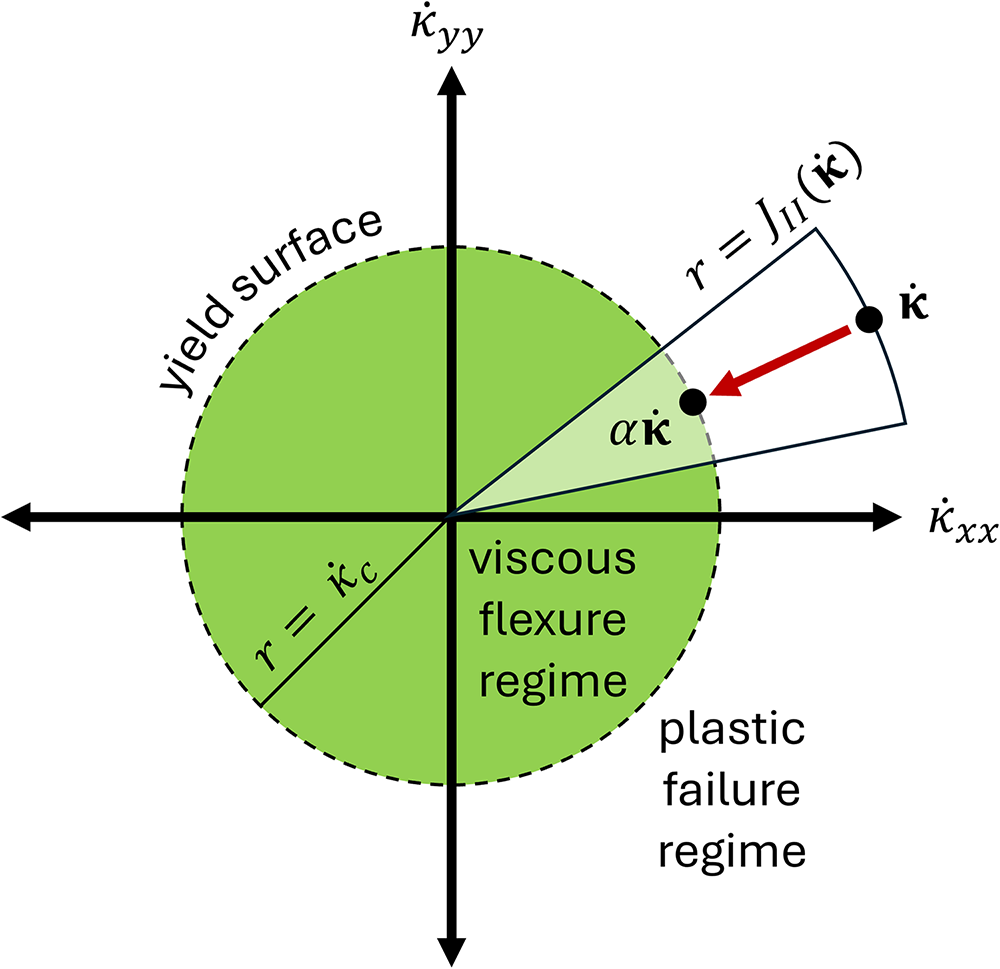


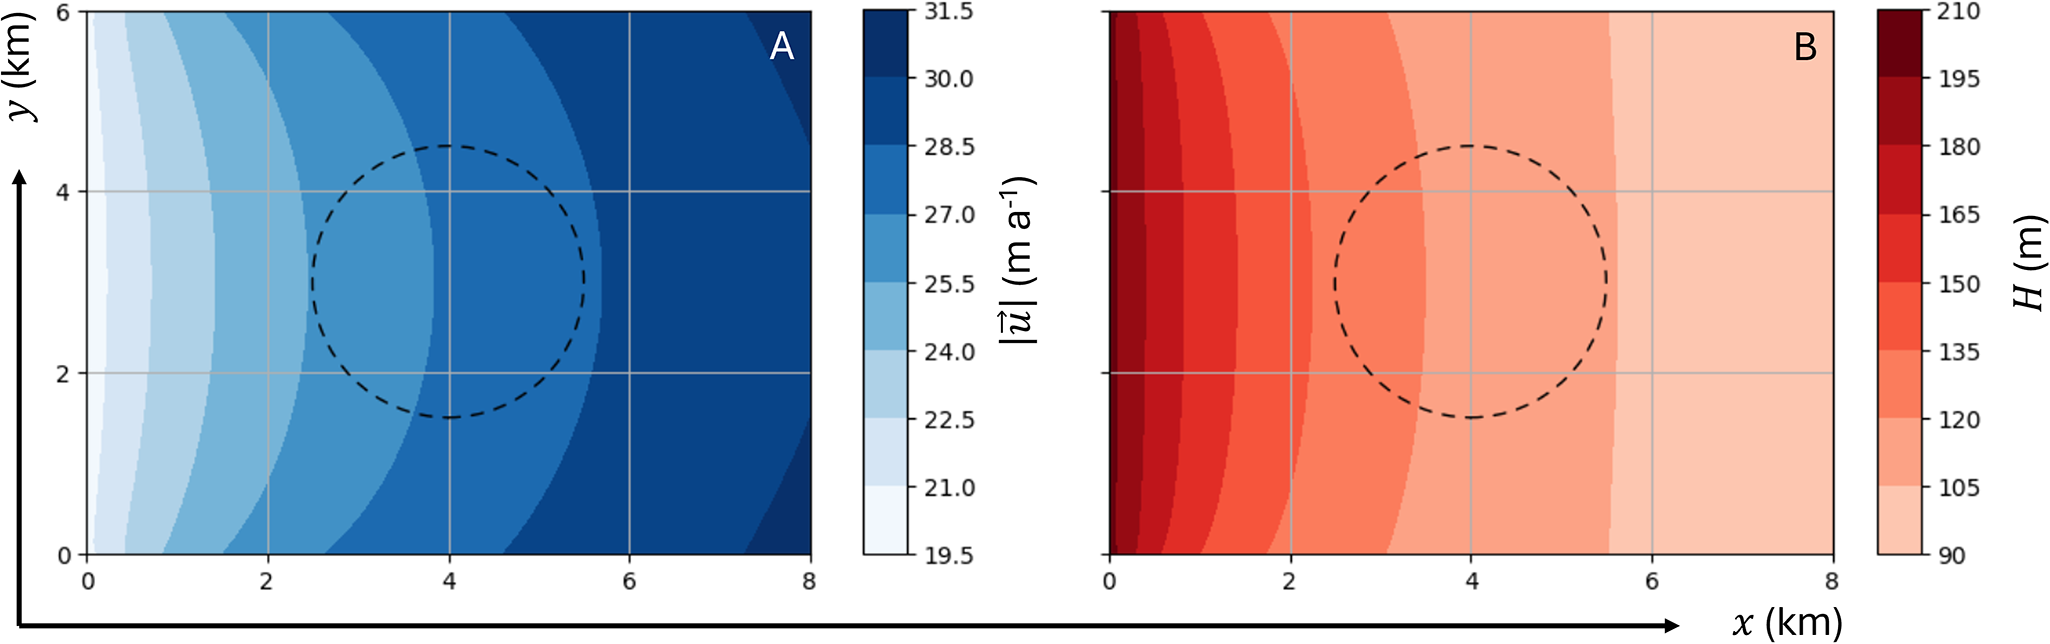

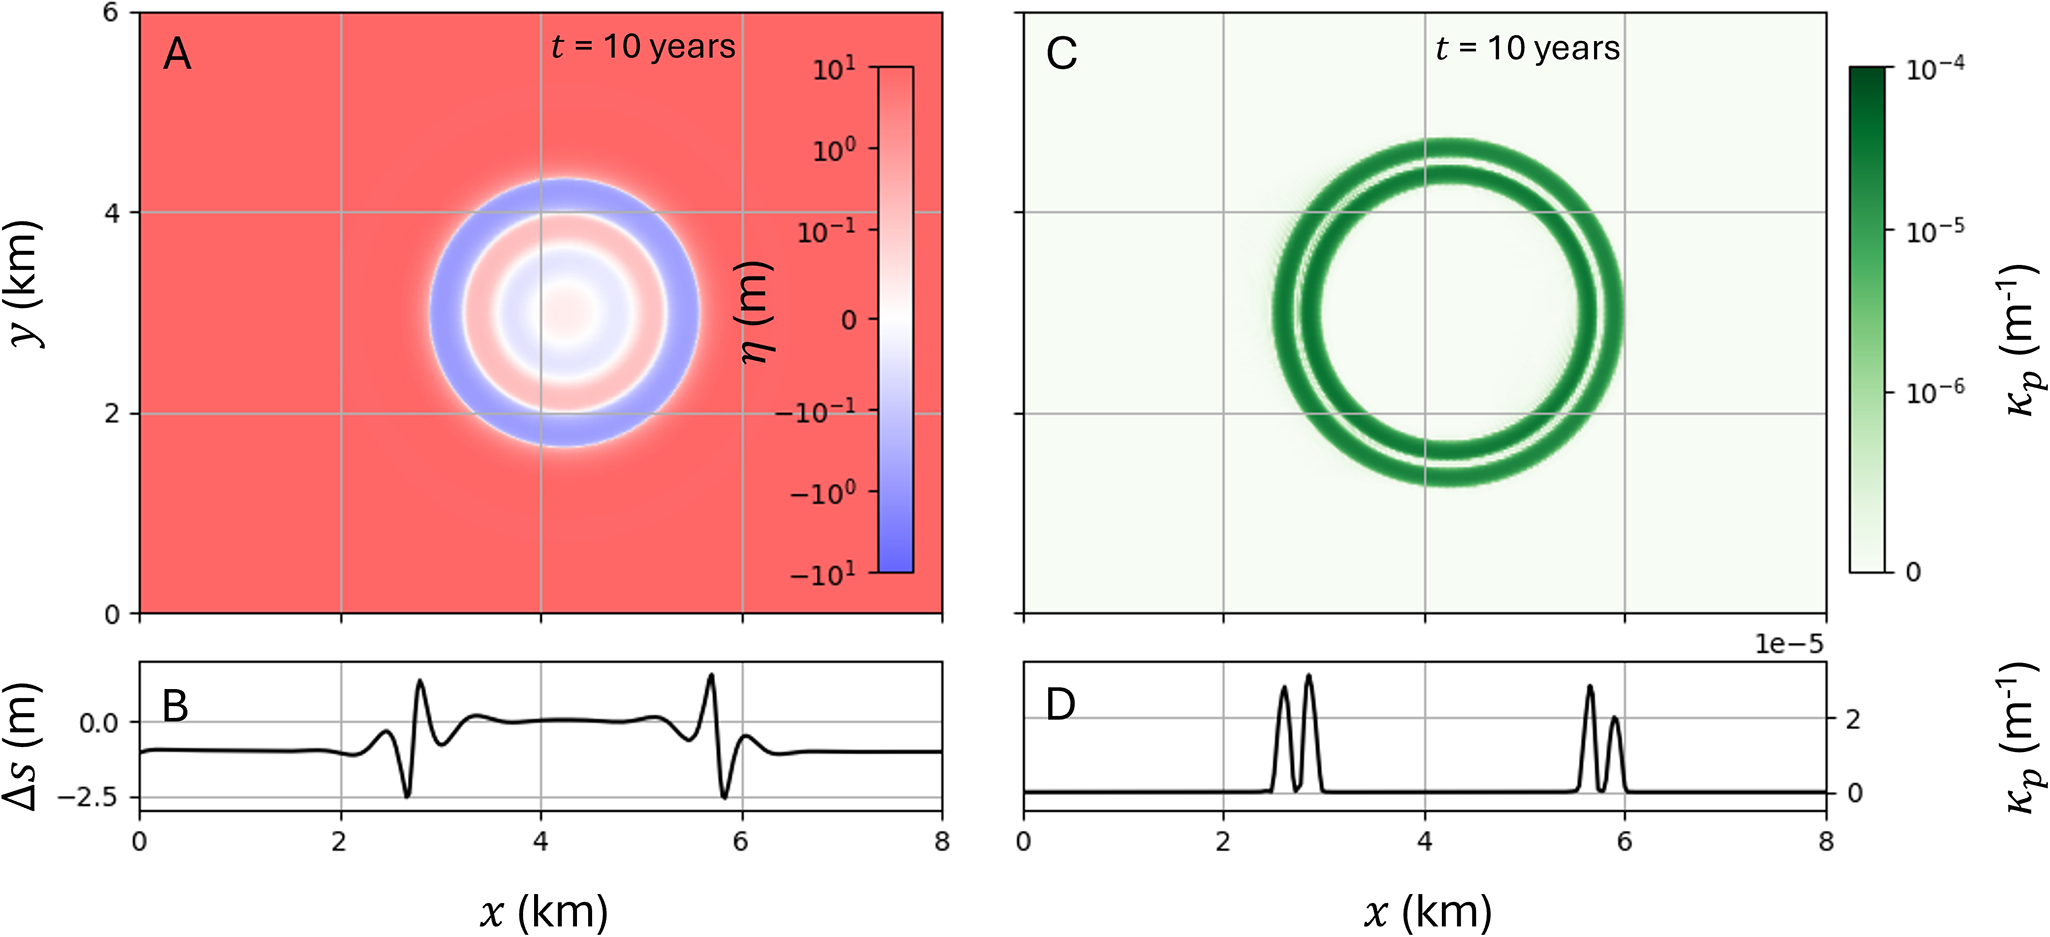
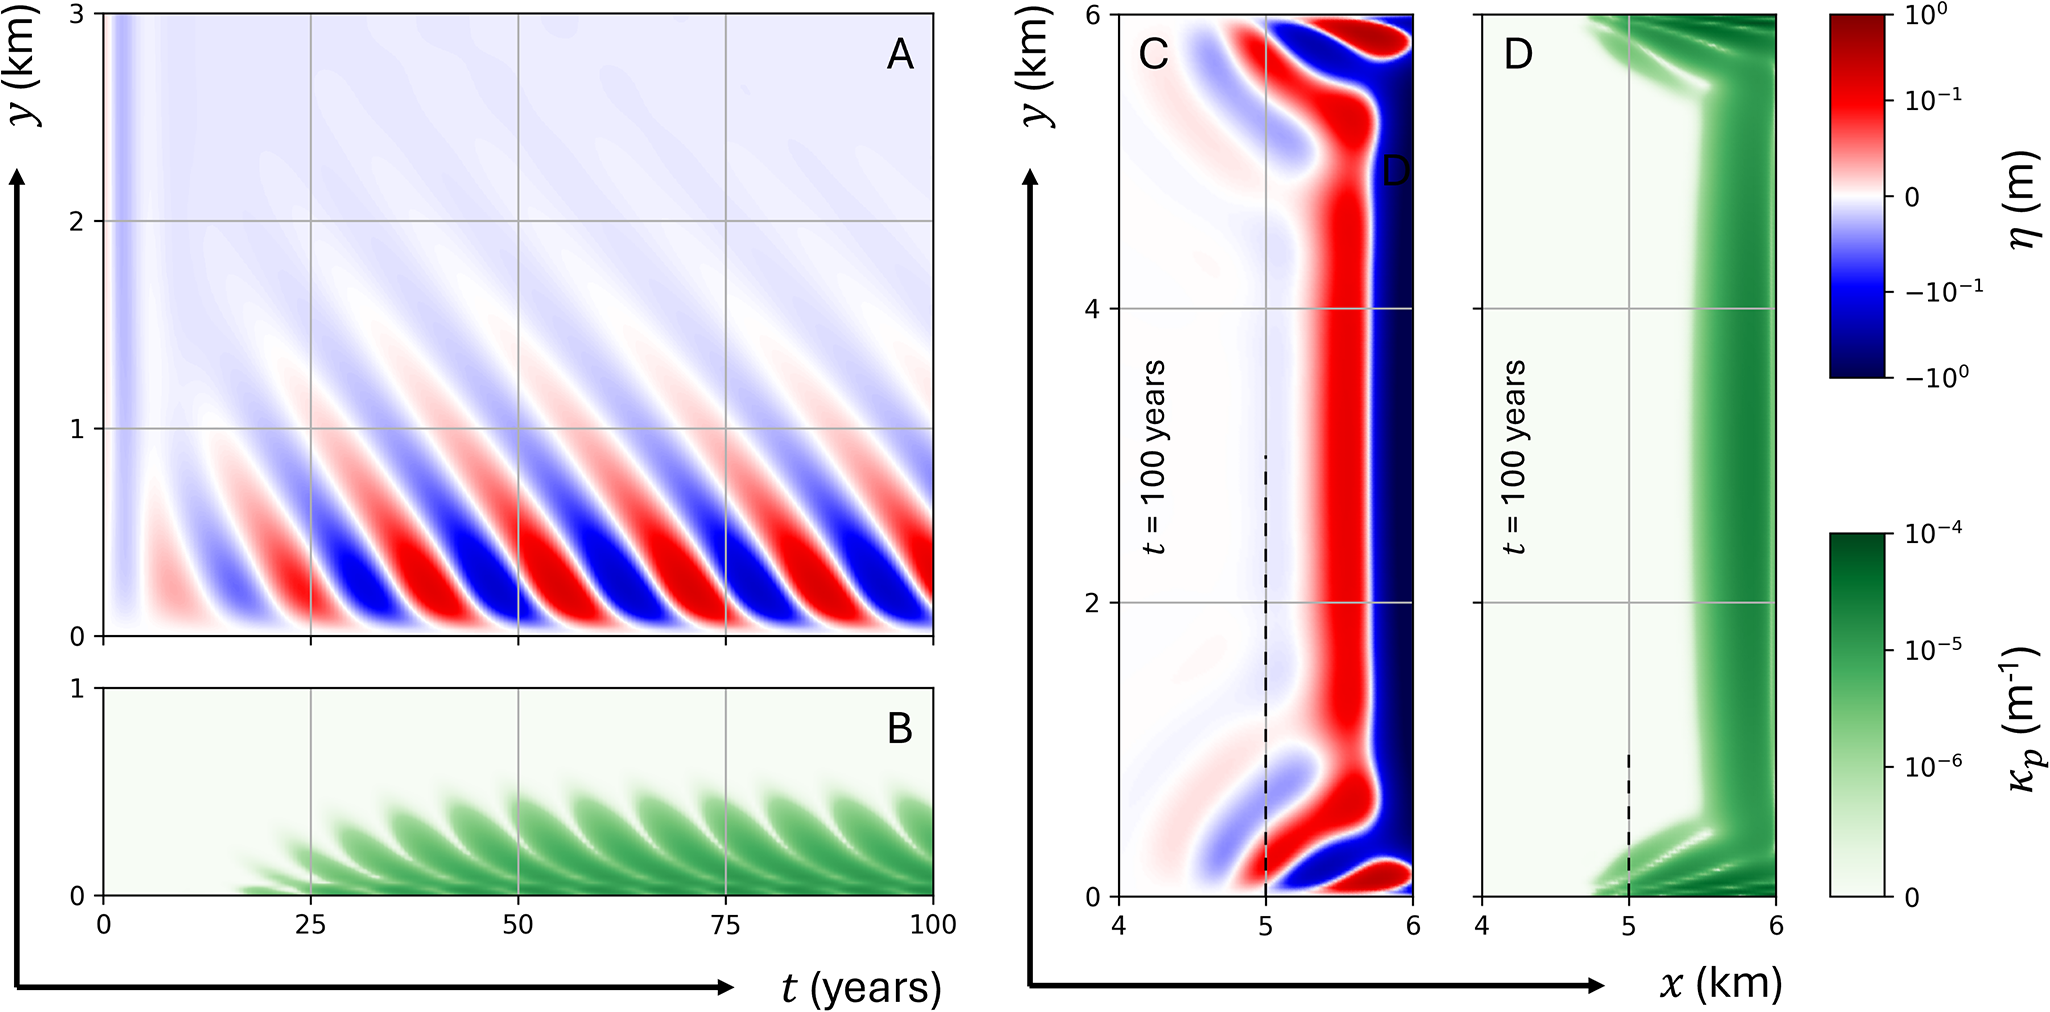
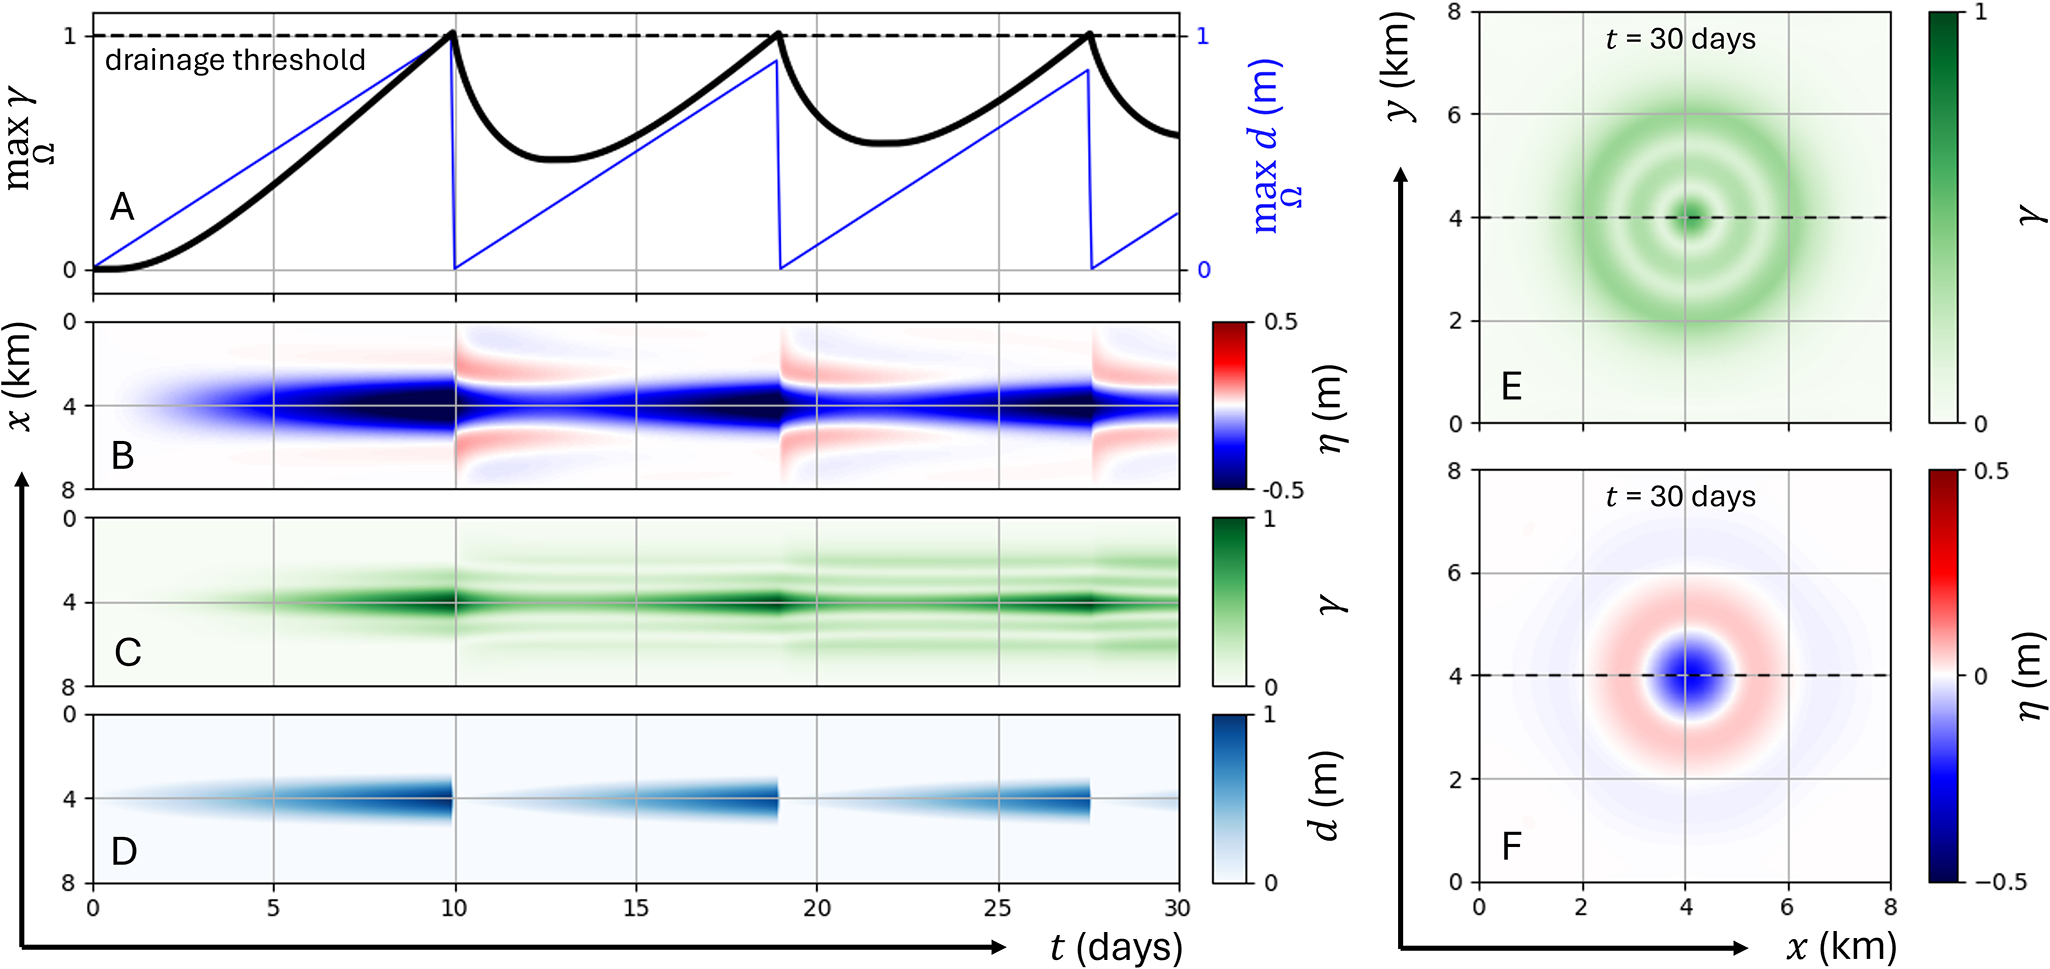
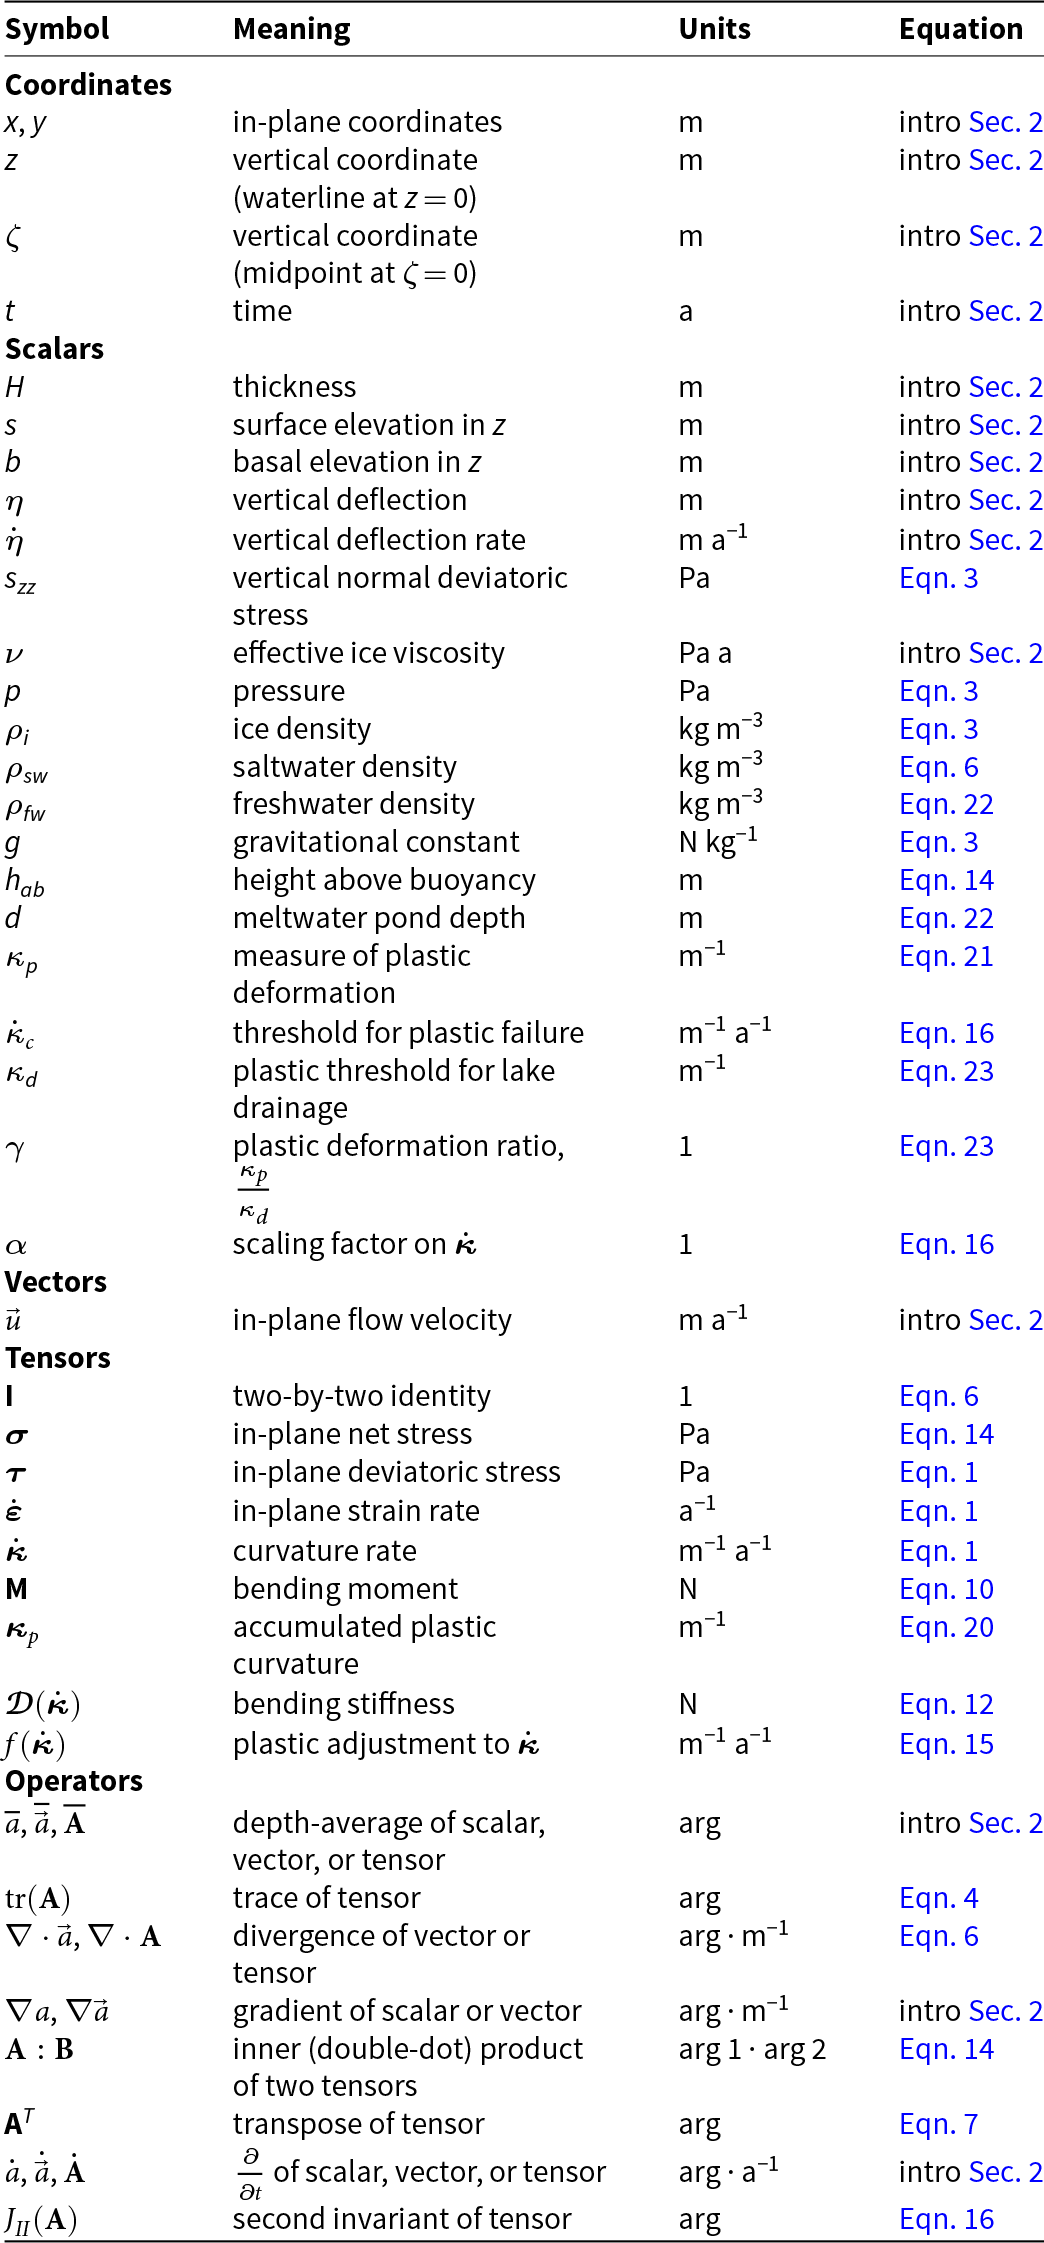


 Open access