



I. INTRODUCTION
Material surfaces are frequently coated to improve corrosion resistance, reduce wear and tear, achieve desired optical properties and appearance, or create special functionalities. For all these purposes, control of the thickness of the coating and its homogeneity are crucial. X-rays offer a wide range of possibilities to measure properties and especially the thickness of thin films and coatings. All X-ray techniques offer the benefit of being nondestructively, thus coatings can be further used or tested after they were characterized.
For thin films with a thickness of less than 1-μm X-ray reflectivity (XRR; Zabel, Reference Zabel1994; Chason and Mayer, Reference Chason and Mayer1997), grazing incidence X-ray diffraction (GIXRD; Dutta, Reference Dutta2000), or grazing-incidence small-angle X-ray scattering (GISAXS; Gilles et al., Reference Gilles, Lazzari and Leroy2009) are frequently used. All these techniques require a highly collimated X-ray beam and a high beam intensity and are thus often used with synchrotrons. Coatings with the thickness of 0.01–75 μm can be readily investigated by X-ray fluorescence (XRF; ASTM B568-98, 2021), but this technique cannot differentiate polymorphs (e.g., Fe2O3 or Fe3O4).
In this work, X-ray diffraction (XRD) is shown to be a valid alternative to XRF for thickness measurements, which extends the capabilities of the XRD technique. Three different surface layers are investigated:
1. Zn coatings on steel and mapping of the thickness distribution.
2. XRF reference standard with two layers (Cr, Ni) on a Fe-substrate.
3. Fe nitride and oxide layers on steel.
II. X-RAY DIFFRACTOMETER AND SAMPLE PREPARATION
All XRD measurements were performed with a Bruker D8 Discover equipped with a Vantec2000 area detector and an XYZ sample stage with a laser/video alignment system. FeKα-radiation (FeKα radiation is used as it does not cause Fe fluorescence (as does CuKα) nor Mn fluorescence (as does CoKα)) was focused with a PolyCap and a 1.0 mm diameter collimator onto the sample. With FeKα-radiation, no monochromator was used.
To determine the intensities of X-ray Bragg reflections the background of the Θ-scans was subtracted. Peak areas of Zn coatings were measured with Bruker DIFFRAC.EVA and of the XRF standard and Fe nitride layers from fits with Gaussian functions using Matlab®.
For the XRD measurements of coatings, the sample surface was only gently cleaned with ethanol. To remove the Zinc coatings before the measurement of the coating free diffraction signal of the steel substrate, a part of the sample was submersed for a few seconds in concentrated hydrochloric acid.
For the electron backscatter diffraction (EBSD) and energy-dispersive X-ray spectroscopy (EDX) measurements of nitride layers, the samples were cut along the surface normal, embedded in conductive resin and ground and polished in several steps. Final polishing was done with oxide polishing suspension.
III. THICKNESS MEASUREMENTS
If the X-ray penetration depth is sufficient to pass two times through the thickness of a coating layer, diffraction peaks from the substrate can be detected. It is assumed that the thickness of the substrate is infinite with respect to the penetration depth of X-rays. From a measurement of the diffraction intensity of the substrate with coating IS,C and without the coating I S,0 the X-ray absorption of the coating layer can be calculated and thus the layer thickness dC:
 $$I_{S, C} = I_{S, 0}\cdot \exp ( {-\mu_Cx_C} ), $$
where μC is the linear absorption coefficient of the coating and xC is the length of the X-ray beam path through the coating (Figure 1(a)):
 $$x_C = d_C\cdot \left({\displaystyle{1 \over {\sin ( {\theta_0} ) }} + \displaystyle{1 \over {\sin ( {\theta_S-\theta_0} ) }}} \right).$$
X-ray beam path through a single coating layer (a) and multiple layers (b).
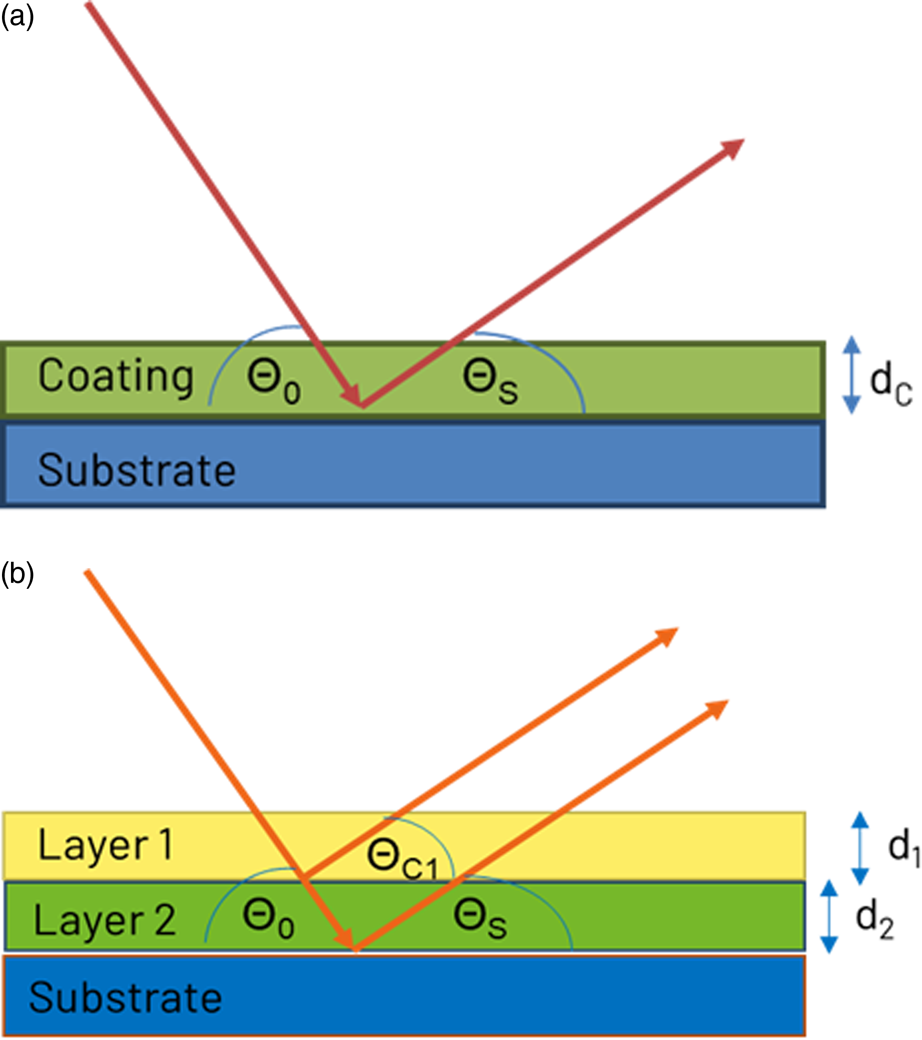
As the length of the beam path depends on the X-ray incidence angle θ 0 and the diffraction angle θ S of the observed substrate diffraction peak, lower angles are more suitable for thin or low absorbing layers while higher angles are more suitable for thicker or high absorbing layers.
If more than one layer is present, it is generally necessary to know the diffraction intensity of an infinitely thick reference IC,ref of the same material (Figure 1(b)). With the assumption that the diffracted intensity of the top layer is proportional to the absorption of this layer, the diffracted intensity IC is:
 $$I_C = I_{C, ref}\cdot ( {1-\exp ( {-\mu_Cx_C} ) } ) .$$
The diffraction intensity of the substrate IS,cor without the top layer can then be calculated:
 $$I_{S, cor} = I_S\cdot \exp ( {\mu_cx_{C, S}} ) ,$$
where xC,S is the beam path through the top layer for the observed diffraction angle of the substrate. The thickness of the next coating layer can be calculated with Eqs (1) and (2).
This calculation can be extended to more than two layers. However, for N layers generally N−1 reference intensities from bulk samples of the same materials are necessary. Furthermore, it is necessary that the layers are well separated and have even surfaces.
All X-ray linear absorption coefficients were calculated with the software Bruker AbsorbDX (based on values given in Elam et al. (Reference Elam, Ravel and Sieber2002) and Ebel et al. (Reference Ebel, vagera, Ebel, Shaltout and Hubbell2003)). An alternative source for X-ray linear absorption coefficients is for example Reference Hubbell and SeltzerNIST-5632.
IV. EXAMPLES
A. Zinc coating and thickness mapping
Zinc is a common coating of steel products to protect them against corrosion. Typical thicknesses are 2.5–20 μm, in some cases also significantly more. The coating is mostly done by hot-dip or electrogalvanizing.
For the X-ray measurements of Zn coatings with less than 10 μm thickness, the Fe-{110} reflection was measured with an incident angle of 34°, for thicker coatings the Fe-{220} reflection was used with an incident angle of 45° to achieve a higher penetration depth. The measurement time per 2D-Frame was 100 s. After the measurements, the Zn coating on a small area of a sample was removed by hydrochloric acid and the reference diffraction intensity of the Fe substrate was measured with identical conditions. A linear X-ray absorption coefficient of Zn for FeKα radiation of μZn = 770 cm−1 was used for the calculations.
With the XYZ stage of the diffractometer, a grid of 230 points on an area of 40 mm × 57 mm was measured with a step size of 3 mm. This enables one to map differences in the Zn coating thickness within an area of about 24 cm2. Results for a Zn coating with a reference thickness of 3 μm are shown in Figure 2.
Mapping of Zn coating with 3 μm reference thickness. Calculated coating thickness without (a) and with height correction (c). Measured lattice spacing of Fe-{200} reflection without (b) and with height correction (d).
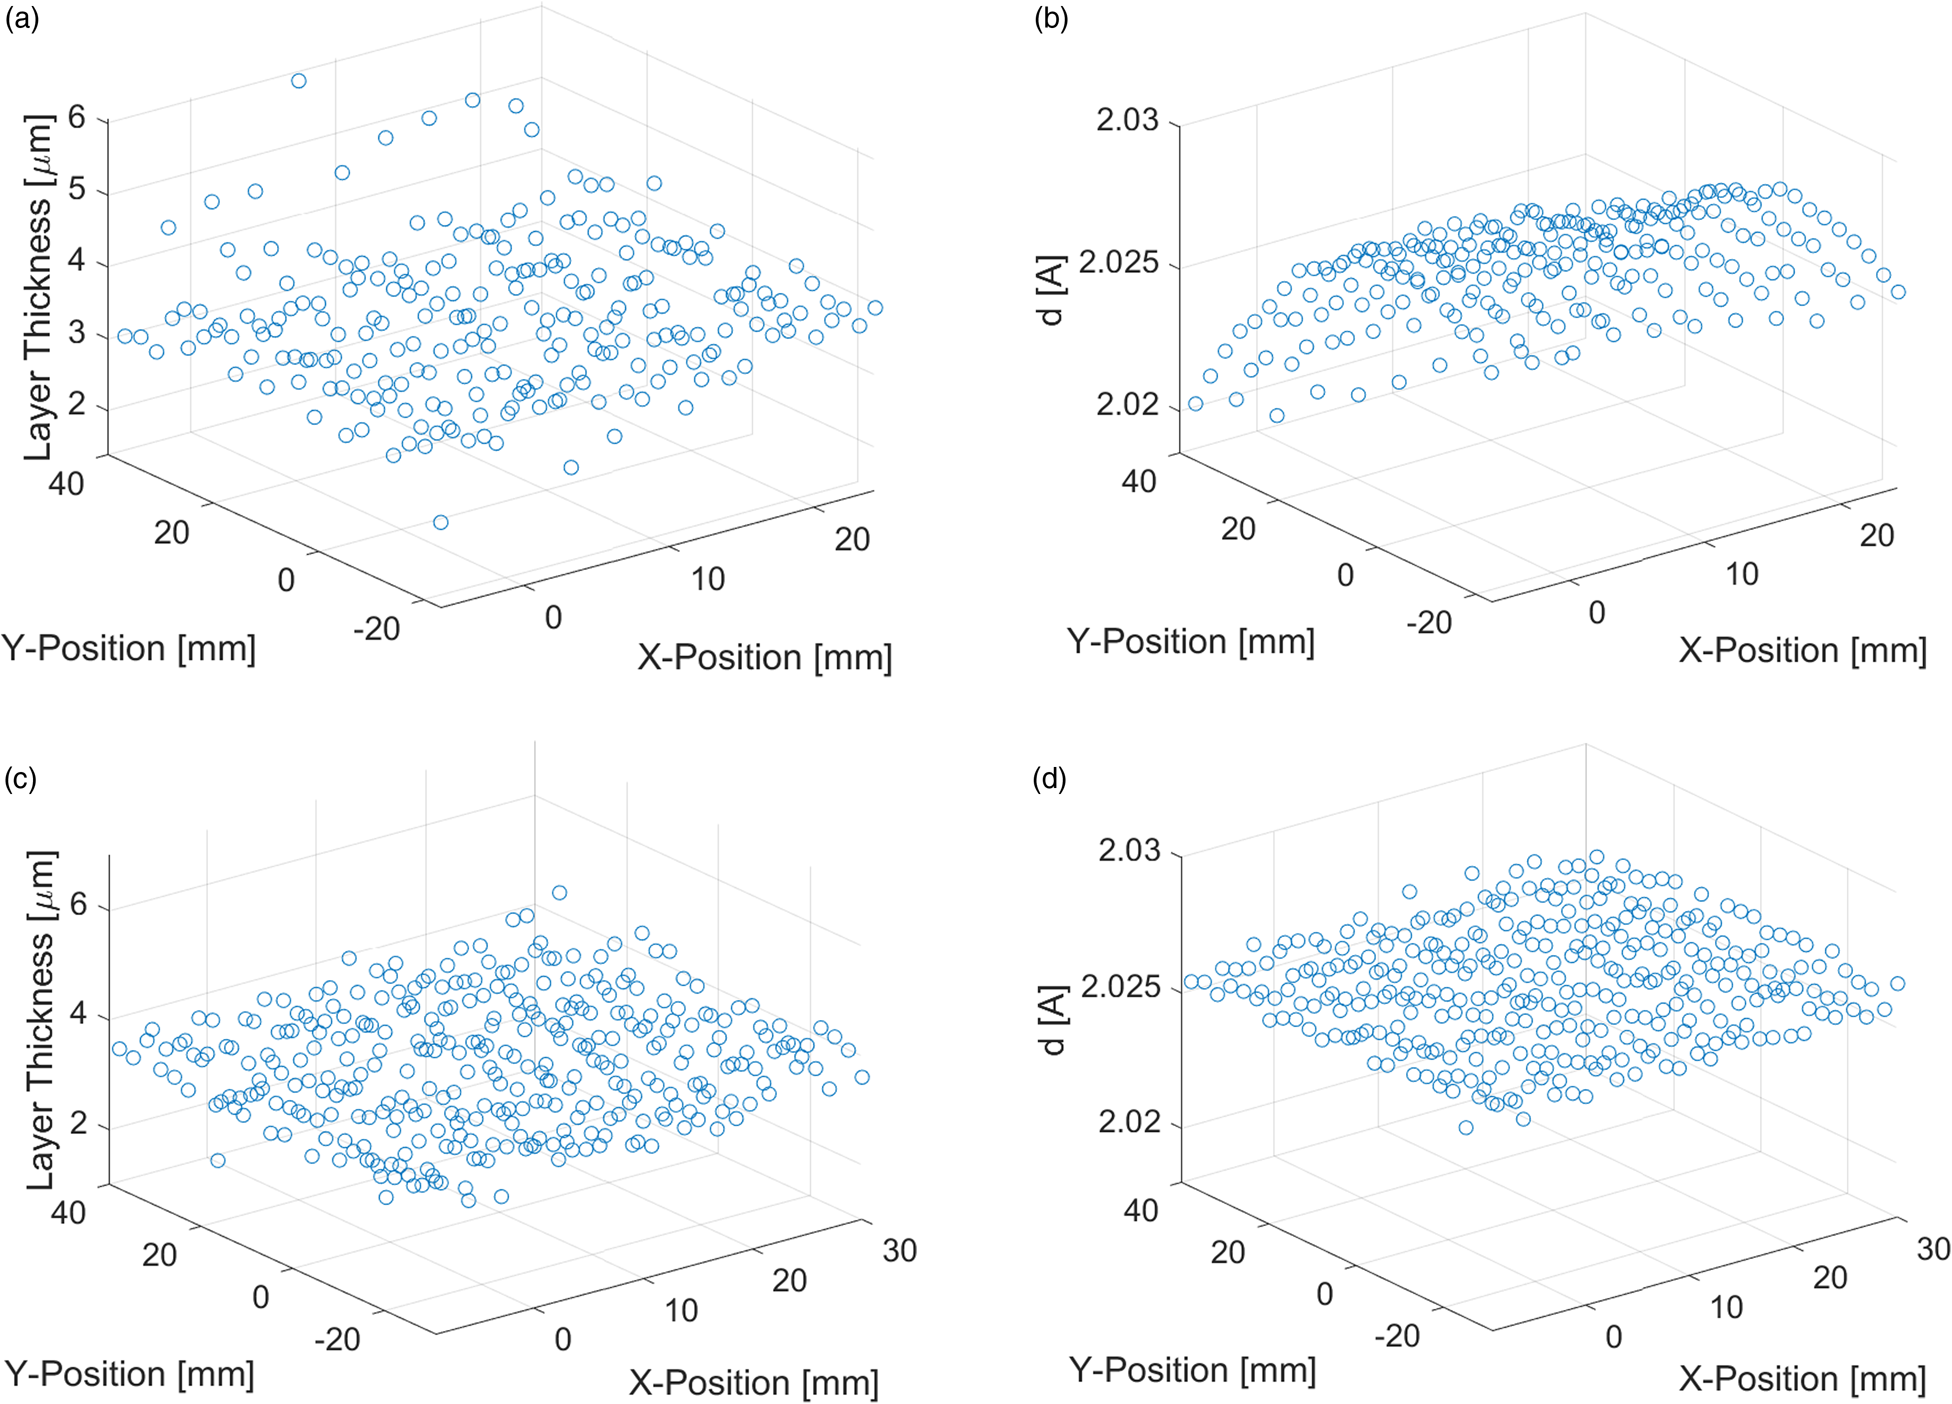
Due to the curvature of the sample surface, a defocusing of the X-ray beam occurred, which caused a larger scatter of the measured thickness and a curved deviation of the X-ray peak positions (Figures 2(a) and 2(b)). An automatic sample height correction routine using a laser/video system could be applied to set the correct focus for each measurement point. With this correction, the scatter of the measured thickness values was significantly reduced, and the peak positions were stable (Figures 2(c) and 2(d)). For the investigation shown in Figure 2, the magnitude of this height correction was 680 μm and it reduced the maximal deviation of the measured Fe-{200} d-spacing from 1.1×10⁻² Å to 1.9×10⁻³ Å. The point at x = 0 mm and y = 40 mm was close to the laser cutting edge of the sample, which explains the lower Zn thickness at this point due to local evaporation of Zn.
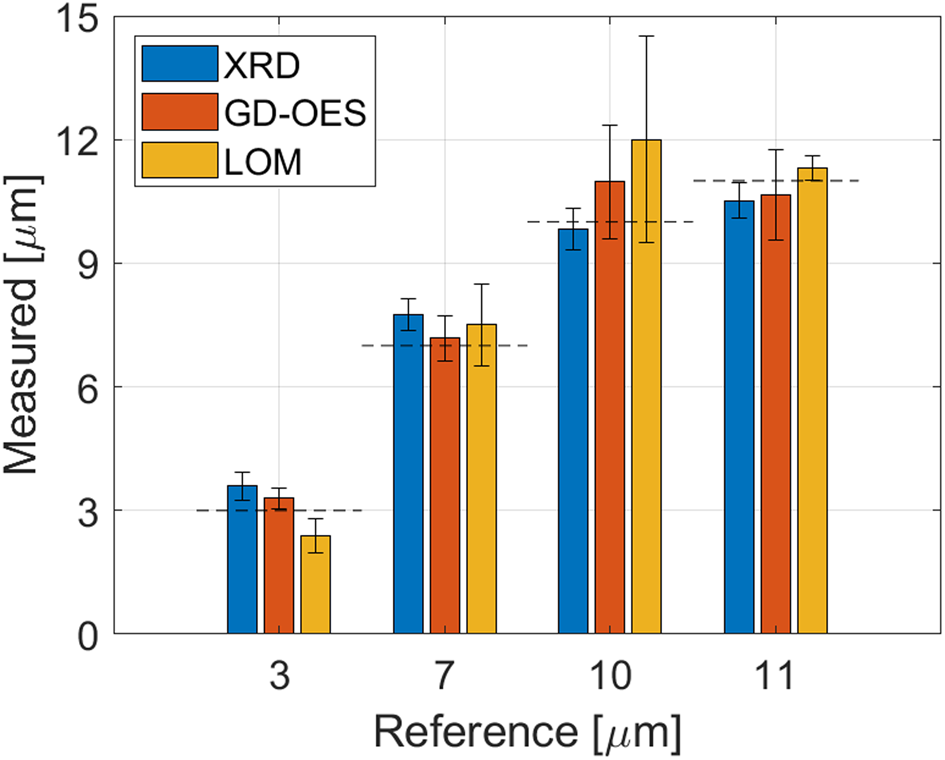
To validate the accuracy of the XRD thickness measurement, four zinc coatings with thicknesses of 3, 7, 10, and 11 μm were also measured with glow-discharge optical emission spectroscopy (GD-OES; Payling and Nelis, Reference Payling and Nelis2007; Wilke et al., Reference Wilke, Teichert, Gemma, Pundt, Kirchheim, Romanus and Schaaf2011) and light optical microscopy (LOM). For reference, the thickness was also calculated gravimetrically from the weight of deposited Zn per square meter.
The agreement of the XRD results with the other methods (Figure 3) is high and the mean relative deviation from the gravimetric reference value is 9%.
Comparison of XRD thickness measurements with result from GD-OES and LOM. The reference thickness is determined gravimetrically and shown as a dashed line. The error bars show the standard deviations of several measurements.
As a use case for an XRD thickness mapping, a scratch on an 8 μm Zn coating (Figure 4(a)) was investigated and compared to atomic force microscopy (AFM) measurements. In the XRD mapping results in Figure 4(b), a clear reduction of Zn coating thickness of about 1 μm is visible in the direction of the scratch. Also, the AFM image in Figure 4(c) shows a depression of 0.5−1.5 μm in the scratch direction.
Scratch on Zn coating. (a) Overview, (b) XRD thickness map, and (c) surface topography measured with AFM.
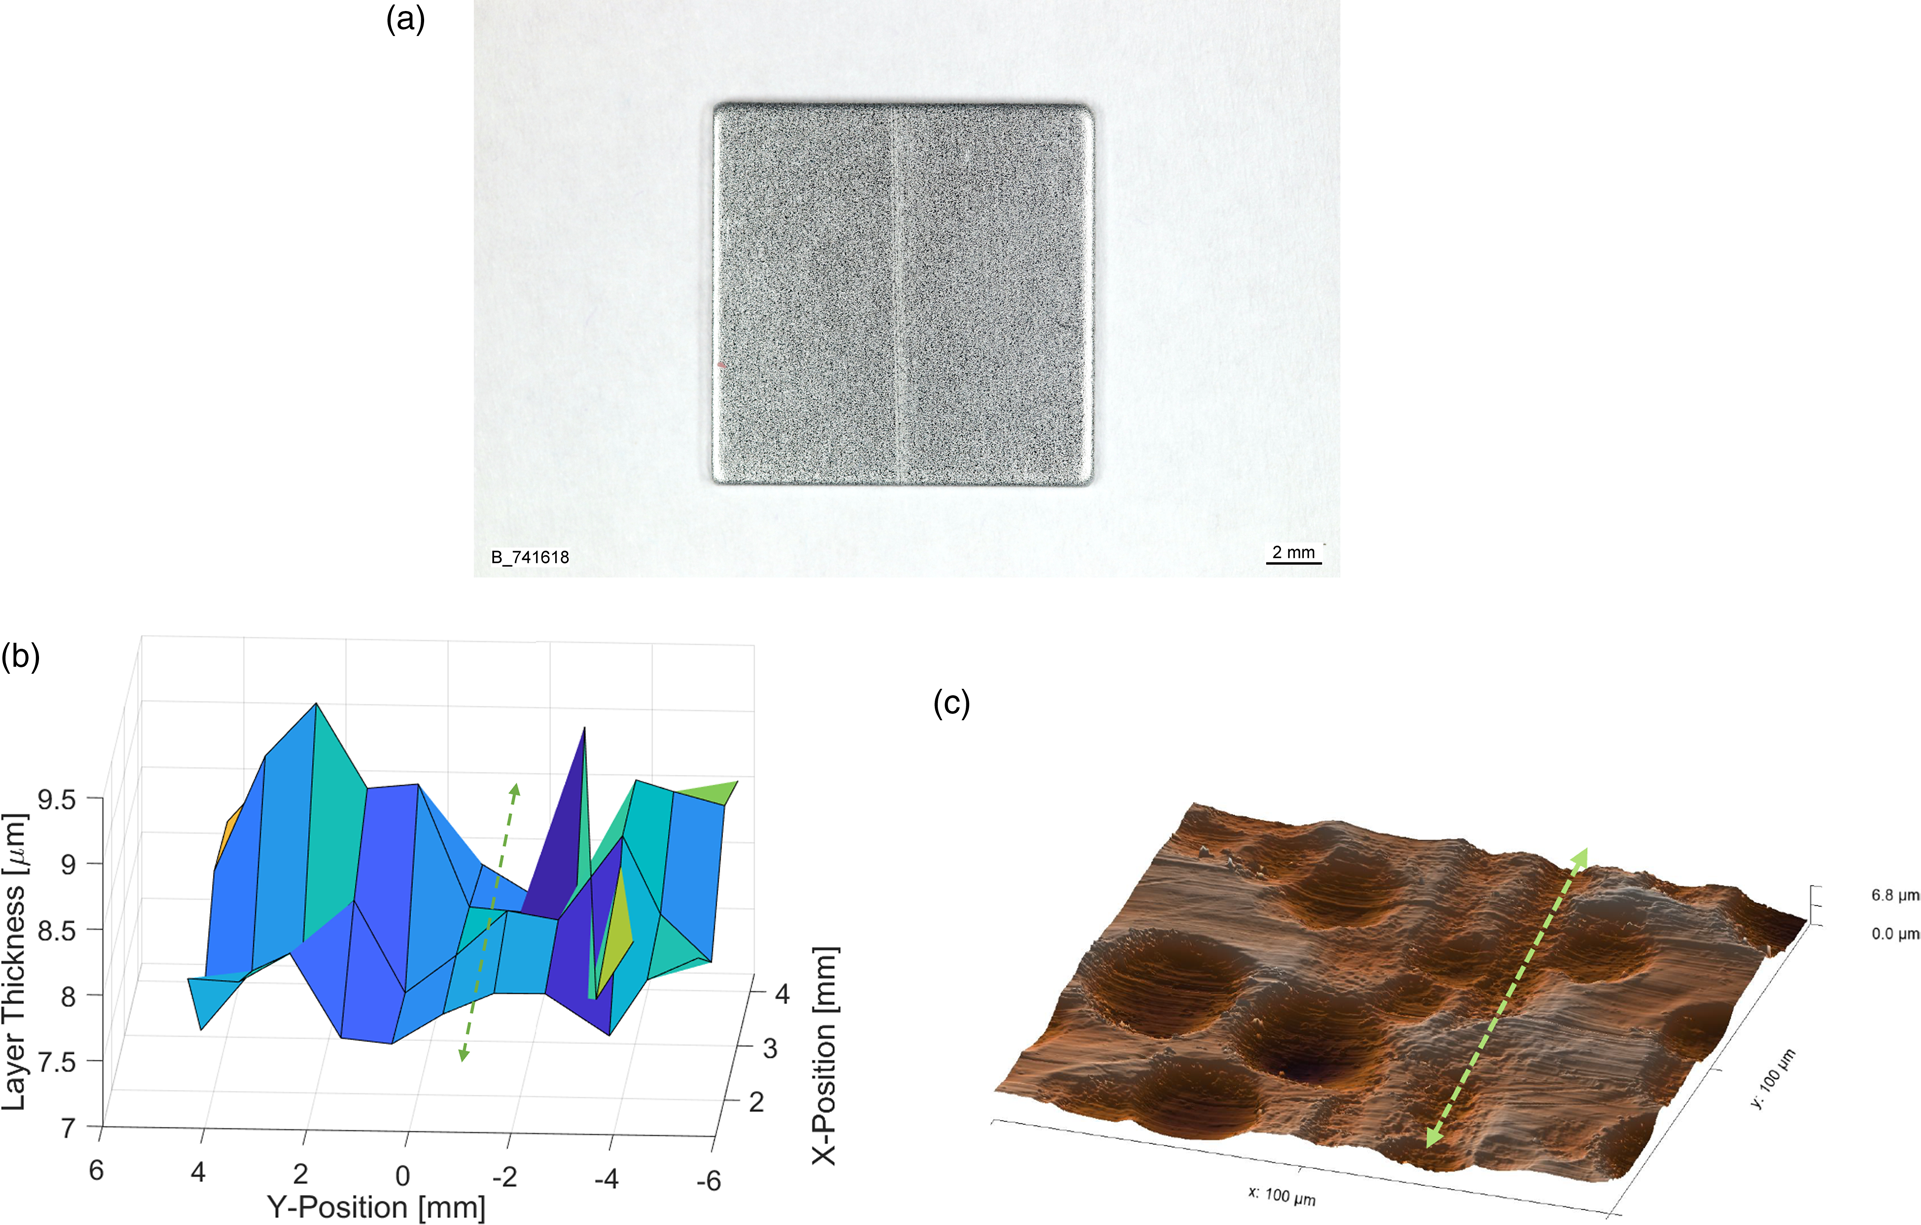
The surface of the Zn coating was textured with the PRETEX© skin-pass rolling process to produce cup-shaped indents (Figure 4(c)), which increased the scatter of the XRD thickness measurement. Regardless, the scratch path was clearly visible in the XRD thickness map. As the Zn thickness reduction coincides with the depression in the surface topography, a scratch on the steel substrate, which could have been replicated during the Zn coating process, can be excluded.
B. XRF standard for thickness measurements
For the validation of the XRD measurement of multilayer thickness, the XRF reference standard CFVLO from Helmut Fischer with 0.88 μm Cr/7.3 μm Ni/Fe was investigated. The thickness calculations were done with the approach for multilayer coatings described above.
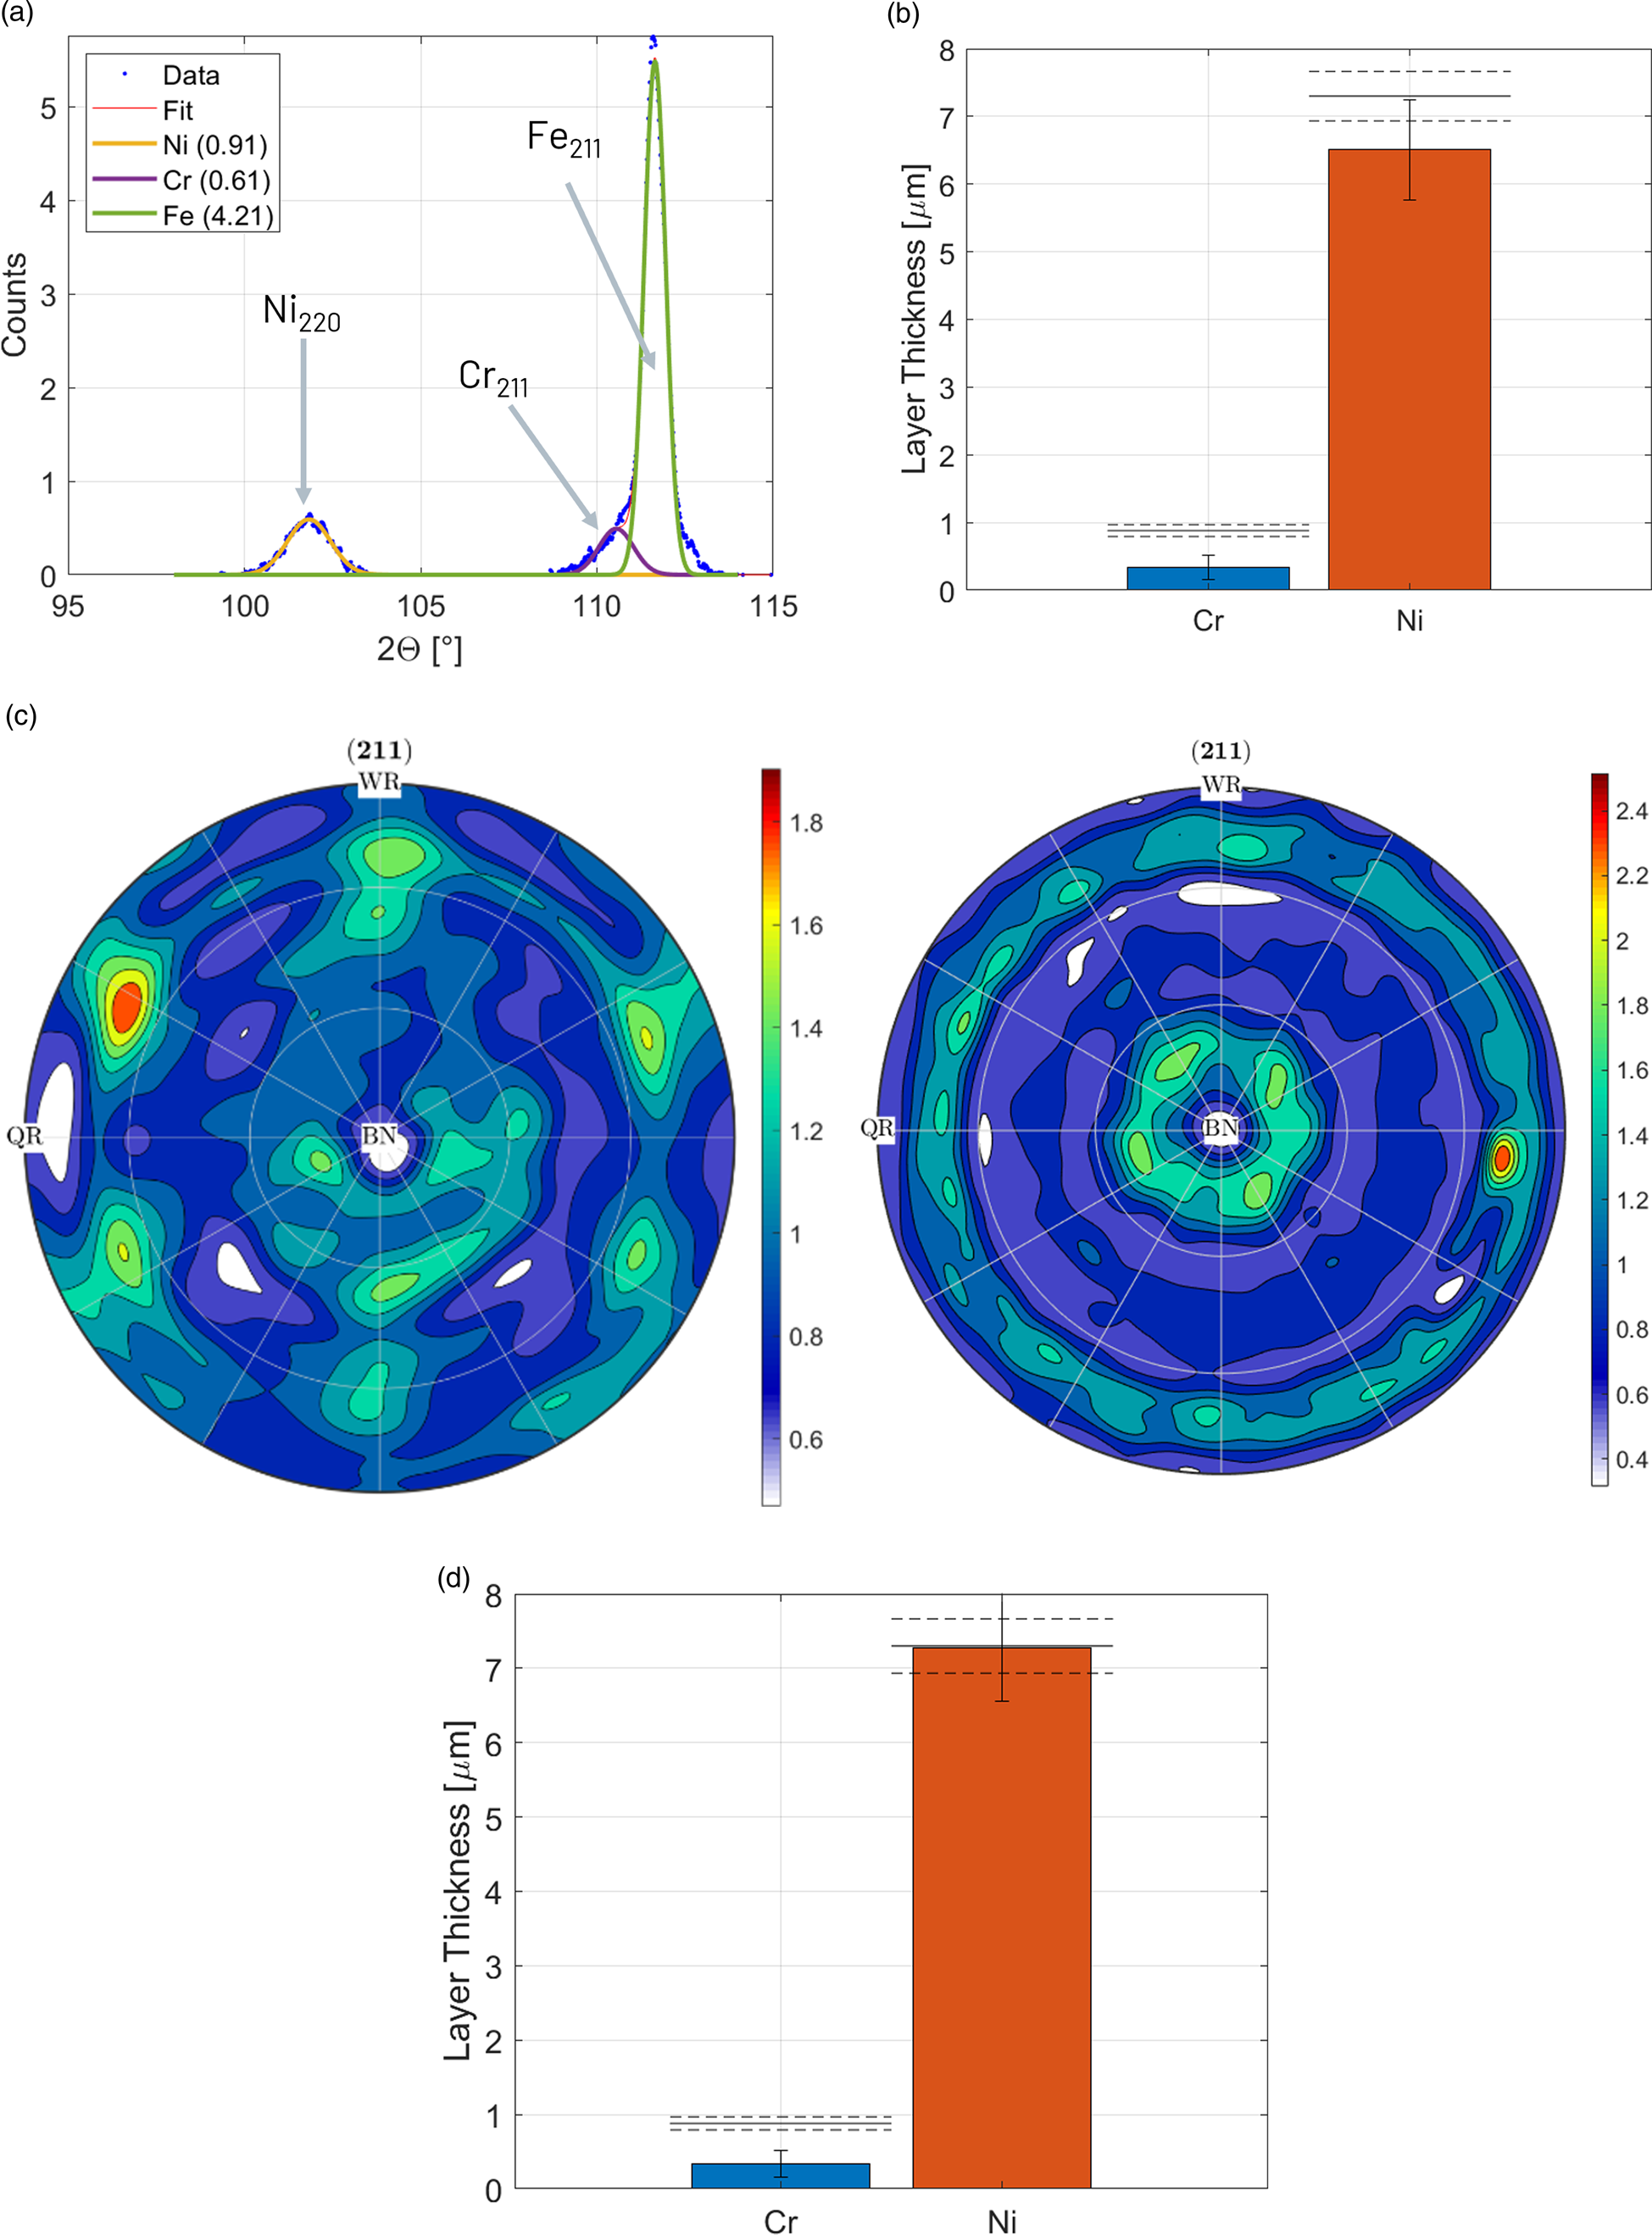
The intensity of the Cr- and Fe-{211} diffraction peaks was measured with an incident angle of 50°. To deal with the overlap with the Fe-{211} diffraction peak, both peaks were fitted simultaneously with two gaussian functions (Figure 5(a)). As Cr causes strong X-ray fluorescence with FeKα radiation (linear X-ray absorption coefficient μCr = 3157 cm−1), the intensity background is very high, especially with an area detector without secondary X-ray optics. To determine the Cr layer thickness, a reference intensity was measured on a high purity Cr sputter target.
XRD thickness measurements of XRD standard CFVLO. (a) Diffraction signals of Cr-{211} and Fe-{211} overlap. (b) Initial XRD results compared to reference values (dashed lines). (c) Recalculated Fe-{211} pole figures of hot-strip reference sample (left) and Fe substrate of standard CVLO (right). (d) XRD results after texture correction of Fe intensities compared to reference values (dashed lines).
Since the coating layers could not be removed for the measurement of the Fe substrate intensity without destroying the XRF standard, an arbitrary low-alloyed hot-strip steel sample was used as reference. A hot-strip sample was chosen because of its low alloying content, fine grain size (<10 μm), low dislocation density, and weak crystallographic texture (maximum of orientation distribution function < 10). For the absorption of the Ni layer, an X-ray absorption coefficient of μNi = 808.5 cm−1 was applied.
The calculated layer thicknesses in Figure 5(b) are significantly lower than the reference values of the standard. As the reference intensities were not measured from the standard Fe substrate material, texture differences may cause intensity deviations. To correct for these deviations, the textures of the hot-strip steel sample and of the Fe substrate of the standard were measured and complete pole figures recalculated with the Matlab toolbox MTEX (Hielscher and Schaeben, Reference Hielscher and Schaeben2008). During the thickness measurement, the sample was not rotated nor tilted, thus the intensities correspond to the center of the recalculated pole figures (Figure 5(c)). However, as an area detector was used, the intensity of the thickness measurements was actually integrated in a line segment, corresponding to a virtual tilt angle of ±12°. To take the texture differences into account, the mean {211} pole figure intensity in such a line segment in multiples of a random texture distribution was used to scale the intensities of the Fe reference and standard Fe substrate to a random texture.
The results after texture correction in Figure 5(d) show an excellent agreement for the Ni layer thickness but still a too low thickness of the Cr layer. The deviation of the Cr layer is caused by several factors: strong X-ray fluorescence, peak overlap, and the combination of these two factors also made texture corrections impossible.
C. Iron nitride and oxide layers on steel
Nitriding is a common technique to increase the surface hardness of steel. An additional oxide layer on top of the nitride layer further improves the corrosion resistance of the surface. During nitriding generally two different iron nitrides, γ-Fe4N and ε-Fe3N, are formed. The phase fraction of these two nitrides affects the final properties of the hardened surface layer. As the γ-Fe4N and ε-Fe3N are polymorphs, they are best discriminated by diffraction methods, e.g., XRD or EBSD.
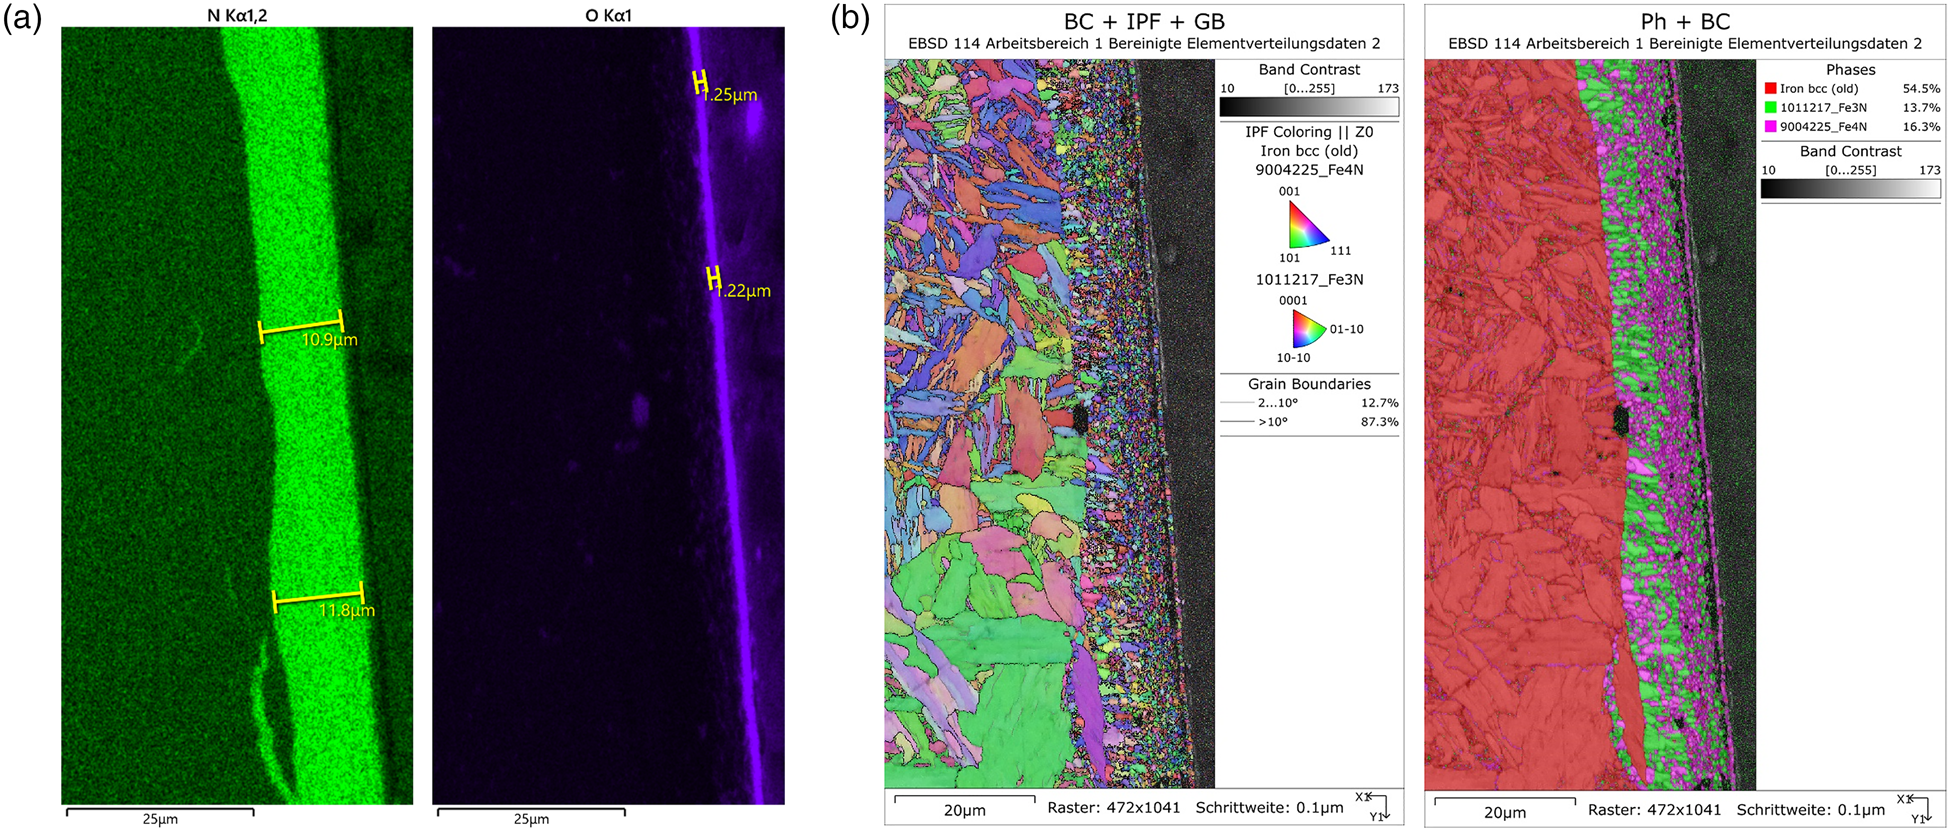
The EDX maps in Figure 6(a) show a ~11.5-μm thick nitride layer and an ~1.2-μm thick oxide layer on a steel substrate. Based on the EDX signal, a discrimination of the two iron nitrides was not possible. With EBSD, the fine-grained nitride phases could be readily identified and quantified (Figure 6(b)). As the two nitride layers are not well separated from each other, it will not be possible to determine their respective thickness with XRD. Thus, they will be treated as one layer with a mean linear absorption coefficient:
 $$\mu _{{\rm Fe}_x{\rm N}} = 0.5\ast ( \mu _{\rm Fe_3N} + \mu _{\rm Fe_4N}) = 0.5\ast ( 537 + 494) \,{\rm c}{\rm m}^{{-}1} = 516\,{\rm c}{\rm m}^{{-}1}.$$
EDX and EBSD measurements of nitride and oxide layers on steel. (a) EDX intensity map of N (left) and O (right). (b) EBSD maps of grain orientations (left) and crystallographic phases (right, Fe in red, Fe3N in green, and Fe4N in magenta).
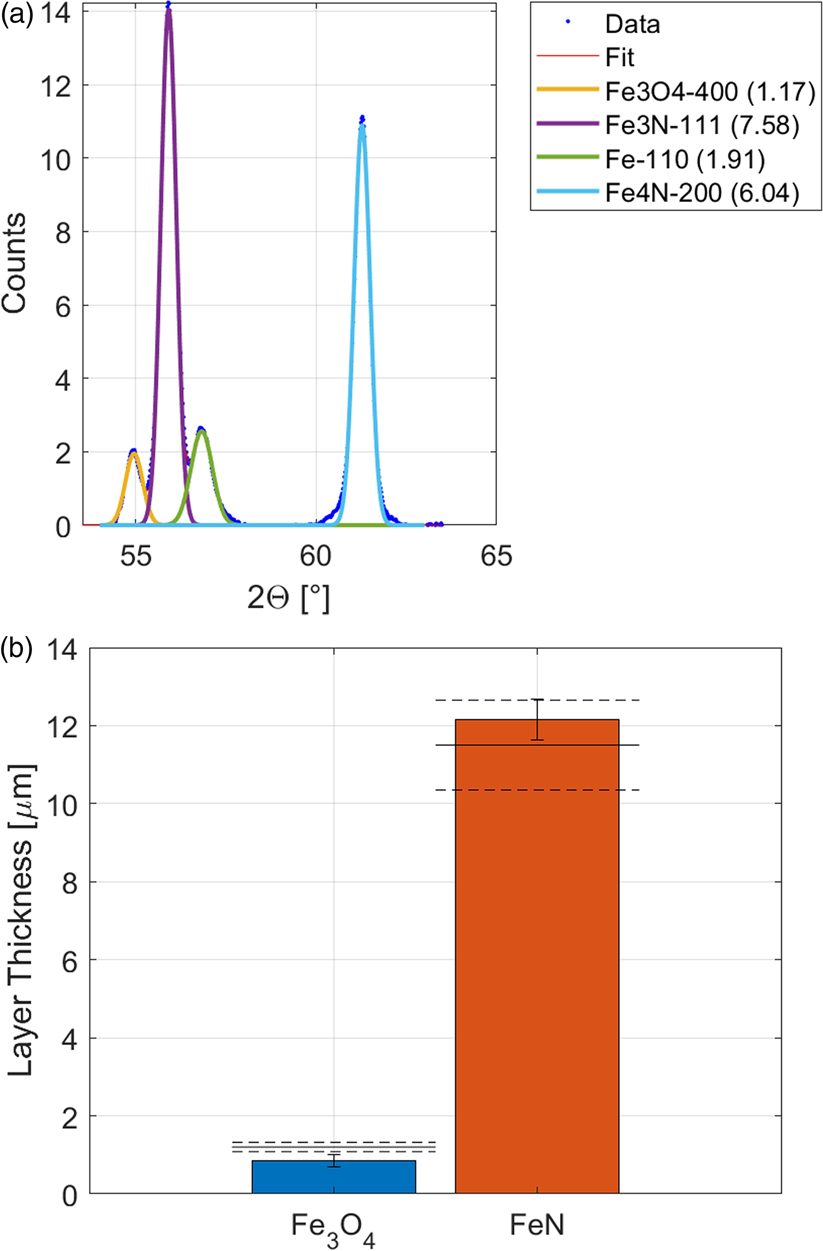
With the method for the determination of multilayer thickness, presented above, the thickness of the nitride and oxide layer were determined with XRD (Figure 7). The XRD measurement showed that the oxide layer is Fe3O4 (magnetite). As reference material for Fe3O4, a measurement on thick oxide scale on a steel slab was used with contained about 90% Fe3O4. The linear absorption coefficient of Fe3O4 was taken as μ Fe3O4 = 298 cm−1. The results in Figure 6(b) show a good agreement for the total thickness of the iron nitride layer and a too small thickness of the iron oxide layer. The matching of the oxide layer thickness would assumingly be better with a pure and texture-free reference sample, which was not available at the time.
XRD measurements of nitride and oxide layers on steel. (a) Diffraction signal of the iron substrate and the different nitride and oxide phases, incident X-ray angle 35°. (b) Result of the XRD thickness measurement. The layer thickness determined from EDX is shown as dashed lines.
V. SUMMARY
It was demonstrated that XRD thickness measurements by X-ray absorption are a potential method to determine the thickness of one or several layers in the micrometer range. Three different coating systems (Zn, XRF standard (Ni + Cr layer on Fe substrate) and nitride/oxide layers on steel) were investigated and the XRD results showed good agreement with other measurement techniques (GD-OES, LOM, EDX).
For the measurement of N layers generally N−1 reference materials are necessary. To avoid errors originating from the determination of substrate reference intensity, it is preferential to measure the X-ray intensity of the substrate after removal of the surface layers. If this is not possible, other suitable samples of the substrate material can be used, but this may require additional corrections, to account for differences of crystallographic texture. For a 2D thickness mapping on non-flat surfaces, height differences must be corrected to achieve accurate results.
Furthermore, the presented method is also suitable to determine to thickness of polymorph layers, e.g., different oxide states, if the layers are well separated and suitable reference materials are available.



