


I. INTRODUCTION
The advent of new personal viewing headsets for 3D visualization has seen marked growth in recent years (Xiong et al., Reference Xiong, Hsiang, He, Zhan and Wu2021). Systems such as the HTC Vive and other headsets have spearheaded virtual reality (VR) visualization capabilities for the gaming industry. These PC-based systems make use of the latest developments in graphic processing power that enable the rapid calculations required to maintain visual perception without latency. The gaming industry, while often first to market with such new developments, is not the only industry that stands to benefit from this new technology. There are many additional applications for VR in industry. For example, VR systems can be used for virtual safety training (Li et al., Reference Li, Liang, Quigley, Zhao and Yu2017). Similarly, augmented reality (AR) headsets enable simultaneous viewing of a virtual and real-world environment (e.g., Google glass) that can support education in the medical profession (Nakhla et al., Reference Nakhla, Kobets, De la Garza Ramos, Haranhalli, Gelfand, Ammar, Echt, Scoco, Kinon and Yassari2017). There are many opportunities to employ VR applications for materials science applications as well. Recently, our team documented the use of VR for viewing micro-Computed Tomography (μCT) and texture/strain XRD 3D datasets (see Rodriguez et al., Reference Rodriguez, Pillars, Valdez, Griego, Gallegos, Krukar, Polonsky and Wolfley2022). A natural extension of this work has been to pursue the visualization of crystal structure data in a VR environment. This was driven primarily by the need for a greater sense of presence around and within crystal structure lattices. There is a common theme regarding the difficulty in presenting information that requires visualizing in 3D (Extremera et al., Reference Extremera, Vergara, Dávila and Rubio2020). The challenge for any crystallographer is to visualize data in 3D while being constrained by the inherent limits of 2D viewing (paper, PC monitor, etc.). This so-called barrier to understanding (Meyer and Land, Reference Meyer and Land2006) remains one of the most challenging aspects for translating 3D information to the observer. VR holds the promise for breaking down this barrier in order to expand comprehension of 3D structures, thereby enabling a highly detailed understanding of materials through intuitive interaction within a 3D environment.
II. EXPERIMENTAL
A. Instrumentation
This work employed the use of the HTC Vive Pro 2 VR headset with connected hand controllers for viewing and manipulating 3D crystal structures. The system runs on a Windows-based computer with an Intel i9 CPU and a NVIDIA Quadro RTX 4000 GPU. Typical speeds for frame rates exceed 60 frames-per-second for visualization purposes, and therefore enable seamless viewing without motion sickness caused by latency of the headset. CAD2VR™ version 2021.0.1, a software program developed in-house at Sandia National Laboratories, was installed on the computer system to serve as a platform for running the CrystalVR plugin. For more details regarding CAD2VR, see the CAD2VR website https://CAD2VR.sandia.gov.
B. Structural data selected
This work employed results extracted from neutron powder Rietveld refinements of Pb0.99(Zr0.95Ti0.05)0.98Nb0.02O3 as documented by Avdeev et al. (Reference Avdeev, Jorgenson, Short, Samara, Venturini, Yang and Morrison2006). This previous study performed both variable temperature (10–295 K) and varible pressure (ambient to 0.62 GPa) experiments. Measurements were performed at the Intense Pulse Neutron Source (IPNS) at Argonne National Laboratories. Crystallographic results were compiled and documented by Avdeev et al. (Reference Avdeev, Jorgenson, Short, Samara, Venturini, Yang and Morrison2006) as well as archived as Crystallographic Information Files (CIFs) and republished within the Powder Diffraction File PDF4+ (Gates-Rector and Blanton, Reference Gates-Rector and Blanton2019). The CIF files were extracted from the database and ported to the VR environment via the CrystalVR plugin application integrated into our CAD2VR platform. CrystalVR leverages the open-source CIF reader Open Babel ver. 2.4.0 (O'Boyle et al., Reference O'Boyle, Banck, James, Morley, Vandermeersch and Hutchison2011) to read and process the CIF files into CrystalVR. The pressure series of CIF files was viewed sequentially to observe the structural changes as a function of increased pressure. Video recording of output was enabled through the embedded recording options in the tool. A tool menu attached to one of the hand controllers and viewable within the VR environment was also employed to allow intuitive manipulation of presented crystal structures.
III. RESULTS AND DISCUSSION
A significant challenge regarding the documentation of work performed in VR stems from the severe limitations in communicating a true immersive experience when the reader cannot be equipped with a headset. Such challenges mirror those outlined in Edwin Abbott's comical book entitled Flatland (Abbott, Reference Abbott2019) where a lowly 2D square strives to imagine a third dimension. To better address this issue, we have done our best to document this work via video, which accompanies this article. See reference (Sandia National Laboratories, 2022) for the url link. The video is the closest we could achieve to providing the reader a contextual presence with the 3D crystal structure data. The video still falls short of the immersive experience provided by the VR headset environment. This is because even in a video format, a true immersive experience is still encumbered by the barrier of the 2D viewing screen. Likewise, the video does not enable the user to tactilely interact with the structures within the VR environment. However, the video does provide a tour of the VR environment from the perspective of a user and can give the reader a sense of the possibilities afforded by the tool. Throughout this article, we refer the reader to the accompanying video and provide screenshot captures of the video as figures herein to highlight certain features that have been enabled in the tool. Timestamps are given [in square brackets] both for the presented figures in this article as well as throughout the body of the text to indicate where in the video the outlined features can be viewed. In this way, the viewer can have a better understanding of the CrystalVR tool.
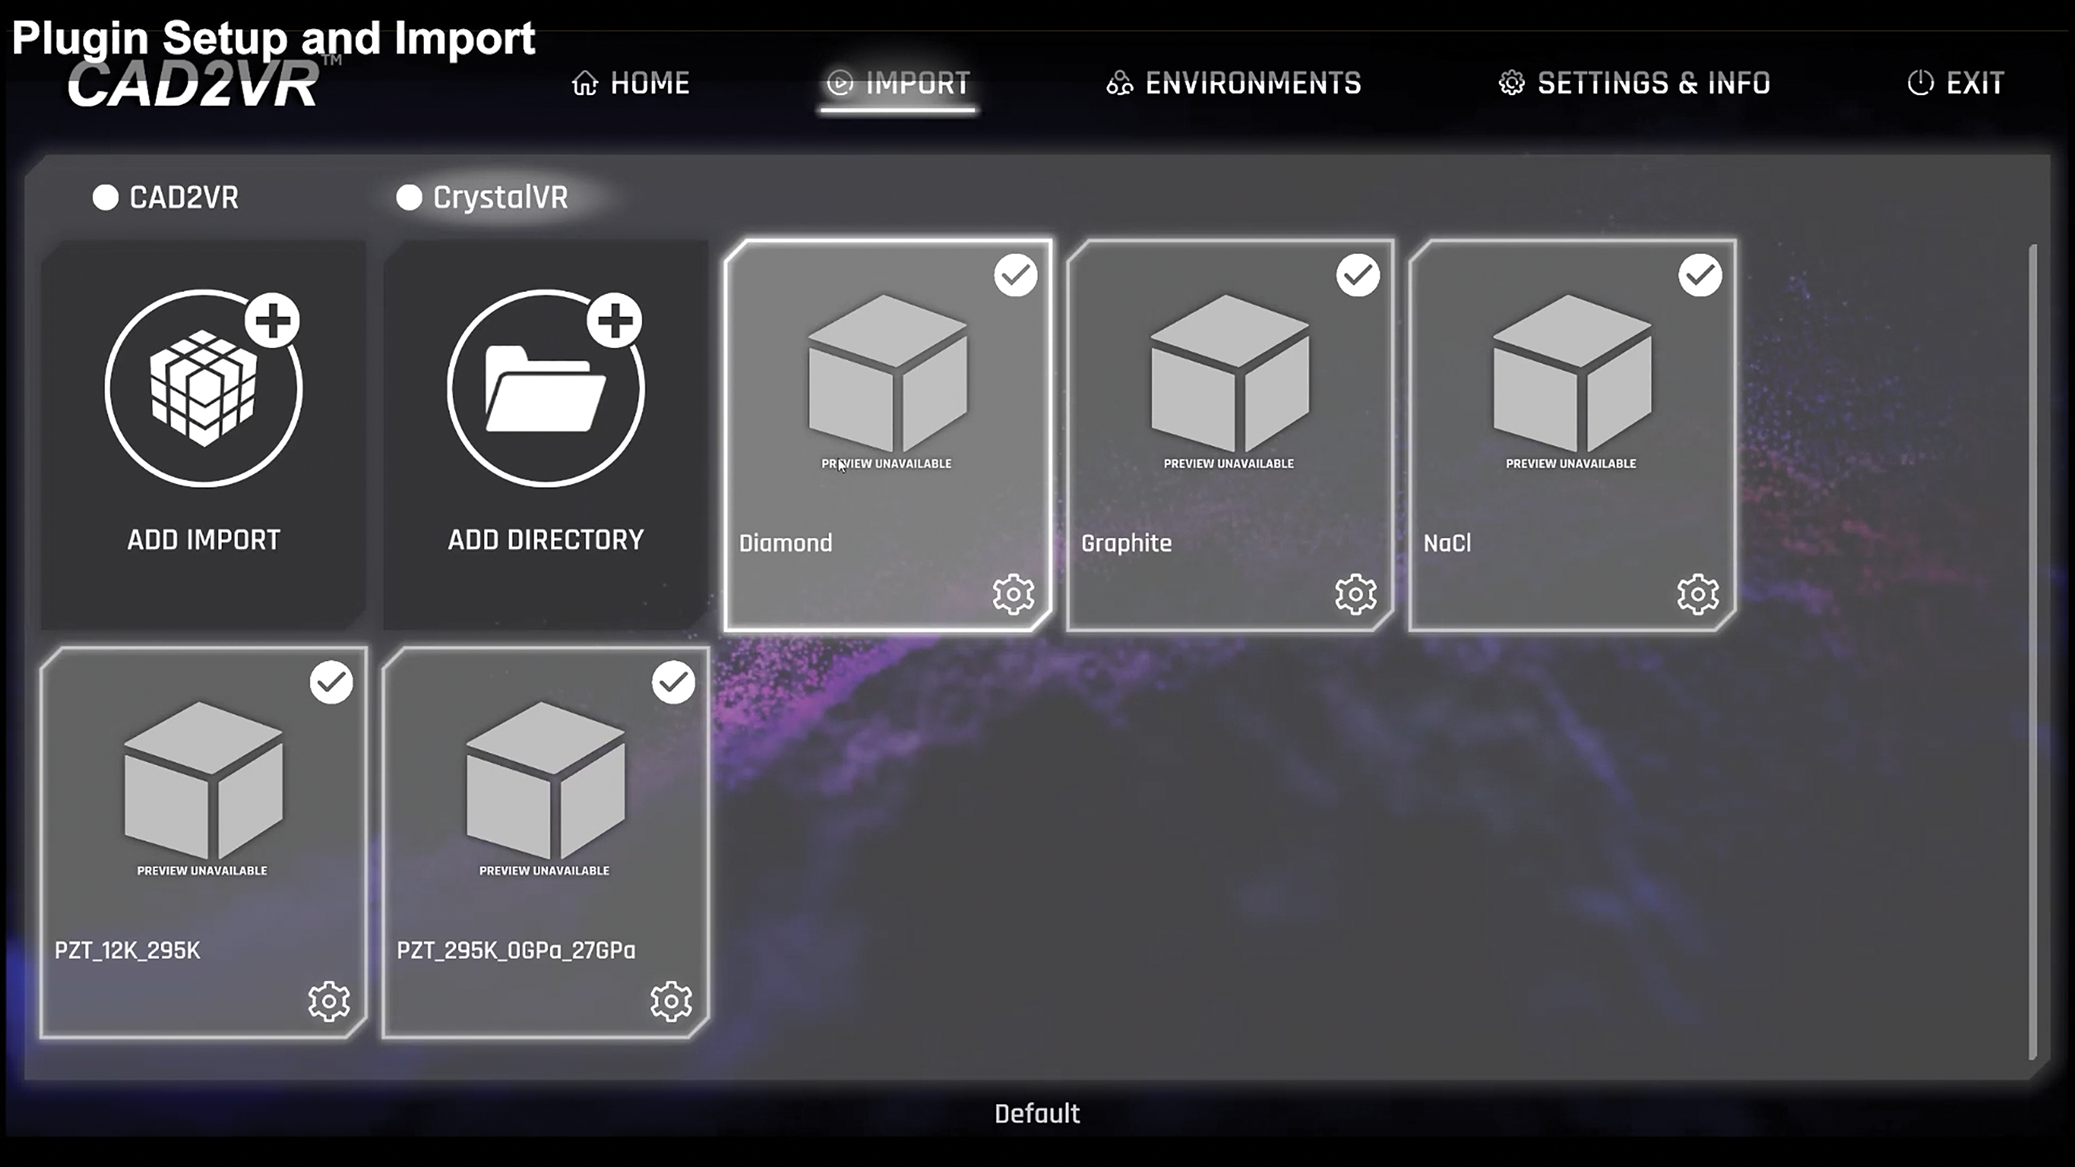
The CrystalVR plugin runs within the larger program CAD2VR. The accompanying video begins the analysis of our 3D structural data by demonstrating how to import the CrystalVR plugin into the main CAD2VR application [01:43]. All the plugin details load into CAD2VR automatically. Once this is accomplished, the import tab contains a CrystalVR section. To add crystal structures written with CIF file formatting, the user can simply locate the files on the computer, select any number of CIF files, and the selected files will populate the menu screen [02:28]. One can also import a directory containing a series of CIF files to be loaded as a data series. This is one of the major benefits of viewing crystallographic data in the CrystalVR tool. Figure 1 shows an example screen for loading CIF files into the CrystalVR plugin application. Note that in this figure there are directories for both a temperature series and a pressure series. The focus within this article shall be given to the pressure series for PZT within the R3c crystal structure, but the analysis is equally viable for the temperature series as well. All discussion for this paper will be for CIF file imports, but the software is also being configured to support other common crystal structure formats such as *.pdb and *.res files via the Open Babel file import reader.
CAD2VR setup and import screen for CIF files showing individual crystal structure CIF import files (diamond, graphite, NaCl) along with CIF file directories containing a series of structures as a function of temperature and pressure [02:28].
There are many embedded features in the CrystalVR tool that can be employed. These include intuitive bond length and bond angle measurement, creation of tablets for more in-depth detail of the structure, and modification of the appearances of bonds and atoms shown in the VR environment. Once in VR, the user can move toward the imported crystal to interact with it [03:39]. The viewed crystal structure can be scaled and grown in any direction by grabbing the corners of the bounding box and expanding or contracting via the hand grips. The structure for lead zirconium titanate (PZT) is shown in Figure 2, having been read into VR via the application. In this figure, the red atoms are oxygen and the blue atoms that they are bonded to are zirconium (Ti and Nb cations also reside on the same Zr site). The dark-grey atoms are lead. The lead atom bonds have been removed to make this structure easier to interpret.
Ambient pressure/temperature PZT crystal structure viewed in VR showing origin hexagonal unit cell (yellow) and additional unit cells generated by symmetry (white). The wrist menu (shown in the lower-right) indicates the active unit cell menu option [04:56].
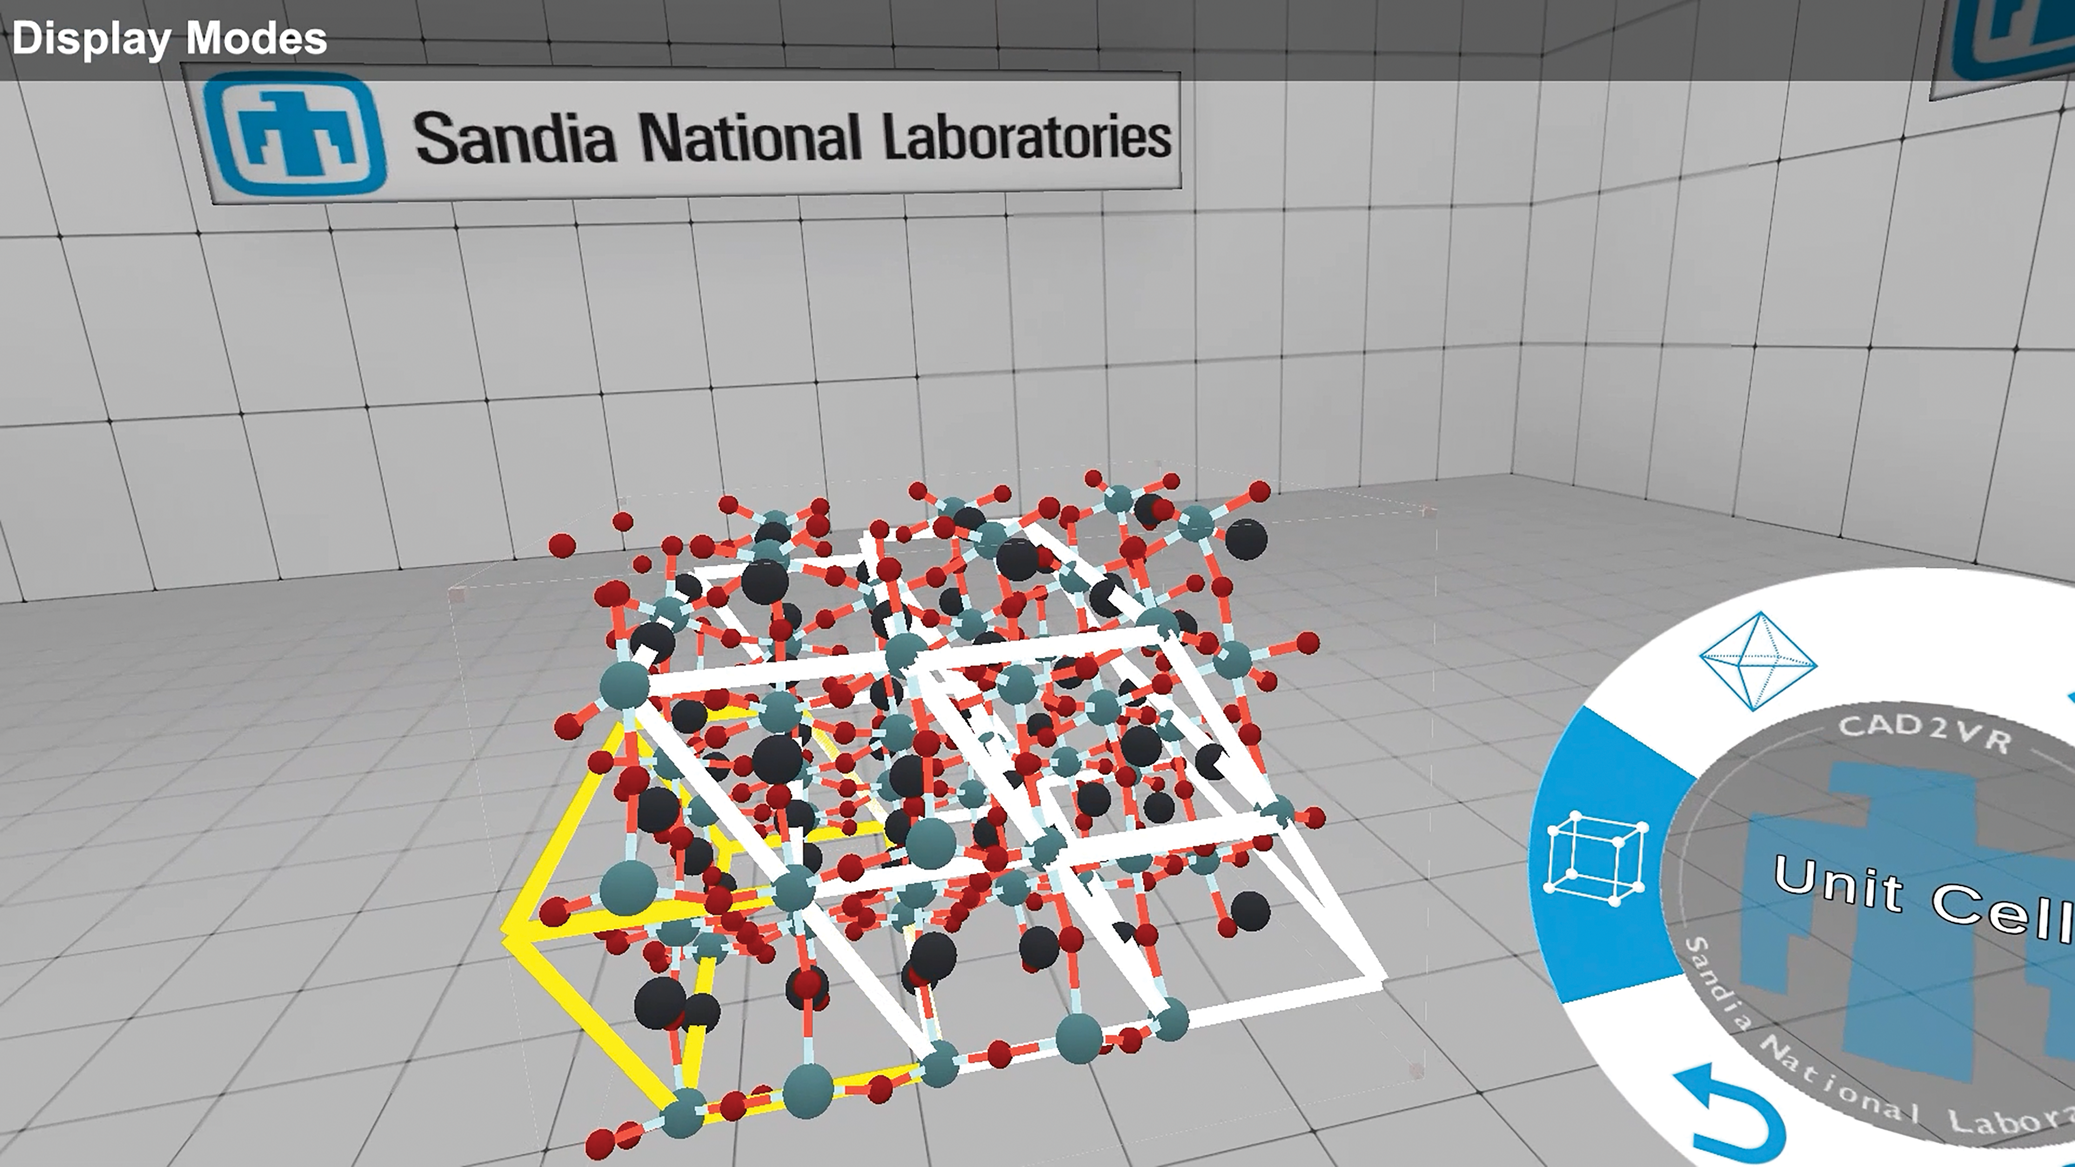
To begin exploring PZT, one can open the display menu [04:36]. From this menu, one can outline the unit cells of the viewed crystal [04:56] via the unit cell option. Figure 2 illustrates the PZT structure at ambient conditions with a rhombohedral (space group R3c) symmetry and employing the hexagonal setting for the unit cell. As the crystal is grown, complete unit cells become outlined in white while the origin unit cell is outlined in yellow. Ball-and-stick is the default display mode for presenting the atoms; a space-filling mode is also available. For simplified viewing, a wire frame option can also be generated. This is of particular use when viewing large molecules such as metal-organic frameworks (MOFs) or proteins. Viewing the coordination polyhedra is another popular method to present crystal structure data and can greatly simplify interpretation of the crystal structure. Standard presentation of the b-site cation coordination in perovskites such as PZT is to generate the octahedron-shaped polyhedra created by the Zr(Ti,Nb) atoms and the oxygen atoms to which they are bonded [05:18]. Presenting the structure via the coordination polyhedra greatly improves understanding of the concerted impact induced by changes in temperature and pressure, as well as how these changes impact the Zr–O framework. Additional display settings are found on the display panel of a virtual tablet. This is one of the more utilitarian features in the VR environment. These tablets are easy to launch into the VR space and can serve as ideal platforms for viewing tabular data and performing additional functions. For example, from such a tablet, one can adjust the scale of the atoms and the widths of the bonds [05:38]. In this way, structures can be manipulated either by use of the wrist menu or by selecting/modifying features in the launched tablets present in the VR environment.
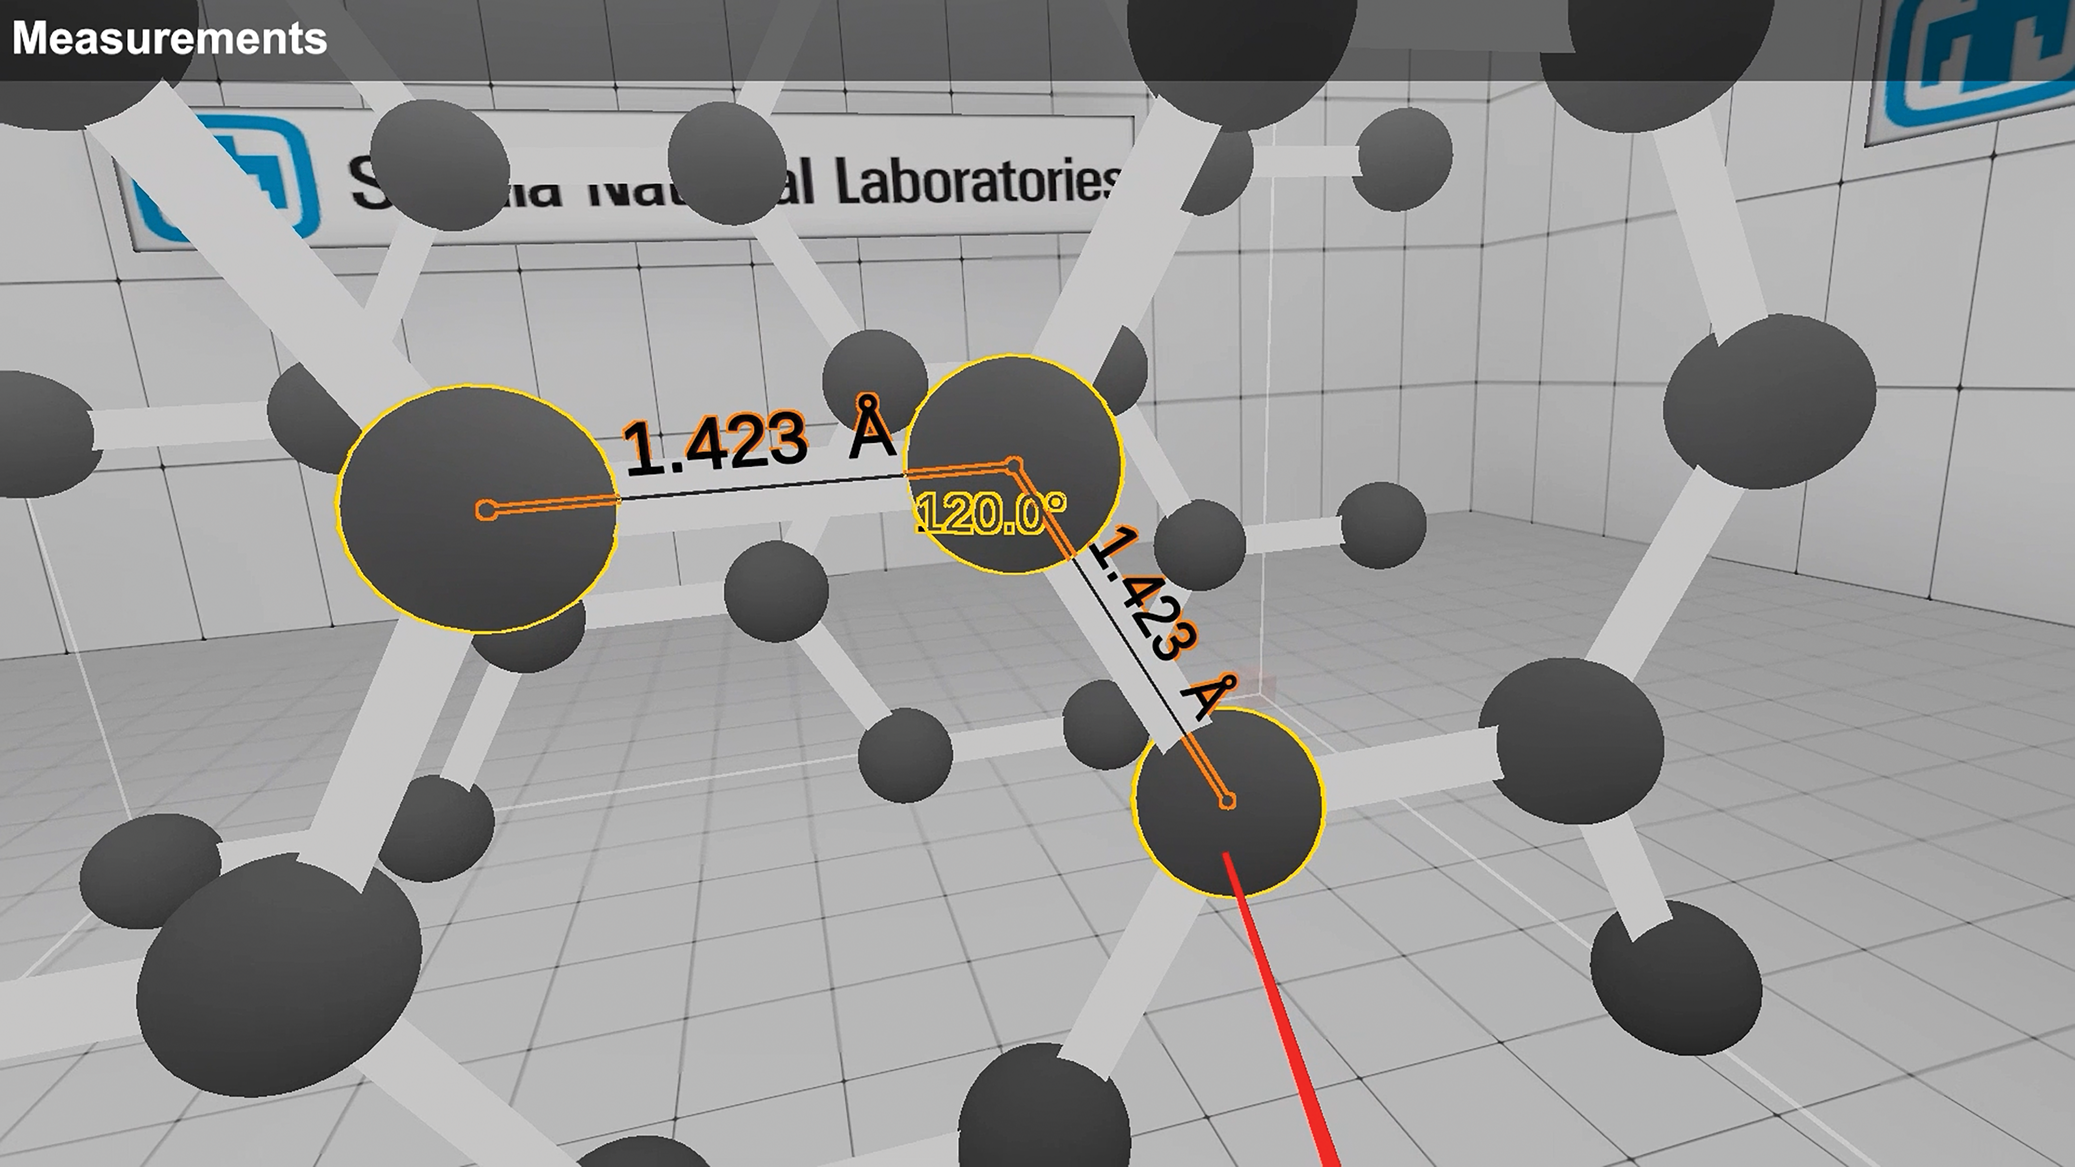
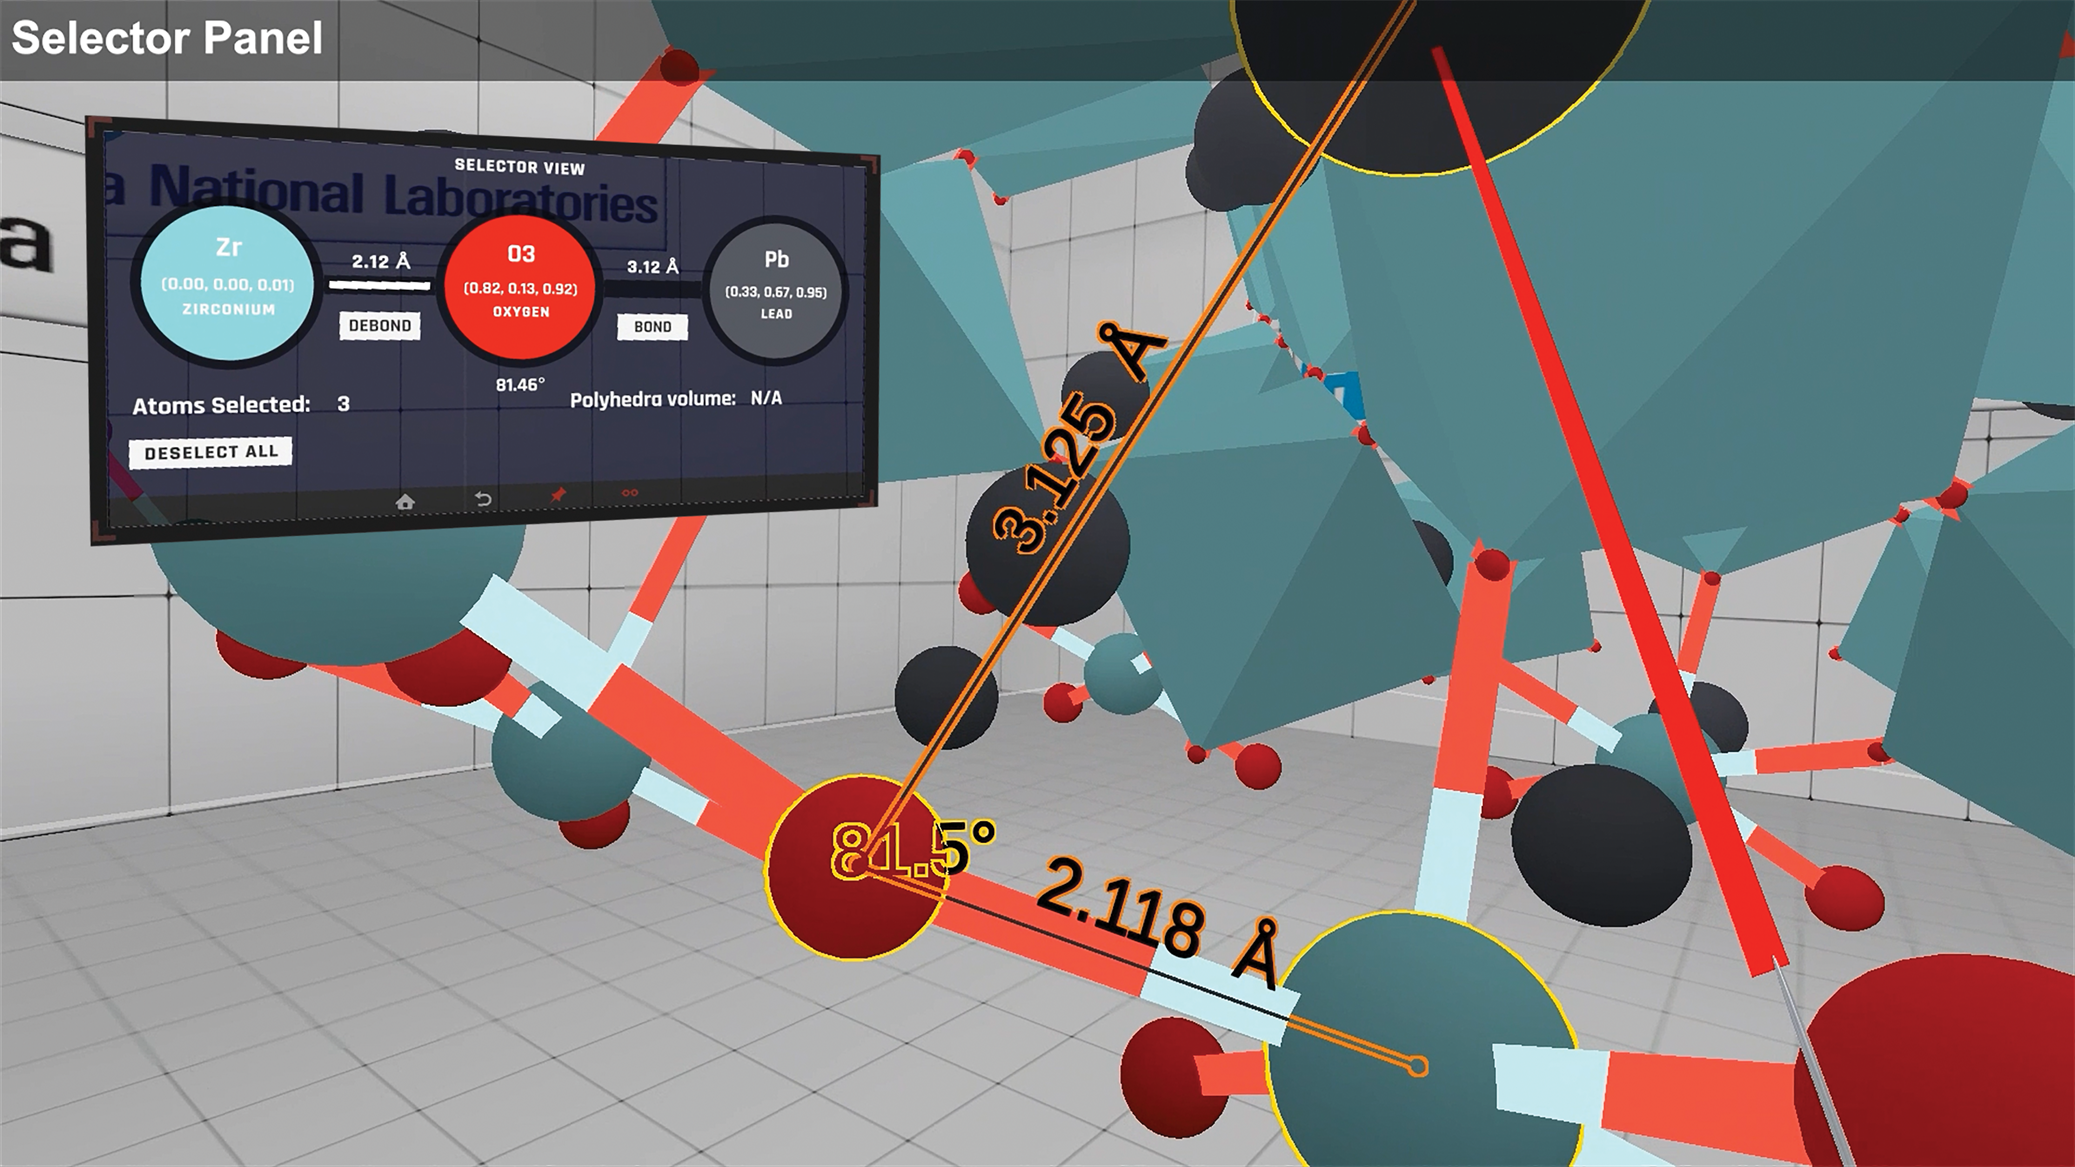
One of the most basic features of molecular analysis is the measurement of bond lengths and angles. It was our goal to make this process as intuitive as possible for the user. Such measurements can be performed by enabling the Atom Selector Tool found in the wrist menu. The Atom Selector Tool is located within the CrystalVR plugin selector menu [06:55]. Once enabled, one can select atoms the same way that one would grab a part via the hand controllers. By selecting two atoms, the distance between them is displayed in Angstroms. By selecting any three atoms, the angle between them is also displayed [07:03]. Figure 3 shows an example of bond length and angle measurements for the structure of graphite. Additionally, the Atom Selector Tablet application helps display the measurement information via the tablet mode. By opening a tablet in the CrystalVR application and subsequently opening the selector panel, if a given atom is selected, its properties are displayed in the panel. In the example provided in the video, an oxygen and zirconium atom are selected for the PZT structure [08:13]. When this is performed, the distance is displayed along the corresponding bond and is also shown in the selector panel along with more information about the selected atoms. The user can select up to three atoms this way. The atom nearest all three serves as the midpoint and it is from this atom that the angle is determined as illustrated in Figure 4 for the bonding between a Zr–O–Pb set of atoms in PZT [08:30].
Use of the measurement tool employed to measure bond lengths and angles. A graphite structure is employed in this example [07:03].
Bonding feature showing bond lengths and angle associated with three atoms in the PZT structure. The values are presented along the bonds and at the angle location for the atom series, as well as within the projected tablet (inset) in the VR environment [08:30].
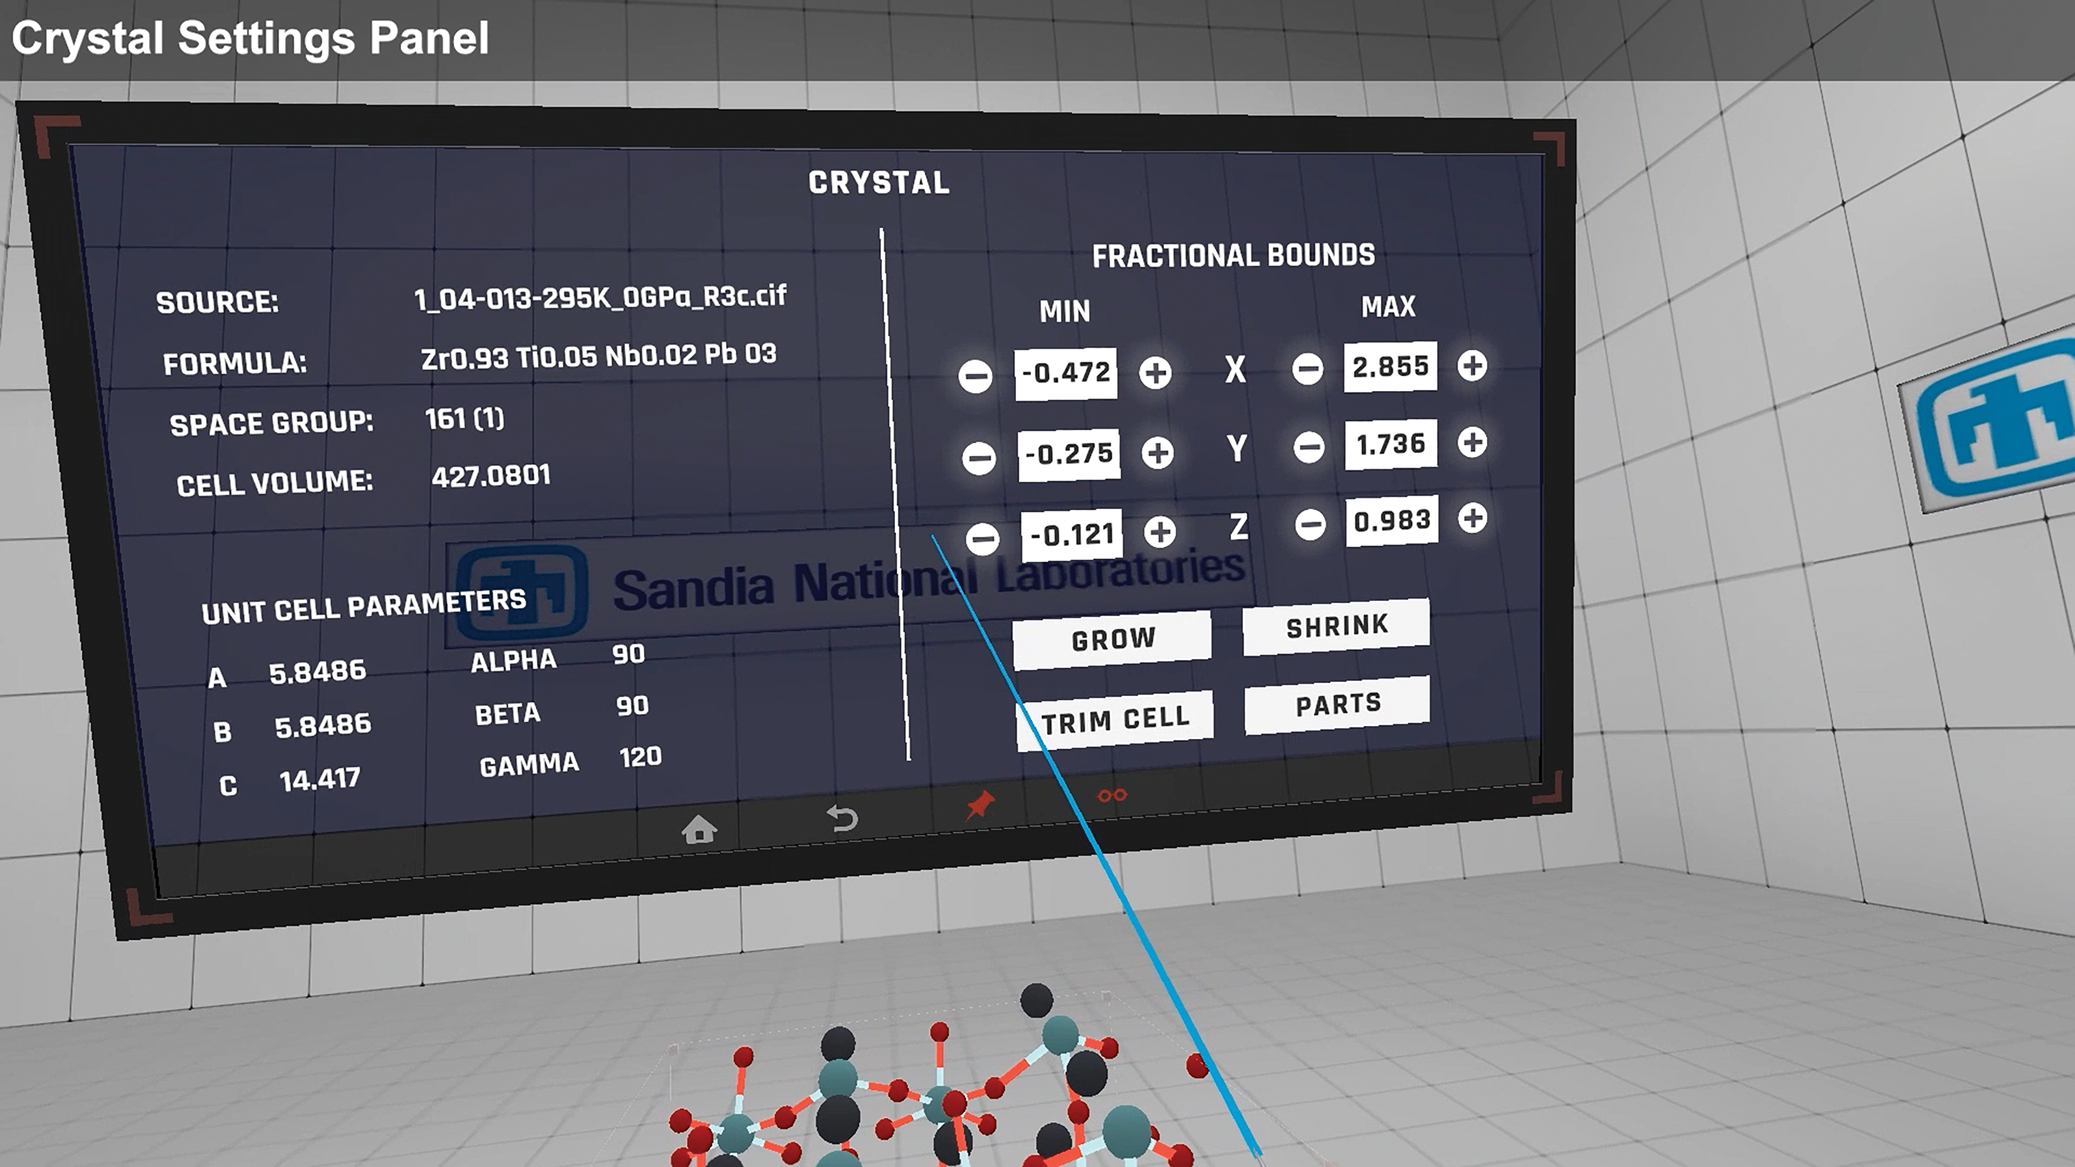
An example of the Crystal Settings panel for the PZT structure is shown in Figure 5. From this panel, one can find details about the crystal structure such as the file source, chemical formula, space group, lattice parameters, and unit cell volume [09:03]. There are buttons and input fields so that the user can make fine adjustments to the crystal or to uniformly grow and shrink the crystal. The trim cell button will hide the atoms generated through symmetry operations and reduce the view of the atoms to the irreducible formula unit for the structure [09:06]. Another feature in the Crystal Settings panel is the parts menu, allowing the selection of different crystal parts. This is especially beneficial when there is a disorder in the molecule or multiple atoms reside on the same atom site. In PZT, titanium and niobium can stand-in for zirconium. By using the parts menu, the user can activate the titanium atom rather than the zirconium [09:18]. In the video, one can note that when this swap to Ti occurs, some of the bonds are missing [09:28]. This is easily fixed by selecting two atoms that should be bonded (via the selector tool) and pressing “bond” [09:39]. When generating bonds, CrystalVR compares the distance between two atoms with the sum of their respective bond radii. If the distance is within the bond radii sum, the atoms are bonded. This can be adjusted within the VR environment to obtain the desired bonding for the structure.
A view of the Crystal Settings panel showing information about the cell parameters, fractional bounds, and menu options for growing, shrinking, trimming, and selecting parts of the crystal structure [08:50].
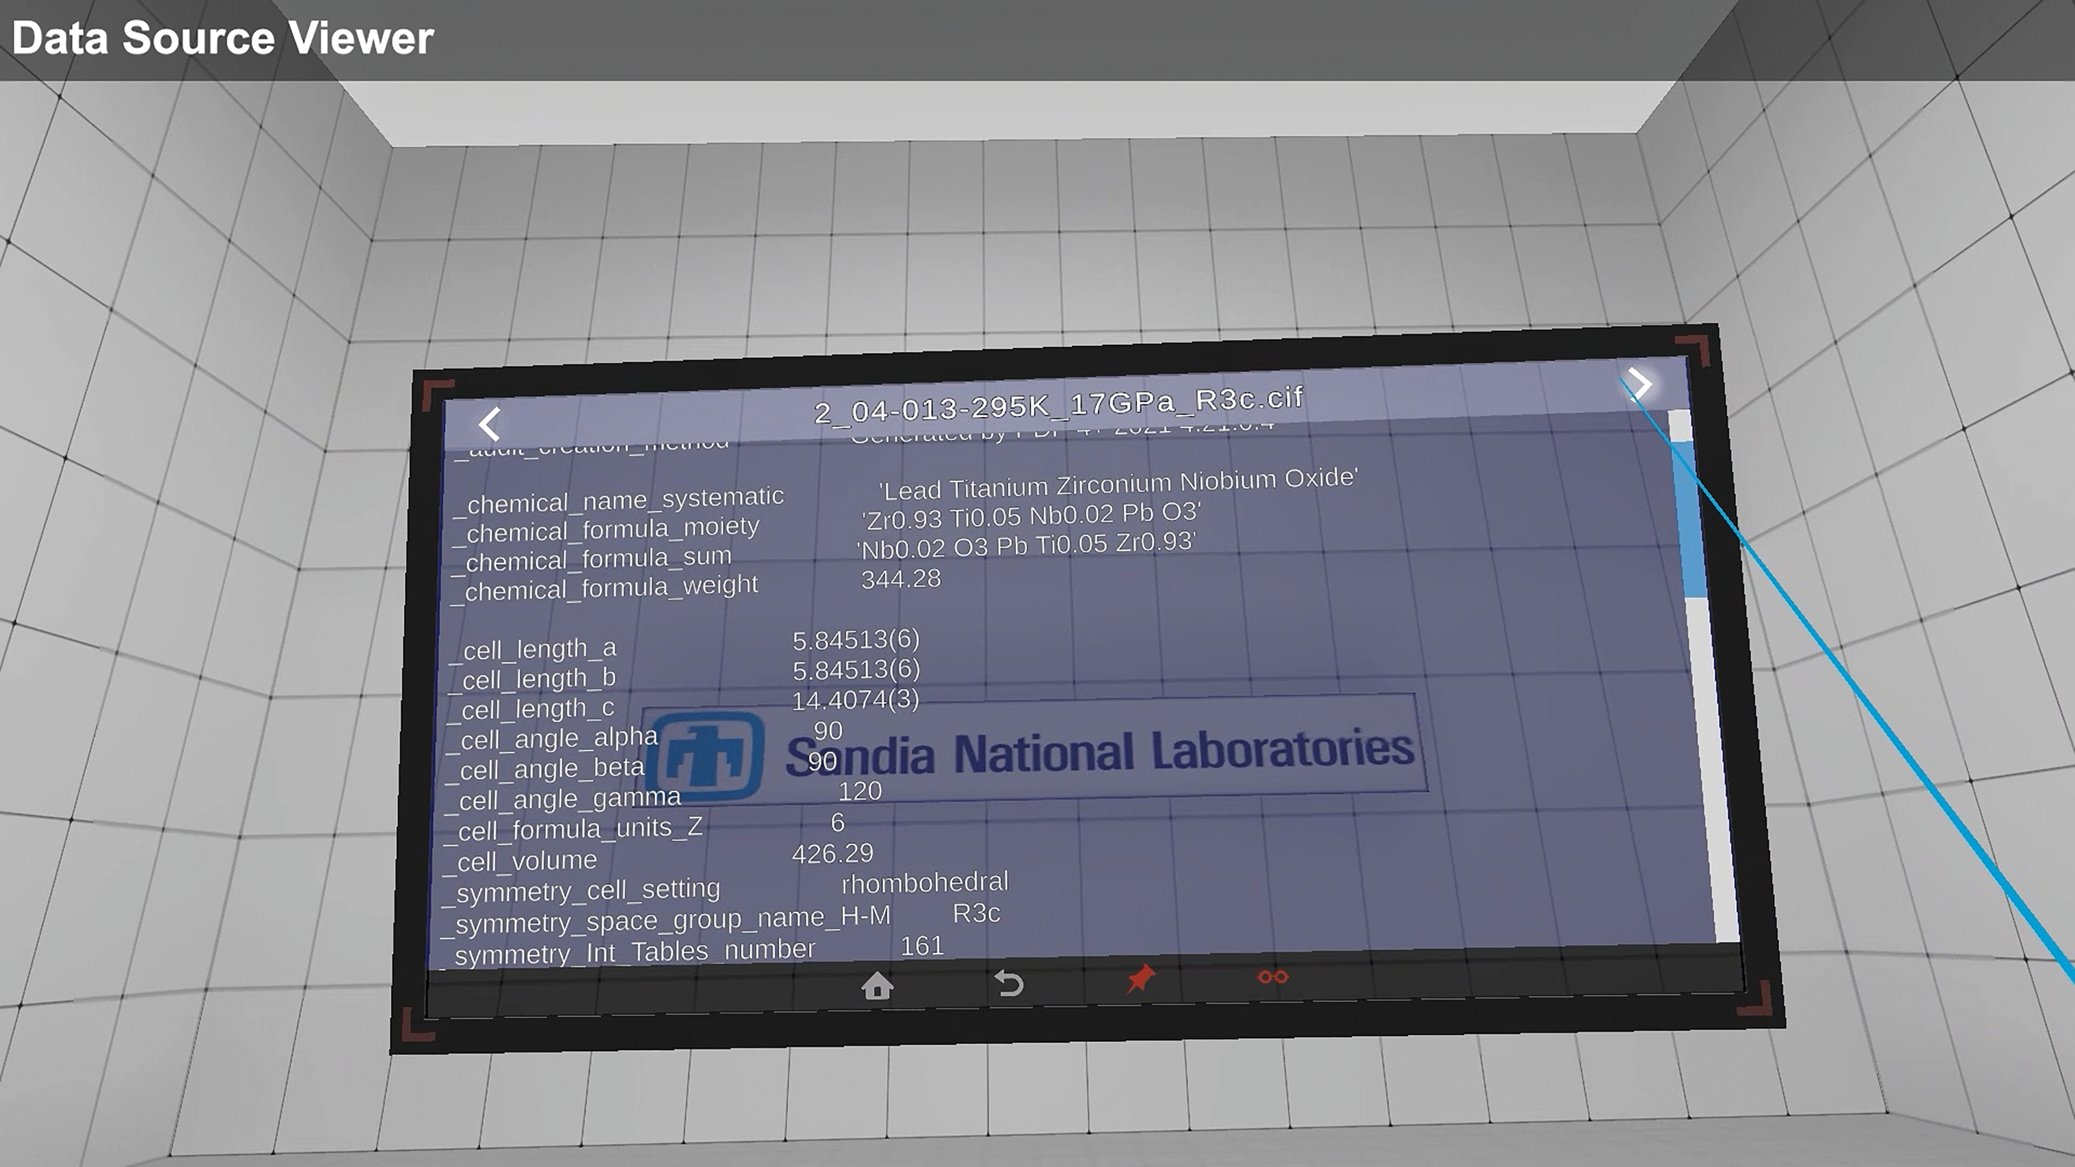
The data in the CIF file contains all the unique atoms and symmetry operations needed to create and grow the crystal. If one desires to look at text in the CIF file itself, one can simply open the Data Viewer panel and it will present the raw information residing in the CIF file [10:10]. Access to this information within the VR environment prevents the need for exiting out of the VR environment and removing the headset to check the structural information. Figure 6 shows the CIF file information for the PZT structure at 0.17 GPa and 295 K. This is the second CIF file in the pressure sequence. Since, in this case, a series of CIF files was read into CrystalVR, each CIF file in memory can be viewed sequentially on the Data Viewer panel by selecting the arrow buttons at the top of the panel as shown in Figure 6. Note that any number of panels can be opened at any time within the VR environment and positioned in the workspace for convenience. This allows for near instantaneous updates regarding the status of the structures being evaluated.
The Data Viewer panel displays a direct view of the CIF file information. This panel shows the CIF for the 0.17 GPa PZT structure in the pressure series. The arrows at the top of the panel allow the user to toggle through a CIF file series [10:10].
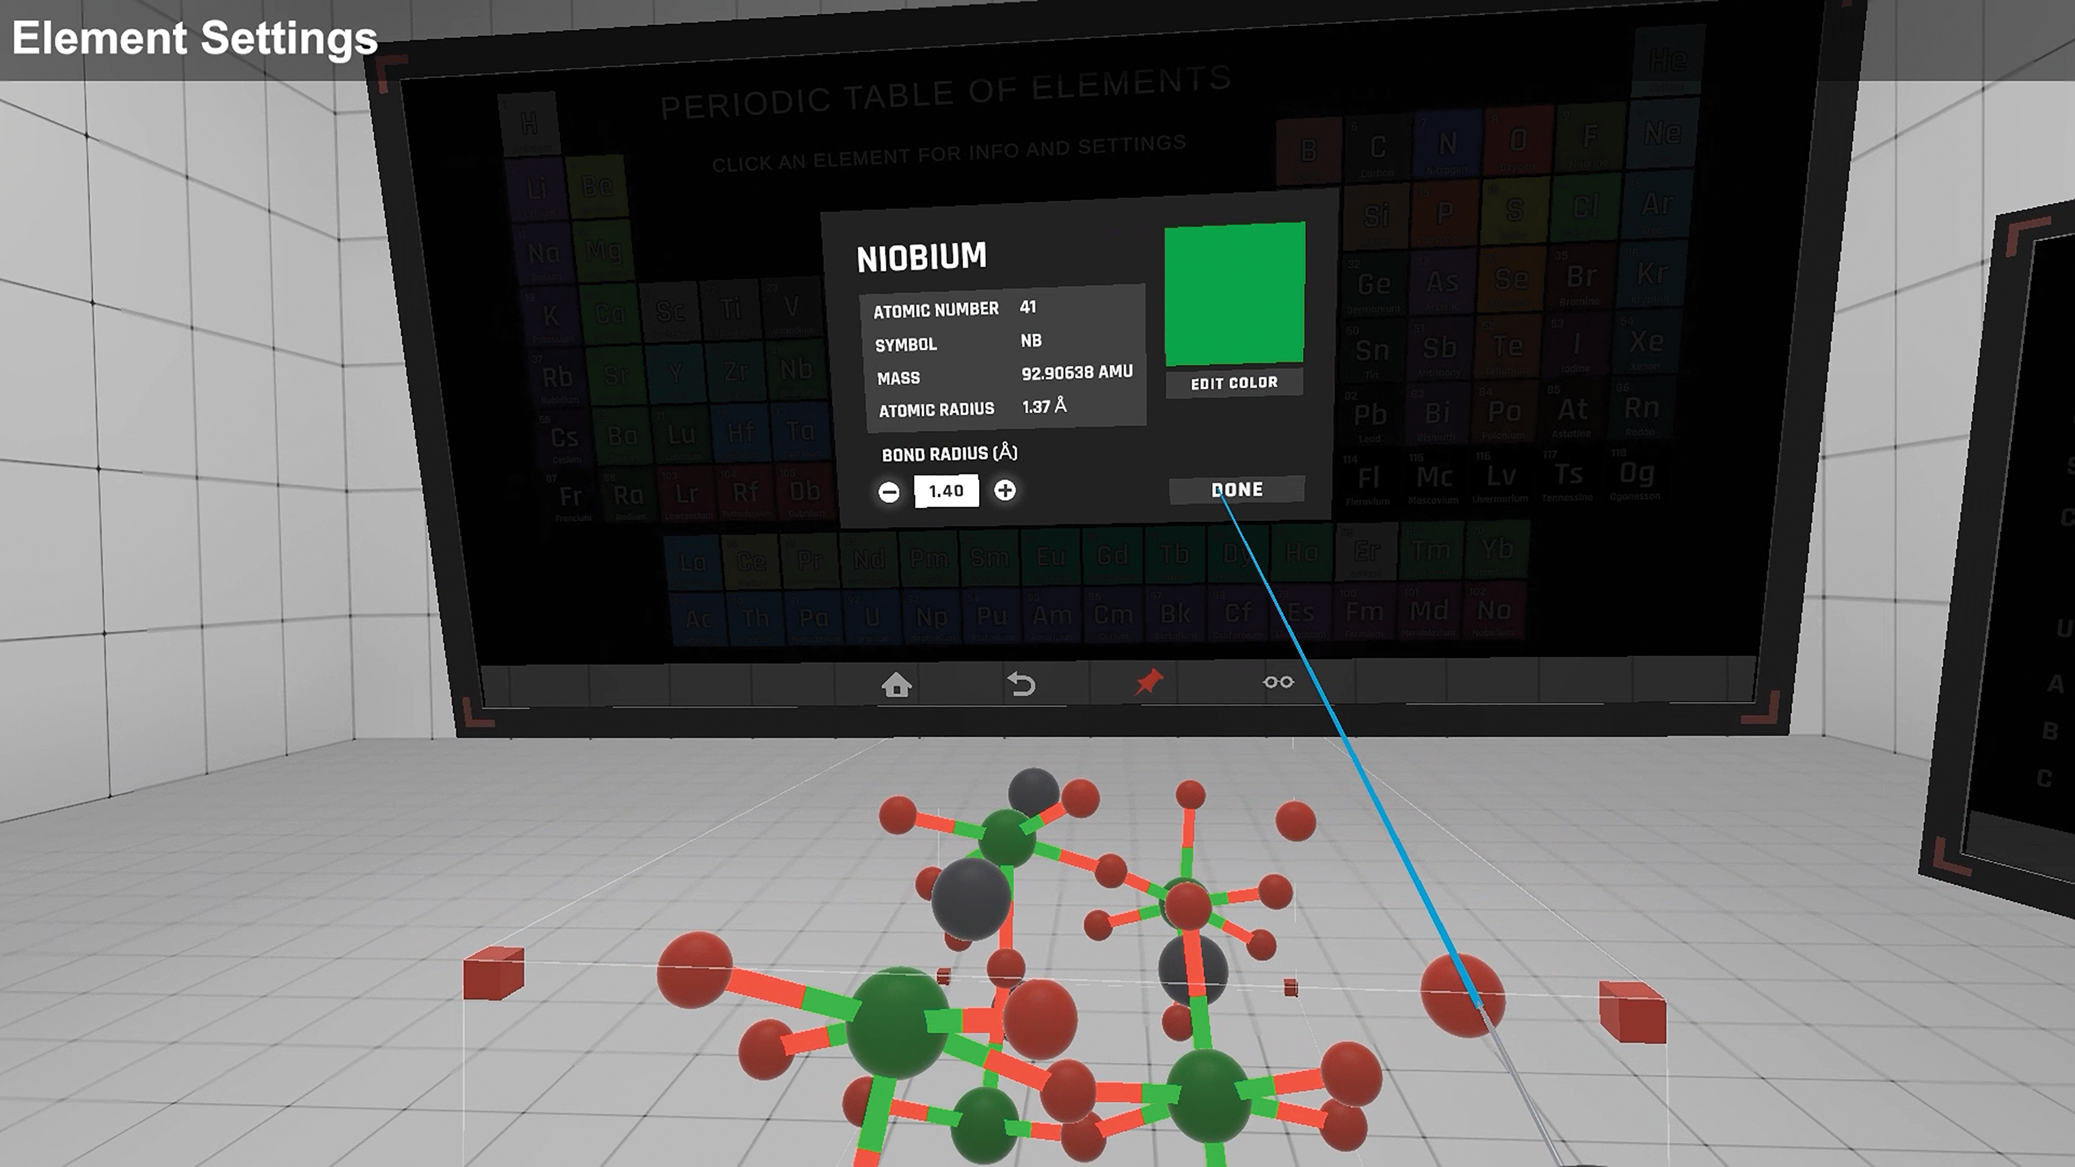
In the Element Settings panel, there is a periodic table [11:15]. Selection of an element enables the viewing of that element's details (such as mass) and allows for modification of some details such as the selected element's color and bond radius. It is helpful to adjust an element's color if that color appears too close in hue to other atoms in the crystal or a different crystal part. In the case of PZT, the zirconium and niobium atoms have a similar appearance. At a glance, it is difficult to tell which part is active. The video outlines the process to change the color of an atom type. In this case the niobium species, which shares the site location with zirconium and titanium, is made more distinct by changing its color [11:40]. The edit color button opens a color selector to choose a new color. The atoms and bonds simultaneously update to the selected color as the user interacts with the color wheel as illustrated in Figure 7. The selected color will be saved, and niobium will still appear in its updated form (green) the next time the CrystalVR application is opened. The assigned Nb color can be reset by opening the color picker and pressing the default button. One can also adjust the bond radius of an element and the bonds will appear or disappear as the value is updated.
Element settings panel showing element color and bond radius settings for Nb [12:02].
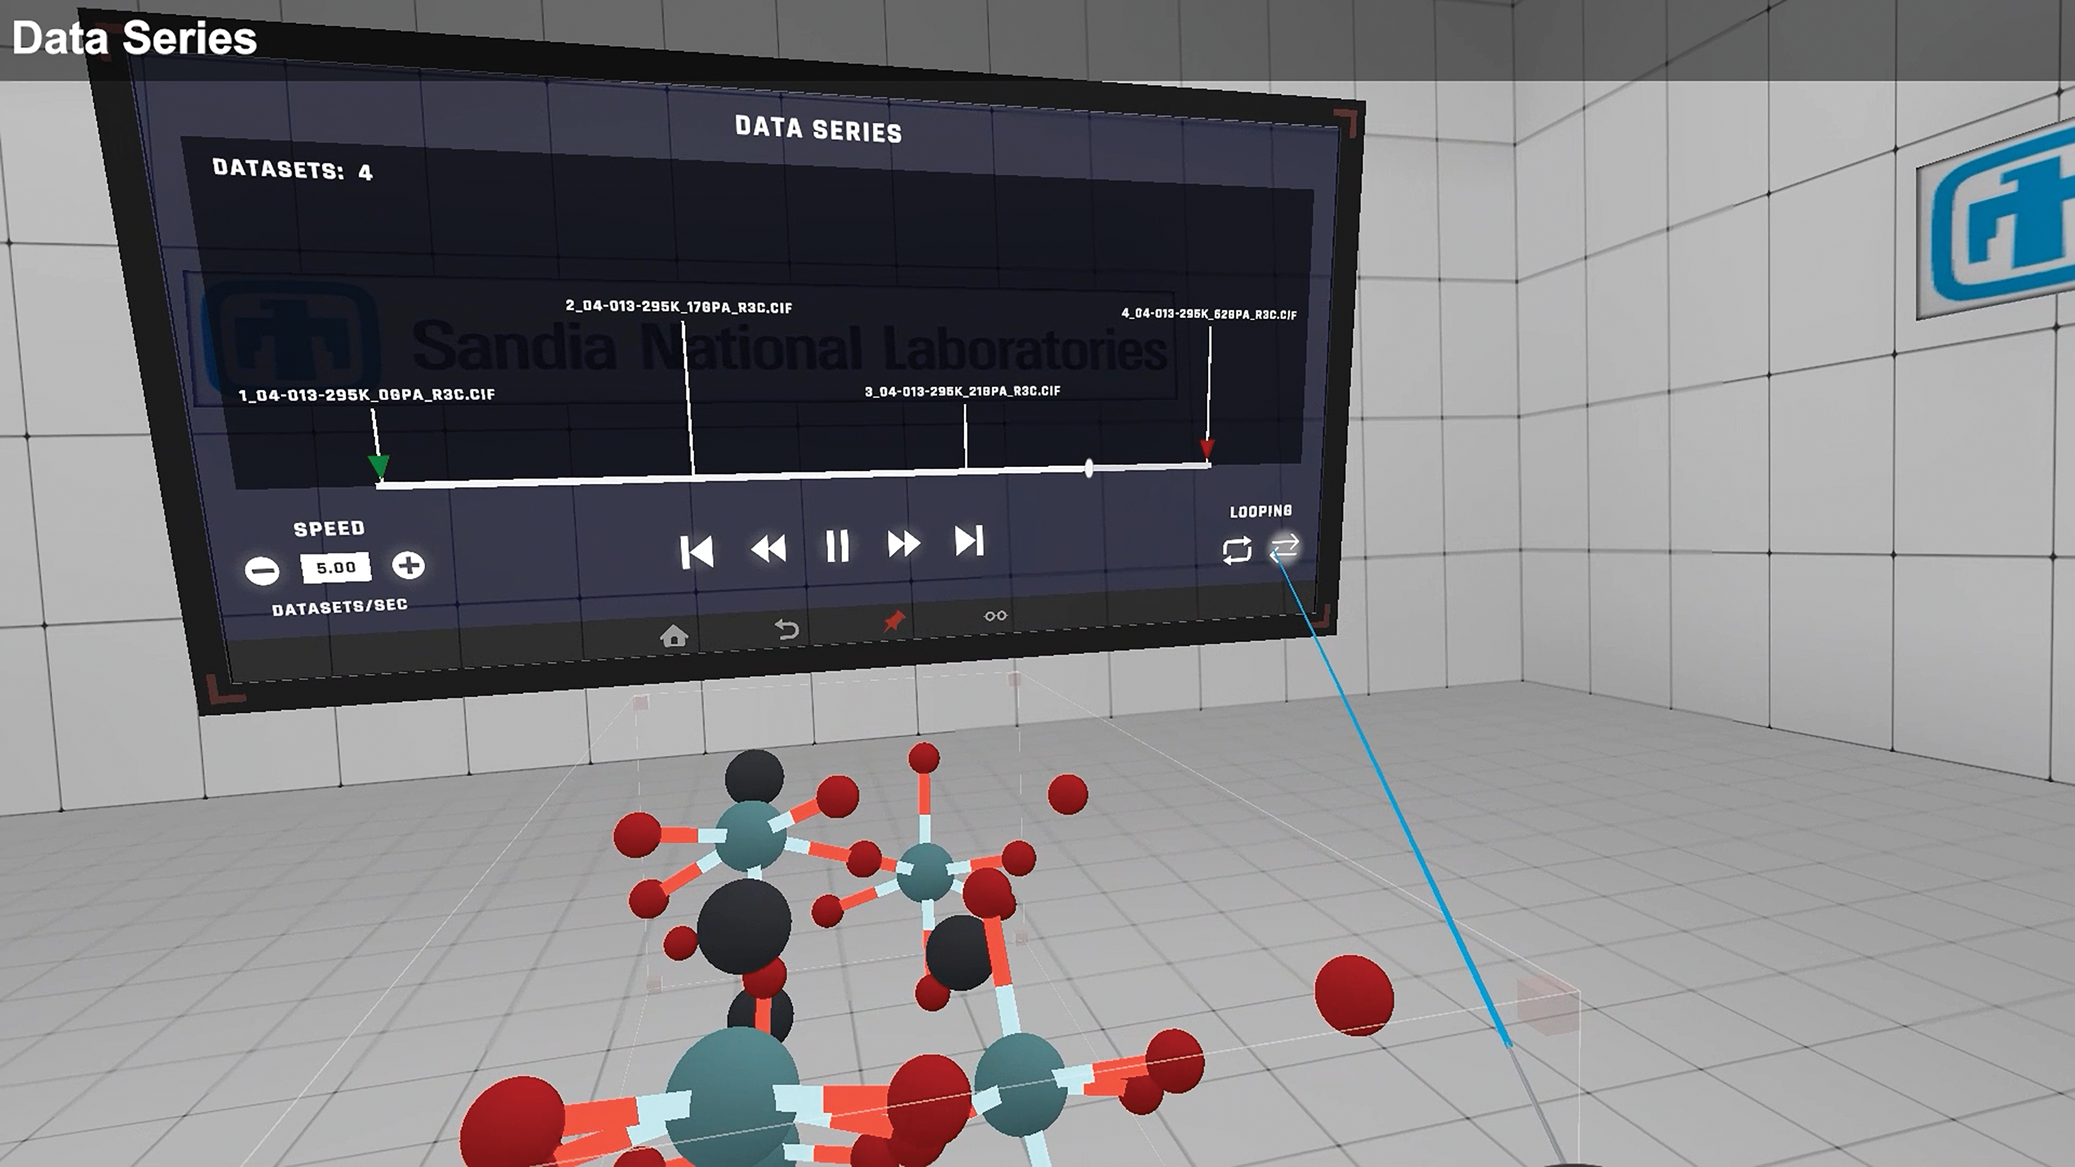
Since a directory of CIF files was imported, the user can play through them as a series via the Data Series panel. This is perhaps the most powerful feature of the CrystalVR application. As shown in Figure 8, the Data Series panel contains four CIF files of PZT at 295 K, with pressures ranging from ambient to 0.62 GPa (Avdeev et al., Reference Avdeev, Jorgenson, Short, Samara, Venturini, Yang and Morrison2006) [13:04]. The structure can be viewed as a time series where the user can observe the crystal lattice deform as it moves through the different pressure conditions. While this series contains only four crystal structures at varying pressures, the bond lengths are interpolated between each dataset to show a continuously adjusting structure as the pressure is increased. In the Data Series panel, the speed of the series can be adjusted. Additionally, one can change the looping for the sequence to either go back to the start after each sequence run, or to run in ping-pong fashion for a smoother transition.
Series of CIF files for ambient to 0.62 GPa at 295 K. The structure series can be viewed along the shown sequence timeline and adjustments to the speed and range traversed on the timeline can be interactively modified [13:04].
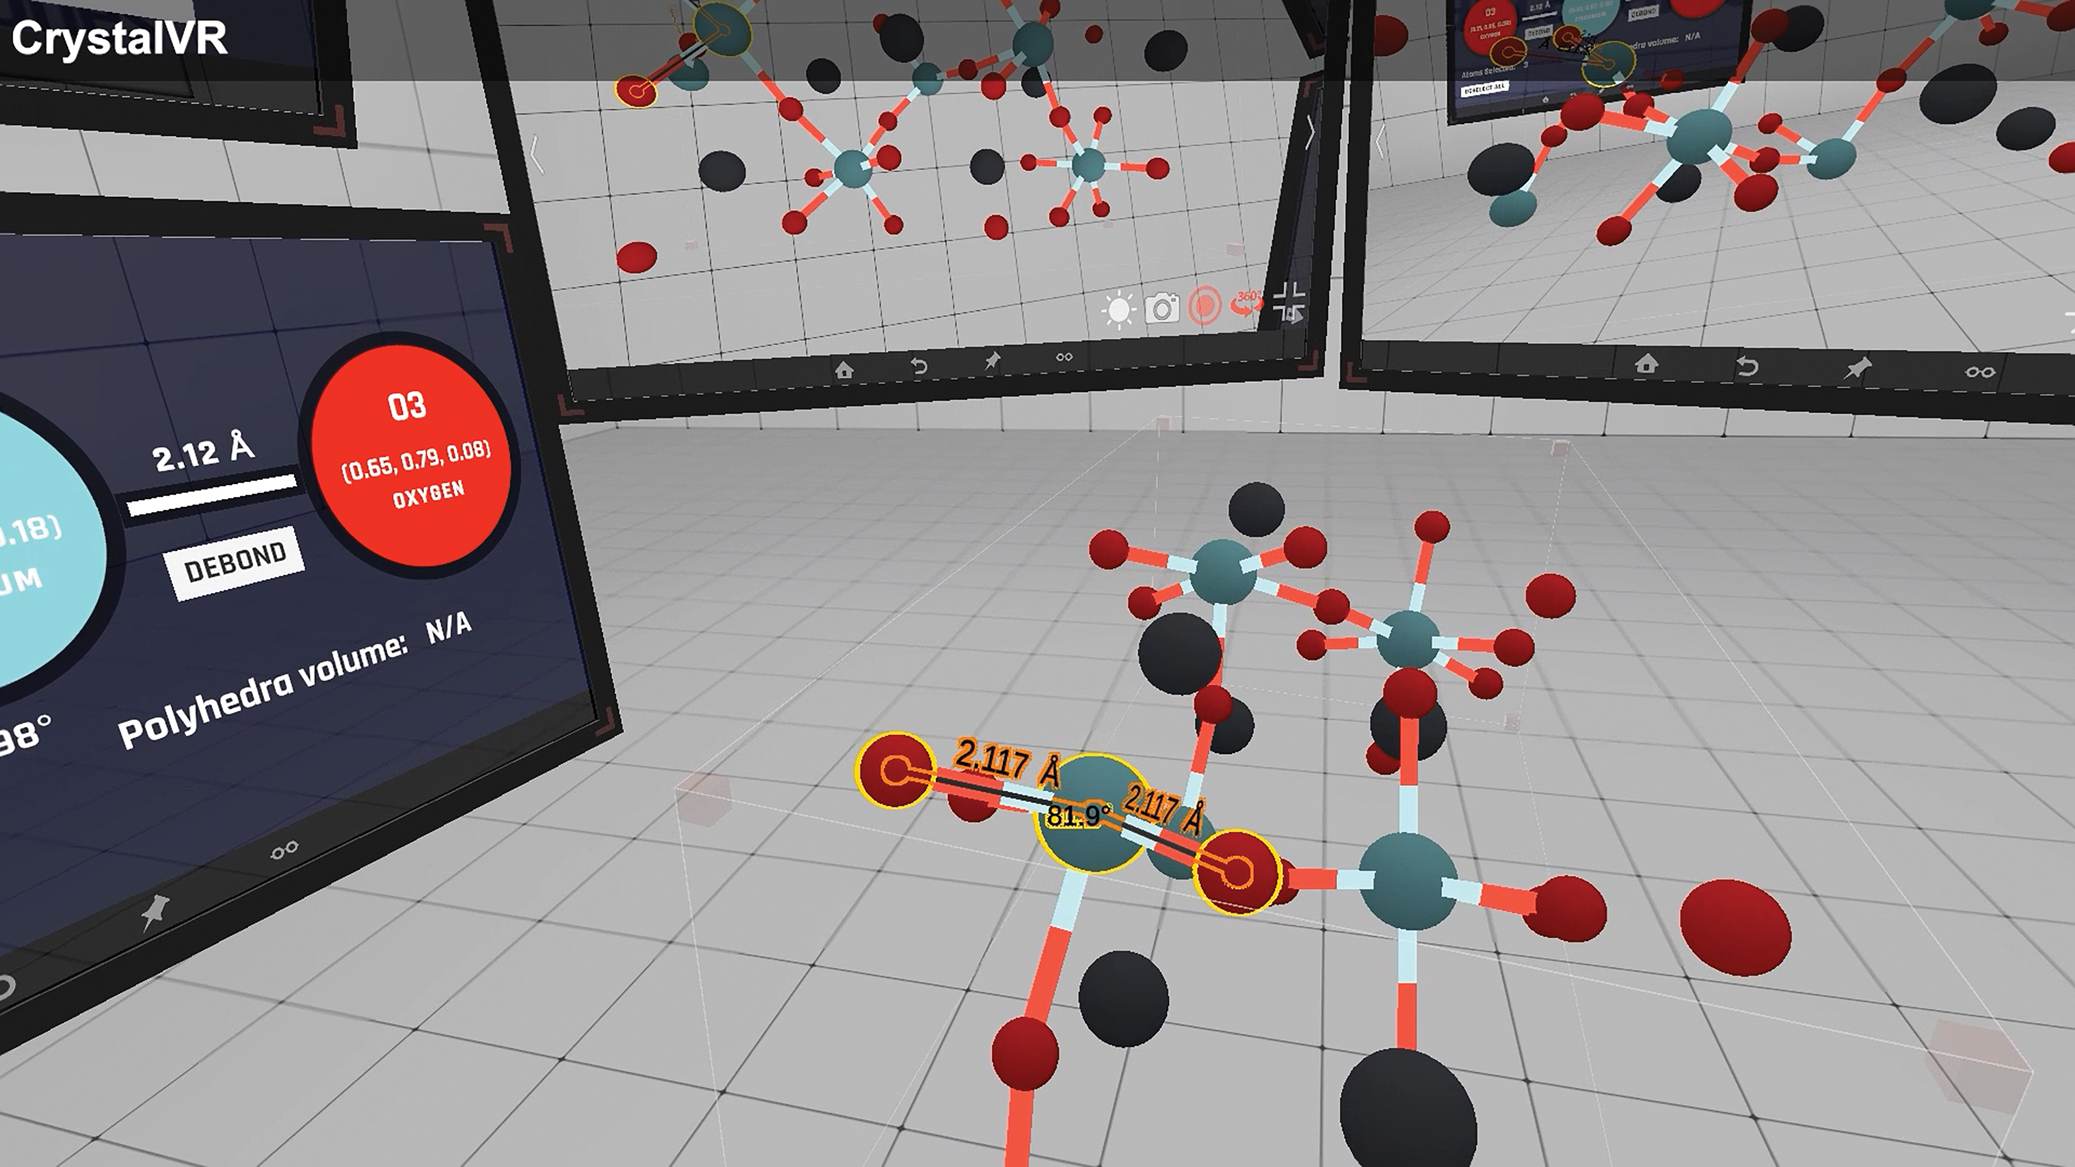
The crystal is still completely interactable while the data series is playing. One can make the coordination polyhedra visible again to get a better idea of how the crystal is deforming under pressure [14:18]. If the details are too small, one can simply scale the crystal to get a better view from the inside. Since CrystalVR is a CAD2VR plugin, the user can leverage all the capabilities provided by CAD2VR and extend them even further. The use of CAD2VR's virtual tablet system has already been demonstrated (e.g., see Figures 4 and 5). It is worth mentioning again that any number of these tablets can be created in the workspace. This is particularly useful when monitoring a dynamic data series. Viewing data in VR is powerful but outputting the results for other users to see as a video or figures is also important for communicating the results obtained by the VR analysis. CAD2VR's virtual camera system can be employed to monitor and record different perspectives of the crystal at the same time. Virtual cameras can be placed in various locations in the VR environment and their output presented on a corresponding tablet. The cameras are invisible in the workspace but are active and can record video or screenshots via the selector buttons present on the tablet screens. Figure 9 shows the PZT structure as it is observed during the pressure sequence, along with several other tablets in the VR environment. The tablet on the top-right of Figure 9 is recording a view of the structure from the right-hand side. The top-centre tablet in Figure 9 is monitoring the structure as viewed from the left-hand side. In fact, all the footage in the video presentation was captured using CAD2VR virtual cameras. An additional tablet on the lower left of Figure 9 shows the current bond being evaluated within the structure. The bond lengths for the Zr–O bonds and angle are also displayed on the structure itself. In the case of the ambient pressure condition (0 GPa), the Zr–O bond length shows a 2.117 Å distance with a O–Zr–O bond angle of 81.9o for the observed trio of atoms.
Structure of PZT showing Zr–O bonding at 0 GPa (i.e., ambient conditions) with bond lengths and angles displayed on the bonds as well as the displayed tablet (right). Also displayed are tablets showing side views of the structure via additional hidden cameras: top-right tablet shows view from the right-hand side of structure, and top-middle tablet shows view from the left-hand side of structure [17:41].
Since this article struggles to portray the experiential perspective obtained by the user during the data series evaluation in VR, obtaining screenshots of the dynamic changes can perhaps serve as a freeze-frame perspective of the structure during the pressure series sequence. Figure 10 shows the status of the structure at the highest-pressure condition of 0.62 GPa [17:47]. Note the extreme shift of the Zr cation above the octahedra plane of oxygen atoms. This is reflected in the increased bond length for the Zr–O bonds (2.196 Å) along with the significantly distorted O–Zr–O bond angle at 69.1°. The extreme distortion of the structure gives some perspective regarding the instability of the highly distorted octahedra and the imminent transition to the antiferroelectric phase as documented by Avdeev et al. (Reference Avdeev, Jorgenson, Short, Samara, Venturini, Yang and Morrison2006). The benefit of the VR visualization is that one can simultaneously monitor many bond distances and atom positions and piece together the adjustments the structure makes to the applied pressure states. The ability to trace the atom movements and subsequent bond distances and angles within the context of previous and subsequent datasets gives a much more detailed understanding of a material's response to its environment. The addition of tools and resources at the user's fingertips is unprecedented and allows for a perspective that has previously been challenging to obtain.
PZT structure captured at the maximum pressure of 0.62 GPa showing greatly distorted Zr–O bonding due to the large ion displacement of the Zr site. See text for details [17:47].
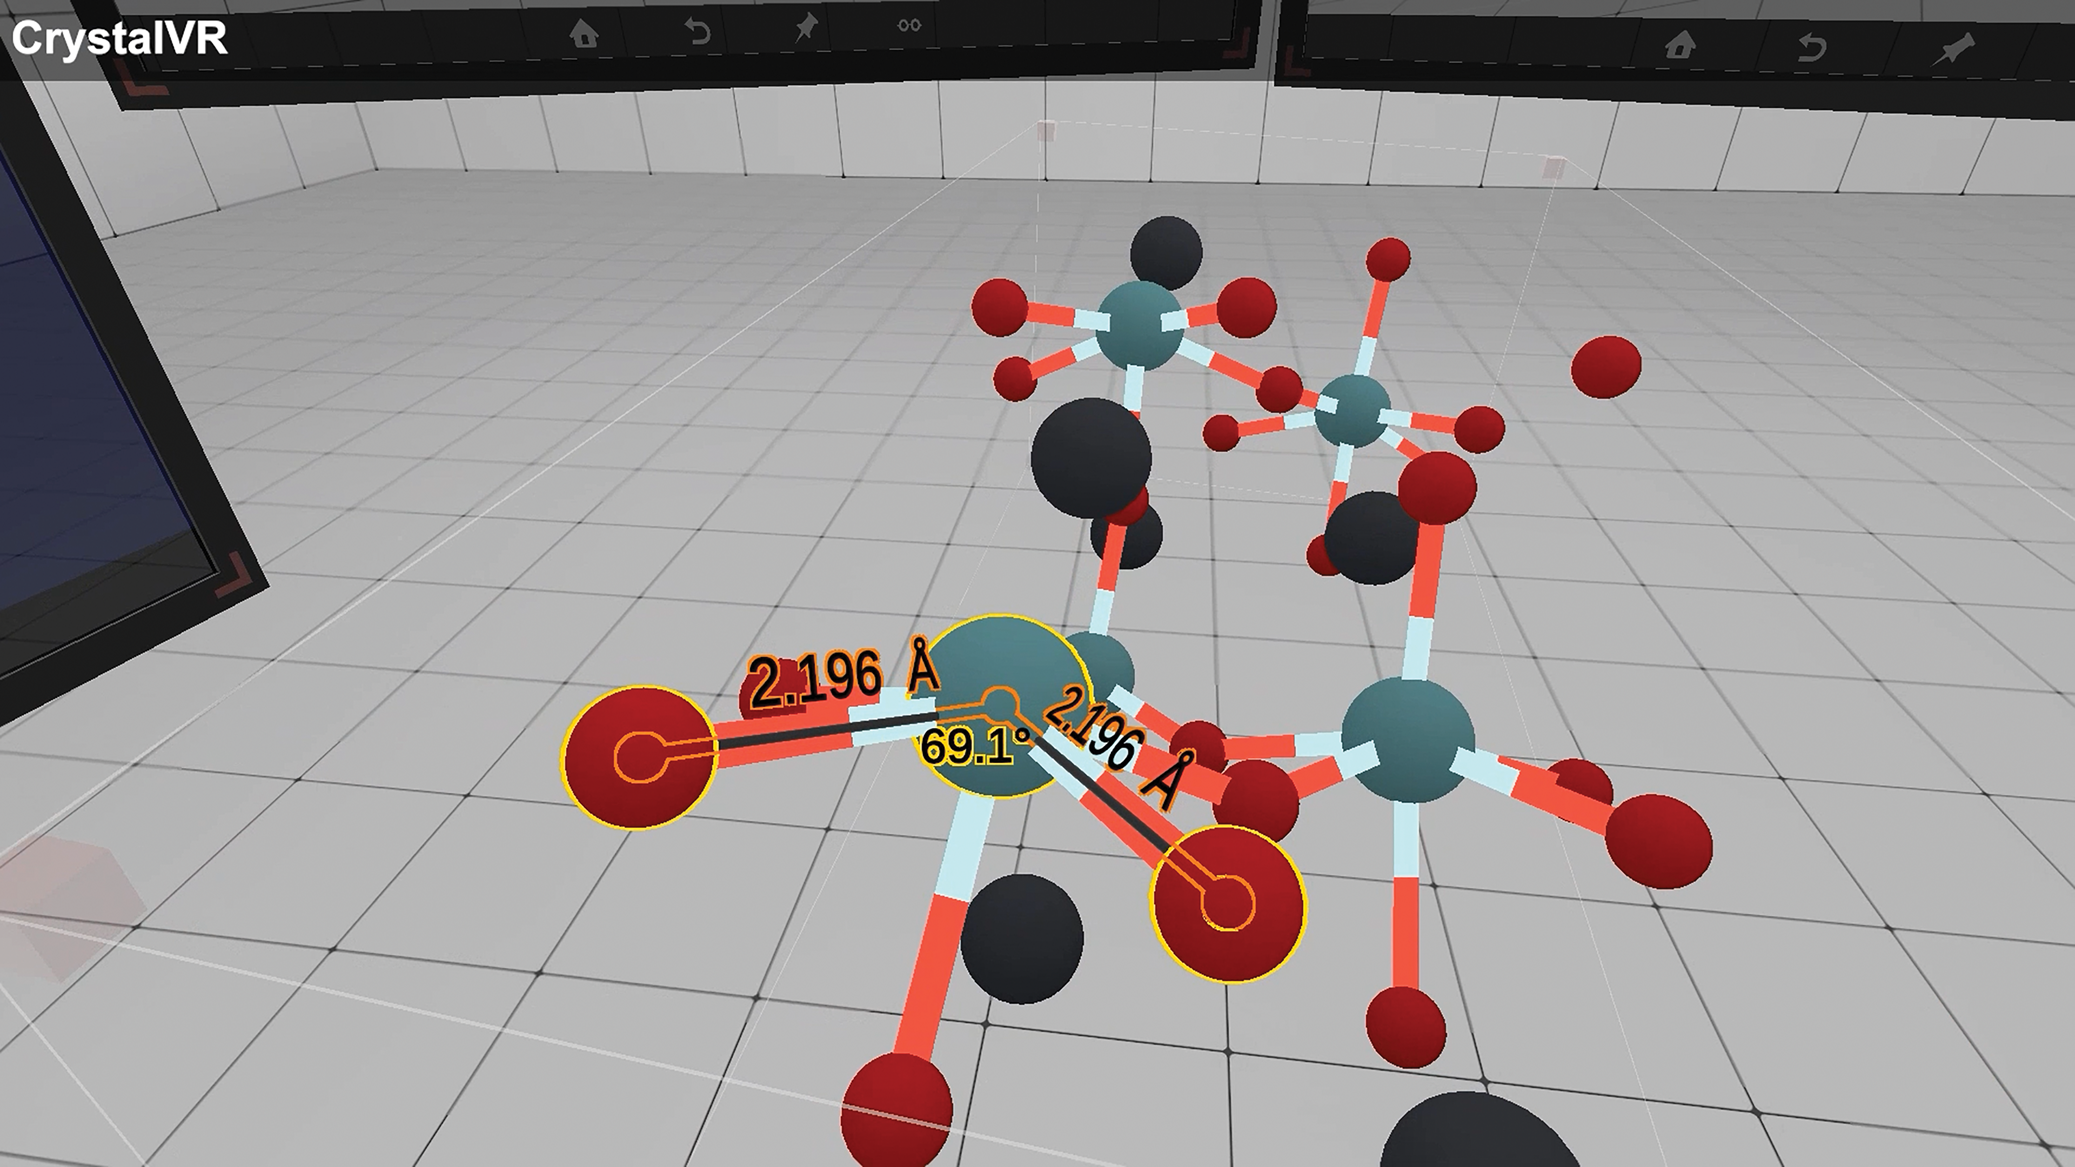
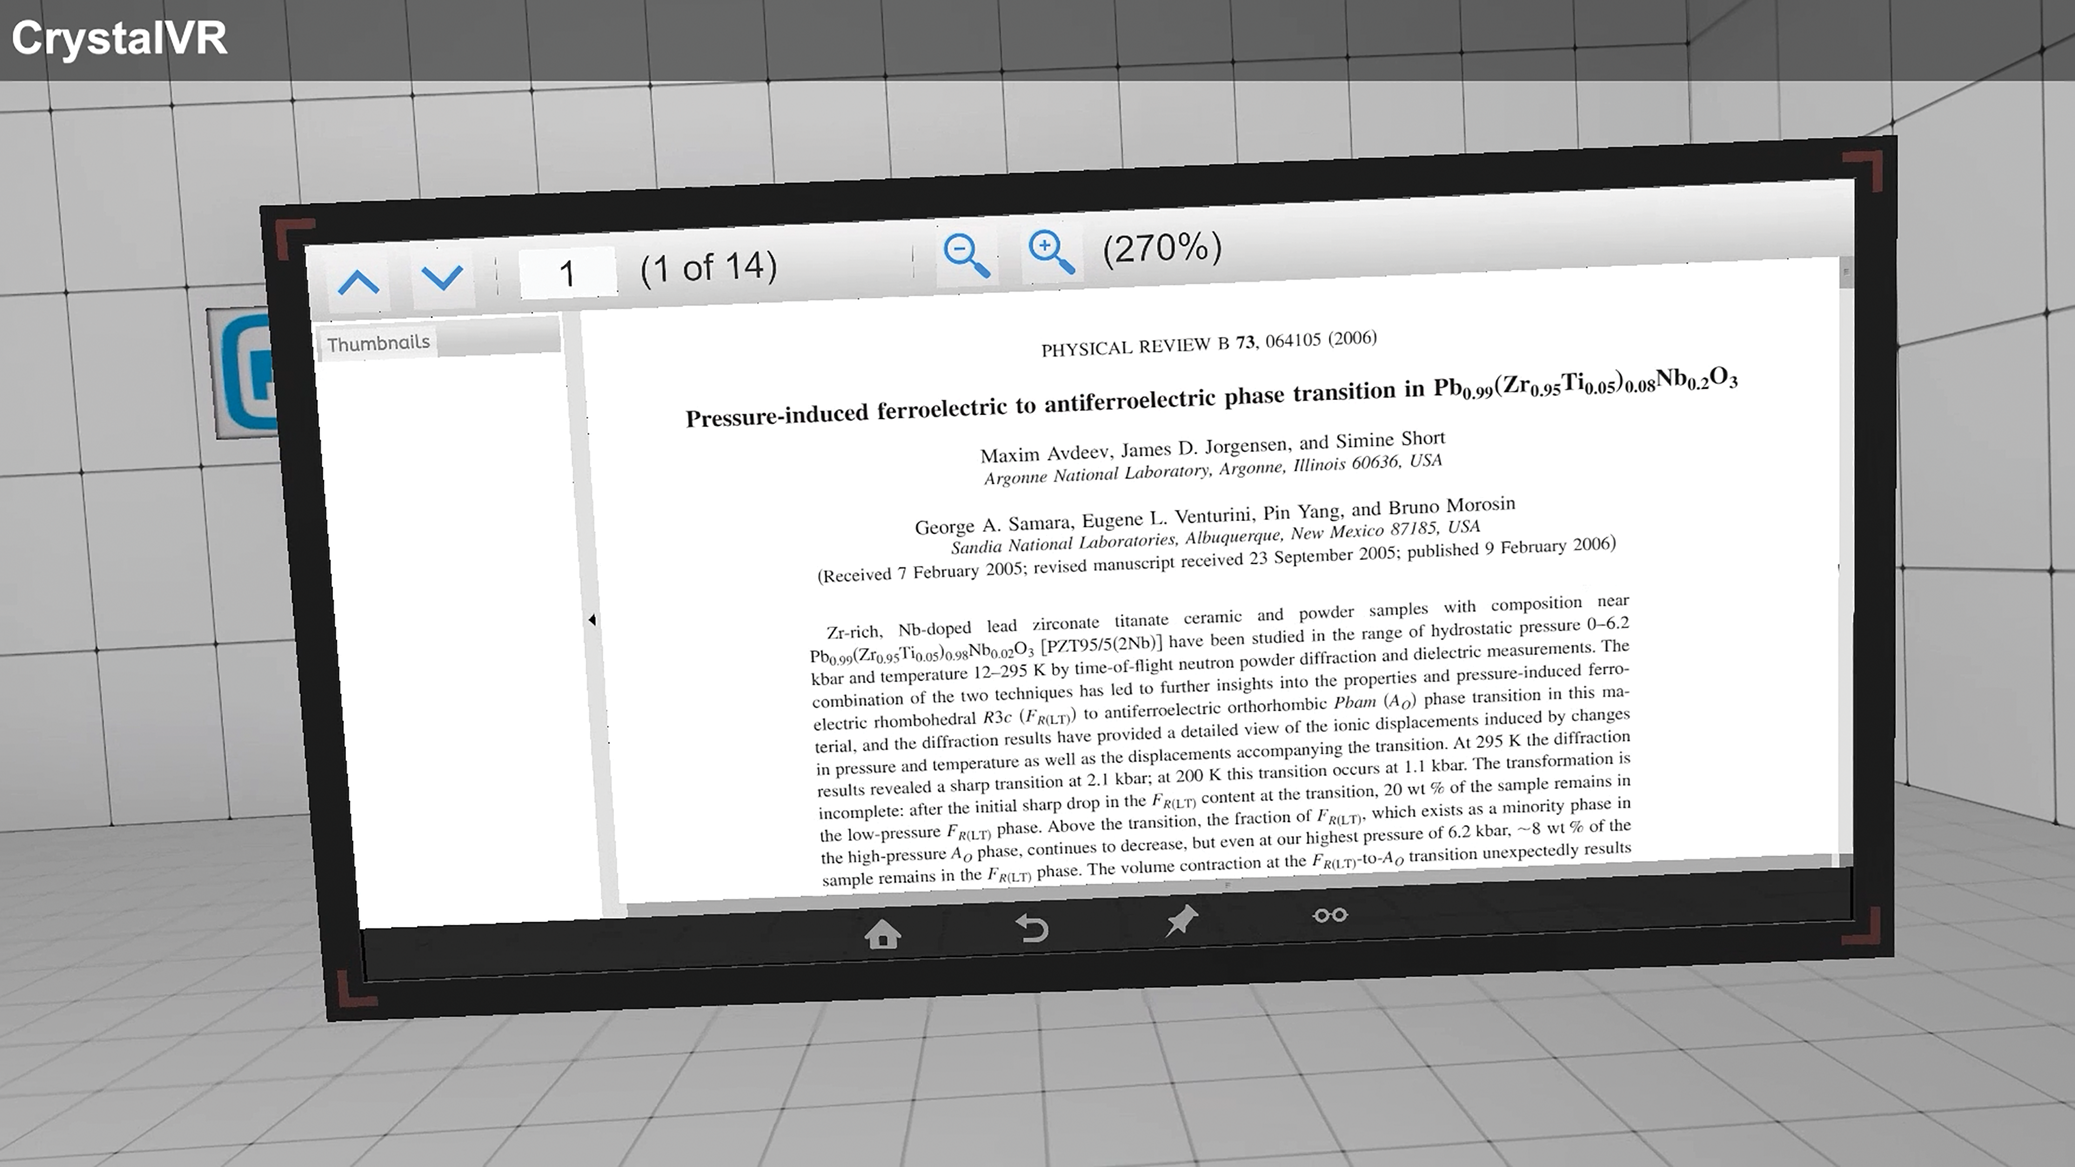
Figure 11 shows an additional feature whereby external documents can be viewed via a virtual tablet [19:45]. The CAD2VR virtual tablet provides a file viewer that can open-text files, CSVs, images, and Portable Document Files (PDFs). This is of particular use if one desires to compare observations made in VR with that of the documented manuscript. In the case of Figure 11, the published article can be scrolled and adjusted in size so that there is no need to exit VR mode to check or compare notes with the published work. One other feature being developed is the ability to share this experience with other users. The CAD2VR software is currently being modified to enable two users in different locations (with their own individual VR headsets) to simultaneously view 3D data, share the same virtual environment, and communicate/interact in real time.
External document viewer tablet showing a copy of the article by Avdeev et al. (Reference Avdeev, Jorgenson, Short, Samara, Venturini, Yang and Morrison2006) which documents the crystal structure information employed in the PZT structure series [19:45].
IV. SUMMARY
Taken together, the CrystalVR tool can empower the researcher with a new lens to experience their crystallographic data. CrystalVR can read various structural formats (including the common CIF format) in a seamless fashion. The tool enables interactive visualization via intuitive tools in a VR environment and provides a new diagnostic for crystal structure data of sequential crystal structures derived from in-situ type experiments. The PZT structure viewed as a function of pressure serves as an exemplar for demonstration of the tool. Bond length and angle measurements are enabled within the tool. Menu and tablet features exist including presenting data in ball-and-stick, space-filling, and coordination polyhedra modes. The sequential evaluation of PZT during increased pressure revealed the significant distortion of the Zr–O octahedra which suggests likely instability of the coordination prior to phase transformation into the orthorhombic antiferroelectric structure.
ACKNOWLEDGEMENTS
Sandia National Laboratories is a multimission laboratory managed and operated by the National Technology and Engineering Solutions of Sandia, LLC., a wholly owned subsidiary of Honeywell International, Inc., for the U.S. Department of Energy's National Nuclear Security Administration under contract DE-NA-0003525.


 Open access