


1. INTRODUCTION
As soon as snow reaches the ground, its morphology changes quickly by snow metamorphism and deforms due to the overburden stress. Snow metamorphism and deformation is crucial to understand other processes, such as avalanche formation (Schweizer and others, Reference Schweizer, Jamieson and Schneebeli2003), firn formation on ice sheets (Fujita and others, Reference Fujita2016), and the effect on wildlife (Bokhorst and others, Reference Bokhorst2016). Metamorphism can lead to the formation of weak layers due to depth-hoar development (Pinzer and others, Reference Pinzer, Schneebeli and Kaempfer2012), or the formation of a well-sintered rounded structure (Kaempfer and Schneebeli, Reference Kaempfer and Schneebeli2007). Deformation can lead to densification and stabilization of a snowpack or local stress concentrations (Scapozza and Bartelt, Reference Scapozza and Bartelt2003b) in a snowpack.
Snow deforms as a non-linear viscoelastic material (Scapozza and Bartelt, Reference Scapozza and Bartelt2003a), for which constitutive laws similar to polycrystalline ice and viscous fluids were formulated based on field and laboratory measurements (Shapiro and others, Reference Shapiro, Johnson, Sturm and Blaisdell1997). With these experimental laws, snow settlement can be described as a creep process. Creep is differentiated between primary, secondary and tertiary creep. Initially, snow densifies rapidly and non-stationary during primary creep, followed by a slower stationary densification during secondary creep (Sturm and Benson, Reference Sturm and Benson1997). For primary creep in snow, Glen's flow law for polycrystalline ice can be simplified as the following power law, relating the strain rate  $\dot{\rm \varepsilon} $ of snow and the constant uniaxial stress σ linearly by the viscosity η, similar to a viscous fluid (Schleef and Löwe, Reference Schleef and Löwe2013):
 $$\dot{\rm \varepsilon} = \displaystyle{\sigma \over \eta} $$
The viscosity η depends on snow density, temperature and strain rate with higher values for higher densities, lower temperatures and lower strain rates (Scapozza and Bartelt, Reference Scapozza and Bartelt2003a). However, considering only the density to describe the structure of snow and its viscoelastic properties showed to be insufficient. Different grain and bond characteristics can lead to larger differences in snow compaction than different loads and load histories (Sturm and Holmgren, Reference Sturm and Holmgren1998). Several field observations confirm large differences in viscosity between different snow types at equal density, as rounded well-sintered snow settles faster than depth hoar (Kojima, Reference Kojima1967; Armstrong, Reference Armstrong1980; Shapiro and others, Reference Shapiro, Johnson, Sturm and Blaisdell1997; Sturm and Benson, Reference Sturm and Benson1997; Sturm and Holmgren, Reference Sturm and Holmgren1998). There is clear evidence from the field that the snow microstructure affects viscosity, but experimental data under controlled conditions are lacking, making modeling difficult.
In a natural snowpack, snow metamorphism occurs simultaneously with deformation. Dry snow metamorphism results from vapour transport within the snow structure under isothermal conditions or a temperature gradient. While a rounded snow structure evolves under isothermal conditions, a temperature gradient leads to a different evolution of the snow morphology, i.e. faceting and depth hoar (Pinzer and others, Reference Pinzer, Schneebeli and Kaempfer2012; Calonne and others, Reference Calonne, Flin, Geindreau, Lesaffre and Rolland du Roscoat2014).
Although temperature-gradient metamorphism is almost always present in a snowpack, most laboratory experiments on snow deformation were conducted under isothermal conditions at different temperatures and stresses, and mainly with rounded snow (e.g. Scapozza and Bartelt, Reference Scapozza and Bartelt2003a, Reference Scapozza and Barteltb; Theile and others, Reference Theile, Löwe, Theile and Schneebeli2011; Schleef and Löwe, Reference Schleef and Löwe2013; Schleef and others, Reference Schleef, Löwe and Schneebeli2014b, Reference Schleef, Löwe and Schneebelic). Likewise, experiments on temperature-gradient metamorphism were conducted (Pinzer and others, Reference Pinzer, Schneebeli and Kaempfer2012; Calonne and others, Reference Calonne, Flin, Geindreau, Lesaffre and Rolland du Roscoat2014; Wang and Baker, Reference Wang and Baker2017; M. Wiese and M. Schneebeli, unpublished data), but without considering settlement occurring simultaneously as in a natural snowpack. The only exception is the laboratory experiment by De Quervain (Reference De Quervain1958), where the snow structure was observed at the start and end of the experiment. Recently, Wiese and Schneebeli (Reference Wiese and Schneebeli2017) developed the Snowbreeder 5 for time-lapse micro-computed tomography (micro-CT) experiments on the effect of structural snow changes due to snow metamorphism on settlement. With this device a constant temperature gradient can be imposed on a snow sample placed in a Micro-CT and simultaneous settlement can be induced. In contrast to the experiments of De Quervain (Reference De Quervain1958) the micro-CT measurements allow for a continuous observation of the snow structure. First results of Wiese and Schneebeli (Reference Wiese and Schneebeli2017) show a decreased settlement under temperature-gradient conditions compared with isothermal conditions. This study extends previous isothermal settlement experiments with settlement experiments under the influence of a constant temperature gradient. The settlement experiments were built up such that the microstructural changes involved could be measured simultaneously by time-lapse micro-CT with the Snowbreeder 5. We aimed to investigate how the viscosity evolves during the first days of transition from rounded snow towards depth hoar and which microstructural properties are relevant to the process.
2. METHODS
We used the instrumented sample holder Snowbreeder 5 (Wiese and Schneebeli, Reference Wiese and Schneebeli2017) to investigate the interaction of settlement and temperature-gradient metamorphism in the first days after onset of metamorphism.
2.1. Experimental design
We considered the following factors as relevant in our experiments: isothermal conditions, temperature gradients, temperature, wall effects by friction and imposed stress. We did not test all interactions between these factors, but the ones where we expected an interaction (Table 1). The initial snow properties were kept constant as much as possible.
Interactions between the investigated factors: isothermal conditions ISO, effective temperature gradient in the snow sample TG, temperature T, wall effect wall, imposed stress σ
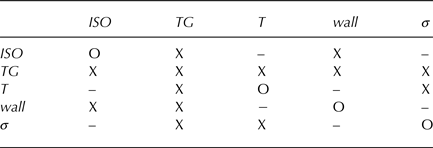
X: investigations were done between factors, –: no investigations were done.
As a reference, where the effect of metamorphism on settlement is negligible, experiments under isothermal conditions were performed, which can be compared well with other laboratory experiments. The sample being confined or unconfined is the only other factor investigated in these experiments, i.e. confined touching the wall of the sample holder, and unconfined, i.e. the sample was slightly thinner than the sample holder. The low value of the Poisson number of highly porous media (Shapiro and others, Reference Shapiro, Johnson, Sturm and Blaisdell1997) leads to a small effect of confinement in compression experiments. This is certainly true for compression experiments under isothermal conditions, but is less clear if this is also the case during temperature gradient metamorphism. Therefore, we checked the wall effect also for the temperature-gradient experiments.
The main interest was in the effect of a temperature gradient and the hereby initiated metamorphism and structural change on densification. We applied various temperature gradients at different imposed stresses and three different temperature ranges (~−14, −9 and − 4°C). One question was the variation of the ice viscosity vs the rate of recrystallization determined by the water-vapour flux at different temperatures. To discriminate whether there is an interaction between settlement and temperature-gradient metamorphism, we conducted experiments with and without additionally imposed stress at different temperatures.
In summary, the 13 successful experiments cover the factors explained above.
2.2. Snow properties and instrumentation
As a starting material we used nature-identical snow produced with the Snowmaker (Schleef and others, Reference Schleef, Jaggi, Löwe and Schneebeli2014a), which cannot be distinguished structurally from natural snow. We sieved the snow through a sieve with a mesh size of 5 mm into styrofoam boxes. The snow was then stored in these boxes at constant temperatures between −5 and − 20°C for several months, such that the snow sintered and developed a rounded structure through isothermal metamorphism. Thus, structural change was small between experiments. This snow had a density between 211 and 261 kg m−3 and a specific surface area SSA between 12.3 and 13.3 m2 kg−3. The calculation of the snow density and SSA from micro-CT images is explained further below in this section. Starting experiments from this rounded snow structure enabled us to observe faceting during the experiments. Cylindrical snow samples were cut out vertically from the snow in the styrofoam boxes for the experiments.
The Snowbreeder 5 (Wiese and Schneebeli, Reference Wiese and Schneebeli2017) imposes a constant temperature gradient on a snow sample and simultaneously induces settlement while measuring the snow microstructure in the Micro-CT (Fig. 1). The temperature at the bottom is controlled with a Peltier element; and the top of the snow sample by controlling the temperature inside the Micro-CT. A passive load is placed on top of the snow sample, which induces settlement and serves also as a passive heater or cooler. The temperature at the top of the snow sample is measured at the bottom of the weight. In addition to no external loading (0 Pa) the applied stress can be varied between 658 and 1736 Pa. The settlement is measured by a laser distance sensor mounted at the stable bottom part towards the upper rim of the weight as it moves downwards. The Snowbreeder rotates 360° horizontally during a micro-CT measurement. Due to this rotation the settlement measurements show larger fluctuations during micro-CT measurements. Hence, these data were excluded for the analyses.
Setup and dimensions of the Snowbreeder 5 experiments. VOI is the volume of interest for the image analysis. A positive temperature gradient is defined by the bottom temperature higher than the top temperature.
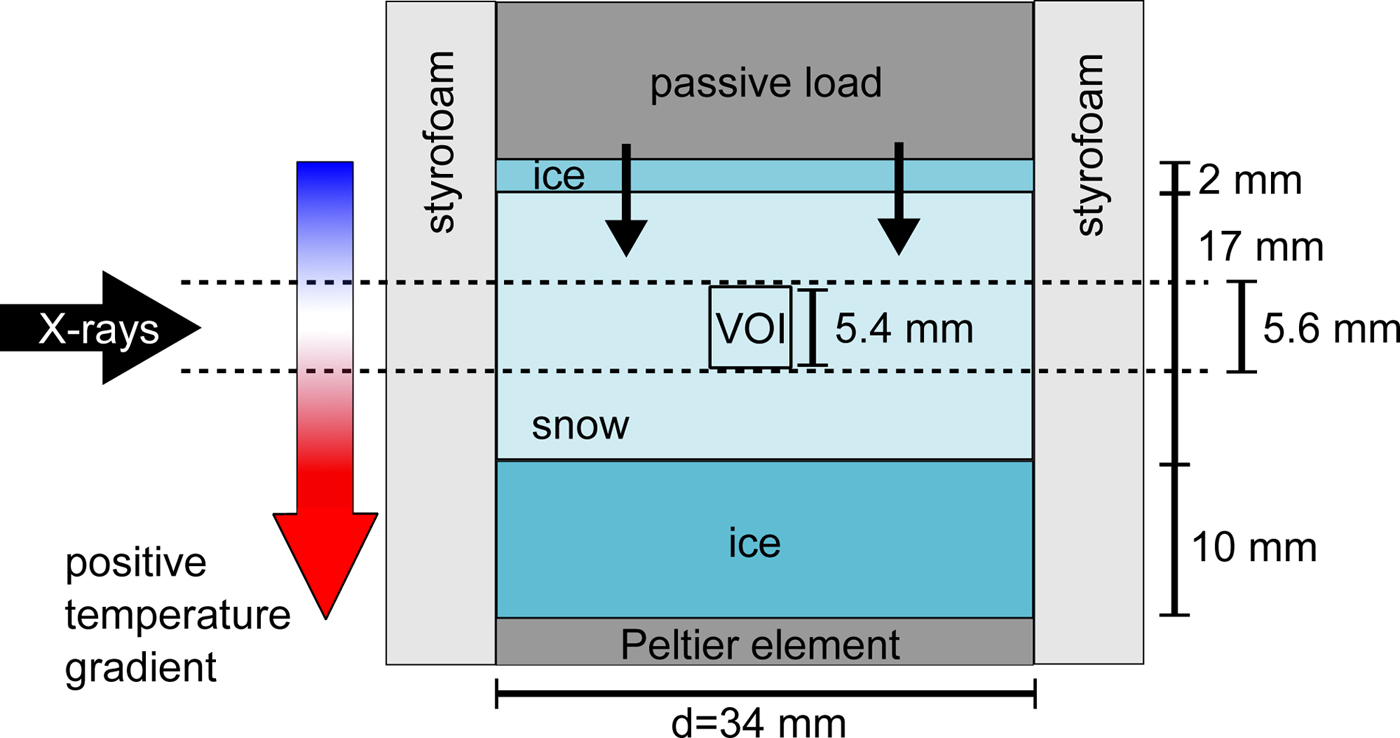
The sample diameter was given by the inner diameter of the Snowbreeder, which is 34 mm. To minimize wall effects during settlement the snow-sample height was 17 mm to reach the recommended diameter-to-height ratio of 2 (ASTM International, 2011). Since the measuring distance of the laser is restricted to 23–33 mm, we inserted a 10 mm thick ice layer at the bottom to raise the snow sample within the sample holder. This ice layer also serves as a water-vapour supply in the case of a positive temperature gradient, when the temperature at the bottom was higher than the temperature at the top of the snow sample. In experiments with a negative temperature gradient, we inserted an additional 2 mm thick ice layer between the snow sample and the passive load as water-vapour source. We lubricated the passive load with a thin film of silicone grease so that it did not freeze to the wall due to the depositing water vapour. No ice deposition was observed on the moving elements of the sample holder after the experiment.
In most of the experiments we applied the maximum stress, i.e. 1736 Pa, on the snow sample. This corresponds to 0.7–0.8 m snow lying on the sample with a density used in the experiment. To compare the structural snow evolution under stress and without stress, we fixed the load in the Snowbreeder in some experiments so that no external stress was applied to the snow sample. Wiese and Schneebeli (Reference Wiese and Schneebeli2017) estimated the stress of the snow's own weight in a sample of the same dimensions and density as in these experiments to be 2% of the imposed maximum stress of 1736 Pa, which they considered to be negligible. We did two experiments with snow samples with a diameter of 28 mm, in order to have certain unconfined conditions, to compare with experiments where the samples had a diameter as large as the inner diameter of the Snowbreeder. For the samples with a smaller diameter we adjusted the weight of the passive load such that the applied stress was very close to the other experiments. Table 2 gives an overview of the applied stresses and sample diameters.
Overview of the experiments
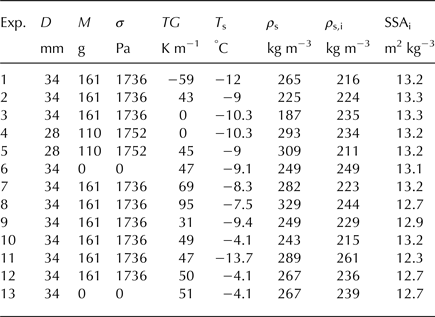
Exp.: experiment number, d: sample diameter, m: weight of the passive load, σ: vertical stress, TG: temperature gradient, T s: mean snow temperature, ρ s: initial snow-sample density measured in the laboratory, ρ s,i: initial snow density calculated from micro-CT images, SSAi: initial specific surface area.
We calculated the strain ε from the measured laser distance d l, the initial laser distance d l,0 and the height L of the sample as follows:
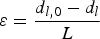 $${\rm \varepsilon} = \displaystyle{{d_{l,0} - d_l} \over L}$$
We imposed various temperature gradients on the snow sample by changing the temperature of the Peltier element and the air temperature inside the Micro-CT. For isothermal experiments we turned off the Peltier element and controlled the snow temperature only via the air temperature inside the Micro-CT. Since we inserted a 10 mm high ice layer at the bottom between the Peltier element and the snow sample, the temperature at the bottom of the snow sample was different compared with the temperature at the Peltier element. We estimated the temperature T int at the interface of the snow sample and the ice layer from the heat conduction through a composite sample. Thus, we could obtain the effective temperature gradient in the snow sample and in the ice layer below. At the interface the heat flux q is continuous:
 $$q_{\rm s} = q_{\rm i} $$
 $$- k_{\rm s} \displaystyle{{T_{{\rm top}} - T_{{\rm int}}} \over {z_{{\rm top}} - z_{{\rm int}}}} = - k_{\rm i} \displaystyle{{T_{{\rm int}} - T_{{\rm bot}}} \over {z_{{\rm int}} - z_{{\rm bot}}}} $$
From Eqn (4) we calculated the temperature at the interface T int as follows:
 $$T_{{\rm int}} = \displaystyle{{(k_{\rm i} /(z_{{\rm int}} - z_{{\rm bot}}) )T_{{\rm bot}} + (k_{\rm s} /(z_{{\rm top}} - z_{{\rm int}}) )T_{{\rm top}}} \over {(k_{\rm s} /(z_{{\rm top}} - z_{{\rm int}} )) + (k_{\rm i} /(z_{{\rm int}} - z_{{\rm bot}}) )}}$$
q s and q i are the heat fluxes in the snow and ice, respectively. T top and T bot are the temperatures measured at the top z top and bottom z bot of the Snowbreeder. z int is the height of the interface between the snow sample and the ice layer below. k i = 2.2 W m−1 K−1 is the heat conductivity of ice. For the heat conductivity of snow k s we took the value for the vertical heat conductivity of rounded snow with densities of our experiments, which is ~k s = 0.17 W m−1 K−1 (Riche and Schneebeli, Reference Riche and Schneebeli2013). The effective constant temperature gradients in the snow sample were between 0 and 95 K m−1. The mean snow temperature varied between − 4.1°C and − 13.7°C.
The snow samples were scanned periodically in the Micro-CT to analyse the microstructural snow evolution. We chose the settings for the micro-CT measurements such that the duration of one measurement was as short as possible to reduce the times when distance measurements were disturbed during the scans. The peak energy and the current of the X-ray tube was set to be 45 kVp and 88 μA, the integration time was 300 ms and the voxel size was 36 μm. We scanned a height of 5.6 mm in the middle of the snow sample. With these settings one measurement took 50 min. We took one micro-CT measurement every 8 h. The exact height position of the Snowbreeder in the Micro-CT was measured with a linear encoder (±1 nm) such that the scans could be precisely aligned between measurements.
At the beginning and end of each experiment we took close-up images of snow grains with a Olympus camera (model: E-510, resolution: 4 μm). In contrast to the 3D images obtained with the Micro-CT, the close-up images show only single snow grains and not the full snow structure with bonds between snow grains. However, these pictures allow an easy classification into snow types.
2.3. Image processing and numerical simulations
To analyse the 3-D images obtained with the Micro-CT, we defined a cubic volume of interest in the images, matching a representative volume of snow. The side length of the volume was 5.4 mm. We applied a Gauss filter with a sigma of 1 and a support of 2 voxels on the greyscale images. Then, we segmented the image into ice and air voxels, based on the histogram of greyscale values in the volume of interest. We used the same threshold for the segmentation for all images of one experiment. The resulting segmented 3-D images were merged to create time-lapse movies, which are included in the online Supplementary material.
From the segmented 3-D images we calculated structural snow parameters, i.e. density, specific surface area SSA and pore size, by triangulation of the ice surface using IPL (Image Processing Language, developed by Scanco Medical AG). This algorithm was also used by Kerbrat and others (Reference Kerbrat2008) and Matzl and Schneebeli (Reference Matzl and Schneebeli2010) to determine structural parameters of snow. The SSA is defined as the ratio of the ice surface area to the ice mass:
 $${\rm SSA} = \displaystyle{{{\rm ice\ surface\ area}} \over {{\rm ice\ mass}}}$$
In addition to the density calculated from the micro-CT images, we calculated the snow density from the weight and the dimensions of the snow sample in the beginning of the experiments.
We calculated additionally the structural anisotropy a of the snow structure from the normalized chord lengths, i.e. the length between intersections of air and ice in the segmented 3-D image (Good, Reference Good1987; M. Wiese and M. Schneebeli, unpublished data). The structural anisotropy a is defined as the ratio of the vertical chord length l z to the two mean horizontal chord lengths l x and l y:
 $$a = \displaystyle{{l_z} \over {(l_{\rm x} + l_{\rm y} )/2}}$$
We simulated the stress distributions in the snow microstructure as a first approximation by a purely elastic simulation in a voxel-based finite-element model in IPL (Van Rietbergen and others, Reference Van Rietbergen, Weinans, Huiskes and Odgaard1995). The isotropic elastic modulus of ice was taken as 9.6 GPa. By using this model, we were able to identify the change in stress distribution related to a change in the microstructure. The creep process in snow is also affected by the strong mechanical anisotropy of ice, and is not reproduced by this simple constitutive model. Prior to the simulations, all small unconnected parts in the segmented 3-D images were deleted, since these parts are not stress-bearing and would cause errors in the simulations. In the finite-element model the microstructure in a 3-D image is elastically deformed with a prescribed uniaxial strain in the vertical direction. From the simulations we calculated the Von-Mises equivalent stress in the snow structure and the elastic modulus. To analyse the distribution of the highest stresses in the snow structure we segmented the 3-D images of the snow structure once again based on a stress threshold. We kept once 5% and once 30% of the snow structure, in which the highest stresses occurred. For the images with 5% ice mass we calculated the anisotropy (Eqn (7)), which we defined as mechanical anisotropy in contrast to the structural anisotropy of the entire snow structure.
3. RESULTS
3.1. Observations
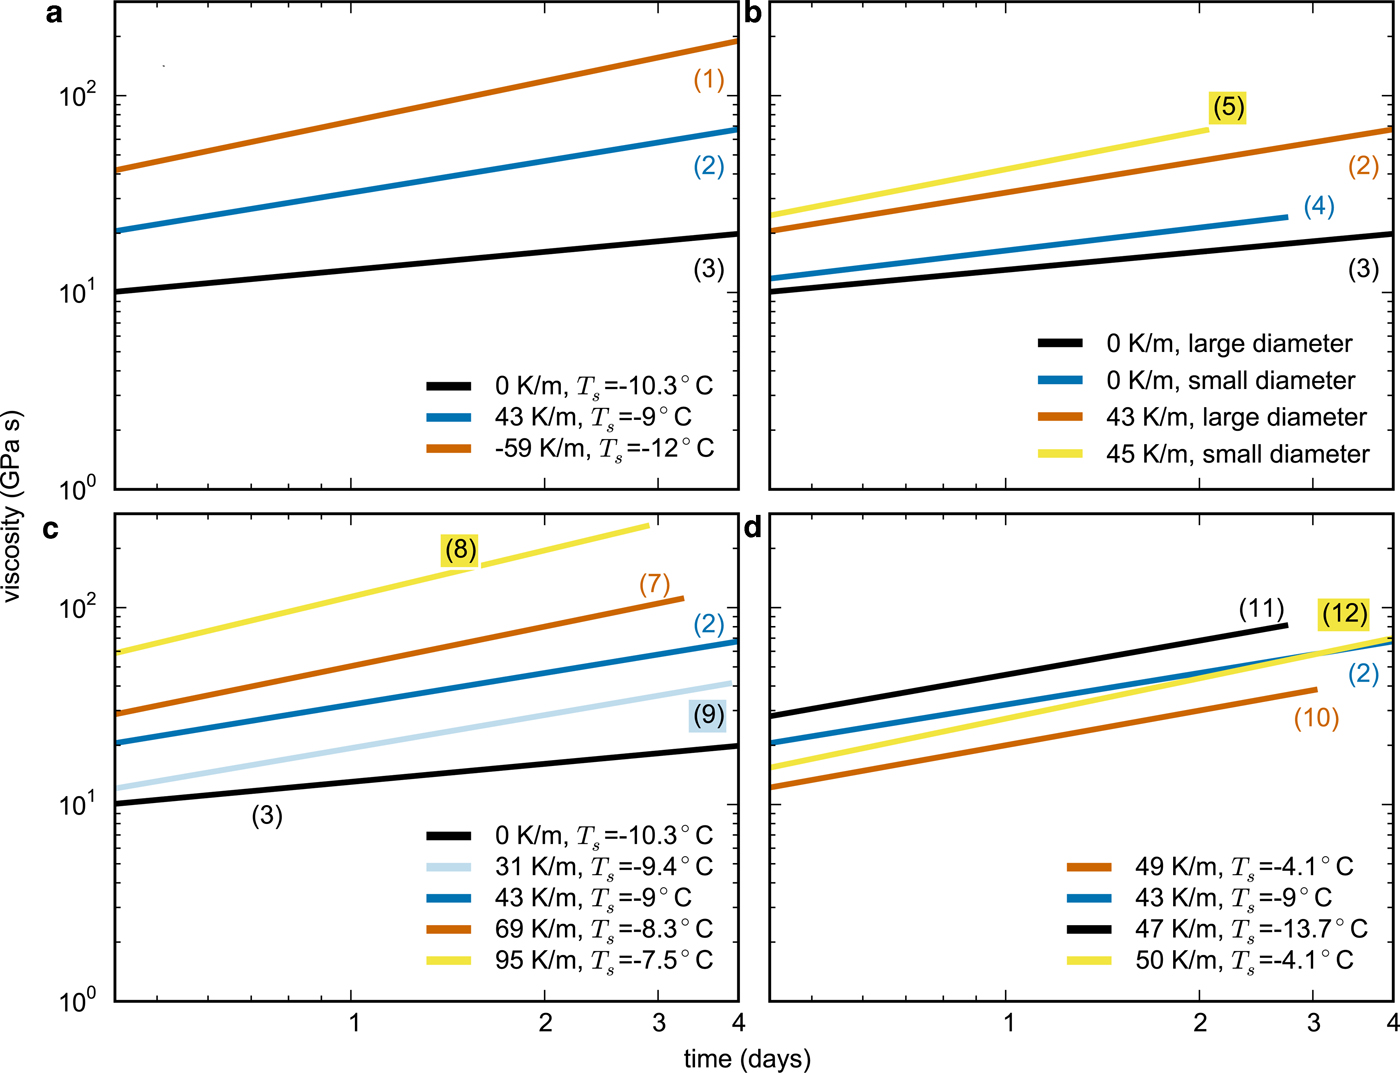
The strain of the snow samples increased monotonically in all experiments in which we induced settlement. In experiments with a constant temperature gradient the strain increase was slower compared with isothermal conditions, independent of the direction of the temperature gradient (Fig. 2a). The strain increase was lower for a higher temperature gradient (Fig. 2b). This difference in strain increase between isothermal and temperature-gradient experiments occurred both in confined and unconfined experiments (Fig. 2c). Figure 2d shows that the strain increase was lower at a lower mean snow temperature. The strain increase at −13.7°C was half as strong as the strain increase at − 4°C.
Strain dependence on temperature gradient direction (a) and magnitude (c), sample diameter (b) and mean snow temperature (d). T s: mean snow temperature. The colored parenthesized numbers on the lines refer to the experiment numbers in Table 2. The grey and black dashed lines are fits according to the power law given in Eqn (8). The exponents and prefactors of the power-law fits are given in Table 3.
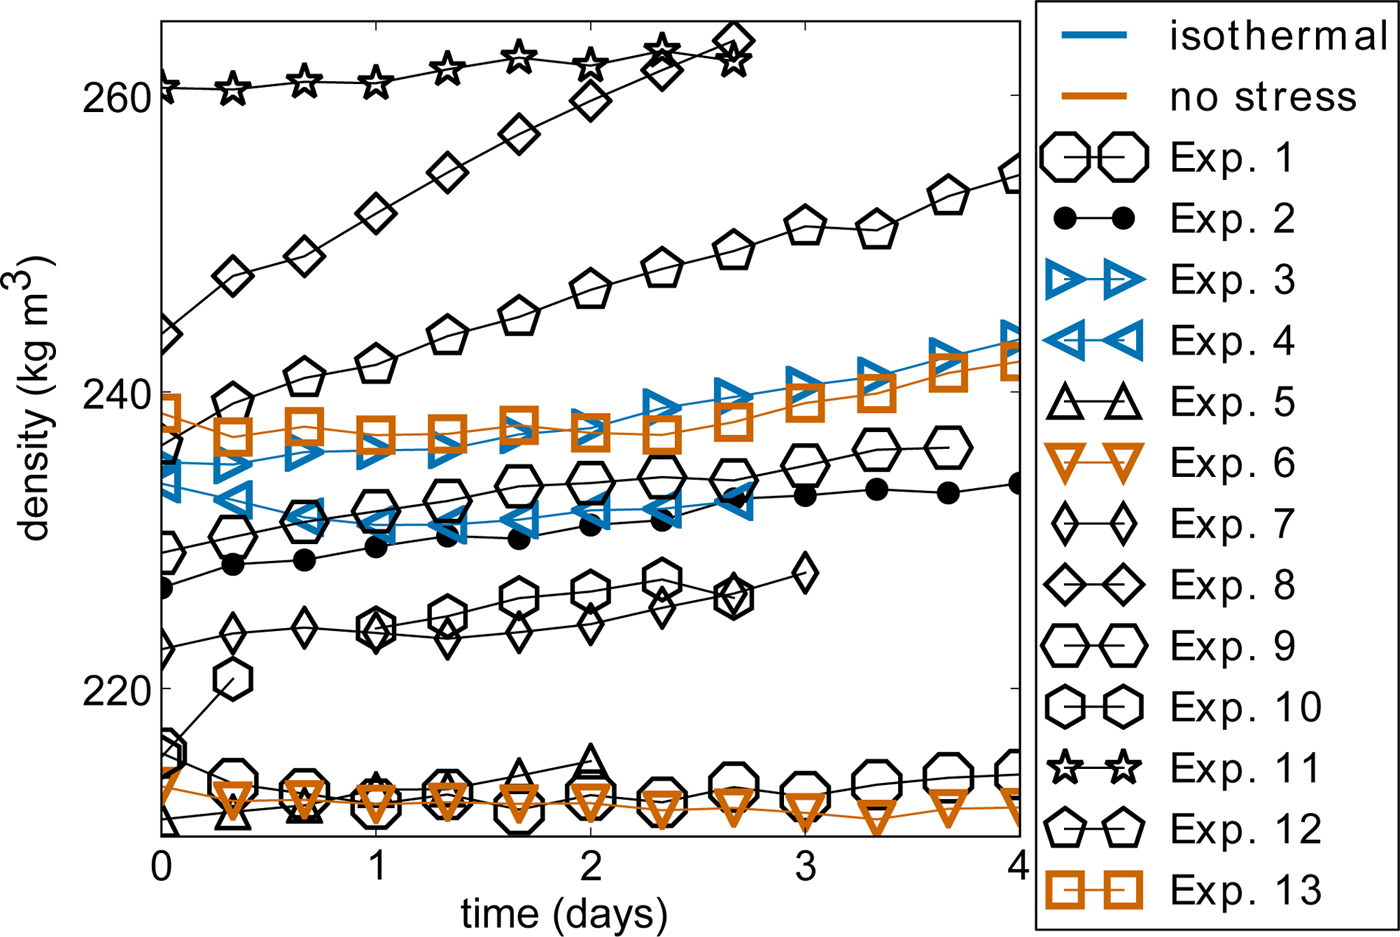
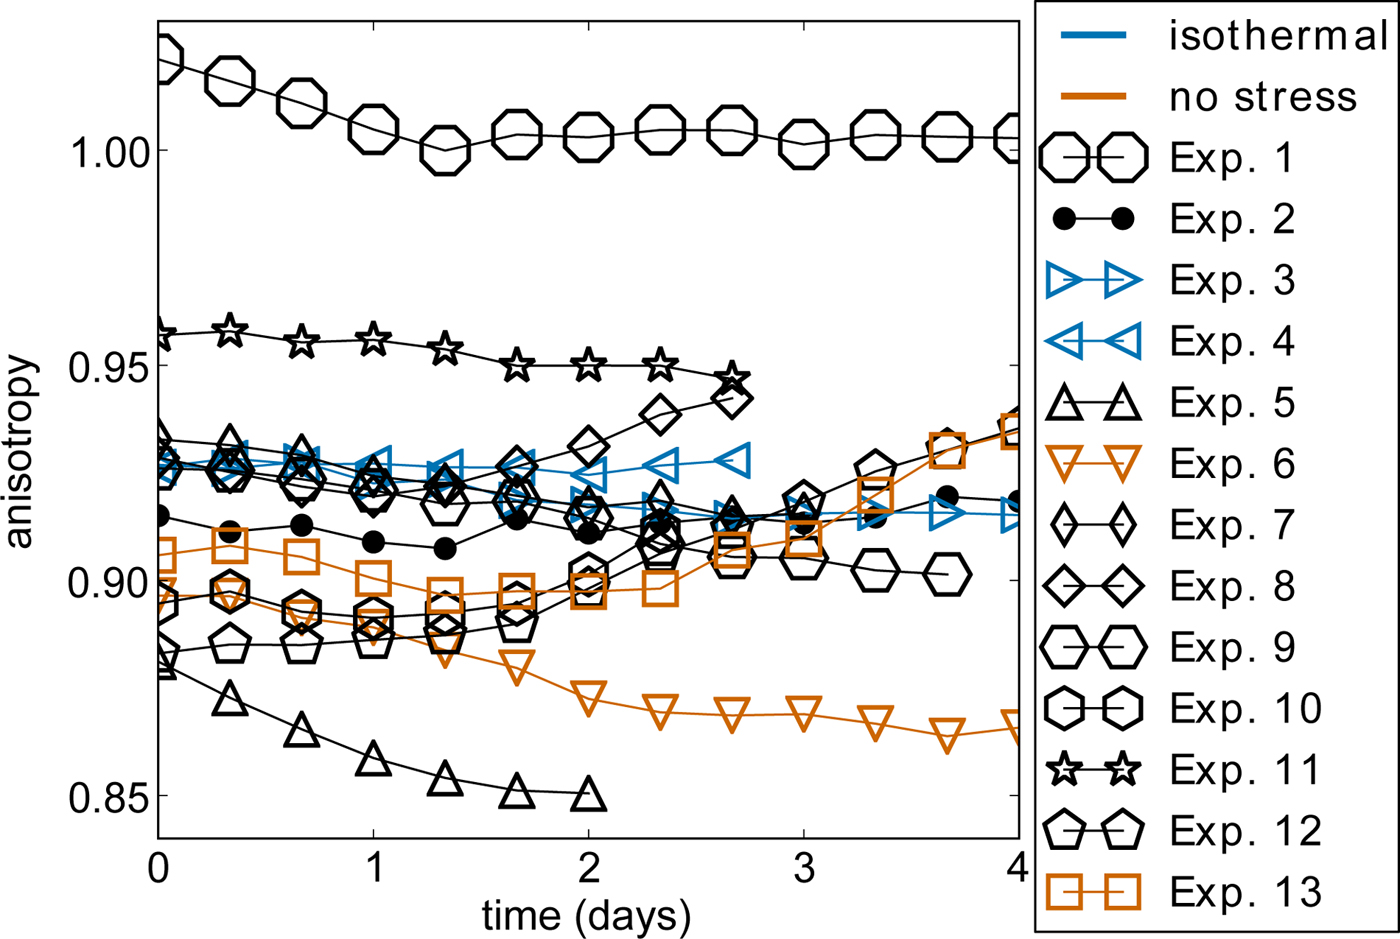
The initially rounded snow structure stayed rounded in the isothermal experiments and became faceted in the temperature-gradient experiments, in which small cup crystals formed (Fig. 3). The SSA decreased only slighty by ~5% and almost linearly in nearly all experiments (Fig. 4). This 5% change in SSA is at the limit of what can be measured with the Micro-CT. In Experiment 10 the SSA increased after a decrease for one day. In Experiment 3 and 4 the SSA increased from the beginning on, with a decrease after 1.5 days in Experiment 3. The highest SSA decrease occurred in the experiment with the highest temperature gradient (Exp. 8). In most of the experiments the snow density increased slightly (Fig. 5). In two experiments the density decreased first before a slight increase occurred (Exp. 1 and 4). In one of these experiments the temperature gradient was negative and in the other one settlement occurred under isothermal conditions. The initial snow structure was slightly horizontally anisotropic (Fig. 6). The structural anisotropy did hardly change during the experiments discussed in this subsection. In some experiments the anisotropy increased slightly and in other experiments the anisotropy decreased slightly.
Close-up images of snow grains before the experiments ((a), RGlr) and after 3 days under isothermal conditions ((b), RGlr and RGxf, Exp. 4), under a temperature gradient of 47 K m−1 ((c), FCso and RGxf, Exp. 10, mean snow tempearture: −13.7°C) and under a temperature gradient of 49 K m−1 ((d), FCso and DHcp, Exp. 11, mean snow temperature: − 4.1°C). The scale in the images is labeled in millimeters.
Temporal evolution of the specific surface area SSA. Details about the experiments are summarized in Table 2.
Temporal evolution of the snow density. Details about the experiments are summarized in Table 2.
Temporal evolution of the structural anisotropy. Details about the experiments are summarized in Table 2.
3.2. Viscosity
We divided the primary creep occurring in our experiments into a pre-primary (first 10 h) and primary creep (after 10 h), because the temporal strain evolution showed large variations from a straight line in a logarithmic plot during the first 10 h of the experiments. We fitted the evolution of the strain ε with time t during the primary creep to the following power law:
 $${\rm \varepsilon} = At^b $$
The values for the exponent b are between 0.28 and 0.7 (Table 3). The fitted strain evolution is shown as dashed grey and black lines in Figure 2.
Exponent b and prefactor A of the power-law fits of the temporal strain evolution (Eqn (8))
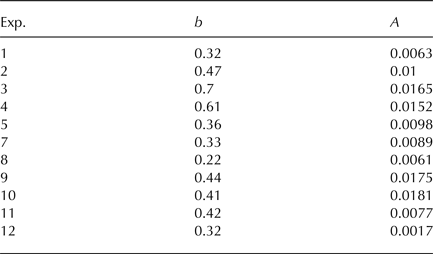
Exp.: experiment number.
With this power-law fit, we summarized the influence of the temperature gradient and mean snow temperature on the measured strain increase (Fig. 7). The strain increase is represented as the exponent b of the power law (Eqn (8)). The exponent b decreased linearly with an increasing temperature gradient TG:
 $$b = 0.63 - 4.7 \cdot 10^{ - 3} TG$$
Relationship between temperature gradient, mean snow temperature and temporal strain evolution given as the exponent of the power-law fit (Eqn (8), Table 3). Positive temperature gradients are depicted as circles and negative temperature gradients are depicted as squares. The black line is a linear fit given in Eqn (9).
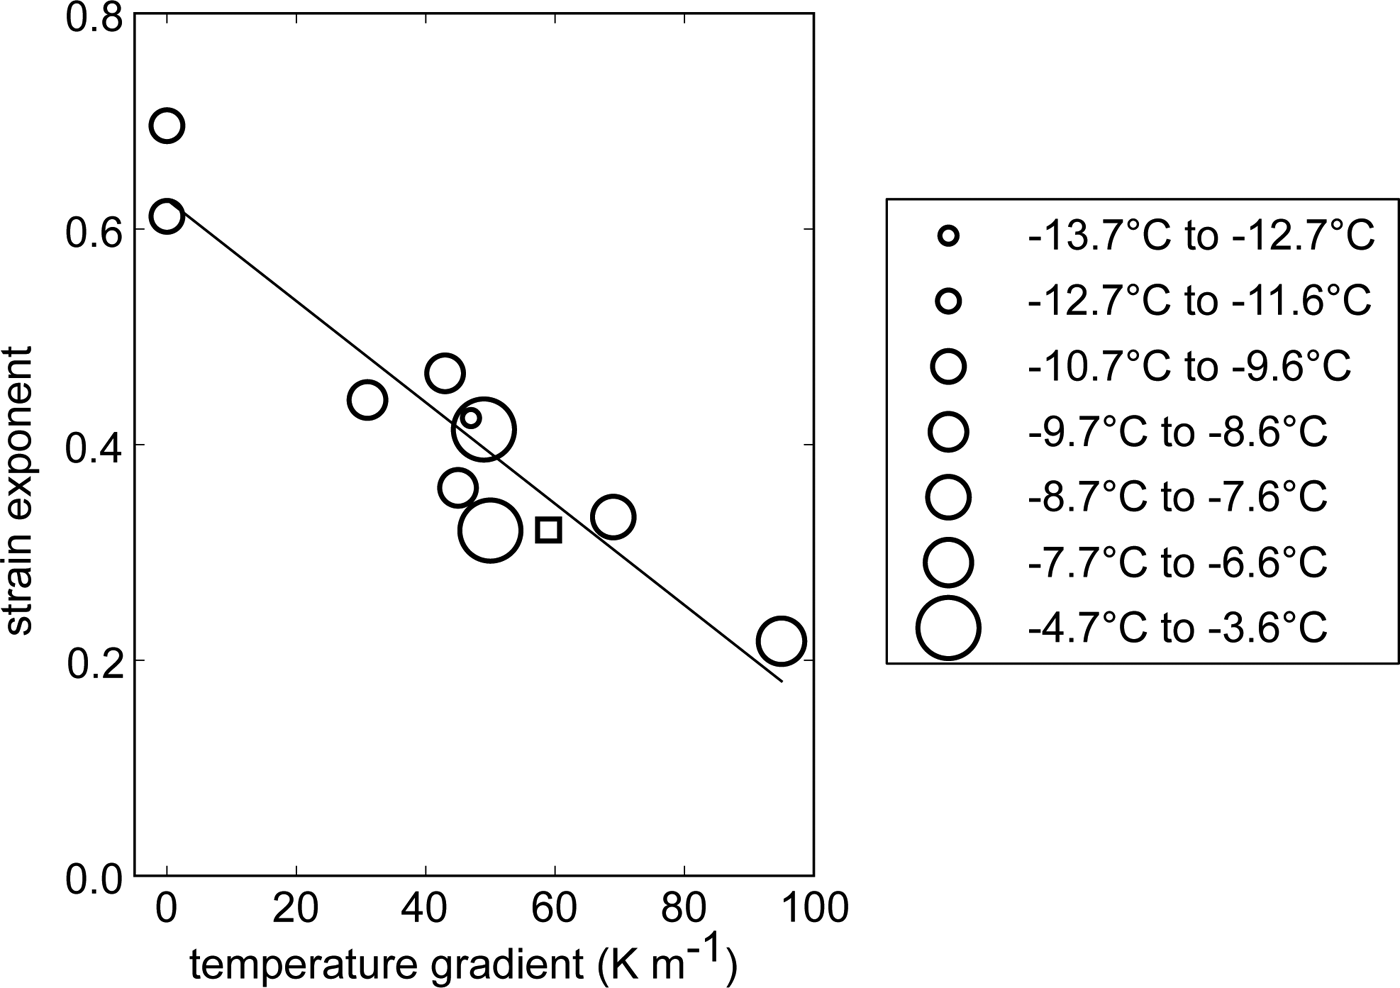
The correlation coefficient is −0.94 and the p-value is 1.2 · 10−5. A lower b at higher temperature gradients shows again the slower strain increase at higher temperature gradients. There is no clear effect of the mean snow temperature visible. The experiment within the lowest temperature range shows a similar value for b as one of the two experiments within the highest temperature range at almost the same temperature gradient.
We calculated the temporal evolution of the compactive viscosity η from the relationship between the strain rate  $\dot{\rm \varepsilon} $ and the applied stress σ (Eqn (1)). For this, we calculated the strain rate from the exponential strain-increase fit (Eqn (8)):
 $$\eta = \displaystyle{\sigma \over {\dot{\rm \varepsilon}}} = \displaystyle{\sigma \over {Abt^{b - 1}}} $$
The viscosity increased in the form of a power law in all experiments. In comparison with isothermal experiments the viscosity reached higher values in experiments with a temperature gradient, independent of the direction of the temperature gradient (Fig. 8a). The viscosity was higher at higher imposed temperature gradients (Fig. 8b). Additionally, the viscosity was slightly higher for lower mean snow temperatures (Fig. 8d).
Dependence of the compactive viscosity on temperature-gradient direction (a) and magnitude (c), sample diameter (b) and mean snow temperature (d). T s: mean snow temperature. The colored parenthesized numbers on the lines are the experiment numbers in Table 2.
3.3. Simulations
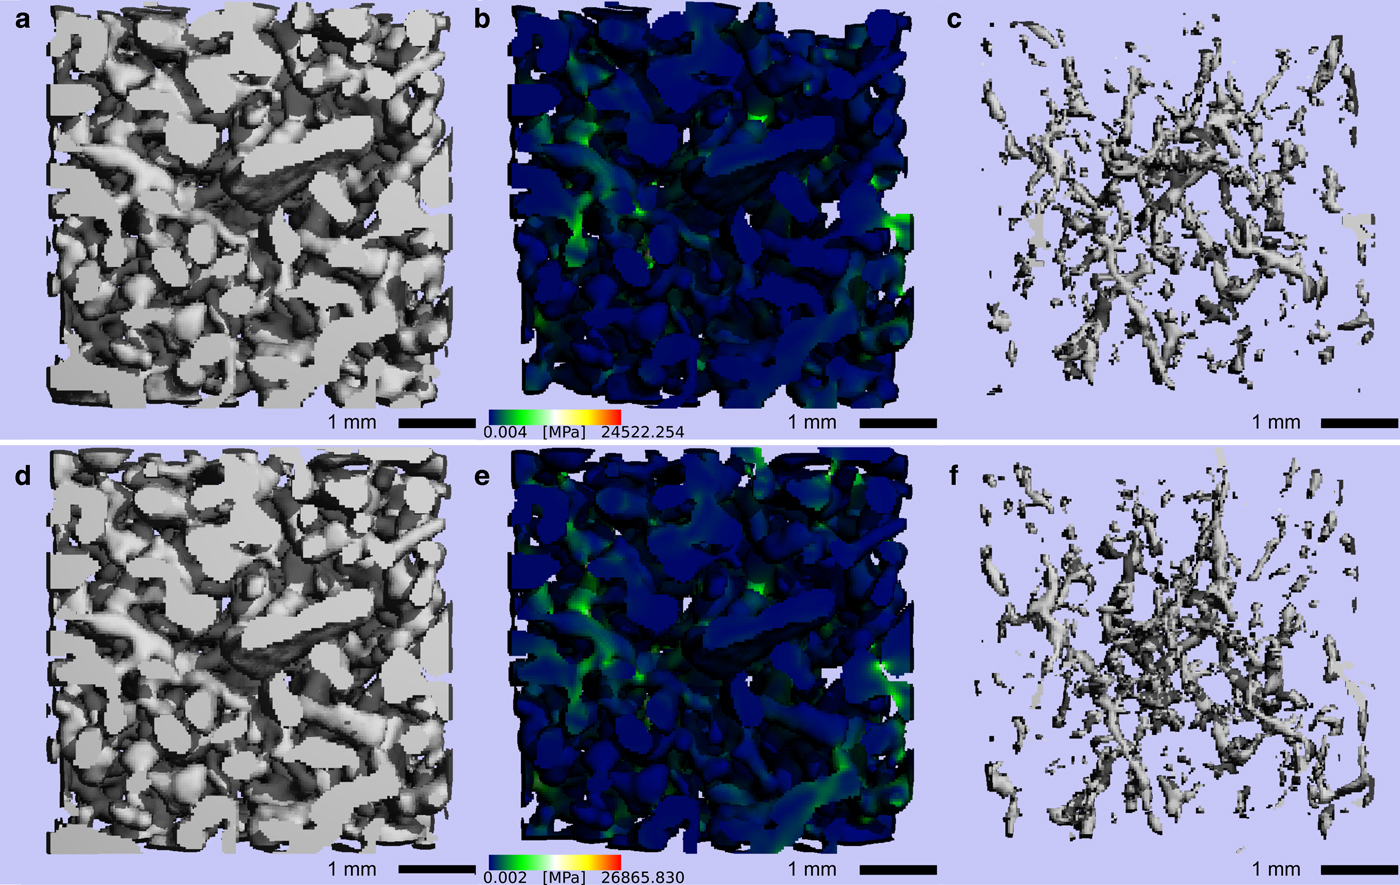
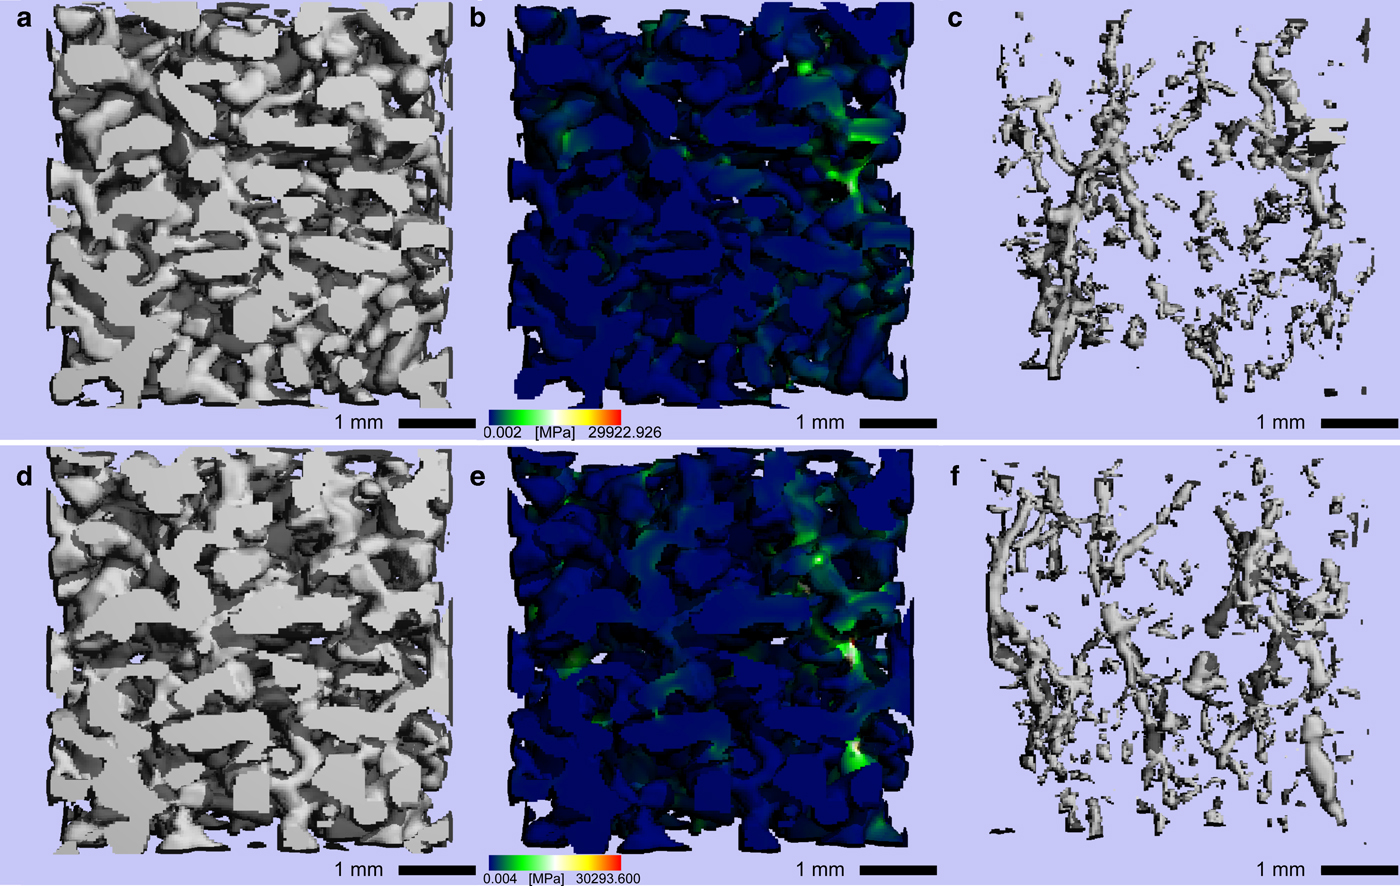
The finite-element simulations show a stiffening of the snow structure. We did simulations for the beginning and end of two experiments as examples for the influence of isothermal conditions and temperature-gradient metamorphism (Experiments 2 and 3 in Table 2). After 4 days, the simulated elastic modulus of the snow structure increased by 28% in the temperature-gradient experiment and by 23% in the isothermal experiment. Adding up the stresses in the stress-segmented 3-D images showed that in 30% of the ice mass 70.8% of the total stress occurred in the beginning of the temperature-gradient experiment. In the beginning of the isothermal experiment, the added up stresses in 30% of the ice mass comprised 71.9% of the added-up stresses occurring in the whole ice structure. Hence, the main part of the stress was born only by a small part of the ice structure. After 4 days 30% of the ice mass bore 72.4% and 70.5% of the stresses in the case of a temperature-gradient and isothermal conditions, respectively. The highest stresses were differently distributed in the beginning and at the end of the experiments. In the isothermal experiment the initial structure of 5% of the ice mass, which bore the highest stresses, was still visible and changed only little (Fig. 9). In the temperature-gradient experiment, vertical stress-bearing chains developed (Fig. 10). After 4 days the mechanical anisotropy increased, while the structural anisotropy showed only little evolution in both experiments. The structural anisotropy increased by 0.4% in the temperature-gradient experiment and decreased by 1.3% in the isothermal experiment. The mechanical anisotropy increased by 8.1% and 3.8% in the temperature-gradient experiment and in the isothermal experiment, respectively.
Initial snow structure (a) in the CT images of an isothermal settlement experiment (Exp. 3 in Table 2) and the snow structure after 4 days (d). (b) and (e) show stresses in the snow structure caused by elastic deformation in the finite-element simulation described in Section 2.3. (c) and (f) show 5% of the structure, in which the highest stresses occurred in the beginning of the experiment and after 4 days, respectively.
Initial snow structure (a) in the CT images of a settlement experiment with a constant temperature gradient (Exp. 2 in Table 2) and the snow structure after 4 days (d). (b) and (e) show stresses in the snow structure caused by elastic deformation in the finite-element simulation described in Section 2.3. (c) and (f) show 5% of the structure, in which the highest stresses occurred in the beginning of the experiment and after 4 days, respectively.
4. DISCUSSION
We measured a distinct reduction in snow settlement caused by temperature-gradient metamorphism in the first days after onset of metamorphism. The settlement induced by the passive load caused a strain increase in the snow samples. Simultaneous temperature-gradient metamorphism led to a slower strain increase than during isothermal conditions. We expected that a vapour flux in the opposite direction of the settlement could counteract the settlement and lead to a decreased strain increase. This would be the case for a positive temperature gradient, i.e. in the direction of the settlement. However, the strain slowed down both when the mass flux was in the direction of the settlement and when the mass flux was in the opposite direction. Hence, the vapour flux within the snow cannot explain the decreased settlement under a temperature gradient compared with isothermal conditions. We can also exclude an effect of the walls of the Snowbreeder on the settlement, independent of isothermal and temperature-gradient conditions. The presence of a temperature gradient and a lower mean snow temperature are two factors that decrease settlement. The snow temperature affects both temperature-gradient metamorphism and deformation. Both the recrystallization rate during metamorphism and the plastic flow increase exponentially with temperature (Bucher, Reference Bucher1956; Scapozza and Bartelt, Reference Scapozza and Bartelt2003b). We can exclude a parallel effect of temperature gradient and snow temperature on settlement in our experiments, because we analysed settlement at different temperature gradients with similar temperatures and vice versa. In addition to the snow temperature, other factors, like the fabric of the snow, i.e. the distribution of the c-axis orientation of the ice crystals in snow, influence both settlement and metamorphism, which we did not measure. However, the fabric evolves only slowly over weeks during temperature-gradient metamorphism (Riche and others, Reference Riche, Montagnat and Schneebeli2013) and did thus most probably not affect settlement during our 4-day long experiments. In the experiments without external stress we did not observe any compaction.
The experiments showed that temperature-gradient metamorphism affects settlement immediately after the onset of metamorphism and not just after a typical depth-hoar structure developed as suggested by field observations (Kojima, Reference Kojima1967; Armstrong, Reference Armstrong1980; Shapiro and others, Reference Shapiro, Johnson, Sturm and Blaisdell1997; Sturm and Benson, Reference Sturm and Benson1997; Sturm and Holmgren, Reference Sturm and Holmgren1998). The transition from a rounded to the onset of a faceted structure is indicated by a slight SSA decrease and slight faceting without a fully evolved depth-hoar structure visible in the images. The SSA decrease resulted from a slight coarsening of the snow structure due to metamorphism. However, only Experiment 8 showed a clear SSA decrease larger than the measurement limit of the Micro-CT, because of the strong imposed temperature gradient. We did not observe a clear influence of the settlement on the SSA evolution, similar to measurements of new-snow settlement from Schleef and Löwe (Reference Schleef and Löwe2013). The SSA increases measured in some experiments were probably caused by the settlement, which led to a movement of different parts of the snow structure into the VOI. However, the SSA variations are at the limit of what can be measured with the Micro-CT. Even though the density increased slightly in most of the experiments, the density increase did not match the compaction caused by the macroscopic strain. In one experiment without stress the density increased slightly and in two experiments with stress the density decreased first before a slight increase occurred (Exp. 1 and 4). The isothermal experiments (Exp. 3 and 4) did not show the highest densification, even though the strain increase was strongest in these experiments. We measured the largest density increase for the experiment with the highest temperature gradient and least strain increase (Exp. 8). A possible reason are local compaction bands propagating through the snow, as observed by Barraclough and others (Reference Barraclough2016). Our volume of interest could probably resolve single compaction bands, but was too small to measure the overall densification of the snow sample. Inhomogeneous recrystallization as well as initial vertical density variations might also play a role in the observed density evolution. The structural anisotropy did barely evolve and was not significantly different between isothermal settlement and settlement under a temperature gradient. Hence, the evolution of the structural anisotropy can also not explain the decreased settlement under a temperature gradient compared to isothermal conditions. Initially, we expected that the snow structure develops faster a vertical anisotropy in the case of a temperature gradient, which stabilizes the snow, in contrast to an isotropic structure under isothermal conditions.
According to the measured non-stationary strain rates the snow samples showed primary creep, which we fitted to a power law. Our experiments show that the exponent b is not constant for a certain density, but depends also on the history of the snow. Only the Experiments 1, 7 and 12 showed Andrade creep with an exponent of or close to 1/3, which occurs usually in polycrystalline ice and dense polycrystalline snow. In the other experiments the exponent was higher, except for one experiment, in which the exponent was lower. Our isothermal experiments can be best compared with literature values. We found them close to the values of Theile and others (Reference Theile, Löwe, Theile and Schneebeli2011) and Schleef and Löwe (Reference Schleef and Löwe2013), even though the density was lower in the new-snow experiments of Schleef and Löwe (Reference Schleef and Löwe2013). Our experiments with a temperature gradient showed that the change in the exponent b could be parametrized using the relationship given in Eqn (9) and shown in Figure 7. However, such a parametrization must be used within the range of snow microstructures investigated.
As the strain increased less in experiments with a temperature gradient in comparison with isothermal experiments, the viscosity reached higher values in those experiments with a temperature gradient. The viscosity values for isothermal conditions are comparable with values given in Shapiro and others (Reference Shapiro, Johnson, Sturm and Blaisdell1997). However, the values given in Shapiro and others (Reference Shapiro, Johnson, Sturm and Blaisdell1997) are only valid for isothermal conditions. The higher compactive viscosity for snow subjected to a constant temperature gradient is not considered in Shapiro and others (Reference Shapiro, Johnson, Sturm and Blaisdell1997). The temperature dependence of the viscosity reported by Bucher (Reference Bucher1956) is also visible in our experiments, i.e the viscosity was higher at lower temperatures.
While the structural evolution was only small, the mechanical properties of the snow structure evolved much faster with a strong influence on settlement. Both in the isothermal and temperature-gradient experiment the elastic modulus increased, showing a stiffening of the snow structure due to settlement. We expected that the elastic modulus would increase more in the isothermal experiment due to the faster densification caused by the higher strain. However, the elastic modulus increased more in the experiment with constant temperature-gradient metamorphism, indicating a stronger stiffening of the snow structure in the case of a temperature gradient. Hence, the temperature-gradient snow structure could deform less than the isothermal snow structure after 4 days, which is consistent with our strain measurements. In the temperature-gradient experiment the small part of the snow structure bearing the main part of the stresses increased after 4 days. Since we used an elastic constitutive model, higher simulated stresses are equivalent to less strain in experiments with a constant applied stress. Hence, less strain could occur in the end of the temperature-gradient experiment, indicating again the stiffening of the snow structure and matching the measured slower strain increase in this experiment compared with isothermal conditions. Additionally, the snow structure developed a larger vertical mechanical anisotropy after onset of temperature-gradient metamorphism compared with isothermal conditions. Stress-bearing chains developed in the snow due to temperature-gradient metamorphism, as also observed similarly by Gubler (Reference Gubler1978) and Schneebeli (Reference Schneebeli2004). These stress-bearing chains stiffen the snow structure much more than an isothermal snow structure, where no such chains developed. This chain formation was apparently independent of the temperature-gradient direction, as the settlement was slower both for a positive and a negative temperature gradient. Similar to the stress-bearing chains, Pinzer (Reference Pinzer2009) showed in simulations that only 40% of the ice conducted 80% of the heat through the snow structure and that heat-flow paths developed under the influence of a constant temperature gradient. Our experiments show that the formation of stress bearing chains leads to a slower settlement in the case of a temperature-gradient compared with isothermal conditions. The formation of such chains increases with temperature gradient and the associated increase in vapour flux and metamorphism, as indicated by the linear relationship between the temperature-gradient magnitude and the strain exponent.
5. CONCLUSIONS
With our laboratory experiments we showed that settlement is strongly affected by temperature-gradient metamorphism directly after onset of metamorphism. After 4 days, a barely measurable structural evolution due to temperature-gradient metamorphism had a large impact on the mechanical properties of snow. Stress-bearing chains developed, which caused a stronger stiffening of the snow structure in contrast to isothermal conditions. This is reflected in the compactive viscosity, which was larger under a temperature gradient than under isothermal conditions. Hence, snow with a similar structure can differ substantially in the mechanical properties. Thus, density and stress are not enough to estimate the settlement of a snowpack. Additionally, a good knowledge about the temperature history is necessary, since the memory of the snow structure evolves fast.
The mechanical properties of snow should be measured in detail under the influence of temperature-gradient metamorphism, to complement the values for isothermal conditions measured before. In the current snowpack models, such as Snowpack and Crocus, the influence of the snow structure due to temperature-gradient metamorphism has to be taken into account in the parameterizations and constitutive equations, which relate stress to strain, to represent the mechanical snow properties reasonably. Good constitutive equations are for example necessary to calculate the stability of a snowpack to evaluate the risk of avalanches.
Since alternating temperature gradients occur rather often in a snowpack, the influence of alternating temperature gradient metamorphism on the mechanical properties of snow could be an interesting investigation. Possibly, settlement under such conditions is similar to isothermal settlement, when the alternating temperature gradient is symmetric, which leads to a rounded snow structure. An asymmetric alternating temperature gradient could cause a decreased settlement, since the metamorphism is closer to constant temperature-gradient metamorphism. However, both symmetric and asymmetric temperature gradients lead to the development of a vertically asymmetric snow structure (M. Wiese and M. Schneebeli, unpublished data), which could stabilize the snow structure after some time, leading to similar settlement rates in both cases.
Supplementary material
The supplementary material for this article can be found at https://doi.org/10.1017/jog.2017.31.
ACKNOWLEDGEMENTS
This study was supported by the Swiss National Science Foundation project number 200021_143839. We thank Matthias Jaggi for his great help in the laboratory. We also thank Henning Löwe for discussions. The chord-length calculations were done with a program written by Quirine Krol. Data are available on request from Martin Schneebeli (schneebeli@slf.ch).


 Open access