


1. Introduction
Designers should estimate consumers’ visual impressions of products to ensure that the consumers understand the designers’ intention, which appears in the appearance of the products. Reference CrossCross (2000) defined the design process as a series of activities, starting from setting the design problem to exploring, generating, evaluating, and communicating designs. During evaluations, designers should check the structure and behavior of the designed artifacts to ensure that the proposed designs solve the specific design problems ( Reference CrossCross, 2000 ). In addition, designers should predict the consumers’ impression of a product’s appearance, particularly when designing consumer products, because a product’s appearance affects consumers’ choices. For example, Reference Creusen and SchoormansCreusen and Schoormans (2004) suggested six different roles of product appearance: communication of aesthetic, symbolic, functional, ergonomic information, attention-drawing and categorization, and they indicated that the roles affect the different factors that affect consumers’ impressions.
However, it can be difficult for designers to estimate consumers’ visual impressions of products because consumers do not necessarily share their tastes and preferences with designers. Reference Mooij and HofstedeMooij and Hofstede (2002) demonstrated that consumers’ tastes and preferences diverge because of differences in culture, sociodemographic properties, income, gender, and psychological factors. Such differences could exist between designers who have received design-specific training or have designed products and consumers who have generally not undergone such experiences. In addition, Reference Hsu., Chuang. and Chang.Hsu et al. (2000) showed that there are many differences between consumers’ and designers’ design preferences and understanding the relationship between real objects and image-words. Although consumer surveys can help designers understand consumer impressions of a product’s appearance, they require time, cost, and effort. Such surveys require responses from many consumers, considering their divergent tastes and preferences. In addition, surveying with the intention of evaluating product design before production is difficult because of the confidential nature of product design in the pre-production stage.
Therefore, many studies have attempted to apply artificial intelligence (AI) to estimate consumer impressions. However, developing AI models that estimate consumer impressions requires enormous training costs and datasets that represent the relationship between consumer impressions and product appearance. Reference Jolly, Iwana, Kuroki and UchidaJolly et al. (2018) demonstrated that a convolutional neural network trained on a dataset sourced from e-commerce services can predict a book’s category using just its cover image. Reference Xia, Sakamoto, Wang and YamasakiXia et al. (2022) developed a ResNet50-based model trained on a dataset sourced through a user preference survey in which 1,000 participants evaluated the appearance of 5,173 product packages. The model can predict consumer preferences and semantic impressions of a package and visualize its feature map. Both studies showed that AI technologies may support the evaluation of design appearance. However, they also indicated that developing AI models requires a large dataset that contains information related to the relationship between the appearance of many products and consumer impressions.
Unlike conventional AI technologies, recent innovations in large-scale multimodal foundation models could enable designers to estimate consumer impressions without surveys, large datasets, or expensive training. Reference Radford, Kim, Hallacy, Ramesh, Goh, Agarwal, Sastry, Askell, Mishkin, Clark, Krueger and SutskeverRadford et al. (2021) invented contrastive language-image pre-training (CLIP) for a multimodal model that can embed images and texts in the same latent space. The image classification models are limited in requiring additional labeled data to classify images according to unlearned concepts. When a batch of N (text, image) pairs is given, CLIP learns a multimodal embedding space by jointly training an image encoder and text encoder to maximize the cosine similarity of the image and text embeddings of the N real pairs in the batch while minimizing the cosine similarity of the embeddings of the N 2 − N incorrect pairings. This method enables the model to classify images into unlearned categories. The text can contain the names of objects in the images and expressions of impressions; therefore, the CLIP model can disentangle the visual characteristics of images related to visual impressions in the latent space. Reference Hentschel, Kobs and HothoHentschel et al. (2022) showed that a CLIP model can quantitatively estimate the aesthetics of pictures. Moreover, employing large-scale foundation multimodal models to estimate the visual impression of products can reduce the training costs of developing a visual impression estimator. However, it is unclear whether impressions of product appearance estimated by the CLIP model are similar to those of general consumers or experts (e.g., designers).
Therefore, we hypothesized that the ratings provided by the CLIP model on product appearance are more similar to consumers’ ratings than those of designers. We believed that models pre-trained on datasets sourced from the internet represent the taste and preference of the average consumer. To test this hypothesis, we conducted a survey in which consumers and designers rated the appearance of car wheels, and the model was used to estimate the visual impressions of car wheels. We compared the ratings of consumers, designers, and the model to test this hypothesis.
The contributions of this study are twofold. First, this study indicates that large-scale foundation multimodal models can estimate designers’ visual impressions of products better than general consumers. Second, it suggests that general consumers do not have a consensus on the relationship between the visual characteristics of products and their impressions.
2. Materials and methods
2.1. Materials
To compare consumers’ and designers’ visual impressions of the products, we conducted online surveys asking consumers to rate images of car wheels sold in the market. It could be difficult for people to presume car wheels’ brand based only on their appearance, and so they could be good evaluation objects to evaluate their visual impressions without effect of their brands. Each image showed a front view of a car wheel without tires, and its background was white. Some images contained other parts behind the car wheel (e.g., brake calipers). The trademark placed at the center of the car wheel was masked with the average color of the masked area to protect the trademark and exclude its impact on participants’ impressions. The image resolution was 256×256 pixels. The total number of images was 1,657, and the images were randomly and equally split into eight lists containing 207 or 208 images without duplicates.
2.2. Participants
For the consumer survey, participants were recruited through Amazon Mechanical Turk (MTurk) to rate car wheel images. The total number of participants was 3,456 (1,152 for each impression axis), but the number of unique participants was 2,136 because each participant could join two or more surveys with different rating axes. The average age of the unique participants was 33.32±8.74 years, except for the participants who answered biologically impossible ages, provided different ages for the plural surveys, or specified “Prefer not to answer.” Of these participants, 1,306 were male, 759 were female, and 1 was non-binary, except for the participants who indicated different genders for different surveys or preferred not to answer. The surveys were in English; therefore, we set the condition that the survey be limited to the MTurk workers who resided in the United States. Moreover, workers should have completed at least 50 approved human intelligence tasks (HITs), and their HIT approval rate must be greater than 90%. In addition, the designer survey included 20 designers from Japan who were working in car wheel design.
2.3. Procedure
The recruited participants rated the images of car wheels on a scale of one to seven. Surveys were conducted following a procedure approved by the Institutional Review Board. First, the participants were required to read the survey description and provide consent to participate. Second, they were asked to answer questions about their age, sex, ethnic group, living country, longest-living country, annual income, and educational background. They had the option to choose “prefer not to answer” as an answer for each question. Third, the definition of the assigned rating axis was explained to align each participant’s recognition of the rating axis with that definition. In the survey, the participants rated each image on elegance, luxury, or sportiness. The level of influence of products’ function on visual impression of products could differ depending on evaluation axes. For example, the sportiness of car wheels could be affected by their function, and luxury and elegance could have a weak relationship with their function. Therefore, the combination of these evaluation axes could be good for understanding how the level of understanding of the relationships between their functions and visual characteristics affects their visual impressions. The definition of each axis is explained in Table 1. Finally, a list of images was assigned to each participant, and the participant looked at all images of the assigned car wheels and rated each image using a 7-point Likert scale ( Reference LikertLikert, 1932 ) shown in Table 2. Figure 1 shows an example of a survey form. The car wheel image in Figure 1 is an example generated by stable diffusion and is not a car wheel presented to the participants. After completing the rating, the participants submitted a completed survey and received an incentive of $ 3.75 for participation. In the designer survey, designers rated 240 images of car wheels on elegance, luxury, or sportiness using a 7-point Likert scale. The 240 images were collected by randomly extracting 30 images from each list of car wheel images presented to the consumer participants.
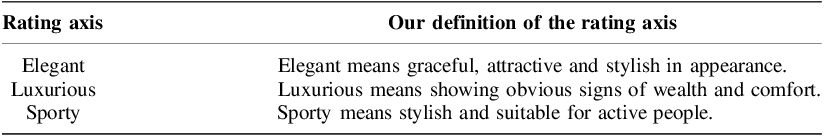
Definition of rating axes presented to the participants

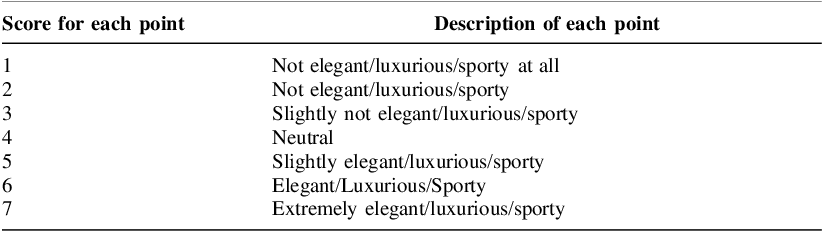
Description of each point presented to the participants

Example of the survey form asking participants to evaluate the elegance of car wheels

2.4. Ratings of car wheels estimated by AI
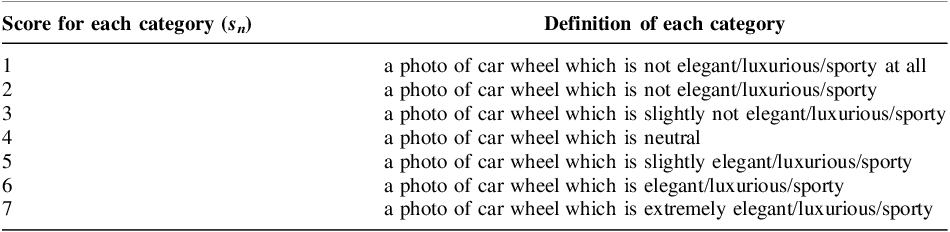
In this study, we employed the CLIP model ViT-L/14@336px ( Reference Radford, Kim, Hallacy, Ramesh, Goh, Agarwal, Sastry, Askell, Mishkin, Clark, Krueger and SutskeverRadford et al., 2021 ) to rate images of car wheels. The model categorized all images of car wheels presented to consumers into seven categories, as presented in Table 3. The definition of each category is equivalent to the description of each point (Table 2) presented to consumers and designers. When the model received an image of a car wheel and the definition of categories shown in Table 3, it outputted the probabilities of categorizing each image into a specific category. Therefore, we defined the sum of the products of a score for each category and the probability that the image was categorized into the category, as shown in Equation (1).
 $$s_{image} = \mathop \sum \limits_{n = 1}^7 r_n p_n$$
where s image is the score for the image, n is the number of categories, rn is a score assigned to the nth category, and pn is the probability that the image is categorized into the nth category.
Description of each category presented to the CLIP model

2.5. Comparison of consumers’, designers’ and AI model’s ratings
We compared the correlation of ratings between every two consumers, every two designers, each consumer and the CLIP model, and each designer and the model to understand the characteristics of car wheel ratings by consumers, designers, and models. Before the comparison, we eliminated ratings by consumers who used only one point to rate all presented images because they could not detect minor differences in the appearance of the presented car wheels.
First, we compared the dispersion of the Pearson product-moment correlation coefficients for every two consumer and designer ratings. For consumers, we computed the correlation coefficients for every two ratings from consumers who rated 207 or 208 images on the same list. On the other hand, all designers rated the same 240 images; therefore, we computed the correlation coefficients for every pair of ratings for all designers. We then compared the distributions of correlation coefficients for the consumers and designers using the unequal variances two-sided t-test (Welch’s t-test (
Reference Derrick, Toher and WhiteDerrick, 2016
)) and effect size (Cohen’s d (
Reference CohenCohen, 1988
)). In the t-test, t was computed using Equation (2), degree of freedom v was computed using Equation (3), and the p-value was found in the survival function based on t and v, where $\bar c_i $
is the mean correlation coefficient of ith group of participants (e.g., consumers or designers), s
i
2 is the unbiased variance of the correlation coefficients of the ith group, Ni
is the sample size of the ith group.
$\bar c_i $
is the mean correlation coefficient of ith group of participants (e.g., consumers or designers), s
i
2 is the unbiased variance of the correlation coefficients of the ith group, Ni
is the sample size of the ith group.
 $$t = {{\bar c_1 - \bar c_2 } \over {\sqrt {{{s_1^2 } \over {N_1 }} + {{s_2^2 } \over {N_2 }}} }}$$
 $$v \approx {\Bigg({{{s_1^2 } \over {N_1 }} + {{s_2^2 } \over {N_2 }}\Bigg)^2 } \over {{{s_1^4 } \over {N_1^2 v_1 }} + {{s_2^4 } \over {N_2^2 v_2 }}}} = {{\Bigg({{s_1^2 } \over {N_1 }} + {{s_2^2 } \over {N_2 }}\Bigg)^2 } \over {{{s_1^4 } \over {N_1^2 (N_1 - 1)}} + {{s_2^4 } \over {N_2^2 (N_2 - 1)}}}}$$
In addition, Cohen’s d was computed using Equation (4):
 $$d = {{\bar c_1 - \bar c_2 } \over {\sqrt {{{(N_1 - 1)s_1^2 + (N_2 - 1)s_2^2 } \over {N_1 + N_2 - 2}}} }}$$
Second, we compared the dispersion of the correlation coefficients between each consumer’s or designer’s ratings and the model’s ratings. To compute the correlation coefficients between the ratings of each consumer and the model, the model was used to rate 207 or 208 images in the same image list as that one provided to the consumer. In computing the correlation coefficients between the ratings of each designer and the model, the model rated 240 images as with the designers. Subsequently, the distributions of the correlation coefficients between consumers and designers and the model were compared, as were the distributions of the correlation coefficients between consumers and designers.
3. Results
3.1. Ratings of car wheels by consumers and designers
First, 110 consumer participants were excluded from the comparison of elegance, 140 for luxury, and 112 for sportiness. They were excluded because they used only one point to rate the appearance of car wheels. None of the designers were excluded from the comparison.
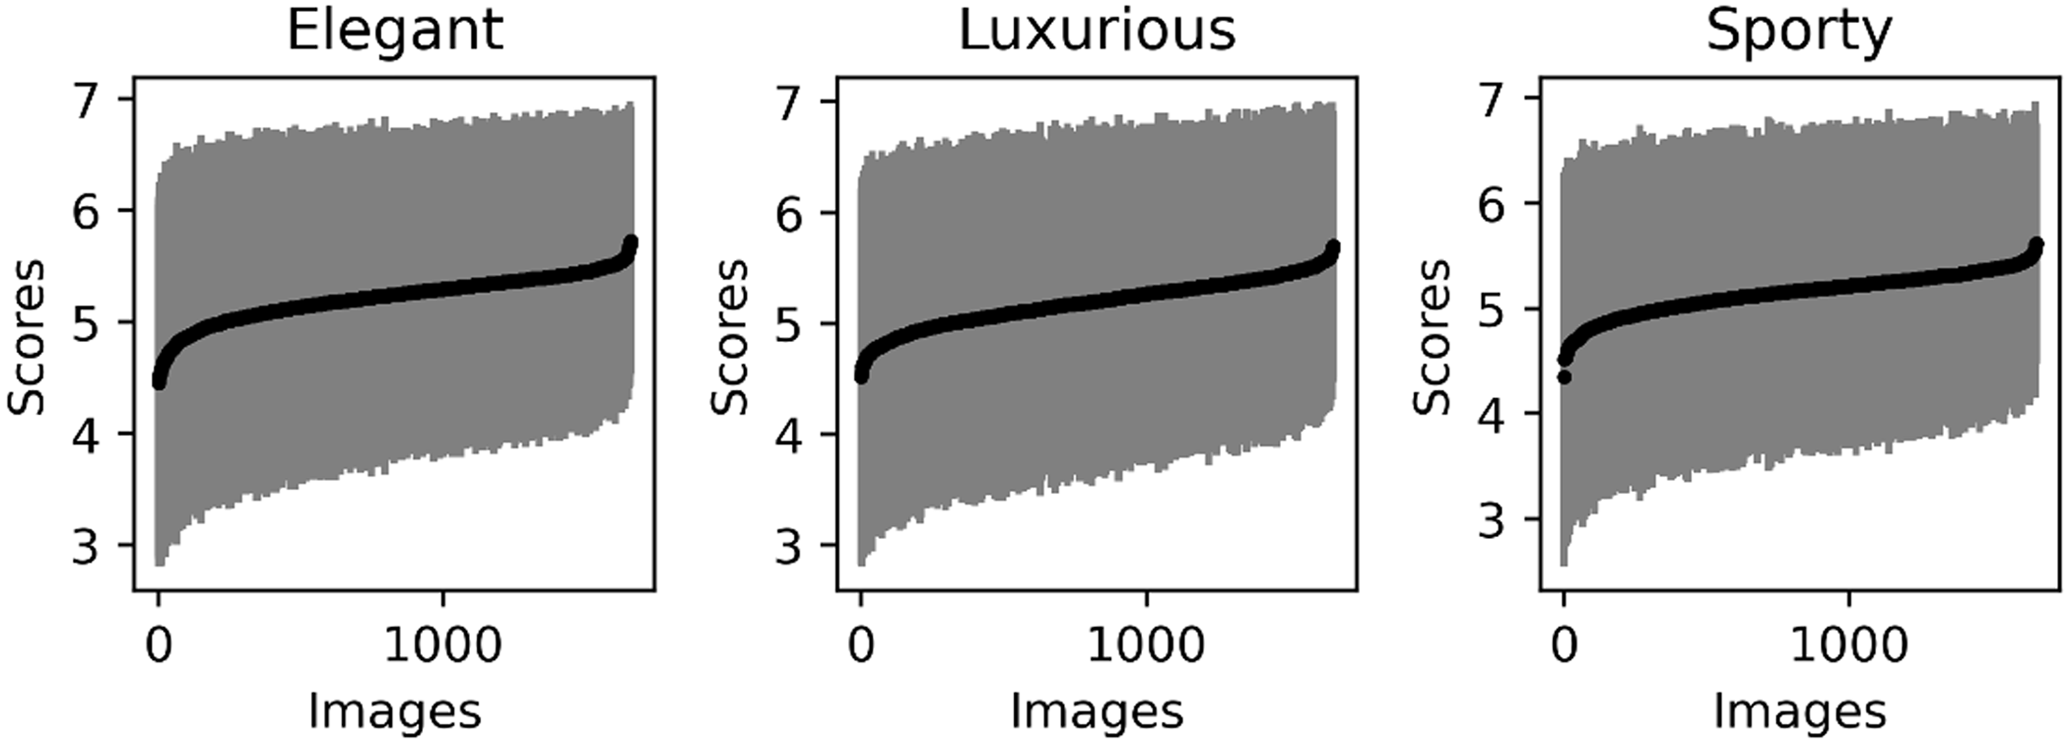
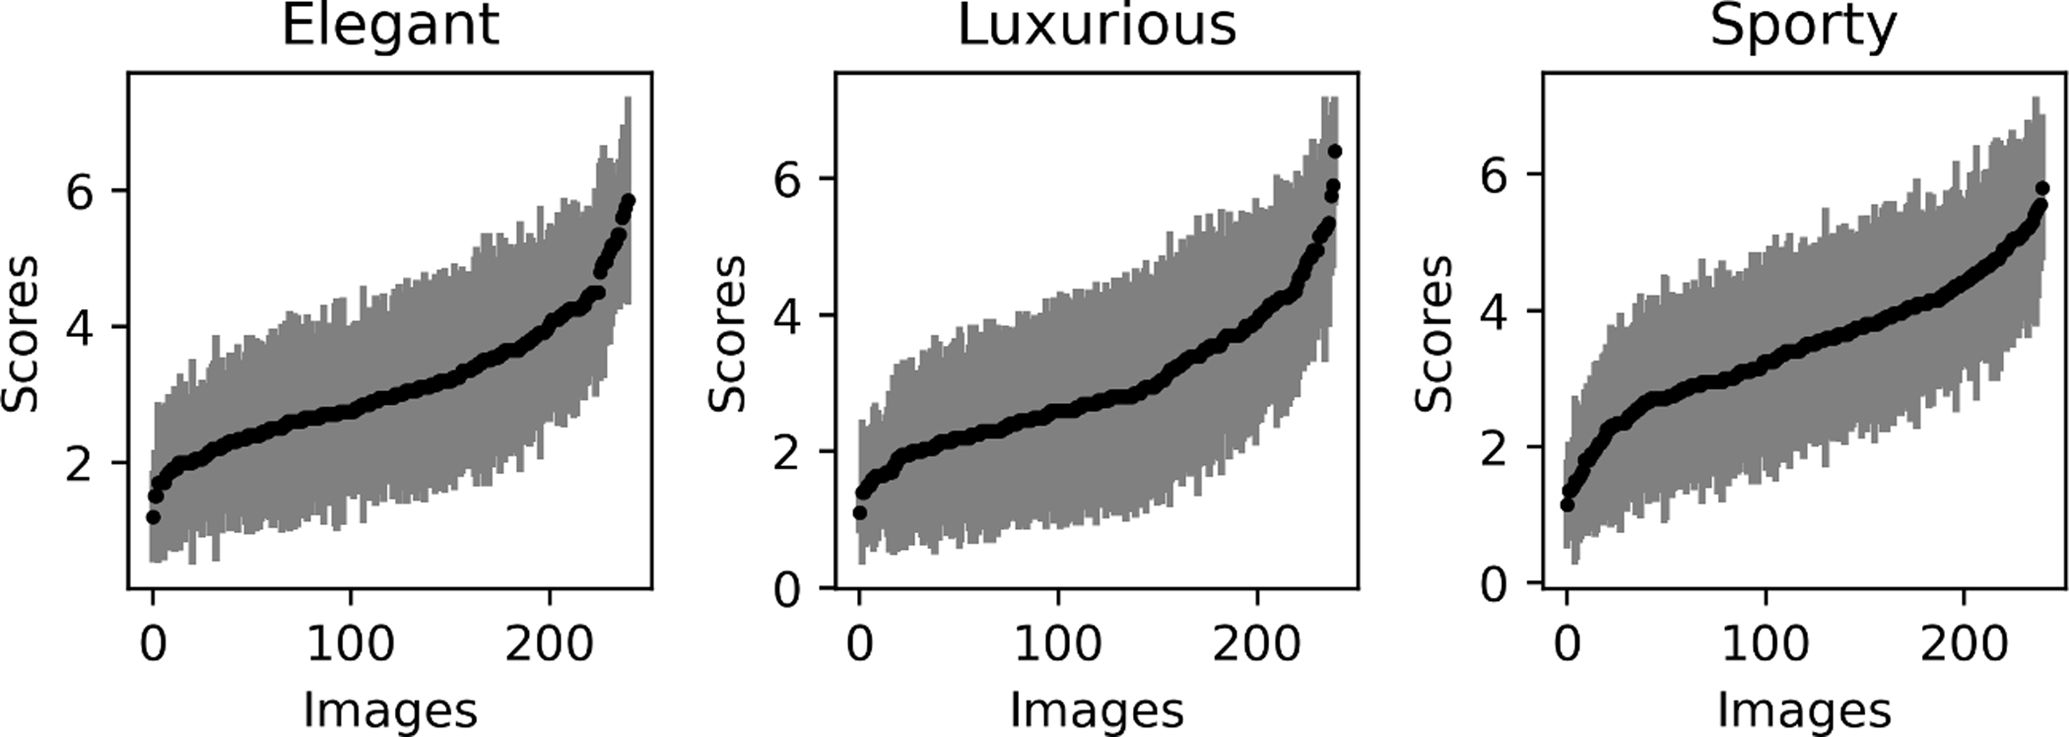
Second, designers used more points to rate the appearance of car wheels than consumers. Figure 2 shows the consumer scores for car wheel appearance, and Figure 3 shows those of the designers. The black circles in each panel indicate the mean score for each image of the car wheel, and the gray bars indicate the standard deviation (SD) of the score. Moreover, the images on the horizontal axis were sorted based on the scores in each panel. There was no significant difference between the mean SDs of scores provided by the consumers (elegance: 1.42, luxury: 1.45, sportiness: 1.42) and designers (elegance: 1.32, luxury: 1.43, sportiness: 1.39); however, the maximum difference in the scores provided by the designers (elegance: 4.65, luxury: 5.30, sportiness: 4.65) was more extensive than that in the scores by the consumers (elegance: 1.28, luxury: 1.18, sportiness: 1.27). This result indicates that difference in consumers’ ratings could be buried in individual differences in ratings, while the designers reflected minor differences in the appearance of the car wheel in the rating more significantly than consumers did.
Scores provided by consumers for images of car wheels

Scores provided by designers for images of car wheels

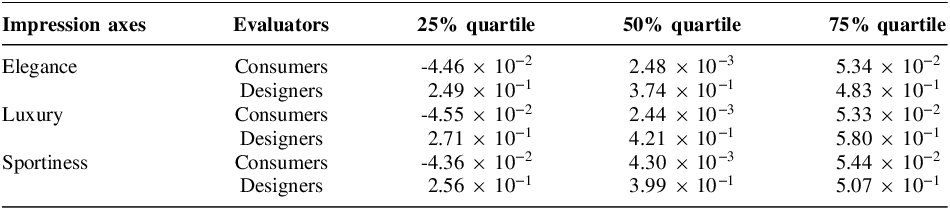
Third, the rating provided by one consumer did not correlate with those provided by other consumers; however, the ratings from the designers had a positive correlation between them. Figure 4 shows the distribution of the correlation coefficients between the scores of every two consumers or designers. In this figure, the left panels show the histograms normalized to integrate the area of the histogram to one, and the right panels show box plots of the distribution. The orange lines in the box plots represent the medians of the distributions. Furthermore, the quartiles of the distributions of the designers’ correlation coefficients were higher than those of the consumers (Table 4). In the two-sided t-test between the correlation coefficients of the scores provided by every two consumers and every two designers, the p-value was 1.24 × 10−67 for elegance, 2.44 × 10−69 for luxury, and 3.51 × 10−65 for sportiness, and Cohen’s d was 3.90 for elegance, 4.54 for luxury, and 4.23 for sportiness. These results show that, unlike designers, consumers do not have any consensus on the relationship between the appearance of car wheels and their impressions.
Finally, a weak positive correlation or no correlation was observed between the car wheel scores provided by the consumers and designers. Figure 5 shows the relationship between consumer and designer scores. In this figure, black circles show the relationship between the mean scores of consumers and designers for 240 images of car wheels evaluated by both consumers and designers, and the red lines denote the linear regression lines between them. The R2 score for the linear regression line was 2.36 × 10⁻² for elegance, 1.06 × 10⁻¹ for luxury, and 1.84 × 10⁻⁴ for sportiness. Additionally, the correlation coefficients between the mean scores provided by the consumers and designers were 1.54 × 10⁻¹ for elegance, 3.25 × 10⁻¹ for luxury, and -1.36 × 10⁻² for sportiness. These results indicate that even average consumers do not share the designers’ consensus on the relationship between their impressions and the visual characteristics of car wheels. In addition, the reason why the correlation coefficient for ratings on sportiness was smaller than those on elegance and luxury could be that sportiness is more strongly affected by the car wheels’ function than other evaluation axes.
Distributions of correlation between scores of every two consumers or designers

Quartile of distributions of correlation between scores of every two consumers or designers

Relationship between the mean scores provided by consumers and designers

3.2. Ratings of car wheels by the CLIP model
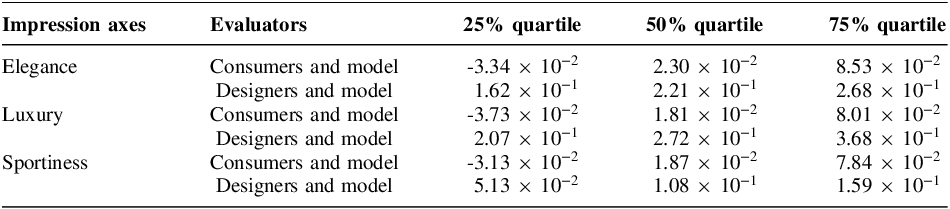
The ratings provided by the CLIP model for car wheel appearance were positively correlated to those by most designers and some consumers. Figure 6 shows the distribution of correlation coefficients between the scores rated by a consumer or designer and the model. In the figure, the left panels show the normalized histograms of the distributions, and the right panels show box plots. The orange lines in the box plots represent the medians of the distributions. In addition, the quartiles of the distribution of the correlation coefficient between consumer or designer evaluations and the CLIP model (Table 5). The correlation coefficients between the designer ratings and model were higher than those between the consumer ratings and model. In the two-sided t-test between the correlation coefficient of scores provided the model and each consumer or designer, the p-value was 3.33 × 10⁻⁸ for elegance, 5.09 × 10⁻⁸ for luxury, and 2.12 × 10⁻³ for sportiness, and Cohen’s d was 1.71 for elegance, 2.26 for luxury, and 6.95 × 10⁻¹ for sportiness. These results show that the CLIP model shares a consensus on the relationship between the visual characteristics of car wheels and the impressions with most designers and some consumers, contrary to our hypothesis.
Distributions of correlation between evaluations by a consumer or designer and CLIP model

Quartile distributions of correlation between evaluations made by a consumer or designer and CLIP model

Figure 7 shows the relationship between the scores provided by the model and the mean scores by the consumers or designers. In each panel, the red line represents the linear regression line between the mean scores provided by the model and consumers, and the blue line represents the linear regression line between the mean scores provided the model and designers. The correlation coefficients between the model’s evaluation and the mean evaluation by the designers were 3.67 × 10⁻¹ (elegance), 3.87 × 10⁻¹ (luxury), and 1.44 × 10⁻¹ (sporty). On the other hand, the correlation coefficients between the model’s and mean consumers’ evaluations are 2.25 × 10⁻¹ (elegance), 2.56 × 10⁻¹ (luxury), and 2.07 × 10⁻¹ (sporty). In addition, the R2 scores of the relationship between the scores of the model and the mean score of consumers were 5.08 × 10⁻² for elegance, 6.56 × 10⁻² for luxury, and 4.32 × 10⁻² for sportiness. Contrarily, the R2 scores of the relationship between the scores of the model and the mean score of designers were 1.35 × 10⁻¹ for elegance, 1.50 × 10⁻¹ for luxury, and 2.08 × 10⁻¹ for sportiness. This result implies that the model can rate the appearance of car wheels more similarly to designers than to consumers.
Mean score by consumers or designers and CLIP model

4. Discussion
In this study, we compared the ratings provided by consumers, designers, and the CLIP model in terms of the visual impressions of car wheels, to test the hypothesis that large-scale multimodal foundation models can estimate consumers’ visual impressions of products but not those of designers. However, the models’ visual impression scores for car wheels were positively correlated with those of most designers and some consumers (Figure 6). Moreover, the score of the model had a stronger correlation with the mean score of the designers than with that of the consumers (Figure 7). These results suggest that the model could have tastes and preferences in terms of car wheel appearance that are more similar to those of designers than consumers, which is contrary to our hypothesis.
The source of the training dataset used for the CLIP model may explain these unexpected results. The CLIP model was pre-trained with numerous pairs of images and text sourced from the internet; therefore, we hypothesized that the model would have an average sense for general consumers. However, content regarding the visual impressions of certain products on the internet includes advertisements by manufacturers or sellers, reviews of the products by professional reviewers, and reviews written by the owners of the products themselves. Additionally, owners who write reviews can have stronger opinions on products than general consumers who may not own the products. Therefore, the average sense of the visual impression of products obtained from the internet may be more similar to the average designer’s sense than that of general consumers with various preferences. Therefore, we can use large-scale foundation multimodal models to estimate the visual impressions of consumers who have opinions about product appearance. However, this cannot be applied to predict the visual impressions of consumers who are not interested in appearance.
Is it possible to predict consumer visual impressions of a product? This study showed that there was no correlation between consumers’ ratings of the visual impressions of car wheels (Figure 4). Therefore, consumers do not have a consensus on the relationship between the visual characteristics of car wheels and impressions. Consequently, it is difficult to predict general consumer visual impressions of products because of their various tastes and preferences. However, do the designers need to predict the visual impressions of all consumers, including those not interested in the products? This study suggests that designers can use the multimodal model to estimate the visual impressions of consumers who are interested in the visual design of the products. If the designers want to have the products reach the people who are not interested in the products so far, fine-tuning models on small datasets from a survey of target consumers could be effective in applying models to them.
5. Conclusion
In this study, we tested the hypothesis that the ratings provided by the CLIP model on product appearance are more similar to those of consumers than to designers. This study showed that the CLIP model can estimate designers’ visual impressions of products better than general consumers, which is contrary to our hypothesis. Second, the results indicate that general consumers do not share any consensus on the relationship between the visual characteristics of products and their impressions.


 Open access