


Introduction
The natural luminescence of samples enriched in K-feldspar is increasingly used for dating (Brill et al., Reference Brill, Reimann, Wallinga, May, Engel, Riedesel and Brückner2018; Buylaert et al., Reference Buylaert, Huot, Murray and Van Den Haute2011b; Reimann et al., Reference Reimann, Thomsen, Jain, Murray and Frechen2012; Zhang et al., Reference Zhang, Zhao, Sheng, Zhang, Zhang, Sun, Wang, Huang, Hou and Chen2022) and tracing (Bonnet et al., Reference Bonnet, Reimann, Wallinga, Lague, Davy and Lacoste2019; Guyez et al., Reference Guyez, Bonnet, Reimann, Carretier and Wallinga2023; McGuire & Rhodes, Reference McGuire and Rhodes2015; Reimann et al., Reference Reimann, Notenboom, De Schipper and Wallinga2015; Rhodes & Leathard, Reference Rhodes and Leathard2022) of sand-sized sediment particles. The infrared-stimulated luminescence (IRSL) and post-IR IRSL (pIRIR) signals of K-feldspar (Thomsen et al., Reference Thomsen, Murray, Jain and Bøtter-Jensen2008) have several advantages over the blue-stimulated luminescence signal of quartz minerals (Zhang & Li, Reference Zhang and Li2020): (1) they saturate at higher dose; (2) they tend to have a higher signal intensity; and (3) the resulting age is less susceptible to changes in environmental dose rate due to internal dosing from K.
Many applications of K-feldspar dating and tracing focus on water-transported sediments originating from fluvial (Guyez et al., Reference Guyez, Bonnet, Reimann, Carretier and Wallinga2022, Reference Guyez, Bonnet, Reimann, Carretier and Wallinga2023; McGuire & Rhodes, Reference McGuire and Rhodes2015; Nian et al., Reference Nian, Bailey and Zhou2012), marine (Brill et al., Reference Brill, Reimann, Wallinga, May, Engel, Riedesel and Brückner2018; Reimann et al., Reference Reimann, Notenboom, De Schipper and Wallinga2015; Riedesel et al., Reference Riedesel, Brill, Roberts, Duller, Garrett, Zander, King, Tamura, Burow and Cunningham2018), alluvial (Rhodes, Reference Rhodes2015) or lacustrine (Roder et al., Reference Roder, Lawson, Rhodes, Dolan, McAuliffe and McGill2012) environments. These approaches thus rely on subaqueous bleaching of the signal(s) of interest. For dating studies, signals of interest need to be adequately reset in all grains, or well-bleached grains need to be identified using small aliquot or single-grain equivalent dose distributions and appropriate statistical approaches (Brill et al., Reference Brill, Reimann, Wallinga, May, Engel, Riedesel and Brückner2018; Madsen et al., Reference Madsen, Murray, Andersen and Pejrup2007; Mauz et al., Reference Mauz, Baeteman, Bungenstock and Plater2010). Tracing studies employ differences in bleaching between grains/aliquots or between different signals arising from the same grains/aliquots to infer sediment sources and pathways (Chamberlain et al., Reference Chamberlain, Wallinga, Reimann, Goodbred, Steckler, Shen and Sincavage2017; de Boer et al., Reference de Boer, Schwanghart, Mey, Adhikari and Reimann2024; Guyez et al., Reference Guyez, Bonnet, Reimann, Carretier and Wallinga2022; Rhodes & Leathard, Reference Rhodes and Leathard2022). To further develop such applications, detailed quantitative information on subaqueous bleaching of various luminescence signals is crucial.
Feldspar luminescence signals bleach at a broad range of wavelengths (Spooner, Reference Spooner1994a). In nature, grains are exposed to varying light intensities, depending on their physical environment. The light spectrum from the sun at the Earth’s surface is further attenuated in water by a variety of factors, like chlorophyll a and suspended solids (Gallegos & Moore, Reference Gallegos and Moore2000). Therefore, subaqueous bleaching of luminescence signals is slower than subaerial bleaching. In seas and rivers, shorter wavelengths were found to attenuate more quickly (Ditlefsen & Huntley, Reference Ditlefsen and Huntley1994). Other studies focus on simulating specific physical parameters that affect bleaching, like turbidity for varying sediment suspensions (Ditlefsen, Reference Ditlefsen1992; Mey et al., Reference Mey, Schwanghart, de Boer and Reimann2023).
Various (laboratory) experiments under controlled conditions have been conducted to show the differential bleaching of quartz (Godfrey-Smith et al., Reference Godfrey-Smith, Huntley and Chen1988; Mey et al., Reference Mey, Schwanghart, de Boer and Reimann2023; Spooner, Reference Spooner1994b) and a multitude of feldspar signals (Cheng et al., Reference Cheng, Zhang, Zhao, Yang and Li2022; Colarossi et al., Reference Colarossi, Duller, Roberts, Tooth and Lyons2015; Kars et al., Reference Kars, Reimann, Ankjærgaard and Wallinga2014; Zhang et al., Reference Zhang, Guralnik, Tsukamoto, Ankjærgaard and Reimann2023). Results show that pIRIR signals potentially have non-bleachable components (Brill et al., Reference Brill, Reimann, Wallinga, May, Engel, Riedesel and Brückner2018; Zhang et al., Reference Zhang, Guralnik, Tsukamoto, Ankjærgaard and Reimann2023). The magnitude of the non-bleachable component is positively correlated with preheat and/or stimulation temperature (Kars et al., Reference Kars, Reimann, Ankjærgaard and Wallinga2014; Zhang et al., Reference Zhang, Guralnik, Tsukamoto, Ankjærgaard and Reimann2023). Grain-to-grain variations in bleachability (Choi et al., Reference Choi, Chamberlain and Wallinga2024) can lead to different extents of residual doses and may induce overestimation and larger overdispersion (OD) in equivalent dose (D e) distributions (Cheng et al., Reference Cheng, Zhang, Zhao, Yang and Li2022).
Environmental in situ bleaching experiments studied the effects of subaqueous light exposure on several luminescence signals for fluvial environments (Berger & Luternauer, Reference Berger and Luternauer1987; Godfrey-Smith et al., Reference Godfrey-Smith, Huntley and Chen1988; Sanderson et al., Reference Sanderson, Bishop, Stark, Alexander and Penny2007). Godfrey-Smith et al. (Reference Godfrey-Smith, Huntley and Chen1988) showed that the optically stimulated luminescence (OSL) signal in quartz and IRSL signal in feldspar reset more readily than the thermoluminescence signals of both minerals. They also showed that the quartz OSL signal resets more rapidly than feldspar IRSL signals do. Wallinga (Reference Wallinga2002) combined light spectra information from a turbid river (Berger & Luternauer, Reference Berger and Luternauer1987) with bleaching efficiency data of quartz (Spooner, Reference Spooner1994b) and feldspar (Spooner, Reference Spooner1994a) signals. The data from these studies suggest that feldspar signals potentially reset more readily than quartz signals in turbid environments (Wallinga, Reference Wallinga2002).
Building on this review of relevant literature, we identify three knowledge gaps on subaqueous bleaching of K-feldspar luminescence signals: (1) the bleaching potential, that is, the light intensity and spectrum as a function of depth; (2) the bleaching efficiency, that is, the efficiency by which varying luminescence signals bleach subaqueous; and (3) the combined effect of bleaching potential and bleaching efficiency on the resetting of IRSL and pIRIR signals underwater. In this study, we experimentally quantify subaqueous bleaching of IRSL and pIRIR signals of K-feldspar extracts in natural light conditions in the Dutch Wadden Sea. We aim to (1) quantify light intensity and spectrum as a function of time of day, depth and tidal stage and (2) quantify the bleaching of IRSL and several pIRIR signals following a full day of light exposure at the surface and at different inundation depths. Our full dataset provides quantitative insight in the relationship between cumulative light exposure and the degree of bleaching for a variety of signals. Such understanding is crucial for dating water lain deposits and for further developing tracing applications based on K-feldspar luminescence signals.
Methods and materials
Site and samples
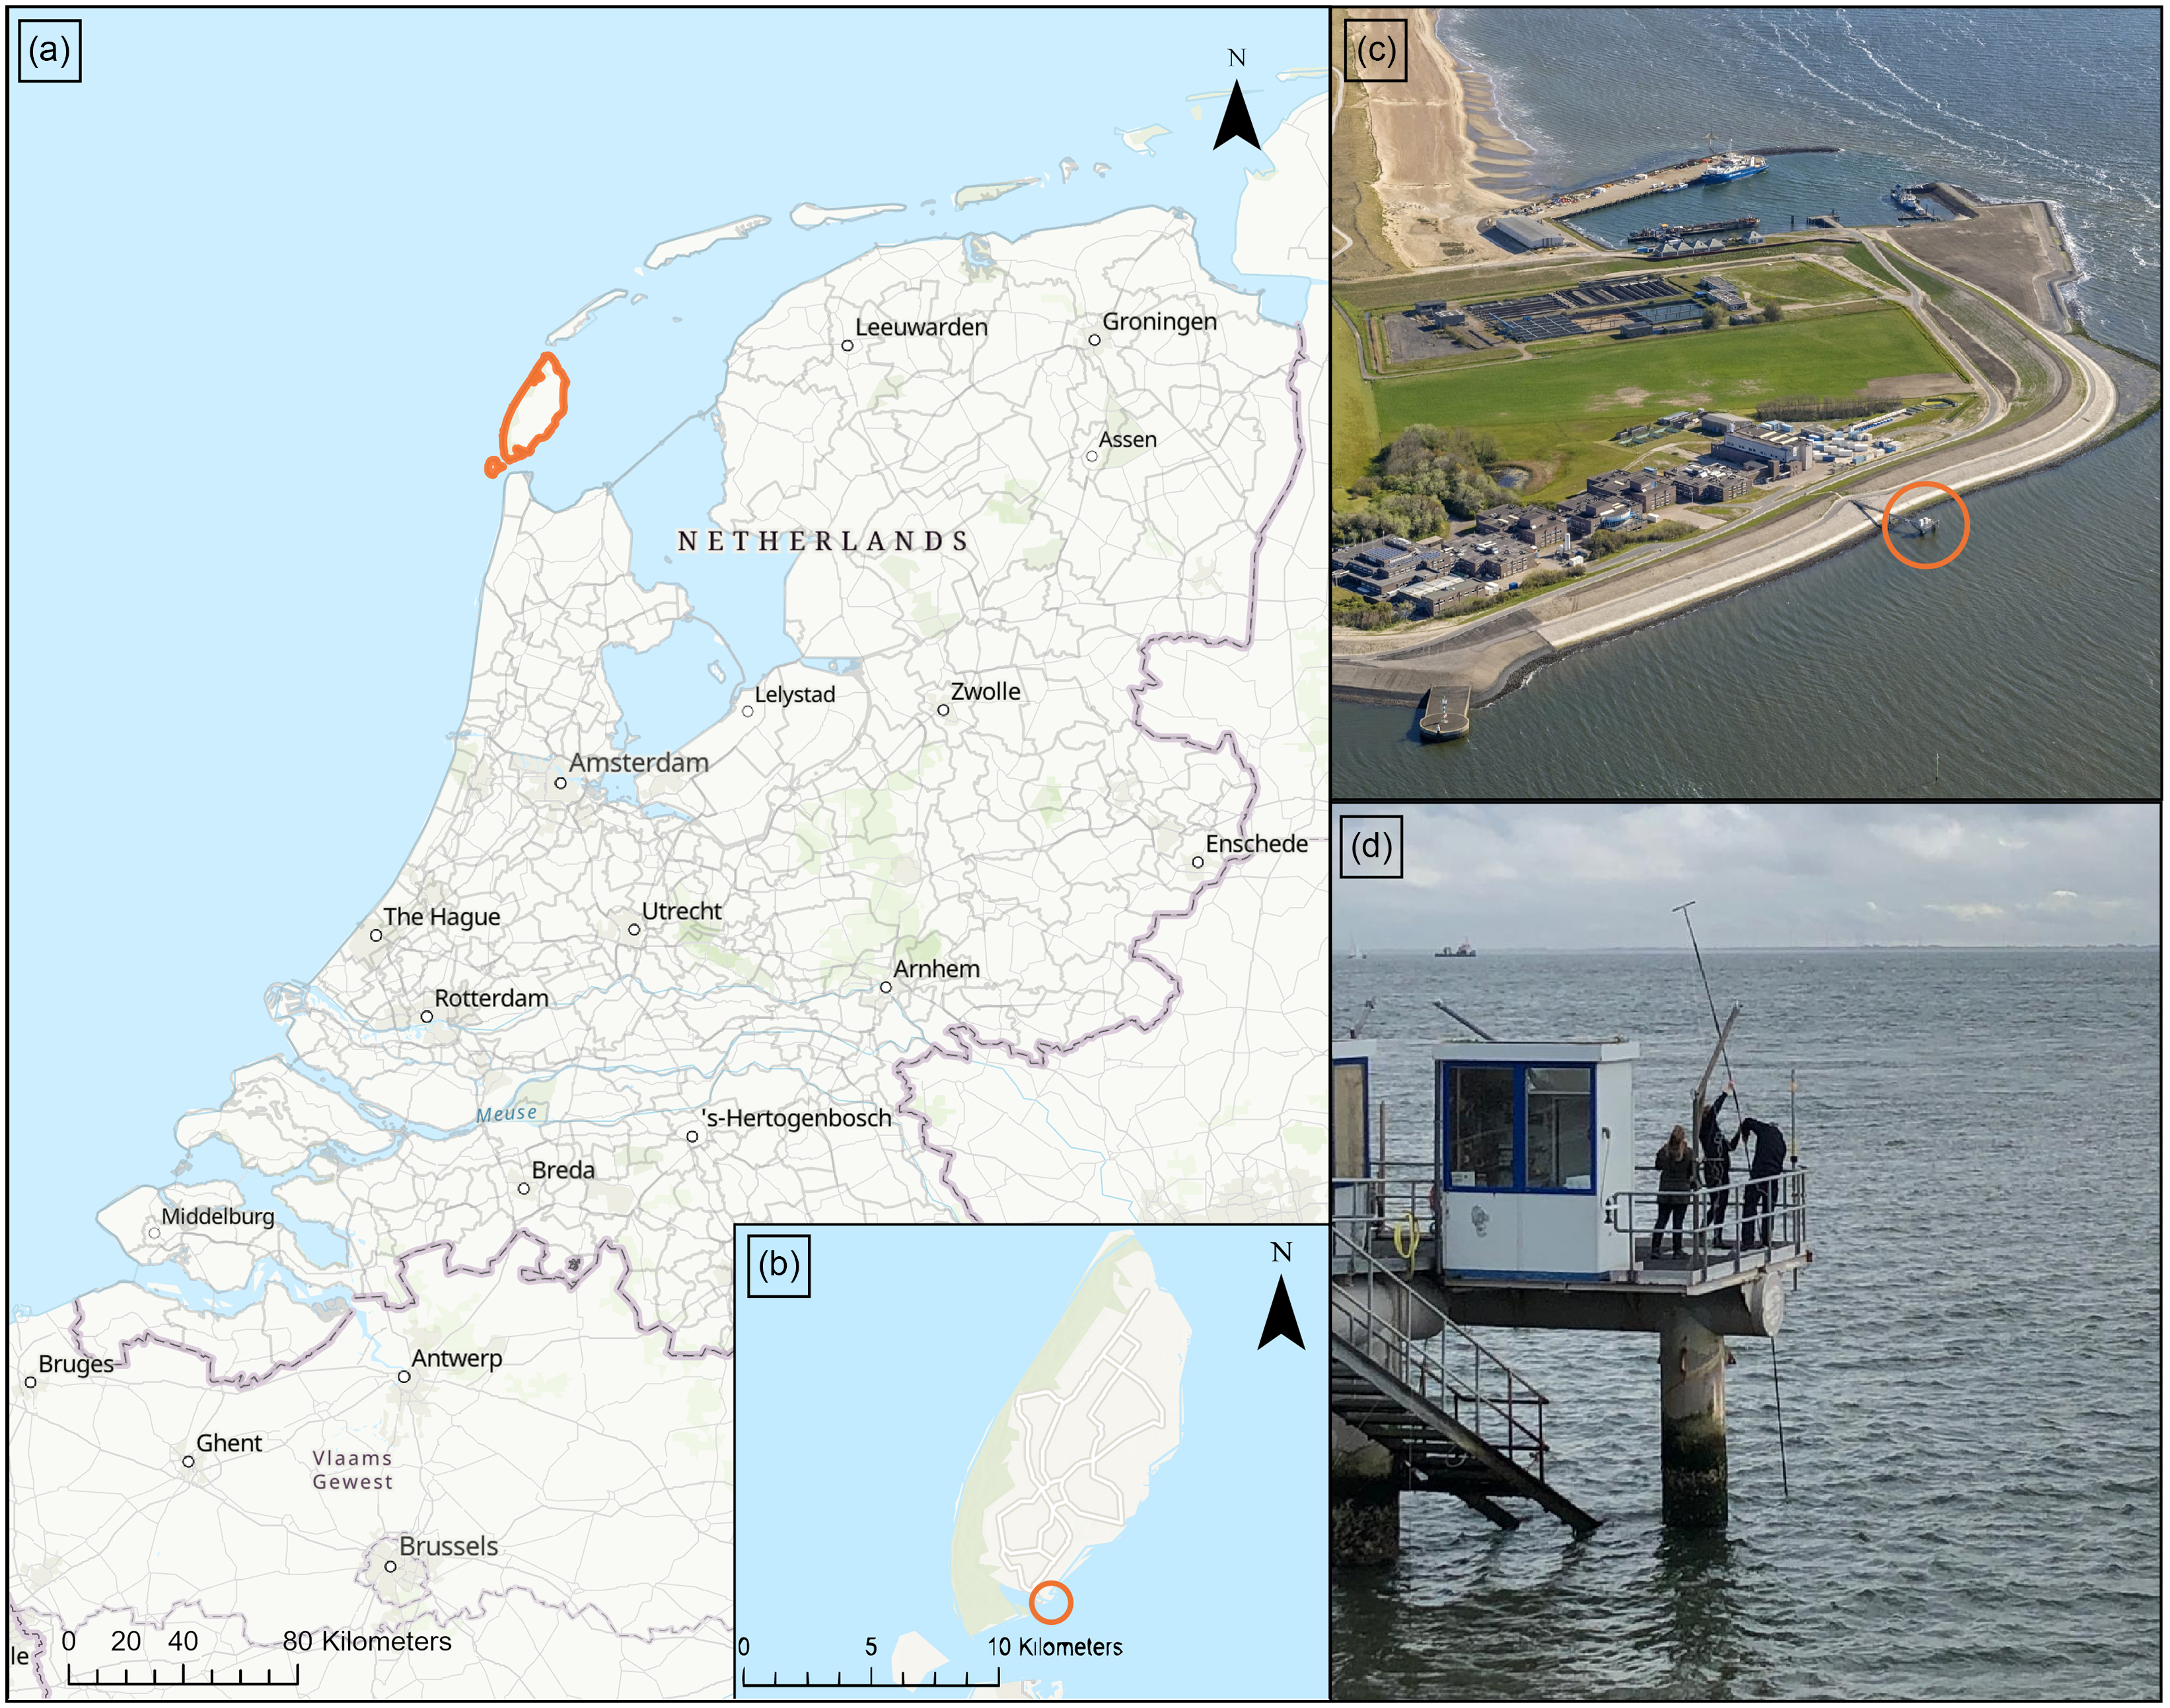
We performed our experiment at the jetty of the Royal Netherlands Institute for Sea Research (NIOZ) on the Dutch Wadden Sea island Texel (N 53°00′06.5″ E 4°47′20.4′ WGS84) on the 26th of October of 2022 (Figure 1). This jetty extends 45 m into the Marsdiep basin, the westernmost tidal inlet of the Dutch Wadden Sea, and has a working platform of 3 by 10 m. Weather on the day of the experiment was cloudy, but there was no precipitation. The average wind speed was 18 kts, and there were gusts with a maximum of 28 kts coming from the southeast. The wave direction was eastward (offshore) (KNMI, 2024). The wave height varied between 0.5 and 0.7 m, with higher waves in the late afternoon as measured in situ every 10 minutes by the KNMI (the Royal Netherlands Meteorological Institute). The wave period was on average 3.5 s. The tidal level varied between +85 cm at 09:21 AM CEST and −80 cm at 03:38 PM CEST (Rijkswaterstaat, 2024), and the reference elevation is +0 cm NAP (Amsterdam Ordnance Datum). A long-term overview of suspended sediment fluxes in the Marsdiep has been reported by Nauw et al. (Reference Nauw, Merckelbach, Ridderinkhof and van Aken2014).
(a) Map of the Netherlands showing the location of the Island of Texel (orange outline). (b) Map of Texel showing the location of the NIOZ jetty (orange circle). (c) Bird’s-eye picture of NIOZ showing the jetty (orange circle). Picture source: NIOZ. (d) Picture of the instalment of the pole set-up from the jetty platform into the Wadden Sea. Picture source: own archive. Map sources: Esri base map (Esri et al., 2024).
The sediment samples used in this experiment were collected in the tidal basin of Ameland in the Dutch Wadden Sea in April 2021. The samples are part of a wider study into luminescence tracing of nourishment sand (de Boer et al., Reference de Boer, Wallinga and Chamberlain2021). NIOZ provided crew, boxcore coring equipment and ship time on the ship R.V. Navicula; luminescence samples were retrieved from these boxcores by pushing a PVC tube horizontally into the core. For this experiment, we selected three recent tidal deposit samples taken at a depth of approximately −2 m NAP: NCL-1521068 (N 53°26′1.2012″ E 5°33′46.1988″ WGS84), NCL-1521069 (N 53°24′56.4012″ E 5°34′41.9988″ WGS84) and NCL-1521070 (N 53°23′51″ E 5°34′41.9988″ WGS84). The material from these three samples was mixed and then subdivided and packed into multiple smaller subsamples for use in the experiment described in section ‘Experimental set-up’ Before mixing, all three samples were prepared at the Netherlands Centre for Luminescence dating (NCL) under amber light conditions. Sediment for the experiment was extracted from the inner portion of each tube. This material was wet-sieved to obtain a grain-size range of 212–250 μm. Carbonates were removed by adding a 10% HCl solution; subsequently, organic matter was removed with a 10% H2O2 solution. A K-feldspar-rich fraction was obtained through density separation by using a separating funnel and LST fastfloat © with a density of 2.58 g/cm3. The remaining feldspar fraction was cleaned with demineralised water and dried in the oven at 50°C overnight. No HF etching was performed.
Given the recent tidal depositional environment of our samples, heterogeneous bleaching of the individual grains within samples was expected. To facilitate the interpretation of results, we chose to bleach and irradiate the samples so all grains would have a similar starting equivalent dose. Therefore, the prepared K-feldspar fraction was bleached in a Hönle SOL2 solar simulator for 4 days. Then, the grains from the three samples were mixed and sent to DTU Risø in Denmark, where they received a fixed dose of radiation. The first irradiation attempt went wrong, therefore the grains were zeroed and irradiated anew. On the 19th of October 2022 a Cobalt ring source, with a dose rate of 2.01 Gy/min, dosed the samples for 7 minutes and 1 s up to 14.21 ± 0.1 Gy. Part of the returned sample (0.52 g) was kept separate for analysis of the starting dose (this is the control sample), while the rest of the irradiated feldspar was distributed into multiple subsamples of ∼0.18 g feldspar for the bleaching experiment (Figure 2). Evaluation of the starting dose on 600 grains showed that laboratory bleaching and dosing did not provide the preferred homogeneous starting dose (see section ‘Sample characterisation’).
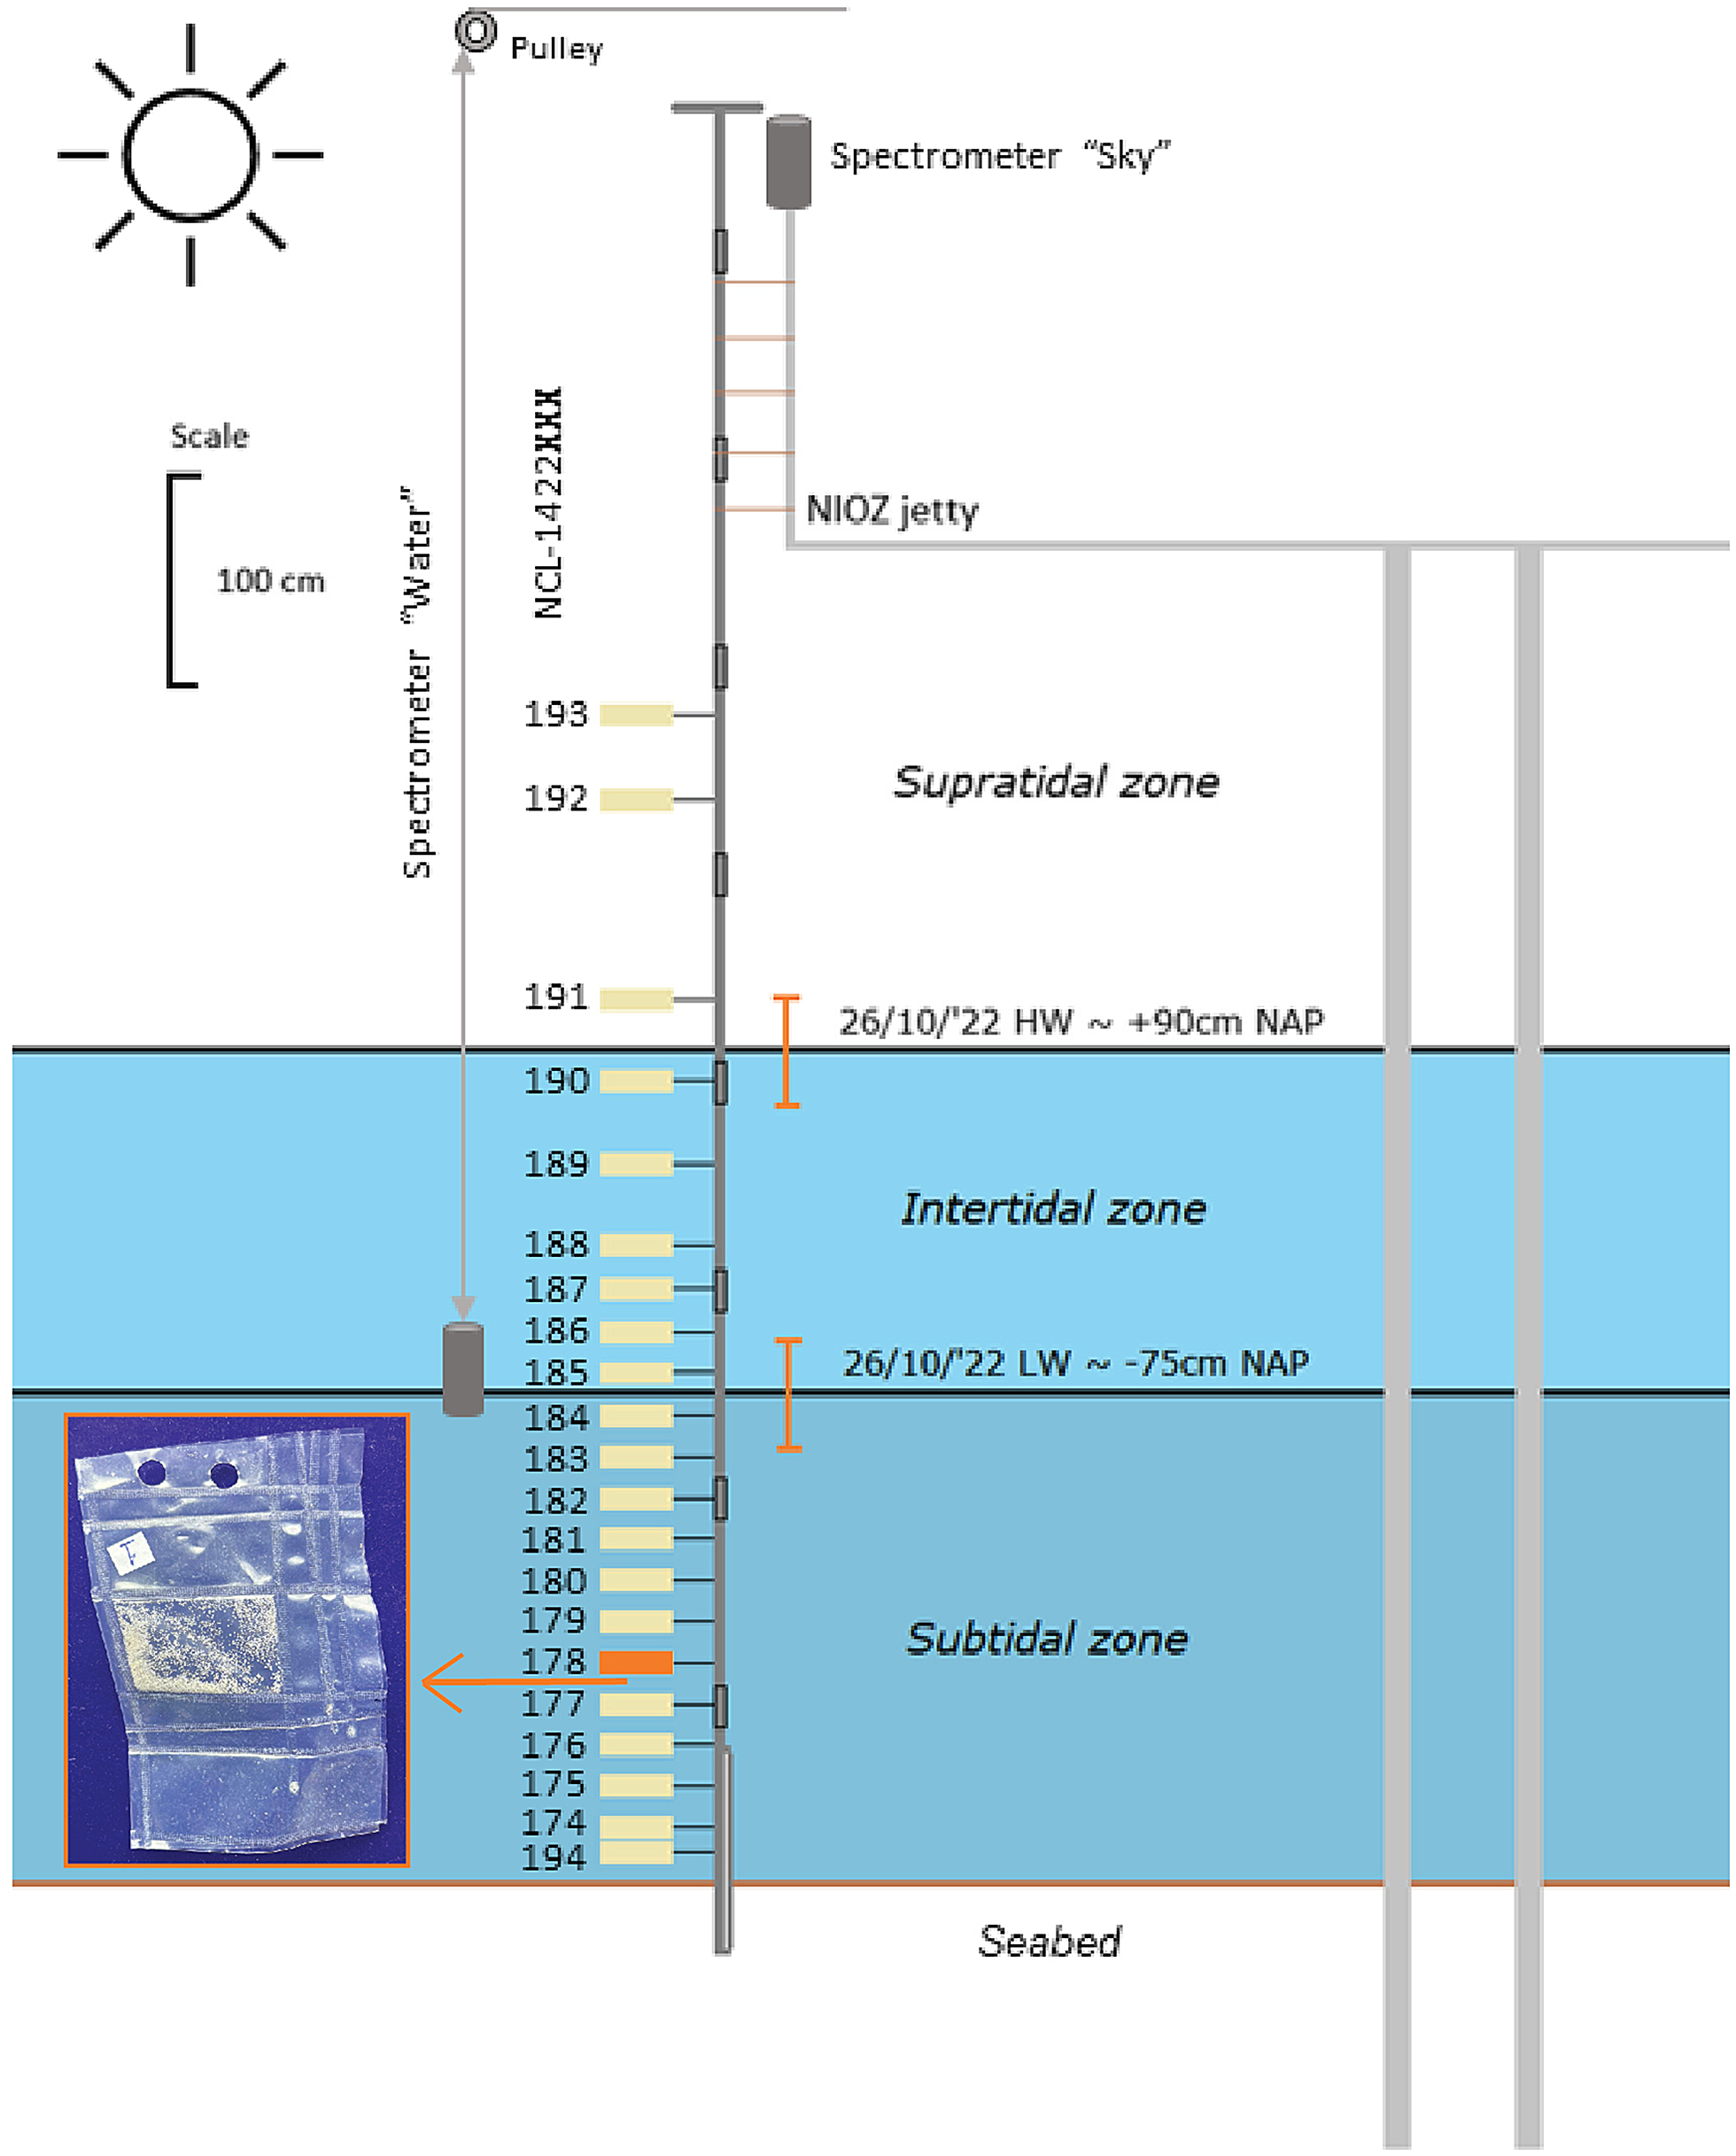
A vertically scaled drawing of the experiment set-up. The size of the samples is exaggerated for visibility. The highest water level (HW) and lowest water level (LW) are indicated with black vertical lines. The orange error bars indicate the mean wave height surrounding these water levels. The picture in the inset shows a sample package made from ETFE foil (9 × 6 cm).
Experimental set-up
We deployed a full-day experiment, from dawn at 07:00 AM till dusk at 08:30 PM. Sunrise took place at 08:25 AM and sunset at 06:21 PM. Throughout the day we, monitored the natural light intensity and spectra with two spectrometers. One spectrometer registered the incoming subaerial light, to monitor the irradiance boundary conditions during the bleaching experiment. The other spectrometer was used to measure light intensity and spectrum at different depths underwater. Details are provided in section ‘Light spectrum measurements’.
To expose K-feldspar grains to light above and below water, we sealed ethylene tetrafluoroethylene (ETFE) foil into waterproof packages (Inset Figure 2) and inserted the sand grains (∼0.18 g) with a thin paper funnel. By using an Ocean Insight Flame spectrometer and the OceanArt software, it was verified that ETFE foil transmits most of the natural light, in contrast to other materials like glass or plastic petri dish or FEP tape (Supplement 1). ETFE foil is durable, strong and flexible, which allowed us to create a monolayer of sand grains within the packages. The sample packages were fixed to the pole with zip ties; no packages were lost during experiment deployment.
The packaged feldspar samples with a known mean dose (see section ‘Site and samples’ and ‘Equivalent dose distributions’) were attached at different heights to a fixed pole. This pole consisted of a soil auger handle, seven extension parts and an auger gouge at the bottom for securing it approximately 40 cm into the seabed. In total, 21 sample packages were attached to the pole at different positions relative to the seabed (Figure 2, Supplement 2). Twelve samples were located in the subtidal zone and therefore stayed subaqueous throughout the bleaching experiment. Six samples were in the intertidal zone and therefore alternately exposed to subaqueous and subaerial spectra depending on the tidal stage. The remaining three samples were placed in the supratidal zone and thus exposed to subaerial natural light throughout the whole experiment. This set-up with varying inundation depth depending on the tide conceptually approximates the natural light exposure experienced by sand grains at the sediment-water interface of tidal flats and tidal creeks for the weather and timescale of our experiment.
Light spectrum measurements
Two TriOS RAMSES SAMIP ACC-2 VIS spectrometers, with a spectral wavelength range between 320 and 950 nm, were used to monitor the light spectra at the surface and below water. The subaqueous spectrometer was attached to a sturdy frame and moved up and down the water column with the help of a pulley (Figure 2) to measure the subaqueous light penetration. Inundation depth was monitored using a pressure sensor. The other spectrometer was attached to the jetty and measured the subaerial light conditions. Both spectrometers faced upwards and were read out simultaneously.
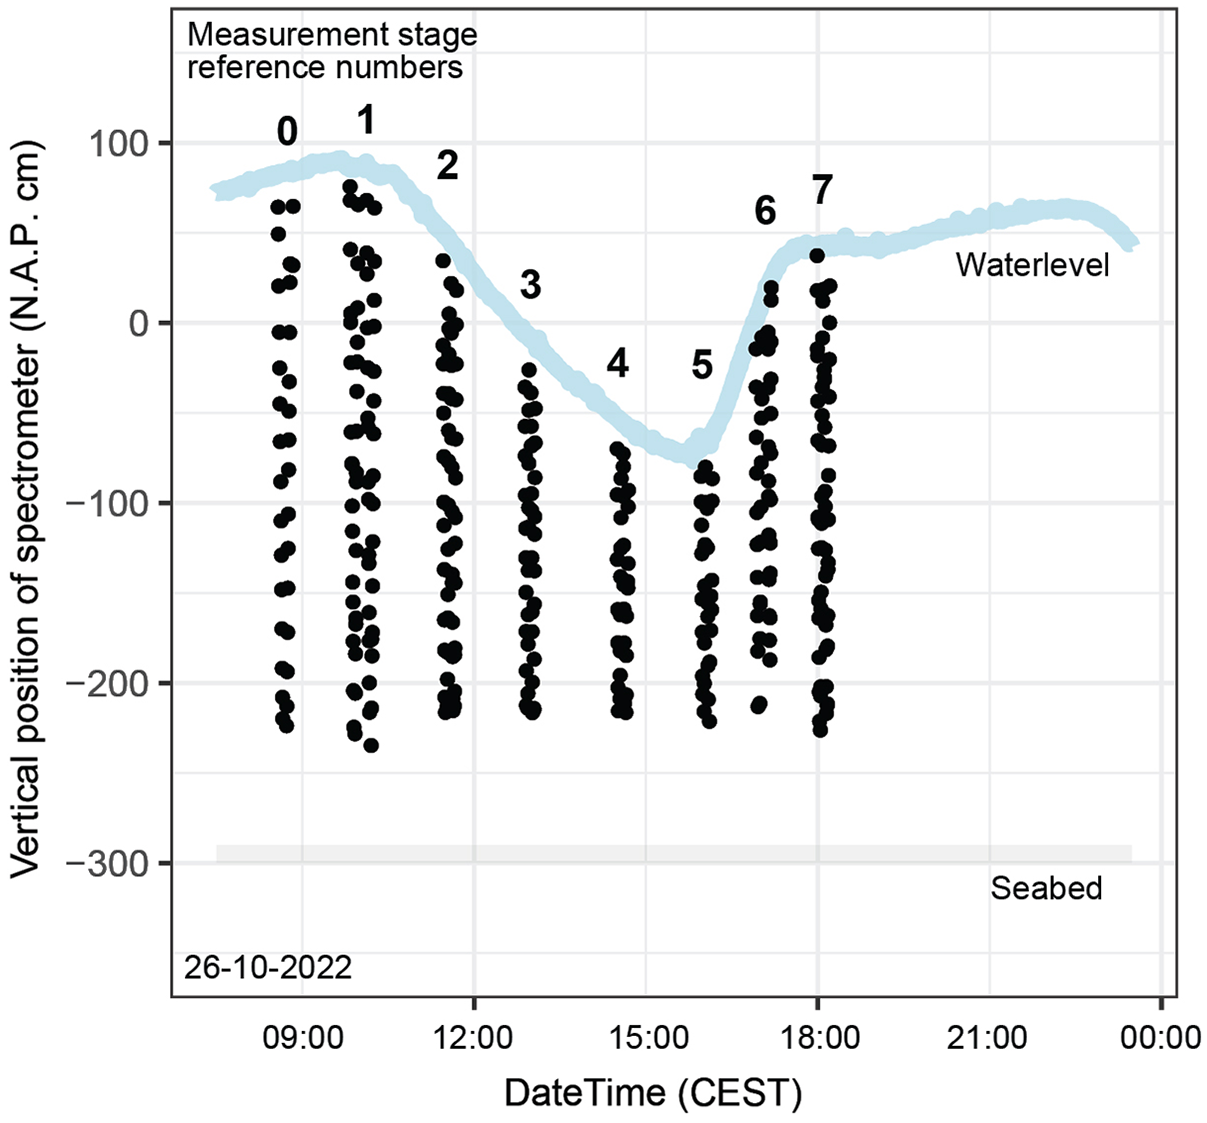
Light spectrum measurements were carried out by lowering the frame to the seabed and raising it again; at predefined depths (spaced 20 cm apart), the frame was stopped, and a measurement was initiated within the TriOS software environment. Measurements were executed during seven measurement stages (S1–S7) throughout the day, with a test moment (S0) beforehand (Figure 3). During every stage except S0, the frame was lowered and raised twice in a time span of about 15 minutes. Towards the end of the day, the depth intervals became greater than the desired 20 cm due to rougher wave conditions. A field form was used to collect observations and metadata, including time, weather, wave conditions and sample depth. In total, 371 subaqueous and 371 subaerial spectrometer measurements were made throughout the day.
Timing (CEST) and position (cm NAP (Amsterdam Ordnance Datum)) of spectrometer measurements. The numbers represent the measurement stage (S) of the spectrometer profiles as introduced in section ‘Light spectrum measurements’. Source of water level data: https://www.nioz.nl/en/research/dataportal/research-visuals/jetty-measurements/jetty-water-level consulted on 26 October 2022.
The depth of each subaqueous spectrometer measurement was calculated from the pressure data simultaneously recorded with the light spectra, assuming an average sea-water density of 1023.6 kg/m3. Water-level measurements at second resolution relative to NAP taken at the NIOZ jetty were obtained from the NIOZ website. These were averaged to minute resolution to avoid scatter caused by waves. From this smoothened water level curve and the calculated sample depths, the vertical position of each measurement relative to NAP could be calculated.
All measurements made with the second (submerged) spectrometer with a calculated inundation depth of <0.05 m were filtered out, leaving 345 subaqueous measurements that were used in this analysis. Each measurement consists of 631 data points (320-950 nm) in mW/(m2 nm). In the outer parts of the wavelength range, increasing noise was observed due to low light intensity. Therefore, the integration interval was limited to the 350–900 nm range to exclude the noisy ultraviolet (UV) and NIR data.
To obtain the total energy per measured spectrum (in mW/m2), we integrated data over the whole wavelength spectrum, that is, the area below the curve of each light spectrum. The cumulative light exposure for each of the sample positions during the day was obtained through the following steps: (1) the integrated light intensity in mW/m2 was averaged over the measurements made at a specific depth interval in a measurement stage; (2) this averaged and integrated light intensity was multiplied by the time interval between measurement stages; and (3) the integrated light exposure for different stages was added up to obtain the total cumulative light energy in J/m2 that a sample received over the day. All analyses were performed within the R environment (see code and data availability section).
Luminescence measurement protocol
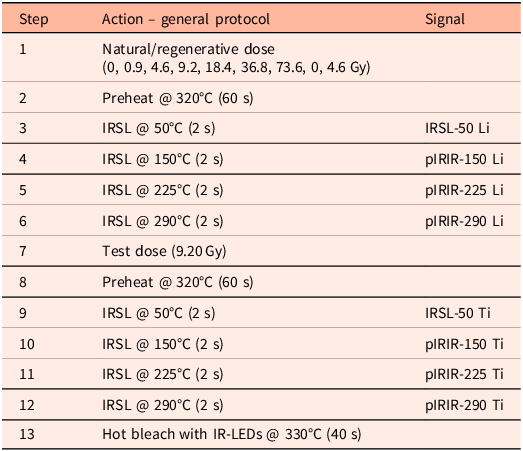
All measurements were performed on an automated Risø TL/OSL-DA-15 reader with a single-grain attachment with an IR laser. A LOT/ORIEL D410/30 nm interference filter was used to target the 410 nm peak emission of K-feldspar (Huntley et al., Reference Huntley, Godfrey-Smith and Haskell1991). A fading test was not performed; potential fading effects are normalised as we present the results of light-exposed samples to non-exposed reference material that was dosed simultaneously. We used a multiple-elevated-temperature (MET) pIRIR measurement protocol (Table 1) (Li & Li, Reference Li and Li2011). Sixty datapoints were read out in 2 s (0.033 s per datapoint), of which 50 datapoints were collected during stimulation. For each sample, three full single-grain discs were measured. Assuming that all positions are filled, this amounts to 300 grains. Visual inspection indicated that not all positions were filled, and we estimate that about 250 grains were measured for each sample.
Adopted MET-pIRIR measurement protocol
The measured data were analysed within the R environment (see code and data availability section). Channels 6 up to 8 (0.099 s) were taken as initial integration limits; the background limits were set at channel 40 up to 50 (0.363 s) (Figure 6). An exponential fit was used for dose-response curve fitting. Rejection criteria (recycling ratio, recuperation ratio relative to N, equivalent dose uncertainty) were set to 20%. Taking the recuperation ratio relative to N may bias the dataset but is the only option in analysing the data within the R luminescence package (Kreutzer et al., Reference Kreutzer, Burow, Dietze, Fuchs, Schmidt, Fischer, Friedrich, Mercier, Smedley, Christophe, Zink, Durcan, King, Philippe, Guérin, Riedesel, Autzen, Guibert, Mittelstrass and Galharret2023). We tested if omitting the recuperation ratio would make a significant difference. This led to higher grain acceptance, but no significant changes in the central age model (CAM) results. Additionally, interquartile range (IQR) filtering was used: grains with a D e value outside the boxplot whiskers, that is, 1.5 IQR below the first quartile or 1.5 IQR above the third quartile of the data, were rejected. These IQR-filtered results were used as input for the logged version of the CAM (Galbraith et al., Reference Galbraith, Roberts, Laslett, Yoshida and Olley1999) in R (calc_CentralDose function). These CAM values were used for further analysis and are referred to herein as residual CAM palaeodose. The CAM is adopted as a means to obtain a weighted mean for our single-grain equivalent dose distributions and to quantify the overdispersion. Bootstrapped minimum age model (bMAM (Cunningham & Wallinga, Reference Cunningham and Wallinga2012)) results were calculated but are not presented here because the inhomogeneous starting dose of the control samples caused bMAM-calculated doses to be ambiguous (see section ‘Sample characterisation’). All results (i.e. residual CAM palaeodoses after daylight exposure) are presented as a fraction of the CAM dose of the control sample for the corresponding IRSL or pIRIR signal. The uncertainty in the CAM value of the control sample was taken into account via uncertainty propagation in the calculations performed.
Results
Water depth and light spectra
Subaqueous light spectra change in shape and intensity as a function of time of day, water depth and tidal stage. Figure 4 shows a selection of the results, taken from four measurement stages corresponding to each of the four tidal stages: high tide (S1); ebb (S3); low tide (S5); and flood (S6). From all spectra profiles, typical spectra at vertical positions +1 m, 0 m, −1 m and −2 m relative to Amsterdam Ordnance Datum (NAP) were selected for each of these four tidal stages. The blue line in Figure 4 indicates the water-surface level. The tidal range throughout the experiment day was around 165 cm, and the water-surface level relative to the samples’ fixed position greatly influenced the light exposure at each position. The combined spectra at the bottom of Figure 4 show that light intensity was higher around the late afternoon than at noon because low tide took place during the late afternoon.
Summarising diagram showing the influence of time of day, water depth and tidal stage on subaqueous light spectra as measured during the experiment day on 26 October 2022. The x-axis of the diagram shows the time in Central European Summer Time (CEST), and the y-axis shows the vertical position of the spectrometer in centimetres relative to Amsterdam Ordnance Datum (N.A.P. cm). The 16 inset graphs show the subaqueous spectra, with the wavelength [nm] on the x-axis and the light intensity [mW/m2 nm] on the y-axis. Note that the graph only shows a subset of the measurements made (see Fig. 3). Each column of spectra represents spectra at various water depths for one tidal stage (high tide – ebb – low tide – flood); they are combined into one graph at the bottom of the figure. The brown bar at 3 m below NAP indicates seabed depth. The blue wave indicates the tidal range throughout the day. The orange donut graphs on the right show the cumulative light exposure as a function of the total incoming light exposure at various water depths.

Cumulated light exposure during the full day (doughnuts at the right of Figure 4) indicates that 82% of subaerial light reached NAP level and 32% of subaerial light penetrated to a depth of 1 m below NAP. 11% of the subaerial light penetrated down to the lowest measurement position at 2 m below NAP.
The spectrometer graphs in Figure 4 also show that the shapes of all spectra narrow underwater; for example, the lower wavelength range attenuates quicker than other parts of the spectrum, regardless of tidal stage. The red graphs, captured at 1 m above NAP, have a wider shape than the yellow graphs, captured at 1 m below NAP. This is most apparent in Figure 5, which shows the attenuation of distinct parts of the spectrum throughout the water column for different measurement stages (S0–S7). The shortest wavelengths, such as UV-A and blue (Figure 5a), and the longest wavelengths, such as dark red and NIR (Figure 5d), attenuate the most under subaqueous conditions. The green (Figure 5b) and red (Figure 5c) part of the spectrum attenuate less strongly. The orange curve in Figure 5 a–c, corresponding to measurement stage S5 (low tide), shows the strongest attenuation as a function of inundation depth, while measurement stage S3 (ebb) shows the least attenuation.
Attenuation of the (a) λ = 400–500 nm, (b) λ = 500–600 nm, (c) λ = 600–700 nm and (d) λ = 700–800 nm spectrum intensity throughout the water column, per tidal stage. Exponential models were fitted through each temporal subset. The x-axis shows the ratio between the intensity of penetrating light (water) normalised by the intensity of incoming light (sky). The y-axis represents the depth of each spectrometer measurement [m], as indicated with dots in the graph.

Equivalent dose distributions
Sample characterisation
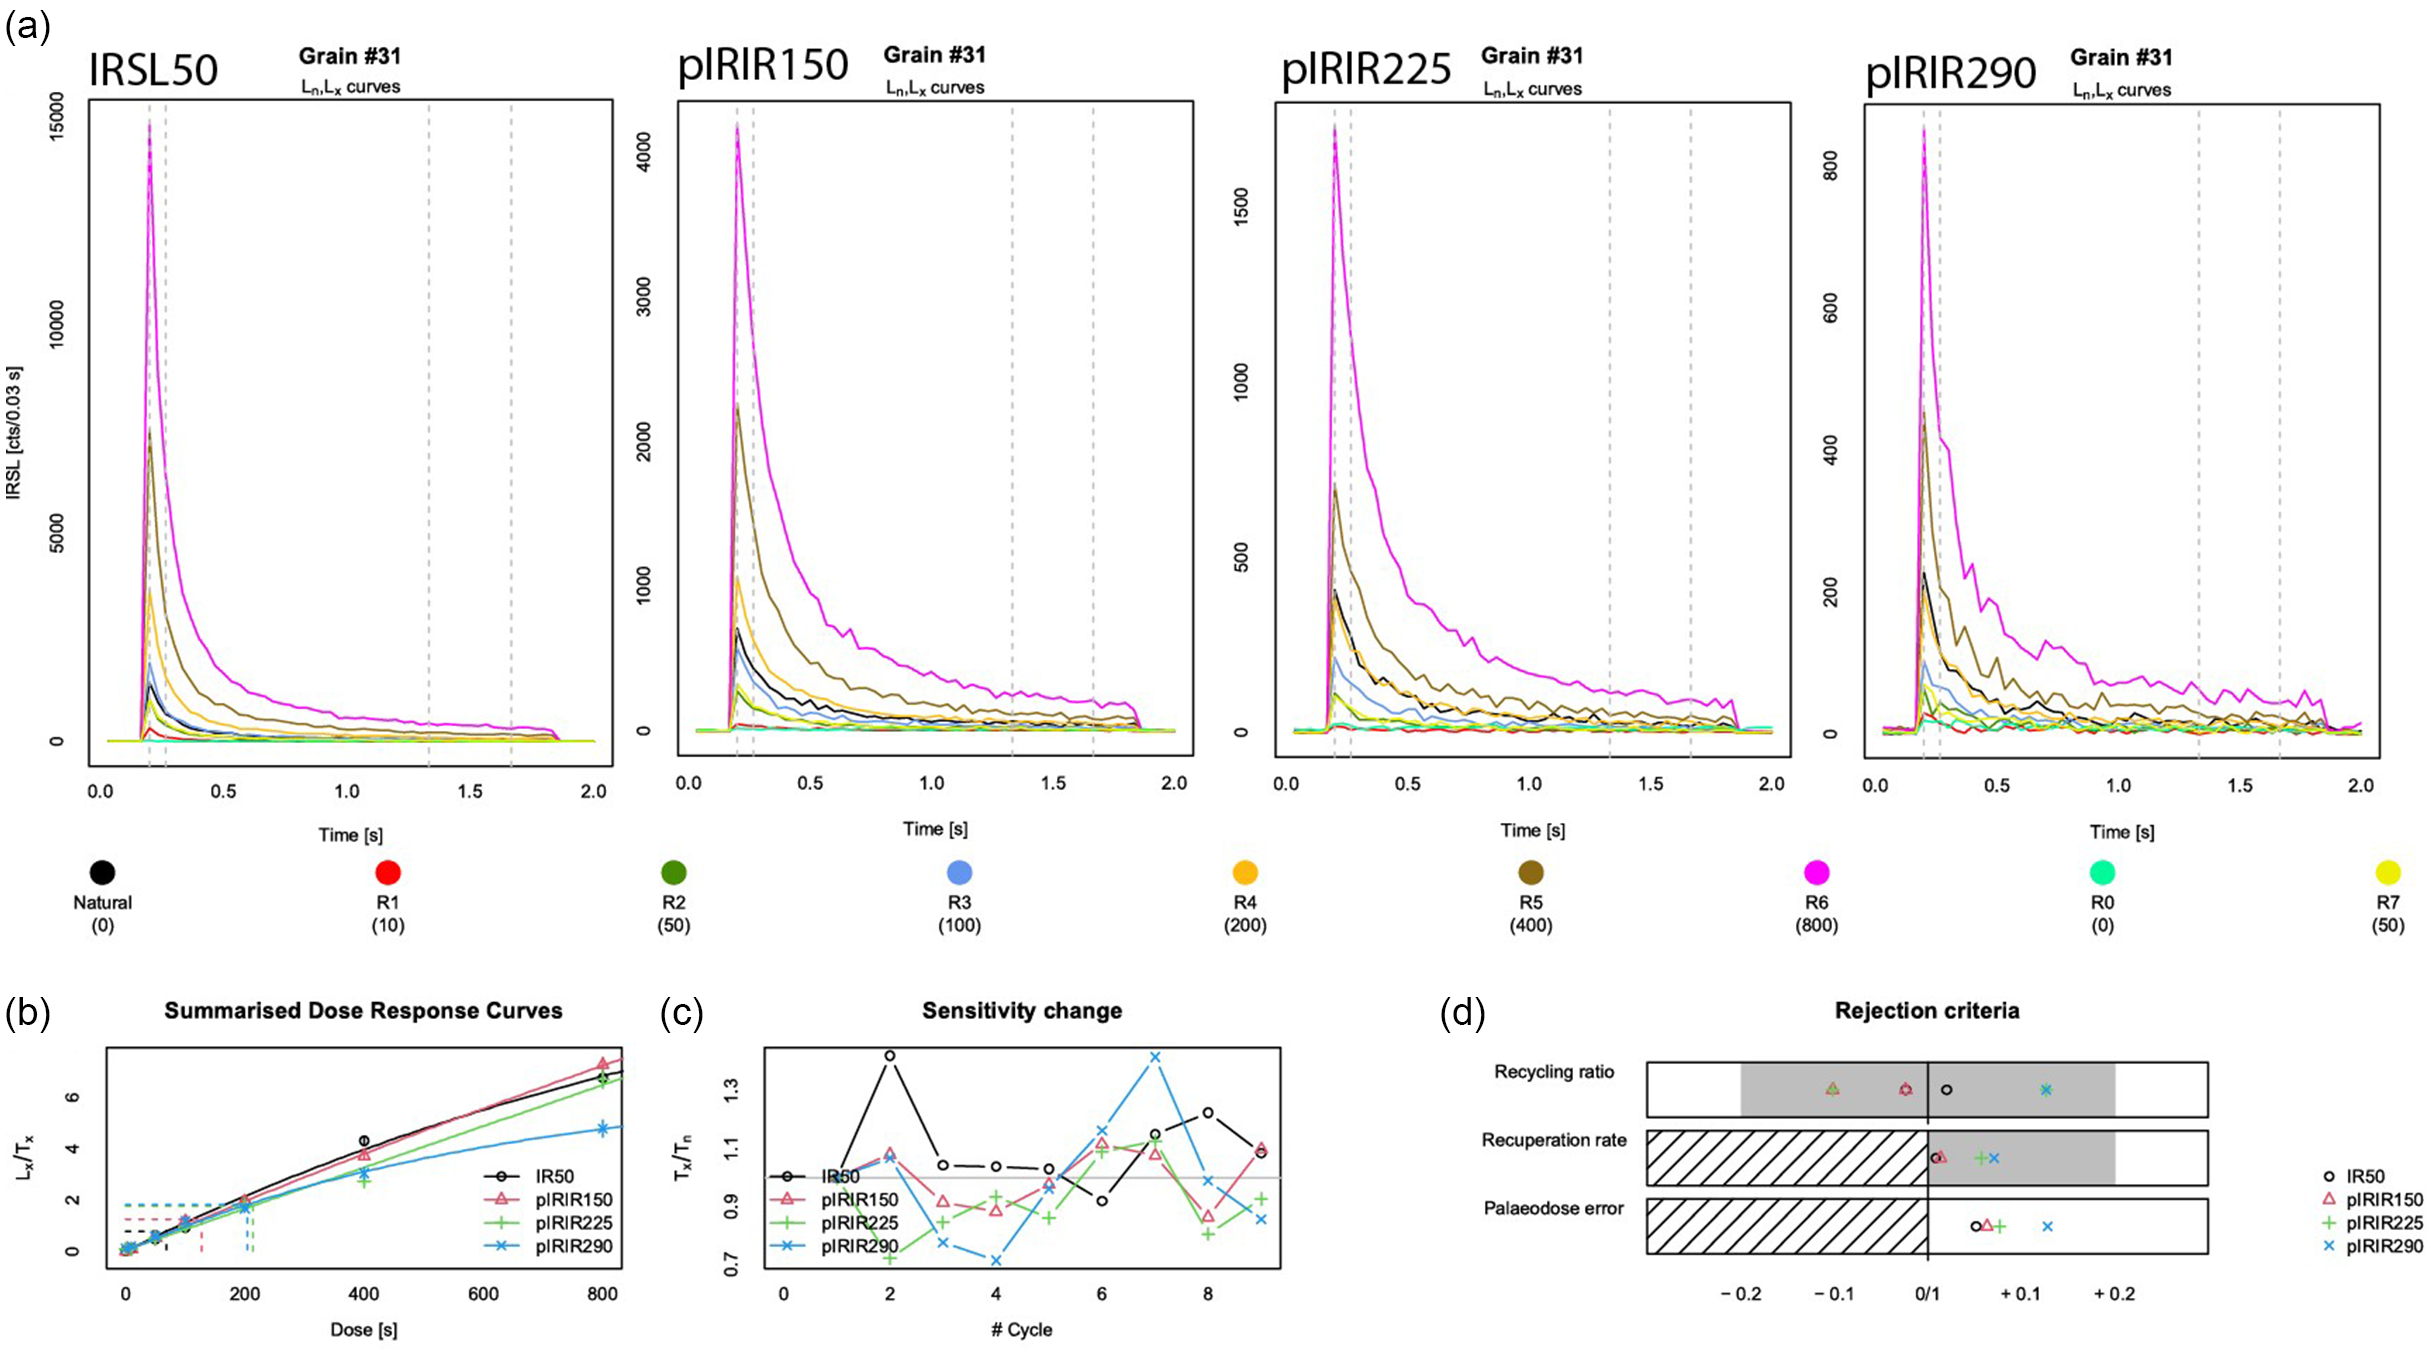
The De distribution on the control sample after IQR filtering (see section ‘Luminescence measurement protocol’) is overdispersed and varies for different (pIR)IR signals (Figure 7a). Inherent scatter was thus present in the control sample, even though the aim was to irradiate all grains with the same dose. Apparently, laboratory bleaching and dosing with 14.2 Gy did not provide the preferred homogeneous starting dose. The IRSL-50 starting dose was estimated at 11.6 ± 0.56 Gy (n = 119; OD = 50 ± 3.6%), the pIRIR-150 dose at 17.7 ± 0.75 Gy (n = 112; OD = 43 ± 3.1%), the pIRIR-225 dose at 20.6 ± 0.92 Gy (n = 99; OD = 42 ± 3.3%) and the pIRIR-290 dose at 24.8 ± 1.68 Gy (n = 35; OD = 34 ± 5.4%). All (pIR)IR signals that met the rejection criteria show well-defined natural and regenerative decay curves; the data for an example grain are shown in Figure 6. The rejection criteria pane in Figure 6 shows that this grain passes all rejection criteria for all signals.
Luminescence decay curves for a single grain (#31) of the control sample, NCL-1422173. From left to right (a): the IRSL-50, pIRIR-150, pIRIR-225 and pIRIR-290 signals. The black line shows the natural decay curves and the coloured lines the decay curves in response to the regenerative doses (see legend). The three panels at the bottom of the figure show from left to right: (b) the summarised dose-response curves for all signals, (c) the sensitivity change throughout the measurement sequence and (d) how each signal plots with regard to the study’s rejection criteria parameters including the recycling ratio, recuperation rate and relative palaeodose error.
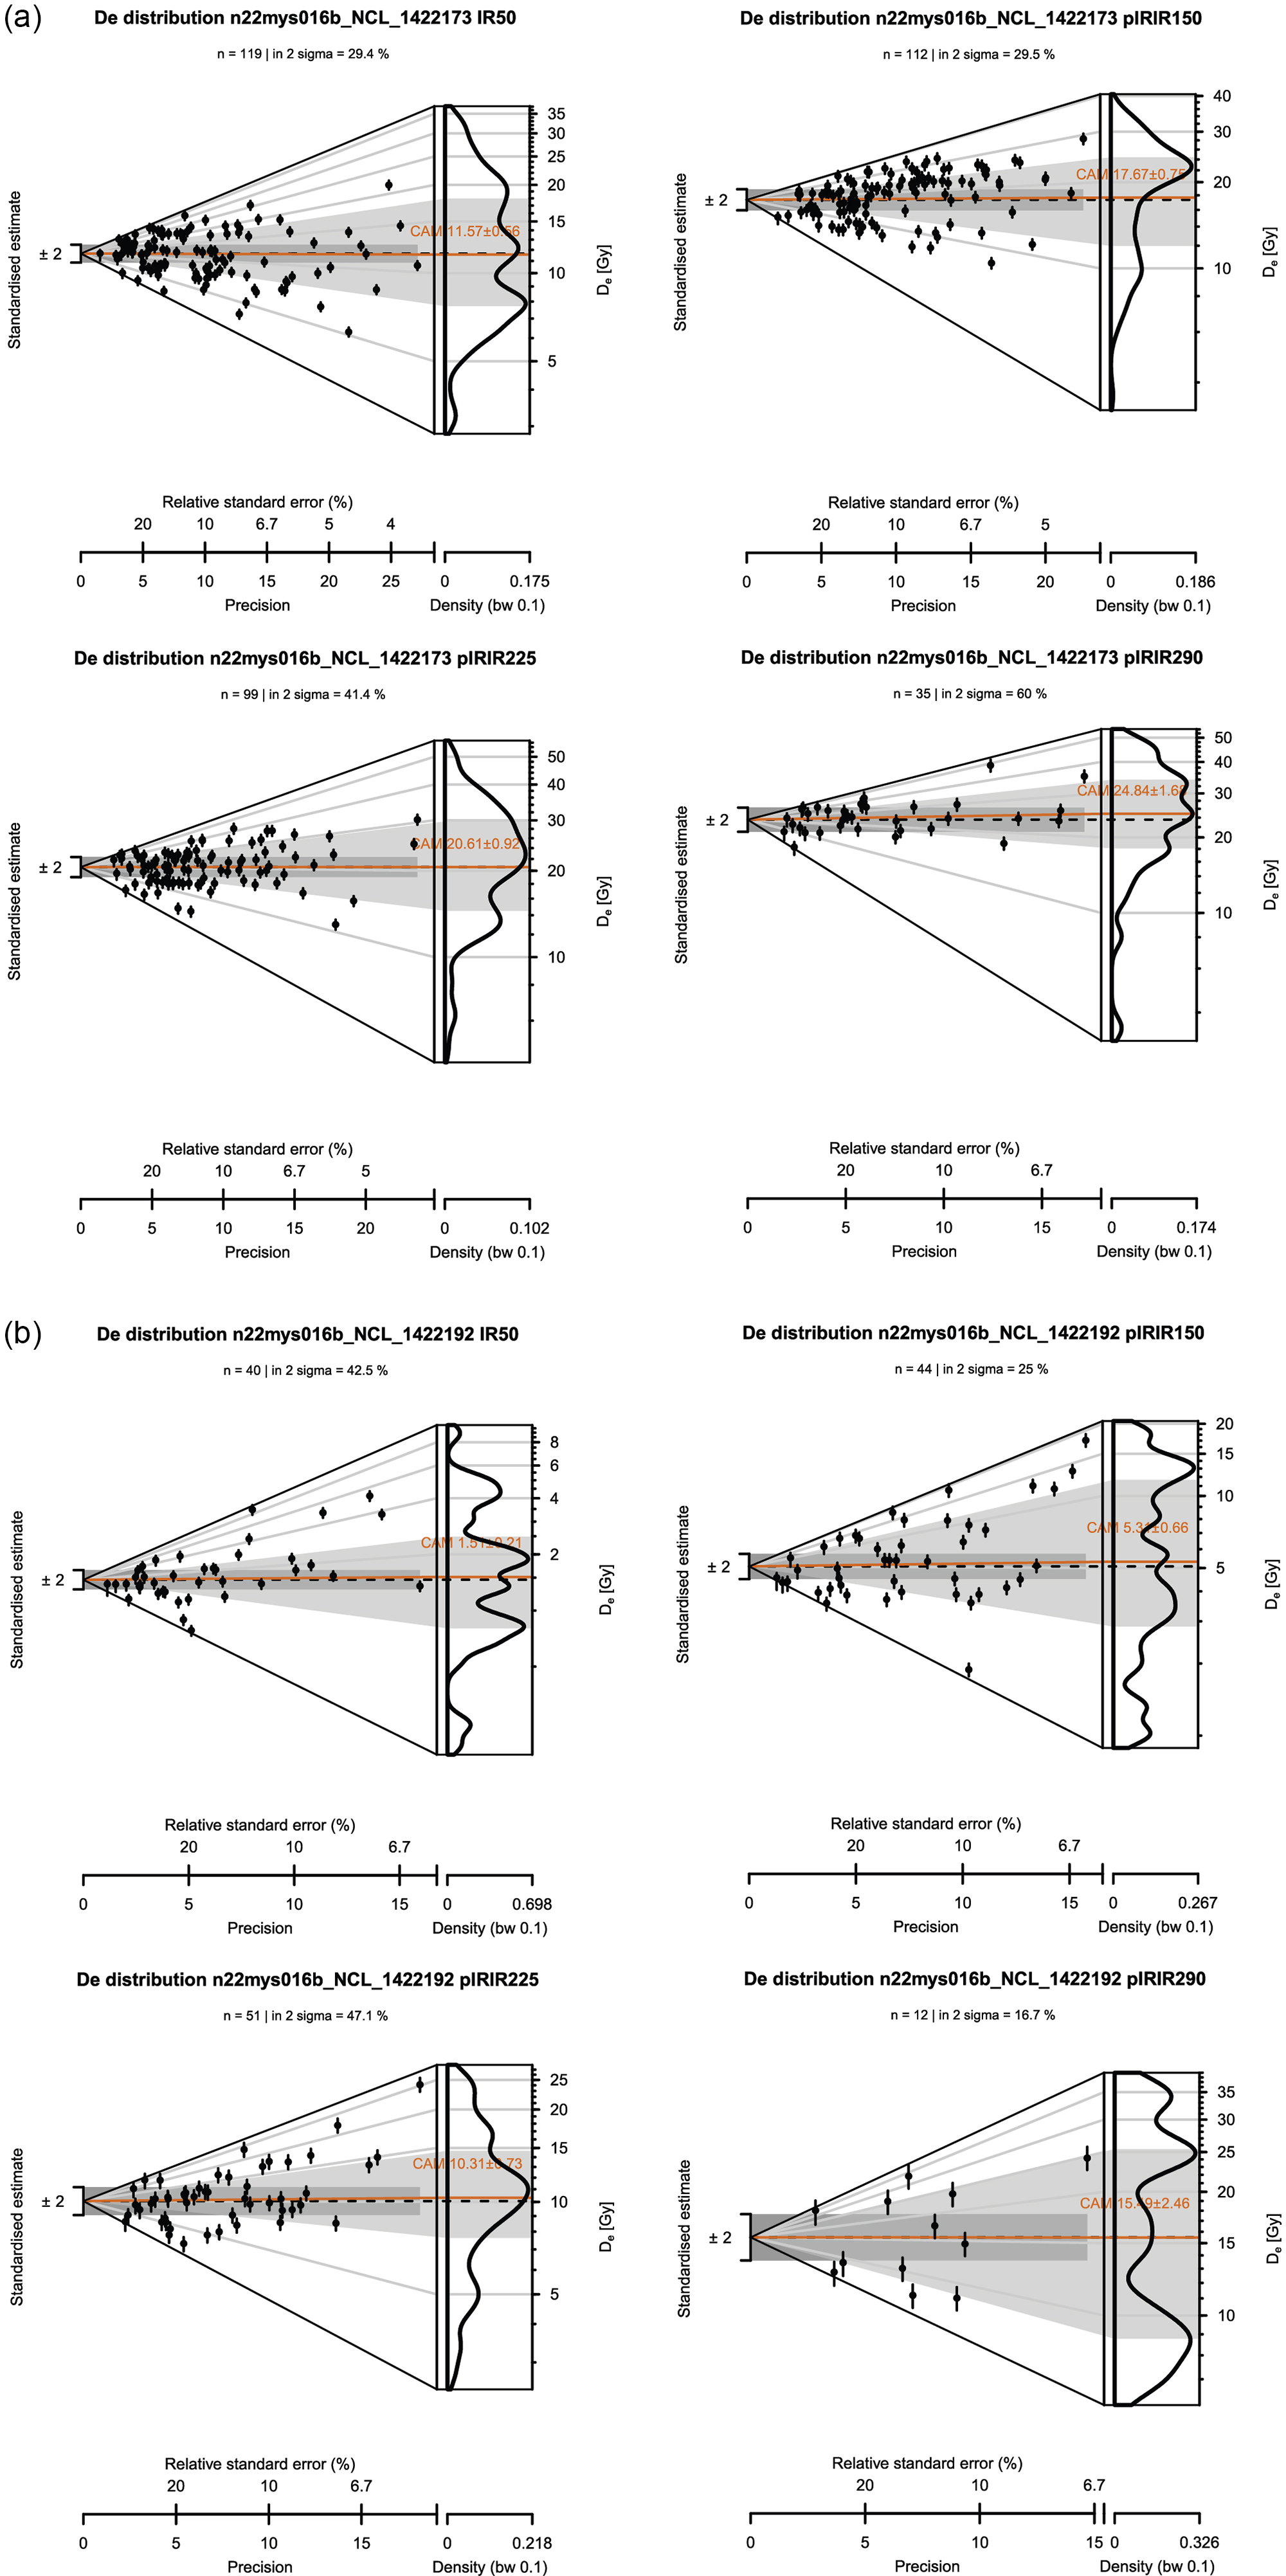
The De distribution of the supratidal sample, that is, the sample that has been continuously exposed subaerially during the experiment (see Figure 2), is also overdispersed for all (pIR)IR signals (Figure 7b). For all (pIR)IR signals, the CAM values are lower than those of the control sample (Figure 7a). However, a residual dose remains for all (pIR)IR signals. The IRSL-50 residual dose is estimated at 1.51 ± 0.21 Gy (n = 40; OD = 83 ± 10.2%), the pIRIR-150 dose at 5.31 ± 0.66 Gy (n = 44; OD = 79 ± 9.1%), the pIRIR-225 dose at 10.3 ± 0.73 Gy (n = 51; OD = 47 ± 5.3%) and the pIRIR-290 dose at 15.5 ± 2.46 Gy (n = 12; OD = 52 ± 11.8%). An overview of all CAM palaeodose estimates can be found in Supplement 2. Abanico plots of all samples and (pIR) IR signals are provided in Supplement 3.
Abanico plots showing the equivalent dose (D e) distribution for single grains of K-feldspar for (a) the control sample (NCL-1422173+NCL-1422195) and (b)the sample (NCL-1422192) that has been exposed subaerially throughout the experiment day for all recorded feldspar signals (IRSL-50; pIRIR-150; pIRIR-225; pIRIR-290). The dark orange line indicates the estimated CAM-paleodose of the sample, and n indicates the number of grains that contributed to this calculation.
IR and pIR bleaching as function of depth
Results of the signal-specific normalised CAM doses are visualised in Figure 8 and listed in Supplement 2 for all (pIR)IR signals measured, presented in order of sample-position depth. For all sample positions, the bleaching rate relates to measurement temperature with the slowest bleaching for higher temperatures. In interpreting these data, we should keep in mind that the CAM dose in the control sample was different for each signal (see section ‘Sample characterisation’).
Normalised CAM doses per sample and for each of the luminescence signals. The x-axis represents the CAM values normalised to the CAM value of the non-exposed sample; the y-axis shows the vertical position of the sample. The horizontal coloured boxes represent the subtidal zone in dark blue, the intertidal zone in light blue and the supratidal zone in white. The two grey points with error bars show wave height variation throughout the day (∼0.5 m). The red vertical box represents the control sample’s start value with its uncertainty. The figure illustrates differences in luminescence signal resetting as a function of depth and the relative bleaching efficiencies of the different IRSL and pIRIR signals.
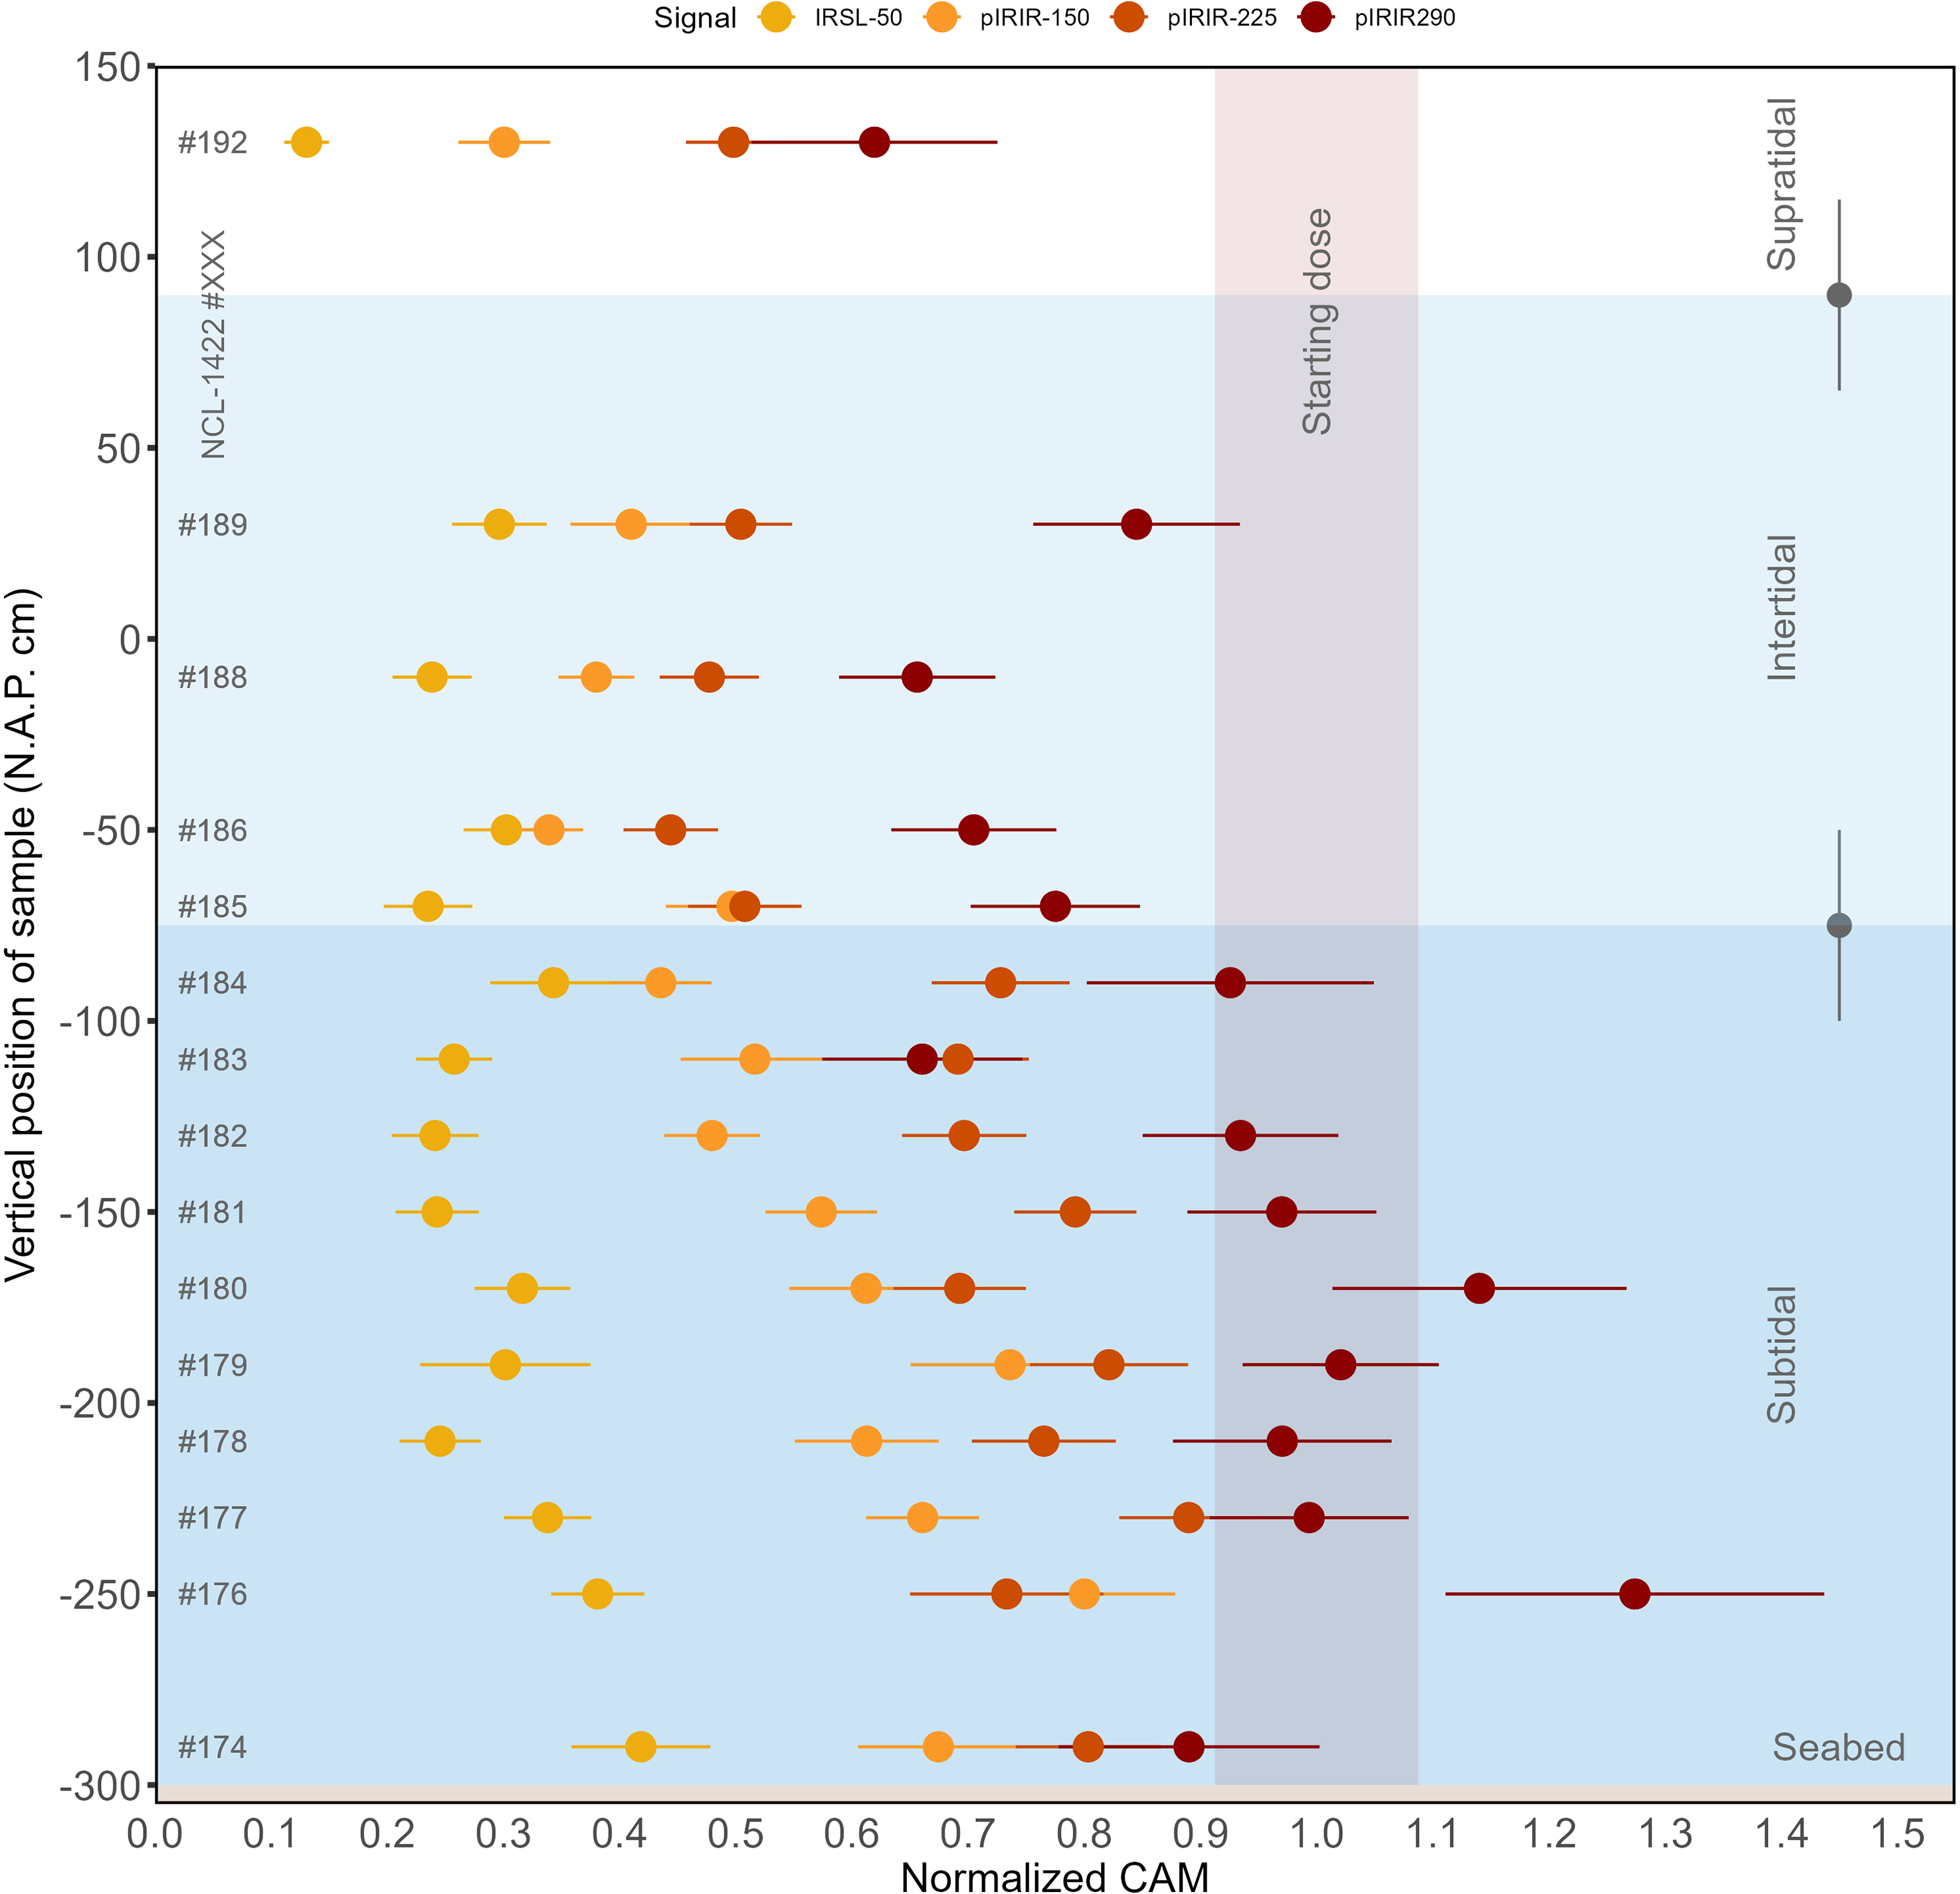
The IRSL-50 signal was reset to less than 50% of its initial signal for each of the samples after the full-day light exposure experiment. The remaining pIRIR-150 signal ranged from ∼40 to 90% in the subtidal zone, to ∼30–40% in the intertidal zone. For pIRIR-225, the remaining signal ranged from ∼60–95% in the subtidal zone to ∼40–50% in the intertidal zone. For pIRIR-290, hardly any bleaching was observed in the subtidal zone, while the remaining signal in the intertidal zone ranged between ∼60 and 90%.
These results indicate that there was more bleaching for the low-temperature IRSL signals than for the high-temperature IRSL signals. No signal was reset completely in any sample, not even the IRSL-50 signal of the subaerially exposed sample NCL-1422192. The results also indicate that the rate of bleaching differs per tidal zone, reflecting that samples in the supratidal and intertidal zones were subaerially exposed during (part of) the experiment.
IR and pIR bleaching as function of cumulative light exposure
The results presented in section ‘IR and pIR bleaching as function of depth’ show that all (pIR)IR signals bleach less strongly in samples located lower on the pole. As described in section ‘Light spectrum measurements’, we measured the subaqueous light penetration as a function of vertical position throughout the day of the experiment. Therefore, it is possible to study bleaching as a function of cumulative light exposure. In doing so, we ignore the dependence of bleaching efficiency on wavelength (optical decay cross-section), as has been documented by Spooner (Reference Spooner1994a). His data show that the bleaching efficiency of the IRSL signal decreases with a factor of 10 between 400 and 700 nm. Unfortunately, we could not implement a correction factor for these variations in the bleaching potential since this type of information is only available for the IRSL signal and not for the pIRIR signals investigated here. Although IRSL and pIRIR signals probably arise from the same traps (Jain & Ankjærgaard, Reference Jain and Ankjærgaard2011), we expect that the wavelength dependency of bleaching could be different due to the different recombination pathways (Thomsen et al., Reference Thomsen, Murray, Jain and Bøtter-Jensen2008). The scarce information on pIRIR bleaching as a function of wavelength that is available (Kars et al., Reference Kars, Reimann, Ankjærgaard and Wallinga2014) is insufficient to implement a correction for the data in this study.
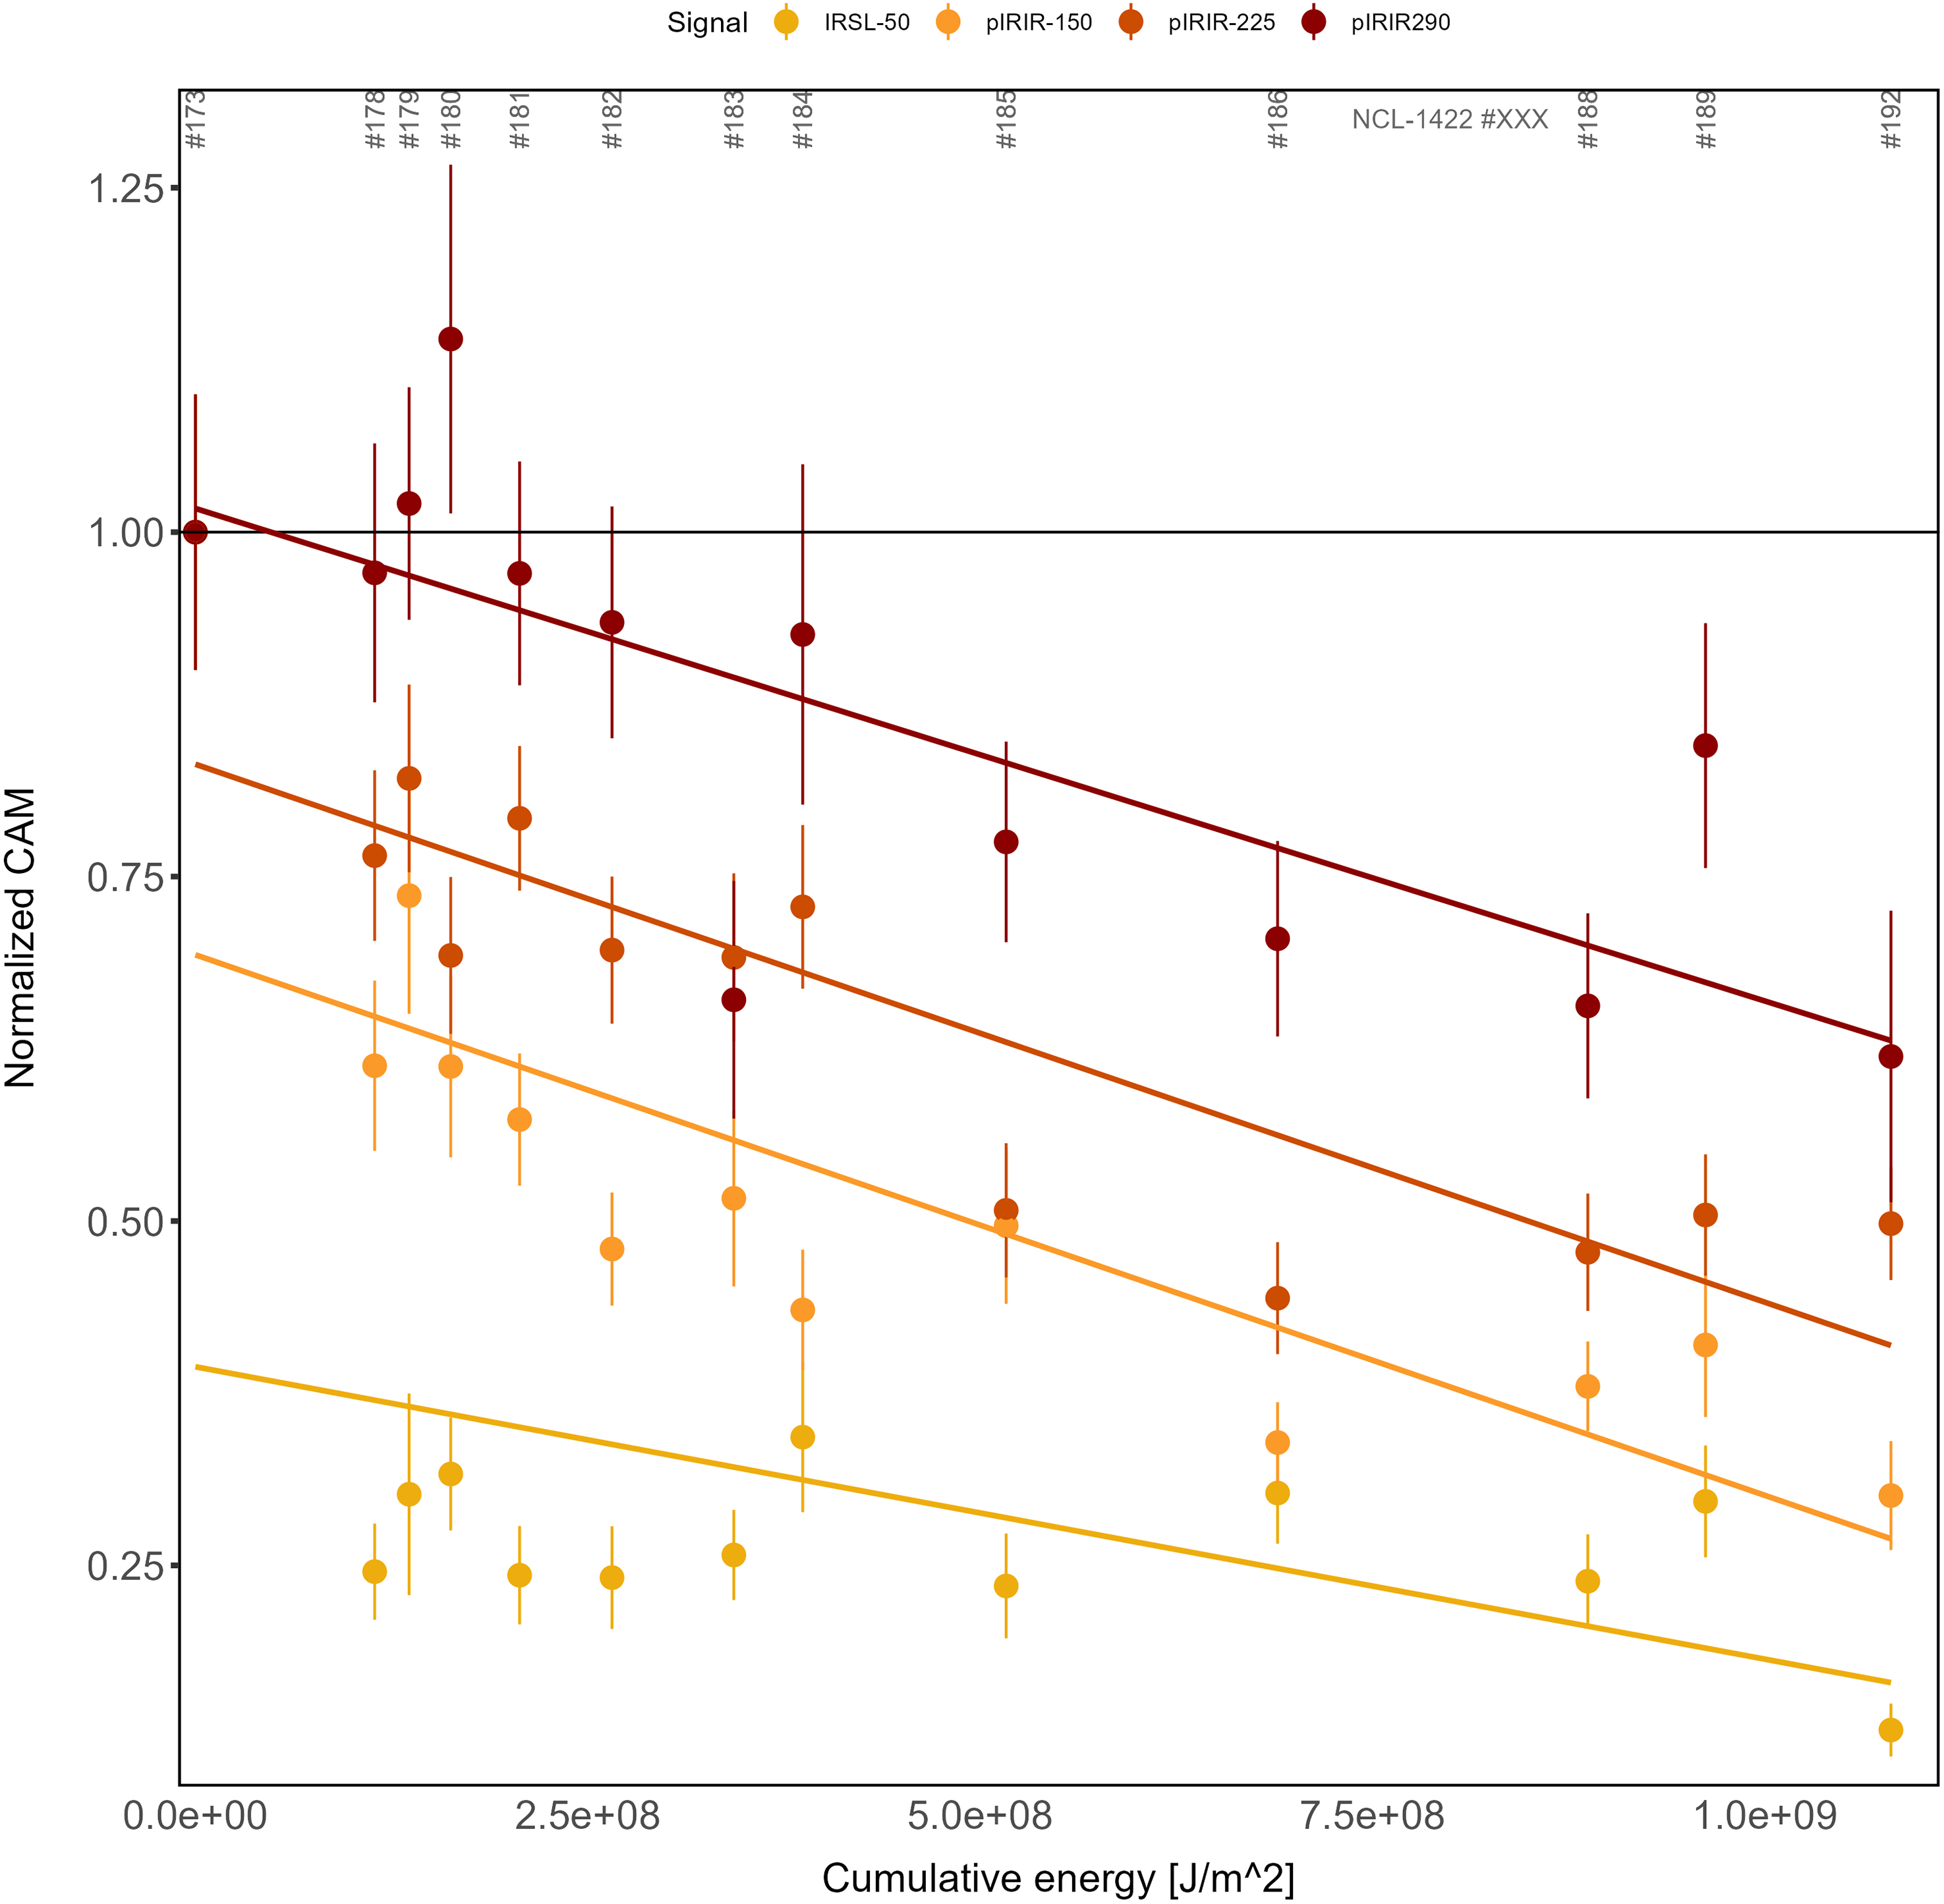
In Figure 9, bleaching curves (CAM dose) as a function of cumulative light exposure are presented as normalised values relative to the control sample. The rightmost data points correspond to the subaerially exposed sample NCL-1422192. The results show that there is a positive relationship between bleaching and cumulative light exposure and a negative relationship between measurement temperature and bleaching rate. None of the (pIR)IR signals were bleached completely: the IRSL-50 CAM dose was bleached to ∼25% of its starting value, pIRIR-150 to ∼38%, pIRIR-225 to ∼50% and pIRIR-290 to ∼70% of the control sample.
Normalised CAM values as a function of cumulative light exposure for the different luminescence signals. The x-axis shows the calculated cumulative energy that a sample received during the bleaching experiment expressed in J/m2. The y-axis shows the CAM values normalised to the non-exposed sample for each signal type. The trend lines are fitted with a linear model. The horizontal black line is drawn at a normalised CAM value of 1; for example, this line represents the value of the control sample.
Discussion
Experimental design
The experimental set-up was found to be suitably robust for this experiment: no samples were damaged or lost. Given the fixed positions of the samples relative to NAP (Figure 2), inundation levels changed during the day, and the intertidal samples were subaerially exposed part of the time. The set-up mimics bleaching conditions for grains at the sediment surface (e.g. channel bed, intertidal or supratidal setting) but is less suitable to quantify bleaching as a function of depth (e.g. during sediment transport). For such investigations, we suggest an experimental design where samples remain at a fixed position relative to the water surface.
Single-grain De distributions of the control sample showed high overdispersion, ranging from 50.4 ± 3.6% for the IRSL-50 signal to 34.1 ± 5.4% for the pIRIR-290 signal, indicating that the quantified measurement uncertainties do not explain the scatter in the De distribution (Figure 7a). Investigating the causes for this unexpected behaviour was beyond the scope of this research but must be sought in (1) heterogeneous resetting of the signals prior to dosing, (2) heterogenous dose rate during irradiation in the gamma-facility or (3) grain-to-grain differences in fading rate. We note that especially the pIRIR signals of the control sample have an estimated starting dose (Figure 7a) much higher than the calculated irradiated dose (14.2 Gy). This suggests that resetting of the signals prior to dosing may not have been complete. The overdispersed De distribution prevented meaningful interpretation of our data at single-grain level, but CAM statistics allowed us to interpret the data as a function of depth and light exposure.
The subaerial sample (NCL-1422192) was not fully bleached even for the IRSL-50 signal (Figure 7b), which is generally considered the most readily bleachable of the signals we measured (e.g. Thomsen et al., Reference Thomsen, Murray, Jain and Bøtter-Jensen2008; Zhang et al., Reference Zhang, Guralnik, Tsukamoto, Ankjærgaard and Reimann2023). The subaerial IRSL-50 residual dose is probably not an artefact of light attenuation by the ETFE foil, which is shown to be very limited (Supplement 1). We suggest the residual dose could be a measurement artefact, caused by thermal transfer during the high preheat at 320°C (Buylaert et al., Reference Buylaert, Thiel, Murray, Vandenberghe, Yi and Lu2011a). Alternatively, the daylight intensity on the day of the experiment may have been too low to reset the signals of interest of all grains completely within one day.
Bleaching as function of inundation depth and light exposure
The qualitative trends in bleaching potential, that is, the light intensity and spectrum as a function of depth, are in line with our expectations. With increasing depth, the light intensity quickly attenuates with only 11% of the integrated incoming daylight reaching −2 m NAP (Figure 4). With increasing depths the UV-blue and NIR portion of the spectrum attenuate most, and peak intensity shifts slightly towards higher wavelengths (Figure 5). This has possibly been observed in antecedent experiments as well (Berger & Luternauer, Reference Berger and Luternauer1987; Mey et al., Reference Mey, Schwanghart, de Boer and Reimann2023; Sanderson et al., Reference Sanderson, Bishop, Stark, Alexander and Penny2007). Mey et al. (Reference Mey, Schwanghart, de Boer and Reimann2023) reported that the stronger attenuation of the UV-blue compared to the red-NIR wavelength part of the spectrum could be attributed to an increase in suspended sediment concentration. However, they did not find this wavelength-dependent light discrimination reflected in their luminescence data. Likewise, we did not find the wavelength-dependency back in our luminescence data. Hereby, it is important to note that in our study we only looked at feldspar data, while Mey et al. (Reference Mey, Schwanghart, de Boer and Reimann2023) compared the bleaching efficiency of quartz and feldspar minerals. Correspondingly, we found the strongest attenuation during low tide (Figure 5a–d, measurement stage S5) when sediment concentrations in the Marsdiep are the highest (Nauw et al., Reference Nauw, Merckelbach, Ridderinkhof and van Aken2014). We expect that narrowing of the light spectrum underwater (Figures 4 and 5) will also impact the bleaching rate (Kars et al., Reference Kars, Reimann, Ankjærgaard and Wallinga2014; Spooner, Reference Spooner1994a) but did not investigate this further (see also section ‘IR and pIR bleaching as function of cumulative light exposure’).
The bleaching efficiency trends, that is, the degree to which different luminescence signals bleach under the given light climate, are in line with previously reported trends from the laboratory (Kars et al., Reference Kars, Reimann, Ankjærgaard and Wallinga2014; Mey et al., Reference Mey, Schwanghart, de Boer and Reimann2023) and field experiments (Sanderson et al., Reference Sanderson, Bishop, Stark, Alexander and Penny2007). The low-temperature IRSL-50 signal bleached the fastest, followed in order by the pIRIR-150, pIRIR-225 and pIRIR-290 signals (Figure 8). These different bleachabilities have previously been attributed to increased distance between traps and recombination centres (Fitzgerald et al., Reference Fitzgerald, Sanderson, Cresswell and Martin2022; Kars et al., Reference Kars, Reimann, Ankjærgaard and Wallinga2014; Poolton et al., Reference Poolton, Ozanyan, Wallinga, Murray and Bøtter-Jensen2002; Riedesel et al., Reference Riedesel, King, Prasad, Kumar, Finch and Jain2019). The degree of bleaching also correlated with the vertical position of the samples: lower samples were exposed to less light and were thus bleached less (Figure 9).
These findings agree with the laboratory light exposure study of Kars et al. (Reference Kars, Reimann, Ankjærgaard and Wallinga2014): (1) pIRIR signals measured at elevated temperatures are consistently harder to bleach than those measured at lower temperatures; (2) bleaching is most efficient under subaerial exposure for all (pIR)IR signals; and (3) all data show a gradual decrease in averaged normalised residual dose with increasing cumulative light exposure, which continues across the observed range of exposure values. Our findings imply that an unbleachable residual level could not be reached at the sample-average level within the exposure duration of our experiment.
Implications for dating
For (pIR)IR dating to be used successfully to date young tidal deposits, at least part of the grains must have been exposed to sufficient light to reset the signal of interest prior to deposition and burial (Hong et al., Reference Hong, Choi, Han and Cheong2003; Richardson, Reference Richardson2001). The results of our light exposure experiment (Figures 8 and 9) show that the studied grains, which can be seen as analogues for grains deposited on a tidal flat (see section ‘Experimental set-up’), yield on average a non-zero residual dose for all measured (pIR)IR signals after one day of exposure. Figure 8 clearly shows the difference between subaerial and subaqueous bleaching efficiency: the subaerially exposed sample (NCL-1422192) has a considerably lower residual dose for all (pIR)IR signals than the subaqueously exposed samples, indicating that extra caution should be taken with regard to doses that remain after bleaching when dating waterborne tidal feldspar grains. However, the measurement protocol we adopted for this study uses a high preheat (320°C) to allow including high measurement temperatures (up to 290°C) in the MET procedure (Table 1). We hypothesise that the non-zero plateau observed for the IRSL-50 signal is likely an artefact of thermal transfer rather than a sign of slow bleaching (Figures 8 and 9). Also, the trends in pIRIR decay may be affected by thermal transfer. Moreover, given the challenges associated with overdispersion in equivalent doses for our control sample, we focused on sample-average residual doses and did not investigate whether signals were fully reset for part of the grains. The gradual decrease of all pIRIR bleaching curves with cumulative light exposure (Figure 9) indicates that an asymptote (bleaching plateau) (Colarossi et al., Reference Colarossi, Duller, Roberts, Tooth and Lyons2015; Kars et al., Reference Kars, Reimann, Ankjærgaard and Wallinga2014; Zhang et al., Reference Zhang, Guralnik, Tsukamoto, Ankjærgaard and Reimann2023) is not yet reached, on average, after a full day of exposure in this setting. While our results show that full resetting of pIRIR signals takes more than a day of light exposure at our site given the bleaching circumstances present during the experiment day and with our D e determination protocol, we would like to emphasise that previous work (e.g. Brill et al., Reference Brill, Reimann, Wallinga, May, Engel, Riedesel and Brückner2018) has shown that young water lain samples can be successfully dated with low-temperature pIRIR protocols or quartz-based methods (Madsen et al., Reference Madsen, Murray, Andersen and Pejrup2007; Mauz et al., Reference Mauz, Baeteman, Bungenstock and Plater2010).
Implications for tracing and other applications
Luminescence-based sediment tracing applications rely on incomplete resetting of signals to infer sediment sources and transport pathways (Gray et al., Reference Gray, Jain, Sawakuchi, Mahan and Tucker2019; Guyez et al., Reference Guyez, Bonnet, Reimann, Carretier and Wallinga2022; Reimann et al., Reference Reimann, Notenboom, De Schipper and Wallinga2015; Rhodes & Leathard, Reference Rhodes and Leathard2022). The bleaching efficiency of the measured (pIR)IR signals, as presented in section ‘IR and pIR bleaching as function of cumulative light exposure’ and Figure 9, shows that the elevated-temperature signals, for example, pIRIR-150, pIRIR-225 and pIRIR-290, are far from steady-state. These signals inherit part of their starting dose and therefore still contain information about their natural signal. The ratio between these (pIR)IR signals, that is, the differences in bleaching efficiency, can provide information on the light exposure and thus transport history of sediments (Reimann et al., Reference Reimann, Notenboom, De Schipper and Wallinga2015). Another opportunity to decipher transport histories is based on the slow resetting speed of TL signals (Ahmed et al., Reference Ahmed, Sato and Tajima2014; Liu et al., Reference Liu, Hamamoto and Sato2011; Liu et al., Reference Liu, Kishimoto, Takagawa, Shirai and Sato2009). Gray (Reference Gray, Jain, Sawakuchi, Mahan and Tucker2019) pointed out that, in order to develop luminescence as a quantitative coastal sediment tracer, the bleaching of different luminescence signals occurring during surface exposure and/or during wave/tidal transport should be quantified. With this study, we aimed to contribute to this knowledge base, and we plan to combine these gained insights with sediment transport models to decipher coastal sediment dynamics and support nature-based coastal management (e.g. de Boer et al., Reference de Boer, Wallinga and Chamberlain2021; Pearson et al., Reference Pearson, van Prooijen, Elias, Vitousek and Wang2020; Stive et al., Reference Stive, De Schipper, Luijendijk, Aarninkhof, van Gelder-Maas, Van Thiel de Vries, De Vries, Henriquez, Marx and Ranasinghe2013).
To study the bleaching potential, that is, the light intensity and spectrum as a function of depth, we measured the light climate during eight measurement stages on the day of the experiment (Figure 3). Information about in situ measured subaqueous light spectra is not widely available in literature, while the light environment is crucial to many forms of subaqueous life (e.g. enabling photosynthesis or visibility for predatory animals). Therefore, we suggest that our light spectra dataset (Figures 4 and 5) may also be of great relevance for ecosystem studies, to complement satellite-derived light data (Jacobs et al., Reference Jacobs, Kromkamp, Van Leeuwen and Philippart2020) or Secchi disc measurements (Colijn & Cadée, Reference Colijn and Cadée2003).
Conclusions
We documented, for the first time, underwater light spectra and associated feldspar luminescence signal bleaching as a function of depth in a tidal basin. Our results show that light spectra narrow underwater and are strongly influenced by tides due to differing sediment concentrations, varying wave climate and/or changing turbidity levels. Total cumulative energy from light is reduced by 90% at an approximate depth of 2 m.
Analyses of IRSL signals and a range of (pIR)IR signals obtained on single grains of feldspar show clear trends of residual CAM dose as a function of depth and signal bleachability. Our study demonstrates that in the investigated natural tidal basin setting: (1) the degree of bleaching of (pIR)IR signals after one day of light exposure reduces with depth; (2) the IRSL signal bleaches faster than elevated-temperature pIRIR signals both under subaerial and subaqueous conditions; (3) pIRIR signals measured at elevated temperatures are consistently harder to bleach than those measured at lower temperatures ; (4) bleaching is more efficient under subaerial exposure than subaqueous exposure for all (pIR)IR signals; and (5) that none of the bleaching curves reach a bleaching plateau, implying that an unbleachable residual level could not be reached within the one day exposure duration of our experiment.
The insights gained from this experiment inform luminescence dating and tracing studies, as they demonstrate that differences in degree of bleaching between IRSL and a range of pIRIR signals yield information on past light exposure of feldspar grains. We suggest that the unique subaqueous light spectrum data presented in this work are also relevant for ecological research.
Supplementary material
The supplementary material for this article can be found at https://doi.org/10.1017/njg.2024.18.
Data availability statement
The underlying measurement sequences, measurement bin files, spectrometer data and code to run the analysis are published on the Dutch 4TU research data repository under DOI: 10.4121/03543625-cc1b-4650-aea3-5992f077f417.
Acknowledgements
The authors gratefully thank Eric Wagemaakers from the Royal Netherlands Institute for Sea Research (NIOZ) for his support with the deployment of the TriOS spectrometers during the experiment day and for providing access to the jetty. We also thank NIOZ for providing ship time on the R.V. Navicula and for their assistance in retrieving sediment samples from the seabed. We thank Jürgen Mey from the University of Potsdam for borrowing us the Ocean Insight Flame spectrometer. We thank Alice Versendaal and Erna van den Hengel-Voskuilen for all their support at the Netherlands Centre for Luminescence dating. We thank Vicky Hansen from DTU Risø for bleaching and dosing our feldspar samples. Our thanks to Toru Tamura and an anonymous referee for their comments, which helped to improve the clarity of the manuscript. This project is financially supported by NWO grant 17600: Tracking Ameland Inlet Living Lab Sediment (TRAILS).
Author contribution
All authors contributed to the study conception. AMdB and MS conducted the experiment. MS performed the sample preparation and luminescence measurements supported by AMdB and EC. AMdB and MS performed the data analysis. AMdB wrote the first draft of the manuscript with support of JW, and all authors read and approved the final manuscript.
Competing interests
The authors declare that they have no conflict of interest.


 Open access