


1. Introduction
Pulsed power driven Z-pinch and high power electron beam loads can be used as laboratory radiation sources to generate x-rays in wide energy ranges. Considerable progress in pulsed power science has been made in the past decades to meet the requirements for the inertial confinement fusion, radiation effects, laboratory astrophysics, material physics, and other high-energy-density-physics experiments. Several multiterawatt (TW) pulsed power accelerators with tens of MA-class current have been or are being developed in the world, including the saturn, Z (ZR) in the US [Reference Spielman1–Reference Bloomquist, Stinnett, McDaniel, Lee, Sharpe and Halbleib4], primary test stand (PTS) in China [Reference Jianjun, Weiping and Suping5], and Baikal in Russia [Reference Grabovsky, Azizov, Alikhanov, Gribov, Jitlukhin and Levashov6].
The magnetically insulated transmission lines (MITLs) are commonly used in the pulsed power system to transmit the electrical pulses from the several meter scale insulator stacks to the centimeter scale loads. The design and performance of MITL are vitally essential for large pulsed power drivers [Reference Stygar, Awe and Bailey7–Reference Zhou, Li and Wang13].
Stygar et al. and Hutsel et al. have developed a transmission line circuit code for the Z (ZR) MITL system, respectively [Reference Stygar, Corcoran and Ives3, Reference Hutsel, Corcoran and Cuneo12]. Both the models simulate several physical processes, including the electron loss prior to the magnetic insulation, the gap closure effects, energy loss to conductors at high lineal current densities, ion emission, anode-plasma expansion, and load impedance time histories. The models agree well with experimental measurements. In the 2017–2019, Spielman et al. reported a screamer circuit code of the MITL system for a 15-TW, 10-MA driver [Reference Spielman, Froula and Brent9, Reference Spielman and Reisman10]. By means of Z flow theory, the current loss to the anode during the setup of magnetic insulation could be rapidly achieved, which provides an innovative MITL design tool. Bailey et al. successfully increased the output voltage of RITS-3 by designing a higher impedance MITL [Reference Bailey, Johnson and Corcoran11]. However, more in-depth research studies are needed on the performance when a MITL disk drives different loads, such as the bremsstrahlung electron beam diodes and z-pinches.
Based on the previous excellent studies, this study developed a transmission line circuit code for a MITL system of a 5-MA 100-ns driver [Reference Fan, Wei, Gong, Wu, Yao and Qiu14]. The electron current loss prior to magnetic insulation and the electron flow distributions in the magnetic insulation steady state were compared for two kinds of typical loads (bremsstrahlung electron beam diodes and Z-pinches).
This study is organized as follows. In Section 2, an initial MITL system design of the 5-MA 100-ns driver is presented. Section 3 gives a transmission line (TL) circuit code for the MITL system including the cylindrical reflex triode (CRT) and the Z-pinch load. The simulation results are illustrated in Sections 4 and 5, including the electron current loss before magnetic insulation, and the electron flow distribution after the magnetic insulation is fully established. In Section 6, the comparison of MITL performance for two loads is given. The work is summarized in Section 7.
2. MITL System of the 5-MA Accelerator
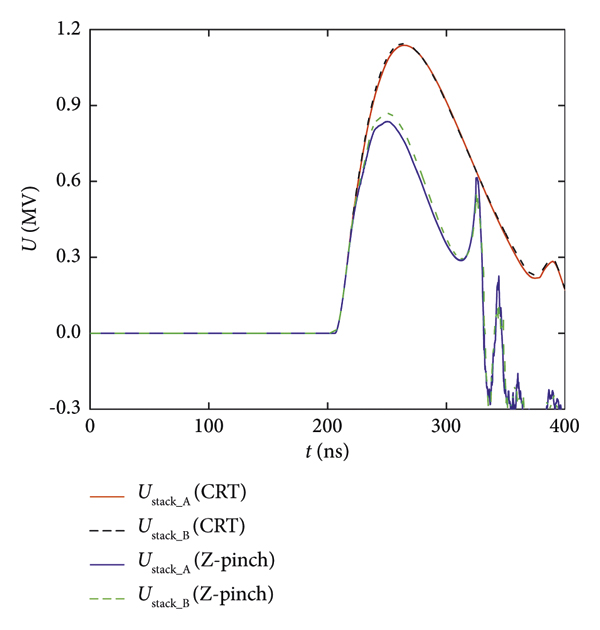
The accelerator is expected to deliver 3∼5 MA electrical pulse to load, which will be used to drive bremsstrahlung electron beam diode or Z-pinch load. The 3D model and cross-sectional view of the central converging region is presented in Figure 1. The prime power source consists of 6 identical LTD modules. Each LTD module delivers about 0.90 MV/0.50 MA electrical pulses to the central water tank by a 3 m length coaxial water transmission line. The 6 m diameter water-tank consists of 6 sets of 1.8 m length triplate radial transmission lines and a two-level vacuum-insulated stack with radius of 1 m. The LTD module, coaxial water insulated transmission line, and the triplate transmission line are almost impedance-matched.
Three-dimensional model and cross-sectional view of the central converging region of the 5-MA accelerator.

A two-level vacuum MITL is used to deliver the electrical pulses to the load from the insulator stack. Each level of the MITL comprises of a constant impedance segment and a constant-gap segment. At the outer radius location, the gap distance of each level decreases as the radius moves toward the center, which provides a constant-impedance profile. As the MITL gap distance decrease to 1 cm, it keeps constant inward. The angle of the MITL cathode is about 12°, which is accessible to diagnose various physical loads on the equatorial plane.
The parameters of each MITL level varying with the radius are shown in Figure 2. The total inductance of the stack-MITL system including the stacks, vacuum flare, and MITL is approximately 11.5 nH (two-level MITL in parallel). The impedance of the A and B level MITL keeps constant as 2.5 Ω at the radius of 73–25 cm, and the A-K gap decreases to 1 cm at the radius of 25 cm.
Geometry parameters of the central converging region of the accelerator: (a) the vacuum inductance, (b) the vacuum impedance, and (c) the AK gap.

3. Circuit Model of the MITL-Load System
As illustrated in Figure 3, a transmission-line-circuit model of the accelerator is developed. The circuit model of the MITL-load system consists of 43 TL elements. Each element has the same transmit time of 0.1 ns. The prime source consisting of 6 LTD modules in parallel is modeled as an R-L-C lumped circuit. Due to the different electrical length, each MITL level has different numbers of TL elements. The A level MITL is comprised of 16 constant-impedance elements (A
i1–A
i16) and 5 constant-gap elements (
 ). And the B level MITL is comprised of 17 constant-impedance elements (B
i1–B
i17) and 5 constant-gap elements (
). And the B level MITL is comprised of 17 constant-impedance elements (B
i1–B
i17) and 5 constant-gap elements (
 ). Within the outer-MITL region, a shunt resistor is used to model the electron current loss in each element before magnetic insulation. Within the load or posthole convolute (PHC) region, the lumped shunt resistors are used to calculate the electron flow loss originated from the terminal of the outer MITLs and then lost to these regions.
Diagram of the TL-code model of the accelerator.

3.1. Forward Voltage Used to Drive the TL Model
As shown in Figure 4, the TL circuit of the accelerator is driven by a forward going voltage U calculated by the TL model. The rise time of forward voltage waveform is about 60 ns, and the full width at half maximum (FWHM) is about 115 ns. The peak voltage is about 0.90 MV.
Plot of the output voltage from the LTD module. The peak voltage is about 0.90 MV.

3.2. Model of the Loss Current
Electrons are emitted from each element cathode once the electric field exceeds the threshold value E th. The emission electrons are assumed to be lost to the anode of the same element. The electron current loss I loss in this element is always calculated by the correction function of F e (Y) and K(t, |E|) on the classical Child Langmuir space charge-limited current I SCL [Reference Samokhin15], which is given as follows. The parallel resistor R loss in each element is calculated by the ratio of the line voltage V a to the electron current loss I loss.

where ε 0 is the vacuum permittivity, A is the surface area of each element, e is the electron charge, m is the electron rest mass, V a is the line voltage of each element, and d is the gap distance of each element. F e (Y) is an artificial function which reflects the threshold depending on the anode current. K(t, |E|) is a function for the use of denoting the emission intensity.
Once the magnetic insulation is established, the MITL is modeled as lossless transmission line. Electron-flow current is estimated by the Mendel’s 1D steady-state MITL equation modified to account for cathode-plasma motion [Reference Stygar, Corcoran and Ives3, Reference Miller and Mendel16].

where Z 0 is the MITL impedance, d 0 is the initial MITL gap distance, vc is the average cathode plasma expansion velocity, I a is the anode current, I k is the cathode current, and c is the velocity of light in vacuum.
3.3. Model Cylindrical Reflex Triode
The cylindrical reflex triode [Reference Weber, Commisso and Engelbrecht17] is shown in Figure 5 and its circuit model is shown in Figure 6. The CRT can be regarded as two parallel bremsstrahlung electron beam diodes.
Cross-sectional view of the cylindrical reflex triode.
The circuit model of the CRT load. L diode_A (L diode_B ) is used to calculate stray inductance of the connecting part of MITLs and CRT, and its value is 4.0 nH.

When the accelerator drives a reflex triode load, the posthole convolute structure is removed, and the end of the constant gap segment of MITL is replaced by a short coaxial MITL. In the circuit model, the transmission lines numbered
 are replaced by A
c1–A
c3 (B
c1–B
c3) accordingly. In the model of CRT load, only the electron emission is considered. The TL-code model includes the effects of a finite turn-on time, the CL space charge limited current phase [Reference Child18–Reference Jory and Trivelpiece20], and the critical current phase [Reference Creedon21]. In the CL space charge limited phase (including the non-relativistic and relativistic regimes), the diode load current is related to the load voltage and geometric parameters, which is given by the following equation:
are replaced by A
c1–A
c3 (B
c1–B
c3) accordingly. In the model of CRT load, only the electron emission is considered. The TL-code model includes the effects of a finite turn-on time, the CL space charge limited current phase [Reference Child18–Reference Jory and Trivelpiece20], and the critical current phase [Reference Creedon21]. In the CL space charge limited phase (including the non-relativistic and relativistic regimes), the diode load current is related to the load voltage and geometric parameters, which is given by the following equation:
where A
T
is the emission area of a single diode, A
T
= 2π
r
A
(
 + 2d), r
A
is the radius of the tantalum anode, w is the axial width of the cathode, d is the effective AK gap, d = d
0 − vd · Δt, d
0 is the initial AK gap, vd is the cathode plasma closure velocity, and γ is the electron relativistic mass factor, which equals 1 + eV
load/mc2.
+ 2d), r
A
is the radius of the tantalum anode, w is the axial width of the cathode, d is the effective AK gap, d = d
0 − vd · Δt, d
0 is the initial AK gap, vd is the cathode plasma closure velocity, and γ is the electron relativistic mass factor, which equals 1 + eV
load/mc2.
When the self-magnetic field becomes significant at high voltage, the critical current can be expressed as follows:

The scaling factor α is assumed to be 1.5 here, as this value provides a good fit to the PIC simulations in previous studies [Reference Swanekamp, Commisso, Cooperstein, Ottinger and Schumer22]. And a fit function is used for transition from the SCL phase to the critical current phase as follows [Reference Swanekamp, Commisso, Cooperstein, Ottinger and Schumer22]:

The impedance of the CRT is given by the following equation:

3.4. Model Z-Pinch Load
The posthole convolute, inner-MITL, and a Z-pinch load are shown and their circuit models are shown in Figure 7.
(a) Cross-sectional view of the posthole convolute, inner MITL, and a z-pinch load [Reference Spielman, Froula and Brent9, Reference Spielman and Reisman10]; (b) the circuit model of the z-pinch load. L PHC and L inner are the inductance of PHC and inner MITL and are assumed to be 1.0 nH and 1.21 nH, respectively.
A typical 0-D imploding shell model is used to model the Z-pinch load [Reference Liberman, Groot, Toor and Spielman23]. The radius of the imploding plasma r(t) is given by the following equation:

where l is the length of the wire, m is the total load mass, I(t) is the load current, and μ 0 is the permeability of vacuum.
The circuit element L load in Figure 7 is therefore modeled as a time-dependent inductance.

where r 0 is the initial radius of wire and L 0 is the initial inductance of load.
3.5. Figure of Merit of MITL
The MITL figure of merit E/cB (the dimensionless ratio of the local electric field to the local magnetic field) can be expressed as follows [Reference Spielman and Reisman10].

where Z
r
is the operating impedance and Z
r
= V
a
/I
a
. Z
vac is the geometric impedance. Z
flow is the electrical flow impedance, and Z
flow = V
a
/(
 ) ^ 0.5. I
f
is the electron flow current, I
f
= I
a
− I
c
.
) ^ 0.5. I
f
is the electron flow current, I
f
= I
a
− I
c
.
4. MITL Performance for CRT Loads
At the charge voltage of ±80 kV, the accelerator stores up 265 kJ of electrical energy. The electrical parameters of the A-level diode are shown in Figure 8; when the radius of the tantalum anode is 0.18 m, the axial width of the cathode is 0.01 m and vd is 2 × 10⁴ m/s. It is seen that as the initial AK gap d 0 changes from 5 mm to 8 mm, the peak load voltage increases from 0.6 MV to 0.9 MV, and the peak load current decreases from 1.1 MA to 0.8 MA. At the time of peak load voltage (∼285 ns), the impedance of the A-level diode increases from 0.59 Ω to 1.20 Ω.
The influence of the load impedance on the A-level diode parameters: (a) load voltage and (b) load current.

In Figure 9, the electron current loss of each segment of the A-level MITL were plotted out. Results show that the loss current is sensitive to the MITL gap, and the largest loss current appears at the innermost segment in the constant-impedance MITL (A i16), which has the highest electric field and firstly exceeds the emission threshold and emits electrons. Overall, the electron emission occurs at the joint position of the constant-impedance segment and the constant-gap one and then expands toward the upstream and downstream. When the load initial gap d 0 is equal to 5 mm (load impedance of A-level is 0.59 Ω), the peak value of total loss current I all of A-level MITL is about 67 kA, and the duration is only about 7 ns. As the initial AK gap d 0 increases to 8 mm (R load_A increase to 1.20 Ω), the magnitude and duration of I all are about 130 kA and 12 ns, respectively.
(a) Electron current loss in each segment of the A-level MITL when d 0 = 5 mm and R load_A = 0.59 Ω. (b) Comparison of total loss current when driving different load impedances. The total loss current I all is calculated from the sum of the electron-loss current of the segment A i1∼A c3.

Once the magnetic insulation was established, the electrons emitting from the cathode no longer arrive at the anode, and it propagates downstream in the sheath electron flow that is close to the cathode surface. Accordingly, the electron loss becomes zero. In Figure 10, the vacuum electron flow currents of each MITL segment of A-level MITL were plotted out. The largest vacuum electron flow current is on the outermost segment in the constant-impedance MITL (A i1) and decreases along the direction of the power flow. The flow current reaches its maximum value quickly and decreases gradually with time, which is mainly due to the rapid increase of the load current. It is seen that when d 0 is set to 5 mm, the electron flow of the segment A i1, A i8, and A i16 decreases to zero at 280 ns, 315 ns, and 350 ns, respectively, because the electric field in the MITL gap is smaller than the electron emission threshold. As the gap d 0 increases to 8 mm (load impedance of A-level increase from 0.59 Ω to 1.20 Ω), the maximum flow current increases from 60 kA to 115 kA.
Time history of the electron flow currents in each segment of A-level MITL (CRT load). (a) d 0 = 5 mm and R load_A = 0.59 Ω. (b) d 0 = 6 mm and R load_A = 0.78 Ω. (c) d 0 = 7 mm and R load_A = 0.98 Ω. (d) d 0 = 8 mm and R load_A = 1.20 Ω.

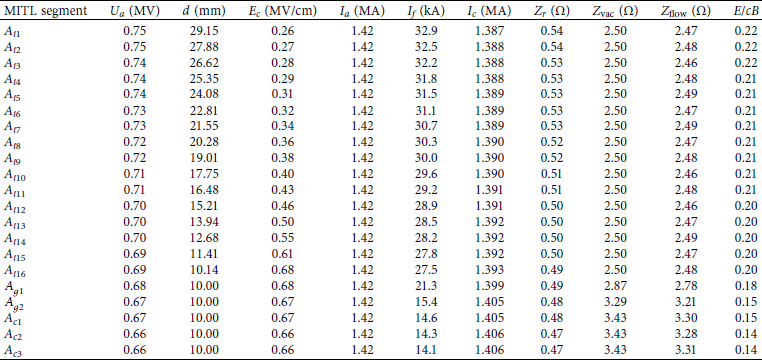
Table 1 gives the electrical parameters of the MITL at the time of peak MITL voltage (275 ns) when the accelerator drives a CRT load (d 0 = 5 mm and R load_A = 0.59 Ω). The line voltage decreases and cathode current increases with decreasing radius; thereby, the ratio E/cB gradually decreases in the direction of power flow. This implies that the quality of magnetic insulation is slowly improved. The range of the ratio E/cB is 0.22∼0.14, which is similar to the one of B-level MITL of the Z-15 driver (0.234∼0.146) [Reference Spielman and Reisman10].
5. MITL Performance for Z-Pinch Loads
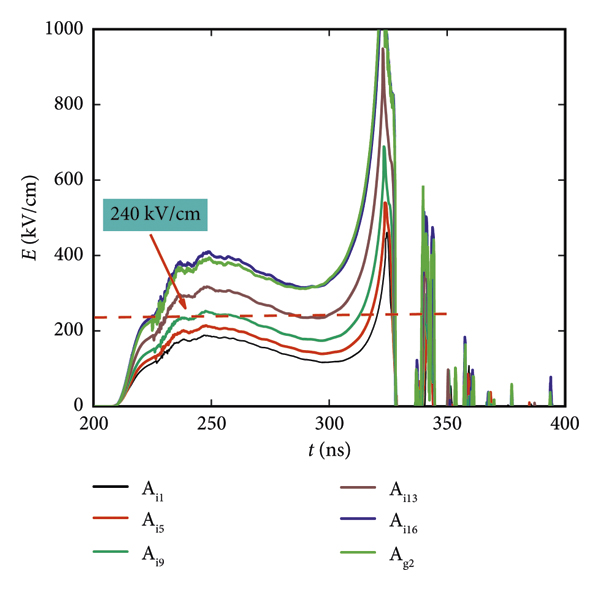
The Z-pinch load used in the simulation is a wire array with an initial radius of 1.2 cm, a length of 1.5 cm, and the mass of 0.3 mg/cm. The simulation uses a convergence ratio of 10 : 1 to estimate the maximum implosion velocities and kinetic energies. As shown in Figure 11, the insulator stack is going to hold off a peak voltage of ∼0.9 MV, and the peak load current is ∼4.2 MA. The A- and B-level voltages and currents reflect their different vacuum inductances in the MITL and PHC. The voltage and electric field waveform have a spike at 320 ns, which indicates the moment of stagnation. The electric field of the A-level outer-MITL elements is shown in Figure 12.
Calculated A-level and B-level stack voltage, A-level and B-level stack current, and total current.

Calculated electric field in each segment of the A-level MITL (l = 1.5 cm, r 0 = 1.2 cm, and m = 0.3 mg/cm).

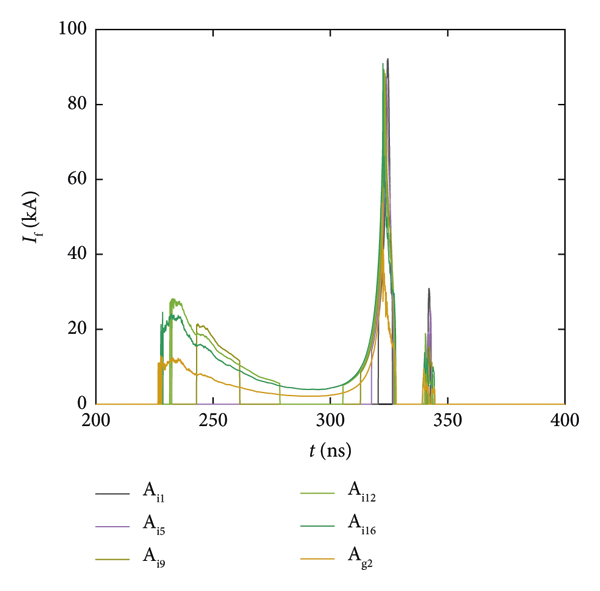
The electron current losses prior to magnetic insulation are negligible because the duration of the magnetic insulation setup is nearly zero due to the large MITL current. As shown in Figure 13, the waveform of the electron flow resembles saddle shape, whose amplitude rises up first, then it goes down, and then increases again. The electron flow ultimately reaches the peak at the pinch stagnation time. The flow current of the downstream element is smaller than that of the upstream element. The maximum electron current flow is about 92 kA in the A-level MITL at the stagnation time.
Time history of the electron flow currents in each MITL segment of A-level MITL as functions of time (Z-pinch load).

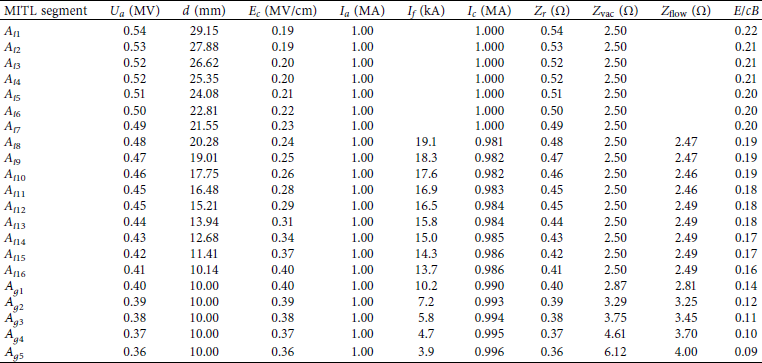
Table 2 gives electrical parameters of the MITL at the time of peak MITL voltage (250 ns) when accelerator drives a Z-pinch load. The value of I f and Z flow of A i1–A i7 segments are blank because the electric field on the cathode is lower than the electron emission threshold (refer to Figure 12) in these regions. And the range of the ratio E/cB is 0.22∼0.09.
6. Comparison of MITL Performance for Two Loads
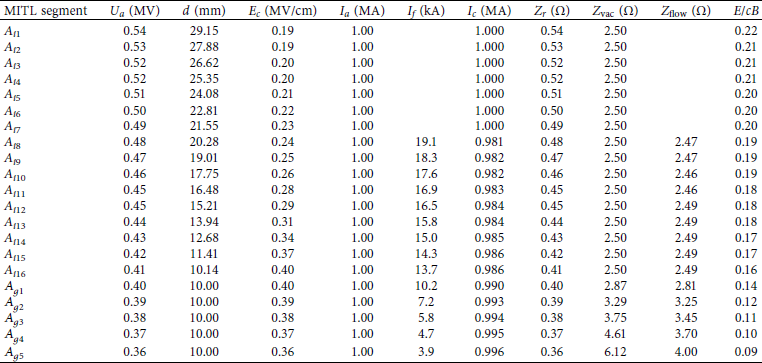
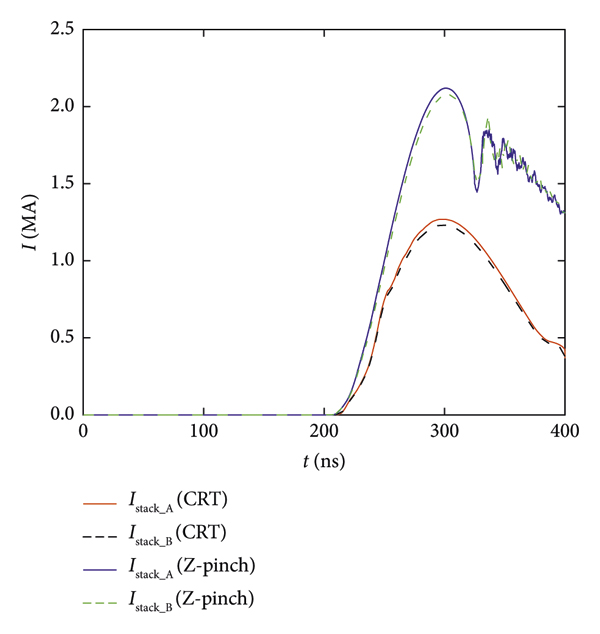
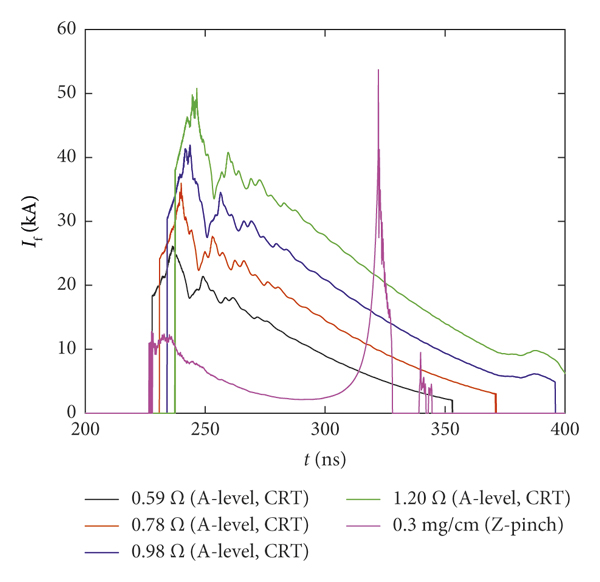
At the same charge voltage of ±80 kV, the comparison of the stack voltage is shown in Figure 14, and the comparison of the stack current is shown in Figure 15. The waveform of the electron flow current of
 segment is shown in Figure 16. It is seen that when the 5-MA accelerator drives a high impedance CRT load in the rising phase of the load current, the amplitude of the flowing current is about 5 times that of the z-pinch load, while in the falling phase of the load current, it is only 0.5 times that of the z-pinch load. The maximum value of flow current at the end of A-level MITL when driving the 1.20 Ω diode load is about 50 kA, and the maximum value of the flow current when driving the z-pinch load is about 55 kA.
Comparison of the stack voltage for the two loads. The peak voltage is about 1.14 MV when the accelerator drives the CRT load (d 0 = 8 mm, R load_A = 1.20 Ω, and R load_B = 1.22 Ω). The peak voltage is about 0.9 MV when the accelerator drives the Z-pinch load (l = 1.5 cm, r 0 = 1.2 cm, and mass = 0.3 mg/cm).
Comparison of the stack current for the two loads. The stack current of each level is about 1.3 MA when the accelerator drives the CRT load (d 0 = 8 mm, R load_A = 1.20 Ω, and R load_B = 1.22 Ω). The stack current of each level is about 2.1 MA when the accelerator drives the Z-pinch load (l = 1.5 cm, r 0 = 1.2 cm, and mass = 0.3 mg/cm).

Comparison of the electron flow currents in
 segment for the two loads.

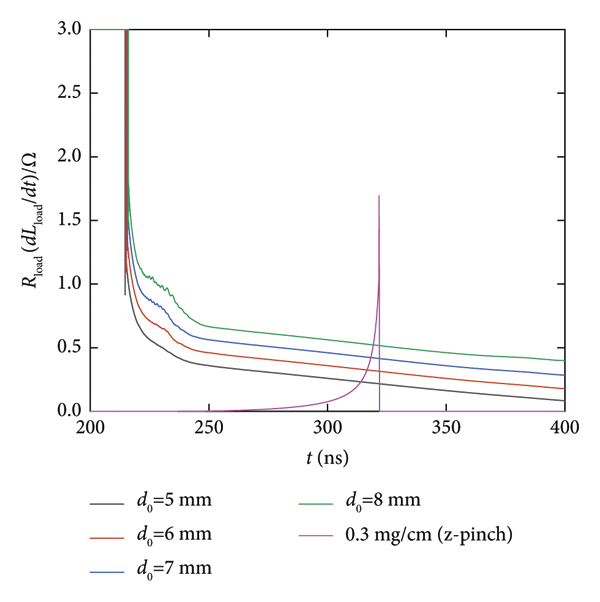
The impedance comparison of these two typical loads is shown in Figure 17. The impedance R load of the CRT gradually decreases with time. And the parallel impedance of the two-level ranges from ∼0.296 Ω to ∼0.604 Ω as the initial AK gap d 0 increases from 5 mm to 8 mm at the time of peak load voltage. However, the effective impedance of the z-pinch (defined as dL/dt) is basically zero at the initial stage and gradually increases at 275 ns. The lower load impedance results in lower MITL voltage and higher MITL current, as shown in Figures 14 and 15.
Comparison of the load impedance for the two loads. R load is the parallel value of R load_A and R load_B.

7. Conclusion
In this study, a transmission line circuit model of a two-level MITL system has been developed for a 5-MA 100-ns pulsed power driver. The MITL performance was compared when the accelerator drives cylindrical reflex triodes and Z-pinch loads. The following conclusions could be obtained.
-
(1) When the accelerator drives a cylindrical reflex triode load, the total electron current loss prior magnetic insulation is about 130 kA, the duration of the magnetic insulation setup is about 12 ns when the load impedance of a single level is ∼1.20 Ω; the maximum flow current is about 50 kA in the end of the MITL and its amplitude decreases gradually after the steady magnetic insulation is established.
-
(2) When the accelerator drives a Z-pinch load, the duration of the magnetic insulation setup is nearly zero; the maximum electron flow current can reach about 55 kA in a single MITL level and the waveform of the electron flow functioning as time resembles a saddle shape, which reaches the peak at the pinch stagnation time.
Generally, the MITLs system described herein can efficiently drive Z-pinch and electron beam loads with a small fractional of current loss; further investigations will be made to optimize the performance of the whole accelerator when the current level is raised in the future.
Data Availability
The data used to support the findings of this study are available from the corresponding author upon request.
Conflicts of Interest
The authors declare that they have no conflicts of interest.
Acknowledgments
This work was supported by the National Natural Science Foundation of China (Grant nos. 51790524 and 11975186).


 Open access