


Introduction
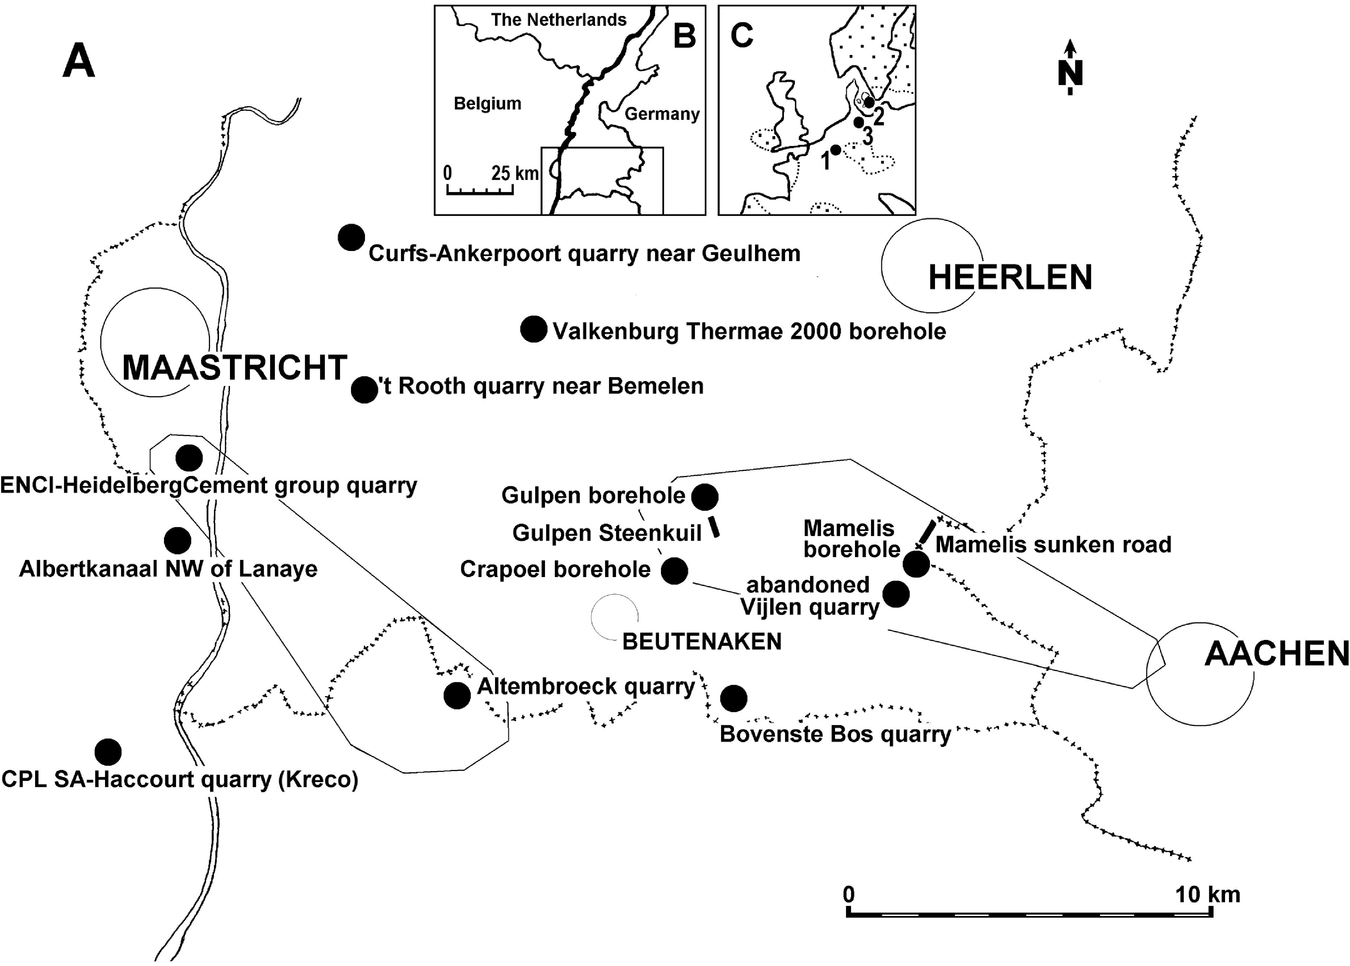
From 1963 to 2009 P.J. Felder sampled and evaluated dozens of samples from outcrops and drillings in the Maastrichtian type area (Fig. 1) and studied them for their bioclast content (e.g. Felder & Jagt, Reference Felder and Jagt1992; Jagt et al., Reference Jagt, Deckers, Dhondt, Dortangs, Felder, Felder, Jäger, Keutgen, Kuypers, Michels, Reynders, Simon, Van der Ham, Van Knippenberg and Van Neer1995; Felder, Reference Felder1997a, Reference Felder2001, Reference Felder2008). The frequency distribution of bioclasts was combined with the chronostratigraphic classification based on the belemnite research of Schmid (Reference Schmid1959), the foraminifer stratigraphy of Hofker (Reference Hofker1966) and the lithostratigraphy of Felder (Reference Felder, Zagwijn and Van Staalduinen1975) representing the basis of the current knowledge of the Upper Cretaceous in this region. It turned out that especially the bioclast content enabled a correlation of sections in several different outcrops in the Maastricht and Belgian Campine areas.
(A) The type area of the Maastrichtian Stage. The marked areas between Aachen and Gulpen and between Altembroeck and Lanaye indicate the approximate extension of the channel systems of Felder (Reference Felder1997a), in which the Vijlen Member is most completely preserved: (B) adjacent regions; (C) location of the type area (1), the Stevns-1 borehole in eastern Denmark (2) and KronsmoorHemmoor, northern Germany (3).
The present author contributed mainly to belemnite research, because of the biostratigraphic potential of these cephalopods (Keutgen & Van der Tuuk, Reference Keutgen and Van der Tuuk1991; Keutgen, Reference Keutgen1997, Reference Keutgen, Jagt, Jagt-Yazykova and Schins2011; Keutgen & Jagt, Reference Keutgen and Jagt1998; Keutgen et al., Reference Keutgen, Jagt, Felder and Yazykova2010). The identified belemnite species of the Vijlen Member seemed to contradict the correlation of selected outcrops in the Maastricht area by bioclasts. Later, it became evident that reworking of belemnites represents a common phenomenon in the Vijlen Member (Keutgen et al., Reference Keutgen, Jagt, Felder and Yazykova2010). As a consequence, the present author became interested in P.J. Felder's bioclast approach, as it allows a more detailed and reliable correlation of sections in the Maastrichtian type area, which could be confirmed by other index fossils, e.g. inoceramids (Walaszczyk et al., Reference Walaszczyk, Jagt and Keutgen2010; Jagt & Jagt-Yazykova, Reference Jagt, Jagt-Yazykova, Jagt-Yazykova, Jagt and Mortimore2018). During the course of several discussions, P.J. Felder explained his concept to the author and forwarded the hypothesis that, due to the comparatively shallow sea in the Maastricht area, sea-level fluctuations and even Milankovitch cyclicity should be well reflected in the bioclast composition. In his pathbreaking publication (Felder, Reference Felder, Ramos-Milan and Bustillo1997b) he proved the latter hypothesis by comparing the bioclast cyclicity of the upper Lixhe and Lanaye Members with the Milankovitch-paced flint cycles identified by Zijlstra (Reference Zijlstra1994). For the present approach, Felder's (Reference Felder, Ramos-Milan and Bustillo1997b) results were adopted, in order to identify long (400 kyr) and short (100 kyr) eccentricity cycles in the Maastrichtian of its original type area based on the extensive raw data collection published by P.J. Felder in several papers (Felder & Jagt, Reference Felder and Jagt1992; Jagt et al., Reference Jagt, Deckers, Dhondt, Dortangs, Felder, Felder, Jäger, Keutgen, Kuypers, Michels, Reynders, Simon, Van der Ham, Van Knippenberg and Van Neer1995; Felder, Reference Felder1997a, Reference Felder2001, Reference Felder2008).
With the exception of Felder et al. (Reference Felder, Keppens, Declercq, Normand and Streel2003), P.J. Felder did not follow up his approach relating bioclasts to Milankovitch cyclicity. In his last published, summarising article (Felder, Reference Felder2001) he described several bioclast profiles from various formations and members in the Maastricht and Belgian Campine areas with their respective type localities, followed by a discussion and definition of bioclast ecozones. These bioclast ecozones were compared with the international subdivision of the Late Cretaceous, focusing on eustatic sea-level changes and, thus, integrating the Upper Cretaceous sediments (Santonian to Maastrichtian) in the Netherlands, northern Belgium and western Germany into the international chronostratigraphic scheme, the latter results first being published in Felder (Reference Felder1996). In his to date unpublished manuscript (Felder, Reference Felder2008), P.J. Felder summarised his c.50 years of research in the extended Maastrichtian type area. This manuscript is here made available online in the NJG supplementary material repository (https://doi.org/10.1017/njg2018.15) in the original version given to the present author as a personal copy in 2008. The review of P.J. Felder consisted of an overview of lithological units and bioclast as well as ecological zones. However, the boundaries of the complicated lithological classification of the Upper Cretaceous did not always correspond to P.J. Felder's classification by bioclasts. Nevertheless, Felder (Reference Felder2008) suggested maintaining the lithological classification in the bioclast division and, based on several essential profiles, correlating the bioclast profiles with the established lithological scheme.
In his publications, P.J. Felder considered sea-level changes and, as a consequence, also hiatuses in the sedimentation for tying the Upper Cretaceous deposits in the Maastrichtian type area with the eustatic curve of RGD & NOGEPA (1993). Due to the generally relatively shallow-water environment during the sedimentation of the Upper Cretaceous deposits in the Maastricht region, especially smaller hiatuses represent a common phenomenon. These could potentially represent a challenge for the astronomical calibration of the deposits in the Maastrichtian type area. As a matter of fact, the most reliable interpretation to date is based on the astronomical calibrations of Zijlstra (Reference Zijlstra1994), Zijlstra et al. (Reference Zijlstra, Brouwers, Brinkhuis, De Boer, Brinkhuis and Smit1996) and Schiøler et al. (Reference Schiøler, Brinkhuis, Roncaglia and Wilson1997), who linked the short-term cyclicity of sediments (in centimetre scale) to 20 kyr precession cycles. They identified seven 20 kyr cycles between the K/Pg boundary (i.e. the Berg en Terblijt Horizon) and the Caster Horizon (base of the Meerssen Member), and another seven between the latter and the Laumont Horizon (base of the Nekum Member). A further twenty 20 kyr cycles occur between the Laumont and Lichtenberg horizons (base of the Valkenburg Member and Maastricht Formation), 20 between the Lichtenberg and Nivelle horizons (base of the Lanaye Member) and 55 in the underlying Lixhe 1–3 members (Fig. 2). For the Vijlen Member, no data are currently available. In view of the fact that the base of the upper Maastrichtian is placed in the uppermost Vijlen Member (Jagt & Jagt-Yazykova, Reference Jagt, Jagt-Yazykova, Jagt, Donovan and Jagt-Yazykova2012), Zijlstra's astronomical calibration would imply that the upper Maastrichtian lasted slightly longer than 2.2 Ma, assuming no major hiatuses. In comparison, the duration of the upper Maastrichtian of the Danish reference core Stevns-1 amounted to c.2.8 Ma (Surlyk et al., Reference Surlyk, Rasmussen, Boussaha, Schiøler, Schovsbo, Sheldon, Stemmerik and Thibault2013), which is about 20% longer, indicating the presence of considerable hiatuses in the Maastrichtian type section, and not considering differences in the definitions of the lower/upper Maastrichtian boundary in both sections, which would lead to further increase of the discrepancy. For the present study, the challenge of smaller hiatuses was approached, firstly, by comparing the identified long (400 kyr) and short (100 kyr) eccentricity cycles with the 20 kyr precession cycles of Zijlstra (Reference Zijlstra1994), Zijlstra et al. (Reference Zijlstra, Brouwers, Brinkhuis, De Boer, Brinkhuis and Smit1996) and Schiøler et al. (Reference Schiøler, Brinkhuis, Roncaglia and Wilson1997), which allowed the identification of ‘incomplete’ short eccentricity cycles and, as a consequence, of hiatuses in the range of one to few (four or less) precession cycles. However, the duration of larger hiatuses of more than 100 kyr could only be identified by a biostratigraphic age assessment. For this purpose the first (FADs) and last appearance dates (LADs) of dinoflagellate and calcareous nannofossil index species (Sissingh, Reference Sissingh1977; Van Heck, Reference Van Heck1979; Verbeek, Reference Verbeek1983; Robaszynski et al., Reference Robaszynski, Bless, Felder, Foucher, Legoux, Manivit, Meessen and Van der Tuuk1985; Schiøler et al., Reference Schiøler, Brinkhuis, Roncaglia and Wilson1997; Slimani, Reference Slimani2001) were compared with those in an established key section for the Boreal Maastrichtian, the Stevns-1 core in Denmark.
Local lithostratigraphic subdivision of Upper Cretaceous strata (after Jagt, Reference Jagt1999, fig. 2; modified after Felder, Reference Felder1997a, and Jagt et al., Reference Jagt, Felder, Dortangs, Severijns, Brinkhuis and Smit1996) with indication of horizons (right side of the members) separating the various members and, if applicable, subunits. In addition, the here identified 400 kyr eccentricity cycles Ma 1–Ma 12 are given for the Maastrichtian stage (cf. Surlyk et al., Reference Surlyk, Rasmussen, Boussaha, Schiøler, Schovsbo, Sheldon, Stemmerik and Thibault2013).

The 456.1 m deep Stevns-1 core is an excellent standard reference for the Maastrichtian Stage in the Boreal Realm of the Danish Basin and penetrated 12.8 m of lower Danian bryozoan limestone and 443.3 m of upper Campanian–Maastrichtian chalk. It provides an eminent expanded stratigraphic and climatic record of the end of the Cretaceous Period (Thibault et al., Reference Thibault, Harlou, Schovsbo, Schiøler, Minoletti, Galbrun, Lauridsen, Sheldon, Stemmerik and Surlyk2012a, Reference Thibault, Anderskouv, Bjerager, Boldreel, Jelby, Stemmerik and Surlyk2015; Surlyk et al., Reference Surlyk, Rasmussen, Boussaha, Schiøler, Schovsbo, Sheldon, Stemmerik and Thibault2013; Boussaha et al., Reference Boussaha, Thibault and Stemmerik2016). It is documented with carbon isotope stratigraphy, gamma-ray logging, calcareous nannofossil and dinoflagellate biostratigraphy. In addition, its correlation by carbon isotopes with the ODP Site 762C (Indian Ocean) and the Gubbio sections (Italy) provides a chronostratigraphic framework (Voigt et al., Reference Voigt, Friedrich, Norris and Schönfeld2010, Reference Voigt, Gale, Jung and Jenkyns2012; Thibault et al., Reference Thibault, Harlou, Schovsbo, Schiøler, Minoletti, Galbrun, Lauridsen, Sheldon, Stemmerik and Surlyk2012a,Reference Thibault, Husson, Harlou, Gardin, Galbrun, Huret and Minolettib).
The purpose of the present study is to take P.J. Felder's concept of relating fluctuations of bioclast frequency with Milankovitch cyclicity for the Maastrichtian deposits in the Maastrichtian type area and to establish numerical ages. Felder (Reference Felder, Ramos-Milan and Bustillo1997b) concluded that his bivalve intervals (Bivalvia) corresponded to 100 kyr short eccentricity cycles, and his smaller bivalve units with 20 kyr precession cycles. Sea lily intervals (Crinoidea) were found to be of a different nature, having been influenced by 40 kyr obliquity cycles (Felder, Reference Felder, Ramos-Milan and Bustillo1997b). It follows from his observations that bivalve, echinoderm and crinoid bioclasts can be used to identify Milankovitch cycles in the Maastrichtian strata. The present study aims at coupling these cycles with absolute numerical ages. To achieve this goal, the bioclast raw data of selected sections published by Felder (Felder & Jagt, Reference Felder and Jagt1992; Jagt et al., Reference Jagt, Deckers, Dhondt, Dortangs, Felder, Felder, Jäger, Keutgen, Kuypers, Michels, Reynders, Simon, Van der Ham, Van Knippenberg and Van Neer1995; Felder, Reference Felder1997a, Reference Felder2008) were combined and reinterpreted with respect to their potential to reflect Milankovitch rhythmicity. The resulting model of the Maastrichtian deposits in the Maastrichtian type region was compared with the Stevns-1 borehole and aspects related to sea-level fluctuations, sequence boundaries, and climate change during the Maastrichtian Stage are discussed. In addition to the dinoflagellate and calcareous nannofossil stratigraphy published for the Maastricht area, information on benthic foraminifers, ammonites, belemnites, and inoceramids is also provided.
Background and approach
P.J. Felder collected and analysed bioclasts (size class 1.0–2.4 mm) between 1963 and 2009. The method of bioclast collection and assessment was described in detail by Felder (Reference Felder1981). For the present study the idea of Felder (Reference Felder, Ramos-Milan and Bustillo1997b) to relate bioclasts to orbital forcing was taken and, based on his extensive data collection published in a series of papers (Felder & Jagt, Reference Felder and Jagt1992; Jagt et al., Reference Jagt, Deckers, Dhondt, Dortangs, Felder, Felder, Jäger, Keutgen, Kuypers, Michels, Reynders, Simon, Van der Ham, Van Knippenberg and Van Neer1995; Felder, Reference Felder1997a, Reference Felder2001, Reference Felder2008), was applied to the deposits in the Maastrichtian type area. The interpretation of the bioclasts with respect to Milankovitch cyclicity is based primarily on the relative frequency of bivalve (Bivalvia) and echinoderm clasts (Echinodermata), which usually respond in opposite ways: a bivalve maximum corresponds to an echinoderm minimum and vice versa. This was first observed by Felder & Bless (Reference Felder and Bless1994) for strata assigned to the Vijlen Member in its type area. The fact that portions of the Vijlen Member that were rich in pebbles and glauconite were virtually restricted to the bivalve-dominated levels led those authors to conclude that these levels were indicative of a relatively high-energy environment, while the echinoderm-dominated levels formed in a comparatively low-energy setting. Felder & Bless (Reference Felder and Bless1994) linked the high-energy deposits to a relatively shallow-water, nearshore facies, favouring bivalve over echinoderm clasts, or vice versa, in case of deeper, more offshore waters. However, Felder (Reference Felder, Ramos-Milan and Bustillo1997b) not only considered these changes in bioclast composition to reflect sea-level fluctuations, but also proposed a relationship to Milankovitch cyclicity. In this case, the astronomical cycles preserved in bivalve and echinoderm bioclasts had their origin in storm intensity mediated through temperature fluctuations. Variations in storm intensity, especially in a nearshore, relatively shallow-water setting such as the one represented in the Maastrichtian type area, should leave their mark on the seafloor ecosystem (Fig. 3). Thus, Felder (Reference Felder, Ramos-Milan and Bustillo1997b) in a certain way anticipated the statement of Zachos et al. (Reference Zachos, Pagani, Sloan, Thomas and Billups2001) that eccentricity of Milankovitch cyclicity affects climate by modulating the amplitude of precession and thus influencing the total annual as well as the seasonal solar energy (temperature) budget.
Schematic illustration indicating the relationship between Milankovitch cyclicity and bioclast cycles based on the relationship of bivalve and echinoderm clasts, linking eccentricity and precession with the total annual and seasonal solar energy (temperature) budget that affects storm intensity.

The bivalve/echinoderm bioclast intervals are here also compared to parasequences, i.e. shallowing-upward sedimentary cycles. As such, each interval should start with a deeper environment (in the ideal case dominated by echinoderms) and be terminated at the top by deposits that reflect a higher-energy depositional environment (dominated by bivalves). Therefore, a relative bivalve maximum (or, alternatively, an echinoderm minimum) is considered to constitute the lower boundary of a bioclast interval (Fig. 3). Making use of Felder's (Reference Felder, Ramos-Milan and Bustillo1997b) original concept, the lower boundary of Felder's bioclast interval would correspond to a relatively deeper (in tendency), low-energy environment, being characterised by an echinoderm maximum. This concept is not followed here. The present approach – using a bivalve maximum or echinoderm minimum as the lower boundary – was chosen to allow easier comparison between bioclast intervals and lithological units, because the boundary between two lithological units is frequently characterised by an abrupt change from a high- to a low-energy depositional environment. Coarse fossil-hash layers at the base of lithological units (often deposited over a cemented level and containing reworked material) that were deposited during relatively high-energy conditions are consequently interpreted as representing the initial phase of a significant sea-level rise. It should be mentioned that bivalve/echinoderm bioclast and lithological boundaries do not necessarily correspond. For example, it is possible that the upper portion of a parasequence is reworked and included in the lowermost portion of the overlying sequence (e.g. in case of a fossil-hash layer), resulting in the observation that the base of a bioclast-identified sequence is either below or slightly above a lithological boundary.
In addition to bivalve and echinoderm bioclast intervals, sea lily intervals (Crinoidea) are influenced by orbital forcing. Although crinoids represent part of the echinoderm clasts (and consequently are affected by eccentricity as well), they are seemingly more influenced by the 40 kyr obliquity cycles rather than by the 100 kyr short eccentricity and 20 kyr precession cycles (Felder, Reference Felder, Ramos-Milan and Bustillo1997b). Consequently, their frequency should depend less on temperature fluctuations and variation in storm intensity. As a matter of fact, all crinoids are semi-passive suspension feeders, which do not generate their own filtration current, but rely on extrinsic water movement (Jagt, Reference Jagt2000b). Hence, variations in frequency distribution of crinoids may reflect varying nutrient availability, which depends on the influx of nutrient-rich water. Consequently, changes in the frequency distribution of crinoids could reflect changes in precipitation and weathering of the nearby land masses because of global climate change. In summary, productivity changes of crinoids should follow terrestrial runoff in combination with soil erosion. According to Zachos et al. (Reference Zachos, Pagani, Sloan, Thomas and Billups2001) obliquity of Milankovitch rhythmicity refers to the tilt of Earth's axis relative to the plane of the ecliptic. A high angle of tilt increases the seasonal contrast, is most effective at high latitudes, determines the latitudinal distribution of insolation, and is likely a significant factor in day-to-day temperature, wind and precipitation activity. Water and wind, however, are the two primary causes of soil erosion. These considerations confirm the impact of obliquity on soil erosion and terrestrial runoff and relate it to the feeding pattern typical of crinoids.
As indicated by Felder (Reference Felder, Ramos-Milan and Bustillo1997b), the identification of 20 kyr precession and 40 kyr obliquity cycles requires a relatively high sampling density, which was not feasible for most of the sections studied. Consequently, only multiples of these cycles can be expected to be identifiable here. Of relevance to Milankovitch rhythmicity are the long (400 kyr) and short (100 kyr) eccentricity cycles in case of bivalve and echinoderm bioclasts. For crinoid clasts, things may be more complex. If it is assumed that 40 kyr cycles are not detectable, the 200 kyr (5 × 40 kyr) and 400 kyr cycles (long eccentricity) should be identifiable when crinoid clasts are combined with bivalve and echinoderm clasts. For the present study this limits the usability of crinoid clasts. Nevertheless, they have been included from case to case, either when their interpretation is corroborated by bivalve and echinoderm clasts, or, in a single case, when crinoid clasts represent the only available source for the interpretation of deposits.
Because the bioclast signals represent multiples of 20 kyr cycles in the case of bivalve and echinoderm clasts, and of 40 kyr cycles for crinoid clasts, it proved necessary to deduce data on sedimentation rate that are included in the sedimentary rocks studied. For the present the age estimates of Zijlstra (Reference Zijlstra1994), Zijlstra et al. (Reference Zijlstra, Brouwers, Brinkhuis, De Boer, Brinkhuis and Smit1996) and Schiøler et al. (Reference Schiøler, Brinkhuis, Roncaglia and Wilson1997) were adopted and the bivalve/echinoderm cycles as well as the crinoid cycles were related to the sedimentation rates preserved in the deposits to identify the Milankovitch short and long eccentricity cycles.
Eccentricity cycles as used in the present study are usually identified by spectral analyses, e.g. by Blackman–Tukey power spectra (Niebuhr, Reference Niebuhr2005; Voigt & Schönfeld, Reference Voigt and Schönfeld2010). Such an approach was not chosen here, because the relatively nearshore deposits in the Maastrichtian type area are characterised by frequent facies changes, variable depositional rates (including sediment winnowing and reworking) and the occurrence of hiatuses of varying duration, which would put limitations on reliable statistical identification. Rather, it is hypothesised here that higher-order cycles should have resulted in more distinct bioclast signals. Assuming a stable sea level (and ignoring the fact that movements of blocks along faults potentially influenced locally the depositional environment), bivalve peaks linked to long eccentricity should be more pronounced in tendency than those affected by short eccentricity only, and, in addition, might be indicated by a complete 400 kyr crinoid interval. The advantage of an approach that focuses only on the identification of eccentricity cycles is that smaller hiatuses related to precession can be ignored or identified as parts of a short eccentricity cycle. In addition, the duration of a larger hiatus may be estimated by its identification as part of a long eccentricity cycle. This means, for example, if the data of Zijlstra (Reference Zijlstra1994), Zijlstra et al. (Reference Zijlstra, Brouwers, Brinkhuis, De Boer, Brinkhuis and Smit1996) and Schiøler et al. (Reference Schiøler, Brinkhuis, Roncaglia and Wilson1997) indicate that the sediments covered by a bivalve/echinoderm cycle represent 80 kyr, then this bioclast cycle corresponds to a short eccentricity cycle of 100 kyr, however, including a hiatus of a 20 kyr precession cycle. In case of an even greater hiatus, as, for example, indicated by the boundary between the Maastricht and Gulpen formations (i.e. the Lichtenberg Horizon), fixed points with known absolute numerical ages are needed to estimate the number of missing (long) eccentricity intervals. For the Maastricht Formation such a fixed point is represented by the K/Pg boundary, which corresponds to the Berg en Terblijt Horizon in the upper Meerssen Member (top of IVf-6; Jagt & Jagt-Yazykova, Reference Jagt, Jagt-Yazykova, Jagt, Donovan and Jagt-Yazykova2012) and is dated at 66.0 Ma (Husson et al. Reference Husson, Galbrun, Laskar, Hinnov, Thibault, Gardin and Locklair2011; Surlyk et al., Reference Surlyk, Rasmussen, Boussaha, Schiøler, Schovsbo, Sheldon, Stemmerik and Thibault2013). For the Gulpen Formation, a fixed point is selected that is situated below the lower/upper Maastrichtian boundary as defined by Surlyk et al. (Reference Surlyk, Rasmussen, Boussaha, Schiøler, Schovsbo, Sheldon, Stemmerik and Thibault2013, figs 2 and 3) in the Danish reference core Stevns-1 by the FAD of Lithraphidites quadratus Bramlette & Martini, Reference Bramlette and Martini1964. Here, the lower/upper Maastrichtian boundary is framed by the bases of the Pervosphaeridium tubuloaculeatum ‘b’ and the Deflandrea galeata dinoflagellate zones. The base of the P. tubuloaculeatum ‘b’ Zone corresponds to the top of the Alterbidinium acutulum subzone, which is characterised by the LAD of the index species Alterbidinium acutulum (Wilson, Reference Wilson1967) Lentin & Williams, Reference Lentin and Williams1985. According to Surlyk et al. (Reference Surlyk, Rasmussen, Boussaha, Schiøler, Schovsbo, Sheldon, Stemmerik and Thibault2013), this index species disappears at a depth of 190.55 m in the Stevns-1 core, which is dated at c.69.2 Ma.
In the Maastricht area, the base of the Pervosphaeridium tubuloaculeatum ‘b’ dinoflagellate Zone is approximated by the LAD of Cladopyxidium verrucosum Marheinecke, Reference Marheinecke1992 and Hystrichodinium pulchrum pulchrum (Deflandre, Reference Deflandre1935) and is situated in the interval c.6.5–3.5 m below the top of the Vijlen Member at the former CPL SA-Haccourt quarry (Slimani, Reference Slimani2001). In addition, the numerical age of this level (69.2 Ma) represents a multiple of the long eccentricity cycle (66.0 Ma + 8 × 400 kyr = 69.2 Ma). At the CPL SA-Haccourt quarry, the base of one of these long eccentricity cycles is identified in the topmost Vijlen Member; the base of the next older corresponds to the Zonneberg Horizon at the base of interval 6 of the Vijlen Member. The presence of dinoflagellate index species typical of the Pervosphaeridium tubuloaculeatum ‘a’ dinoflagellate Zone above the Zonneberg Horizon indicates that the base of the long eccentricity cycle identified in the topmost Vijlen at the CPL SA-Haccourt quarry must be dated 69.2 Ma.
Finally, it should be mentioned that in the upper Gulpen Formation and in the entire Maastricht Formation characteristic horizons occur that often mark the bases of members in addition to typical surfaces within members. In the present article, the names of these horizons are also used to indicate the bases of bioclast cycles. Reference sections for bioclast-defined horizons are within the ENCI-HeidelbergCement Group quarry (Maastricht) for the Maastricht Formation, at the former CPL SA-Haccourt quarry (now Kreco) for the upper Gulpen Formation (Lixhe 1–3 and Lanaye members) and in the extended Mamelis section for the Vijlen Member (Gulpen Formation), which is nowadays totally weathered and largely covered with mud. Below, bioclast horizons are named after the corresponding lithological horizons, but names are in quotation marks so as to indicate that these horizons are not identical with the lithological horizons. Amongst others, exceptions include the Lichtenberg, Bovenste Bos and Berg en Terblijt horizons, which are here used as lithological horizons only. Lithological horizons, such as the Lichtenberg Horizon, may be strongly diachronous.
An astronomical timescale for the type Maastrichtian
Maastricht Formation
Meerssen Member
In its typical development, this unit comprises poorly indurated, white-yellowish, coarse- to very coarse-grained calcarenites with clearly developed hardgrounds and fossil-hash layers. Its thickness ranges from c.15 to 20 m. One of the classic exposures of this unit is the former Curfs quarry near Geulhem, southern Limburg, the Netherlands (Fig. 1), where seven lithological units, IVf-1 to IVf-7 (Fig. 4), have been distinguished. The Berg en Terblijt Horizon, which equates with the K/Pg boundary, defines the top of subunit IVf-6 (Jagt & Jagt-Yazykova, Reference Jagt, Jagt-Yazykova, Jagt, Donovan and Jagt-Yazykova2012). Around this horizon, the bioclast composition does not change considerably, illustrating that there is no major hiatus.
Lithology and bioclast contents for the Maastricht Formation (Emael, Nekum and Meerssen members) and Houthem Formation (Geulhem Member) at the former Curfs quarry near Geulhem (sources: Felder & Jagt Reference Felder and Jagt1992, figs 14, 15; Jagt et al., Reference Jagt, Felder, Dortangs, Severijns, Brinkhuis and Smit1996, fig. 7; Felder, Reference Felder2008, fig. 46). The codes Va-1 to Va-4 and IVf-1 to IVf-7 mark the lithological subunits of the Geulhem and Meerssen Members, respectively. The given numerical ages are calculated based on the results of this study. Ma 1, Ma 2 are the here identified 400 kyr long eccentricity cycles (cf. Surlyk et al., Reference Surlyk, Rasmussen, Boussaha, Schiøler, Schovsbo, Sheldon, Stemmerik and Thibault2013), which are based on 100 kyr short eccentricity cycles, identified by echinoderm minima and indicated by the given numerical ages. The reported percentages represent the percentage of the number of bioclasts belonging to a certain group in the size class 1.0–2.4 mm. The sum of all bioclasts collected from a single sample equals 100%. The fluctuations of the percentages of the three main groups Porifera/Bryozoa, Bivalvia and Echinodermata are given by solid lines; for the subgroups Ophiuroidea and Crinoidea grey and black symbols are used, indicating their contribution to the Echinodermata clasts.
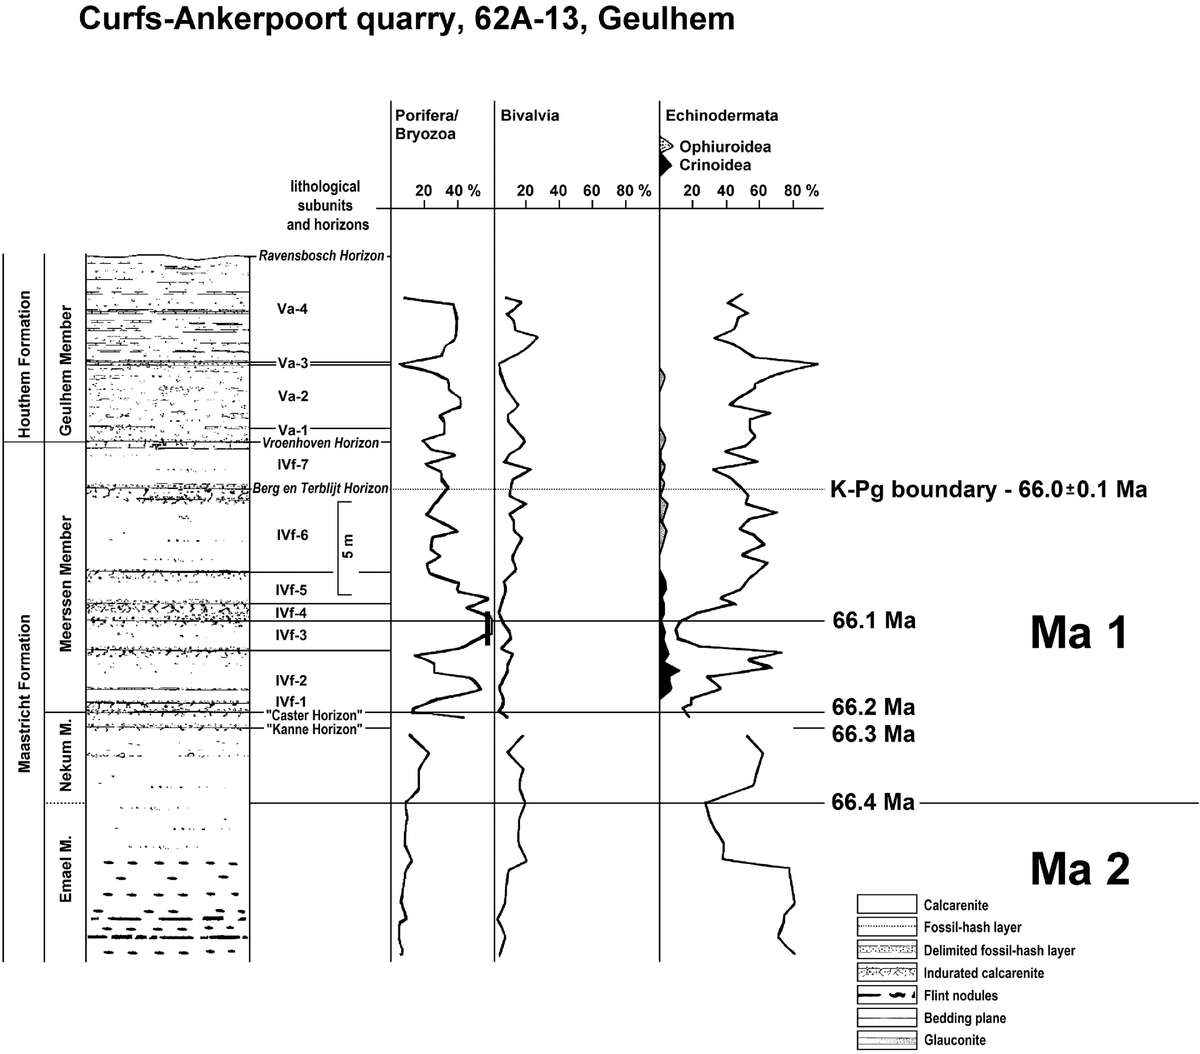
Zijlstra et al. (Reference Zijlstra, Brouwers, Brinkhuis, De Boer, Brinkhuis and Smit1996) interpreted the subunits of the Meerssen Member at the former Curfs quarry as precession cycles, with subunit IVf-6 comprising two cycles. If this interpretation is correct, the Meerssen Member covers a minimum of 8 × 20 = 160 kyr. Within this unit there are two distinct echinoderm minima: the first one close to the base of the member (Caster Horizon) and the second at the top of IVf-3. Therefore, two echinoderm intervals occur within 160 kyr, giving a mean duration of 80 kyr per interval. Assuming the presence of smaller hiatuses, this allows the hypothesis that each of the echinoderm intervals should correspond to a short eccentricity cycle (100 kyr). The lower echinoderm interval in the Meerssen Member covers subunits IVf-1 to IVf-3 (3 × 20 kyr = 60 kyr), whereas the upper corresponds to the intervals IVf-4 to IVf-7 (5 × 20 = 100 kyr). From this calculation it follows that only the lower eccentricity cycle is incompletely developed with hiatuses at the top and/or base of the cycle.
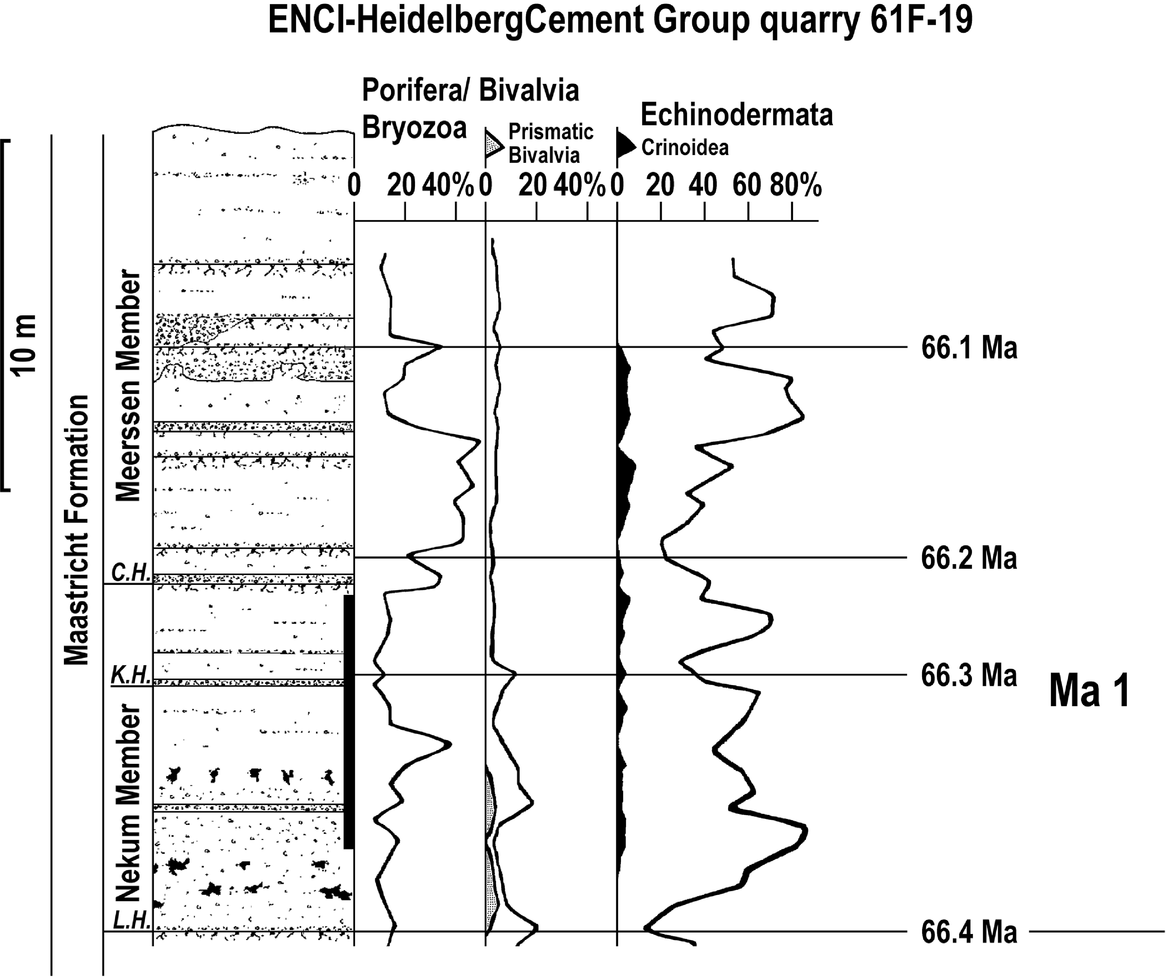
At the ENCI-HeidelbergCement Group quarry (Fig. 5) and in the Thermae 2000 borehole (Krings et al., Reference Krings, Bless, Conil, Felder and Meessen1987, fig. 8), the same echinoderm minima are recorded; however, the Berg en Terblijt Horizon is not preserved there.
Lithology and bioclast contents for the Maastricht Formation (Nekum and Meerssen members) at the ENCI-HeidelbergCement group quarry (sources: Felder & Jagt, Reference Felder and Jagt1992, fig. 9; Jagt et al., Reference Jagt, Felder, Dortangs, Severijns, Brinkhuis and Smit1996, fig. 4; Felder, Reference Felder2008, fig. 40). The given numerical ages are calculated based on the results of this study. Ma 1 is the here identified 400 kyr long eccentricity cycle, which is based on four short 100 kyr eccentricity cycles, identified by echinoderm minima and indicated by the given numerical ages. The reported percentages represent the percentage of the number of bioclasts belonging to a certain group in the size class 1.0–2.4 mm. The sum of all bioclasts collected from a single sample equals 100%. The fluctuations of the percentages of the three main groups Porifera/Bryozoa, Bivalvia and Echinodermata are given by solid lines; for the subgroups Prismatic Bivalvia and Crinoidea grey and black symbols are used, indicating their contribution to the Bivalvia and Echinodermata clasts, respectively. For the legend for lithology see Figure 4. Abbreviations: C.H., Caster Horizon (base of the Meerssen Member); K.H., Kanne Horizon; L.H., Laumont Horizon (base of the Nekum Member).
Nekum Member
This unit comprises poorly indurated, white-yellowish, coarse-grained homogeneous calcarenites, locally with fossil-hash lenses and beds. The highest flints of greyish-brown colour occur in the lower part of the member, which typically is c.7–15 m thick (Jagt & Jagt-Yazykova, Reference Jagt, Jagt-Yazykova, Jagt, Donovan and Jagt-Yazykova2012).
According to Schiøler et al. (Reference Schiøler, Brinkhuis, Roncaglia and Wilson1997) and Zijlstra et al. (Reference Zijlstra, Brouwers, Brinkhuis, De Boer, Brinkhuis and Smit1996), seven 20 kyr cycles are present between the top and the base (Laumont Horizon) of this unit; hence the duration of this member equals at least 7 × 20 = 140 kyr. Similar to the Meerssen Member, it contains two distinct echinoderm intervals (Fig. 5). The base of the lower interval corresponds to the Laumont Horizon, that of the second to the Kanne Horizon (Fig. 5). The mean duration of an echinoderm interval (70 kyr) is similar to that in the Meerssen Member, favouring the hypothesis that these intervals reflect short, probably incomplete eccentricity cycles (100 kyr).
Emael, Schiepersberg, Gronsveld and Valkenburg members
In typical development, the Emael Member consists of poorly indurated white-yellowish and yellowish-brown homogeneous calcisiltites in the lower portion, with numerous light-grey flint nodules. Total thickness varies between c.5 and c.7.5 m. The Schiepersberg Member comprises usually poorly indurated, white-yellowish homogeneous calcisiltites with numerous regular beds and randomly distributed light-grey to bluish-grey flint nodules; in a northeast direction flint disappears and the presence/thickness of fossil-hash layers gradually increases. The thickness of this member is 5–6 m. The Gronsveld and Valkenburg members comprise poorly indurated, white-yellowish to yellowish-grey calcisiltites with greyish-brown flint nodules, when present. The total thickness of the former member varies from c.4.5 to 10 m. The thickness of the latter increases from a few metres in the southwest to up to c.45 m in the northeast of the study area (Jagt & Jagt-Yazykova, Reference Jagt, Jagt-Yazykova, Jagt, Donovan and Jagt-Yazykova2012).
At the ENCI-HeidelbergCement Group quarry, bioclasts from these members indicate the presence of four echinoderm intervals, the bases of which correspond with the Lava, Schiepersberg, St Pieter and Lichtenberg horizons (Fig. 6). Like the Nekum and Meerssen members, the bases of these intervals correspond to echinoderm minima. However, these minima are not nearly as distinct as in the latter two members, at least at the ENCI quarry. Therefore, the identification of the bioclast intervals is based on the presence of the rather distinct bivalve maxima detected in the section at the ’t Rooth quarry near Bemelen (Fig. 6). According to Schiøler et al. (Reference Schiøler, Brinkhuis, Roncaglia and Wilson1997), strata between the Laumont and Lichtenberg horizons correspond to twenty 20 kyr cycles (400 kyr); hence, the four echinoderm/bivalve intervals should cover 100 kyr each, i.e. four short eccentricity cycles.
Lithology and bioclast contents for the upper Gulpen Formation (Lanaye Member) and Maastricht Formation (Valkenburg, Gronsveld, Schiepersberg, Emael, Nekum and Meerssen members) at the ENCI-HeidelbergCement group quarry and the ’t Rooth quarry near Bemelen (sources: Felder & Jagt, Reference Felder and Jagt1992, figs 8 and 9; Felder & Bosch, Reference Felder and Bosch1998, fig. 11; Felder, Reference Felder2008, figs 40 and 42). The given numerical ages are calculated based on the results of this study. Ma 1, Ma 2, Ma 3 are the here identified 400 kyr eccentricity cycles, which are based on 100 kyr eccentricity cycles, identified by echinoderm minima or bivalve maxima and indicated by the given numerical ages. Ma 1 seems to correspond also to a 400 kyr crinoid cycle, because in the sections exposed in the ENCI-HeidelbergCement group quarry and the ’t Rooth quarry crinoid clasts start occurring regularly above the Laumont Horizon. The reported bioclast percentages represent the percentage of the number of bioclasts belonging to a certain group in the size class 1.0–2.4 mm. The sum of all bioclasts collected from a single sample equals 100%. The fluctuations of the percentages of the three main groups Bryozoa (including Porifera), Bivalvia and Echinodermata are given by solid lines; for the subgroups Crinoidea and Ophiuroidea black and grey symbols are used. For the ’t Rooth quarry, the percentage of Echinodermata clasts is not available. Abbreviations: Val., Valkenburg Member; Grons./Gro., Gronsveld Member; Sch./Schieper., Schiepersberg Member. Note that the bioclast intervals (short eccentricity cycles) below the ‘St Pieter’ horizon at ’t Rooth quarry are tentative, which is why a correlation with the ENCI quarry is not indicated. 20 kyr cycles* refer to the number of precession cycles identified by Zijlstra (Reference Zijlstra1994), Zijlstra et al. (Reference Zijlstra, Brouwers, Brinkhuis, De Boer, Brinkhuis and Smit1996) and Schiøler et al. (Reference Schiøler, Brinkhuis, Roncaglia and Wilson1997).

As already recognised by Felder (Reference Felder1987), when compared with the Albertkanaal section northwest of Lanaye, it becomes clear that deposition of the Valkenburg Member started earlier at the ENCI quarry than in the Albertkanaal section (Fig. 7). In reference to bioclasts, Felder (Reference Felder2001) proposed to correlate the onset of sedimentation of the Maastricht Formation in the Albertkanaal section with the ‘ENCI’ (bioclast) Horizon as exposed at the ENCI-HeidelbergCement Group quarry, which is situated within the lower Gronsveld Member.
Lithology and bioclast contents for the upper Gulpen Formation (Lixhe 3 and Lanaye members) and lower Maastricht Formation (Valkenburg, Gronsveld, Schiepersberg and Emael members) in the Albertkanaal section northwest of Lanaye and at the ENCI-HeidelbergCement group quarry (sources: Felder & Jagt, Reference Felder and Jagt1992, figs 8 and 9; Felder, Reference Felder, Ramos-Milan and Bustillo1997b; Reference Felder2008, figs 34, 40 and 41; Felder & Bosch, Reference Felder and Bosch1998, figs 8 and 11; Reference Felder and Bosch2000, fig. 3.37). The given numerical ages are calculated based on the results of this study. Ma 2 to Ma 7 are the here identified 400 kyr long eccentricity cycles, which in case of the Maastricht Formation are based on 100 kyr short eccentricity cycles. In the Maastricht Formation, the short eccentricity cycles are identified by echinoderm minima or bivalve maxima, whereas in the Gulpen Formation echinoderm and crinoid minima mark the 400 kyr long eccentricity cycles; both are indicated by the given numerical ages. The reported bioclast percentages represent the percentage of the number of bioclasts belonging to a certain group in the size class 1.0–2.4 mm. The sum of all bioclasts collected from a single sample equals 100%. The fluctuations of the percentages of the three main groups Bryozoa (including Porifera), Bivalvia and Echinodermata are given by solid lines. For the Crinoidea subgroup a black symbol is used. For the Albertkanaal section, the percentage of Echinodermata clasts is not available. In addition, the flint layers of the Lanaye Member are numbered in order to allow an immediate comparison of the Albertkanaal and ENCI sections. For the legend for lithology see Figure 6. Abbreviations: Valk. Me., Valkenburg Member.

Differences in the onset of sedimentation above the Lichtenberg Horizon were also revealed when the section at the ’t Rooth quarry near Bemelen was compared with that at the ENCI-HeidelbergCement Group quarry (Fig. 6). Down to the base of the Gronsveld Member, the bioclast cycles at ’t Rooth are identified by distinct bivalve maxima. In contrast, the nearly 25 m thick Valkenburg Member at ’t Rooth is roughly divisible into three intervals on crinoid frequency. The duration of these intervals is difficult to establish, but a few considerations can be presented, as follows:
1. If deposition of the Maastricht Formation started earlier at ’t Rooth than at ENCI and the Albertkanaal, it may be assumed that the depositional rate of the lower Valkenburg Member did not exceed that of the Gronsveld, Schiepersberg and Emael members, but was, in tendency, either similar or smaller.
2. Assuming that there is no overlap of members of the Gulpen and Maastricht formations, the top of the Gulpen Formation is dated at 67.4 Ma (Albertkanaal section) and the base of the Gronsveld Member at 66.7 Ma (Fig. 6). Hence, deposition of the Valkenburg Member could not have exceeded 700 kyr. Assuming a maximum thickness of 45 m for that member (Jagt & Jagt-Yazykova, Reference Jagt, Jagt-Yazykova, Jagt, Donovan and Jagt-Yazykova2012), a mean depositional rate of 6.4 m per 100 kyr can be estimated. Thus, the Valkenburg Member at ’t Rooth would roughly correspond to 350–400 kyr.
Taking these considerations into account, the conservative assumption would be that deposition of the Valkenburg Member at ’t Rooth took about 300 kyr, with each of the three bioclast intervals lasting for about 100 kyr.
Gulpen Formation
Lanaye and Lixhe 1–3 members
The Lanaye Member comprises white, fine-grained chalks or calcisiltites with irregular light to dark blue-grey flint nodules (Jagt & Jagt-Yazykova, Reference Jagt, Jagt-Yazykova, Jagt, Donovan and Jagt-Yazykova2012). Its greatest thickness has been documented at the Albertkanaal northwest of Lanaye (Fig. 7), where 27 flint bands are distinguished. The total thickness amounts to c.20 m, but decreases towards the north. Albers & Felder (Reference Albers and Felder1979) noted that in the west the Lanaye Member consisted of pure biodetrital chalks, which graded into calcisiltites considered typical of the Maastricht Formation.
The Lixhe 1–3 members comprise white, fine-grained chalks or calcisiltites with irregular dark blue-grey to black flint nodules (Jagt & Jagt-Yazykova, Reference Jagt, Jagt-Yazykova, Jagt, Donovan and Jagt-Yazykova2012). For the present study, the sections exposed at the former CPL SA-Haccourt (now Kreco) and ENCI-HeidelbergCement Group quarries are discussed, because they represent the most complete and best studied to date (Fig. 8).
Lithology and bioclast contents for the upper Gulpen Formation (Vijlen interval 6, Lixhe 1–3 and Lanaye members) at the ENCI-HeidelbergCement Group and former CPL SA Haccourt (now Kreco) quarries (sources: Felder & Jagt, Reference Felder and Jagt1992, figs 3, 8 and 9; Felder & Bosch, Reference Felder and Bosch1998, figs 5–8, 11; Reference Felder and Bosch2000, figs 3.33–3.35; Felder, Reference Felder2008, figs 33 and 34). In view of the fact that the lithological section of the CPL SA quarry was not available to me, that of the nearby Dierkx quarry northwest of Lixhe has been used, since it is generally accepted that the Lixhe 1–3 and Lanaye members are almost identical at both localities, in close proximity. The given numerical ages are calculated based on the results of this study. Ma 5 to Ma 8 are the here identified 400 kyr long eccentricity cycles based on echinoderm and crinoid minima and also bivalve maxima. The reported percentages represent the percentage of the number of bioclasts belonging to a certain group in the size class 1.0–2.4 mm. The sum of all bioclasts collected from a single sample equals 100%. The fluctuations of the percentages of the three main groups Bryozoa (including Porifera), Bivalvia and Echinodermata are given by solid lines; for the subgroup Crinoidea a black symbol is used, indicating their contribution to the Echinodermata clasts. For the legend for lithology see Figure 6. Abbreviation: Vij. 6, Vijlen interval 6 Member. 20 kyr cycles* refer to the number of precession cycles identified by Zijlstra (Reference Zijlstra1994), Zijlstra et al. (Reference Zijlstra, Brouwers, Brinkhuis, De Boer, Brinkhuis and Smit1996) and Schiøler et al. (Reference Schiøler, Brinkhuis, Roncaglia and Wilson1997).

The Lixhe 1–3 and Lanaye members represent classic deposits for the application of orbital forcing for deducing sedimentation rates in the Maastricht area. Zijlstra (Reference Zijlstra1994) concluded that the chalk with flint contained 75 flint layers, with individual members containing 55 and 20 flint layers, respectively, and that flint layers formed bundles of five, suggesting that precession cycles controlled flint appearance – each flint layer representing 20 kyr – in addition to eccentricity cycles, i.e. each flint bundle of five representing 100 kyr. Consequently, the 55 flint layers of the Lixhe 1–3 members indicate that the deposition of these units took 1.1 Ma, whereas the 20 flint layers of the Lanaye Member would indicate a time frame of 400 kyr.
Felder (Reference Felder, Ramos-Milan and Bustillo1997b) demonstrated for the Lixhe 3 and Lanaye members that his bivalve intervals corresponded to 100 kyr short eccentricity cycles and his smaller bivalve units to 20 kyr precession cycles, whereas the crinoid intervals were considered to have been influenced by 40 kyr obliquity cycles. In the present study, only long eccentricity cycles (400 kyr intervals) could be identified, because of the relatively low sedimentation rate and concomitant large sampling interval in most of the sections. The lower boundaries of the bioclast intervals are usually characterised by rather distinct bivalve peaks, accompanied by equally distinct echinoderm minima. In addition, the echinoderm minima correspond to distinct crinoid minima (Figs 7 and 8).
The lowest bivalve peak is situated slightly above the Lixhe Horizon at the ENCI-HeidelbergCement Group quarry and slightly below this at the former CPL SA-Haccourt quarry (now Kreco; Fig. 8). This level is dated at 69.2 Ma, because it approximates the base of the Pervosphaeridium tubuloaculeatum ‘b’ dinoflagellate Zone. Three 400 kyr bioclast intervals occur in the Lixhe 1–3 and the lower quarter of the Lanaye Member, which would be well in line with the 55 × 20 kyr (=1.1 Ma) precession cycles identified by Zijlstra (Reference Zijlstra1994) in the Lixhe 1–3 members. For the Lanaye Member, however, the bioclasts indicate a complete 400 kyr cycle between flint levels 6 and 17 at the ENCI-HeidelbergCement Group quarry (Fig. 7). Considering the remaining nine flint layers below and above this interval, deposition of the Lanaye Member at this quarry took 400 + (9 × 20) ~ 600 kyr. At the Albertkanaal section, northwest of Lanaye, an additional five flint layers are preserved at the top of the Lanaye Member, so that it can be concluded that deposition of this member took up to 700 kyr, which is distinctly longer than the 400 kyr estimated by Zijlstra (Reference Zijlstra1994).
In the Albertkanaal section, northwest of Lanaye, the Lanaye Member contains 27 numbered flint layers (Fig. 7), which would represent 27 × 20 = 540 kyr according to Zijlstra (Reference Zijlstra1994). The difference of c.160 kyr may be indicative of hiatuses. Alternatively, it may be hypothesised that in the Lanaye Member, which is characterised in part by relatively thick flint layers, originally thinner ‘silica levels’ merged to form a thicker flint layer, leading Zijlstra (Reference Zijlstra1994) to underestimate the time represented by the Lanaye Member.
A similar mobility of silica is indicated when the positions of the ‘Lixhe’, ‘Halembaye’ and ‘Boirs’ bioclast horizons at the ENCI-HeidelbergCement Group and CPL SA-Haccourt quarries are compared with those of the nominate lithological horizons, the latter as typical flint layers that characterise the bases of the Lixhe 1–3 members (Fig. 8). At the former CPL SA-Haccourt quarry (now Kreco) the bioclast horizons are situated slightly (‘Boirs’) or distinctly (‘Halembaye’ and ‘Lixhe’) below the corresponding lithological horizons, while at the ENCI-HeidelbergCement Group quarry they occur distinctly above. Although fair coincidences of lithological and bioclast horizons indicate the applicability of both methodologies for correlation of sections in the Maastrichtian type area, this observation raises doubts over the exact correlation of flint layers. Based on the present results, it is hypothesised that, at least in some of the sections studied, silica migrated, albeit to a limited extent, through the uppermost centimetres of the seafloor prior to the formation of the characteristic flint layers. Hence, as already proposed by Felder et al. (Reference Felder, Keppens, Declercq, Normand and Streel2003), flint layers may potentially represent a secondary development and do not need to conform to primary deposition. This kind of silica migration would also easily allow the fusion of ‘silica levels’ such as proposed for the Lanaye Member, especially when depositional rates were relatively low.
Crinoid intervals are particularly distinct in the Lixhe 1–3 and Lanaye members. However, crinoid frequency may vary considerably even over relatively small distances. For instance, between 68.4 and 68.8 Ma the distribution of crinoid clasts shows a broad maximum at the former CPL SA-Haccourt quarry (now Kreco), whereas crinoids are almost missing at the ENCI-HeidelbergCement Group quarry. This special frequency pattern puts limitations on the value of crinoid clasts. The Maastricht Formation at the ENCI quarry covers c.800 kyr and thus should cover two 400 kyr crinoid intervals. Indeed, the onset of the second interval above the Laumont Horizon is relatively distinct at the ENCI and ’t Rooth quarries (Fig. 6), because crinoid clasts are very rare in the underlying Emael Member. However, identification of 400 kyr crinoid intervals in the Maastricht Formation is difficult and less clear than in the uppermost Gulpen Formation.
In the so-called ‘Aachen area’ (western Germany) and the eastern part of Dutch Limburg, the Orsbach Member is distinguished as part of the Gulpen Formation (Breddin et al., Reference Breddin, Brühl and Dieler1963). This unit comprises weakly indurated, fine-grained chalk, but also marly limestones and limestones with black flints that occur in thick bands especially in the upper portion. The relationship between the Orsbach Member and the Lixhe 1–3 and Lanaye members is not yet fully understood, but preliminary evidence favours correlation with part of the upper Lixhe and Lanaye members (Felder, Reference Felder2008). Equivalents of the lower portion of the Lixhe 1–3 complex are missing (hiatus) or might be present locally in a condensed form within the so-called Wahlwiller conglomerate, a glauconite-rich molluscan packstone with numerous quartz pebbles and comminuted fossil fragments (Jagt & Jagt-Yazykova, Reference Jagt, Jagt-Yazykova, Jagt, Donovan and Jagt-Yazykova2012), which is regarded as the base of the Orsbach Member. The Wahlwiller conglomerate covers, for example, the top of the Vijlen Member in its type locality near Mamelis.
Vijlen Member
The Vijlen Member comprises yellowish-grey, glauconitic, fine-grained chalks to marly limestones with glauconite-rich portions. Flints rarely occur in the east, but more frequently towards the west. However, they are randomly distributed, and, with the exception of the uppermost levels, never form distinct layers. Total thickness generally varies between 15 and 25 m, but may reach up to 100 m (Jagt & Jagt-Yazykova, Reference Jagt, Jagt-Yazykova, Jagt, Donovan and Jagt-Yazykova2012). The oldest portion of this unit is preserved only locally within channel-like structures (Felder, Reference Felder1997a). At the stratotype, the combined Mamelis section, consisting of the sunken road (outcrop 62D-78) and borehole sections (outcrop 62D-168), the total thickness amounts to 65–70 m. Felder & Bless (Reference Felder and Bless1994) subdivided this section into seven intervals, numbered 0 to 6.
Correlation of Vijlen deposits at different localities has been fraught with difficulties for years, due to the complex depositional history of this unit that resulted in reworking of index fossils, especially belemnites (Keutgen et al., Reference Keutgen, Jagt, Felder and Yazykova2010). It has been demonstrated by P.J. Felder that Vijlen Member intervals are best identified by a combined study of bioclasts and foraminifers (Felder & Bless, Reference Felder and Bless1994; Felder, Reference Felder1997a). According to Felder (Reference Felder1997a, Reference Felder2001), the foraminifer bioclast peaks (Figs 9 and 10) are of special importance. Twelve peaks, labelled A to L, have been distinguished. In addition, smaller foraminiferal peaks occur, which are here marked as ʹ or ʺ depending on their position below one of the main peaks, e.g. Eʹ or Eʺ, below peak E. In some cases, these subordinate peaks are considered important for correlation of sections, although they are not distinguishable in all of the sections studied.
Lithology and bioclast contents for intervals 5 (upper part) and 6 of the Vijlen Member at the CPL SA-Haccourt (now Kreco) and ENCI-HeidelbergCement Group quarries and in the type section near Mamelis (sources: Felder, Reference Felder1997a, fig. 4; Reference Felder2008, figs 23, 33 and 34; Jagt & Jagt-Yazykova, Reference Jagt, Jagt-Yazykova, Jagt, Donovan and Jagt-Yazykova2012, fig. 4). The given numerical ages are calculated based on the results of this study. Ma 9, Ma 10 are the here identified 400 kyr long eccentricity cycles based on bivalve maxima. The reported percentages represent the percentage of the number of bioclasts belonging to a certain group in the size class 1.0–2.4 mm. The sum of all bioclasts collected from a single sample equals 100%. The fluctuations of the percentages of the three main groups Foraminifera, Bivalvia and Echinodermata are given by solid lines; for the subgroup Crinoidea a black symbol is used, indicating their contribution to the Echinodermata clasts. Echinodermata clasts are not available for the CPL SA-Haccourt and ENCI quarries. The letters H to L indicate foraminifer peaks as identified by Felder (Reference Felder1997a, Reference Felder2001). Abbreviations: M., Member; Gl., glauconite; Foram., Foraminifera; Prism. Bival., Prismatic Bivalvia. The arrow indicates the position of the lower/upper Maastrichtian boundary on the basis of benthic foraminifers, viz., the LAD of Stensioeina pommerana Brotzen, Reference Brotzen1936. For the legend for lithology see Figure 6.

Lithology and bioclast contents for the Vijlen Member of the upper Gulpen Formation in the combined Mamelis section, Gulpen section (Steenkuil and borehole), the Crapoel borehole and the Altembroeck quarry (sources: Jagt et al., Reference Jagt, Deckers, Dhondt, Dortangs, Felder, Felder, Jäger, Keutgen, Kuypers, Michels, Reynders, Simon, Van der Ham, Van Knippenberg and Van Neer1995, figs 2 and 3; Felder, Reference Felder1997a, fig. 4; Reference Felder2001, figs 14, 17 and 40; Reference Felder2008, fig. 23). The given numerical ages are calculated based on the results of this study. Ma 9 to Ma 12 are the here identified 400 kyr long eccentricity cycles based on bivalve maxima and echinoderm minima. In Ma 11 of the Mamelis section a 400 kyr crinoid cycle may be recognised, because in this part of the section crinoid clasts occur regularly, but not above and below. The reported percentages represent the percentage of the number of bioclasts belonging to a certain group in the size class 1.0–2.4 mm. The sum of all bioclasts collected from a single sample equals 100%. The fluctuations of the percentages of the four main groups Foraminifera, Belemnoidea, Bivalvia and Echinodermata are given by solid lines; for the subgroups Prismatic Bivalvia, Ophiuroidea and Crinoidea grey and black symbols are used. Echinodermata clasts are not available for the CPL SA-Haccourt and ENCI quarries. The letters A to L indicate foraminifer peaks as identified by Felder (Reference Felder1997a, Reference Felder2001). For the legend for lithology see Figure 6. Abbreviations: V.F., Vaals Formation; Z.W.M., Zeven Wegen Member; Orsb. M., Orsbach Member; Gl., glauconite; Foram., Foraminifera; Belem., Belemnoidea; Prism. Bival., Prismatic Bivalvia.

Belemnite bioclasts represent another significant feature of the Vijlen Member. These may be indicative of reworking and winnowing processes, associated with sea-level lowstands and parts of transgressive system tracts. Belemnite bioclasts are particularly typical of intervals 0–2 and 4 of this member, but may also occur at other levels within it. The frequent occurrence of belemnite clasts in deposits of interval 4 led to the assumption that the sedimentation of interval 4 was accompanied by a sea-level fall (Keutgen & Jagt, Reference Keutgen and Jagt2009).
From the ENCI-HeidelbergCement Group quarry, bioclast data are available from interval 6 and the upper portion of interval 5 of the Vijlen Member. Interval 6 is subdivided into 10 lithological subunits, IIIc2-1 to IIIc2-10 (Fig. 9). These may be grouped into an upper portion with more or less distinct flint layers (IIIc2-7 to IIIc2-10) and a lower portion with scattered flints (IIIc2-1 to IIIc2-6). The former portion can be arranged into two blocks (IIIc2-7 to IIIc2-8 and IIIc2-9 to IIIc2-10) based on flint appearance. In the upper portion of each block (subunits IIIc2-8 and IIIc2-10) three and four flint layers, respectively, are seen; these are reminiscent of the bundles of five flint layers that occur in the Lixhe 1–3 and Lanaye members, especially when taking into account that the lower portion of each block with scattered flints (subunits IIIc2-7 and IIIc2-9) also represents a certain period of time. Therefore, it is deduced that the interval IIIc2-7 to IIIc2-10 represents 200 kyr and that the two bivalve intervals represent short eccentricity cycles (Fig. 9). Based on bioclasts, the interval IIIc2-1 to IIIc2-6 represents another single bivalve interval. Because the base of a long eccentricity cycle is situated in the lower Lixhe Member at the ENCI quarry and the bivalve interval spanning the Lixhe Horizon represents another 100 kyr, it follows that the Zonneberg Horizon at the base of interval 6 of the Vijlen Member is the base of the following long eccentricity cycle (Fig. 9). Identification of the bivalve intervals, as identified at the ENCI-HeidelbergCement Group quarry, at the former CPL SA-Haccourt quarry (now Kreco) is facilitated by the occurrence of characteristic foraminiferal peaks in both sections (Fig. 9).
The combined stratotype of the Vijlen Member near Mamelis is about 20 km east of the ENCI-HeidelbergCement Group quarry; however, correlation of the upper Vijlen Member exposed at both localities has proved difficult due to facies differences. Remarkable are the glauconite-rich layers in the Mamelis section that are missing from the Maastrichtian type area (ENCI and former CPL SA quarries), but allow a lithological subdivision of intervals 5 and 6 of the Vijlen Member (Fig. 9). A fixed point for correlation between ENCI and Mamelis is the concurrent range interval of the benthic foraminifers Bolivinoides draco (Marsson, Reference Marsson1878) and Stensioeina pommerana Brotzen, Reference Brotzen1936. Although the latter species has not yet been identified at Mamelis, the concurrent range interval of B. draco and S. pommerana typical of the ENCI section (Jagt et al., Reference Jagt, Dortangs, Felder and Meessen1999) was described from the disused Vijlen quarry by Hofker (Reference Hofker1966). This quarry was situated on the other side of the valley, c.1 km south of the Mamelis type section. The distance between the FAD of B. draco and the LAD of S. pommerana has been deduced for the Mamelis section from the section in the Vijlen quarry and integrated in Figure 9, assuming identical depositional rates. The LAD of S. pommerana in the Mamelis section, thus deduced, allows a reliable correlation of the bivalve peak above foraminifer peak J (Fig. 9). In addition, the ‘Zonneberg’ Horizon can be identified at the base of interval 6 of the Vijlen Member. Another bivalve peak occurs between foraminifer peaks K and L at Mamelis. The position of these foraminifer peaks is remarkable, because at the ENCI-HeidelbergCement Group and former CPL SA-Haccourt quarries, foraminifer peak K corresponds with the bivalve peak at 69.4 Ma, while foraminifer peak L is situated between the bivalve peaks dated 69.2 and 69.3 Ma, respectively. In the Mamelis area, these peaks occur at a stratigraphically lower level (Fig. 9). Similar to the Mamelis section, however, these peaks appear in the Steenkuil section near Gulpen and in the Crapoel borehole (Fig. 10), although in the latter locality foraminifer peak L is characterised by an intermediate position at the bivalve peak dated 69.3 Ma.
Consequently, the bivalve peaks identified signify that:
1. only three bivalve intervals occur in interval 6 of the Vijlen Member at the Mamelis stratotype,
2. slightly more than three bivalve intervals occur in interval 6 of the Vijlen Member at the ENCI-HeidelbergCement Group quarry, and
3. about four bivalve intervals occur in interval 6 at the former CPL SA-Haccourt quarry, altogether indicating the diachroneity of the top of the Vijlen Member (Fig. 9). At the former CPL-Haccourt quarry, for instance, the topmost Vijlen Member already yielded foraminifer Zone E of Hofker (Reference Hofker1966), which is otherwise considered typical of the Lixhe Member (Robaszynski et al., Reference Robaszynski, Bless, Felder, Foucher, Legoux, Manivit, Meessen and Van der Tuuk1985).
A comparison of the Vijlen Member intervals below interval 6 with existing age estimates (Zijlstra, Reference Zijlstra1994; Zijlstra et al., Reference Zijlstra, Brouwers, Brinkhuis, De Boer, Brinkhuis and Smit1996; Schiøler et al., Reference Schiøler, Brinkhuis, Roncaglia and Wilson1997) is impossible. Consequently, the following interpretation of bioclasts relies on the assumption that depositional rates of intervals 0–5 of the Vijlen Member were of the same scale as those of interval 6. Additional evidence may come from the sedimentation of glauconite-rich portions at the Mamelis stratotype which followed the 100 kyr short eccentricity cycles, at least in interval 6. Applying this criterion would allow the identification of four short eccentricity cycles in intervals 4 and 5, which is well in line with bivalve peaks occurring in the Mamelis, Gulpen and Crapoel sections (Fig. 10). Remarkably, the peak rich in prismatic bivalves seen at the base of the Vijlen Member in the Crapoel borehole has a counterpart within interval 5 of the nearby Steenkuil section.
Within intervals 2 and 3 at Mamelis crinoid bioclasts occur rarely, yet regularly (Fig. 10). They are reminiscent of a crinoid interval indicating the presence of a 400 kyr long eccentricity cycle. The presence of three 100 kyr short eccentricity cycles indicated by echinoderm clasts in intervals 3 and 4 at Altembroeck (Fig. 10) allows recognition of two bivalve or echinoderm peaks in intervals 2 and 3, respectively. Within intervals 0 and 1 at Mamelis two further bivalve intervals, covering probably another 200 kyr, occur.
Dinoflagellate control on the proposed bioclast sequences
Strata assigned to the Maastricht and upper Gulpen formations have been combined to form a section that represents the last 4.6 Ma of the Maastrichtian Stage. This section covers (parts of) 12 long eccentricity intervals of Milankovitch cyclicity, labelled Ma 1 to Ma 12, from the top to the base (Fig. 11), in dependence on Surlyk et al. (Reference Surlyk, Rasmussen, Boussaha, Schiøler, Schovsbo, Sheldon, Stemmerik and Thibault2013, fig. 2). Apart from smaller hiatuses in the upper Maastricht Formation, one major hiatus has been identified. The major hiatus separates the Maastricht and Gulpen formations and encompasses c.700 kyr at the ENCI-HeidelbergCement Group quarry. Milankovitch cycle Ma 3 is missing completely from the ENCI section, whereas the lower portion of cycle Ma 4 occurs in the uppermost Lanaye Member, both at the ENCI quarry and in the Albertkanaal section, northwest of Lanaye. In addition, the upper portion of Ma 3 seems to be present at ’t Rooth, near Bemelen. The intervals Ma 3 to Ma 4 could potentially be even more complete in the Thermae 2000 borehole near Valkenburg aan de Geul, where the interval from the base of the Lanaye Member to the top of the Schiepersberg Member reaches a thickness of almost 60 m (Jäger, Reference Jäger1987; Krings et al., Reference Krings, Bless, Conil, Felder and Meessen1987).
Composite stratigraphic log of the ENCI-HeidelbergCement Group quarry, combined with the Mamelis stratotype, with the metre scale set at 0 at the Halembaye Horizon. The two sections are combined at the level of the Zonneberg Horizon, so that the section from the base of interval 6 of the Vijlen Member to the top of the Meerssen Member is in line with the deposits in the ENCI-HeidelbergCement Group quarry, while the thickness of intervals 0–5 of the Vijlen Member is in line with the well-constrained Mamelis sequence (cf. Vonhof et al., Reference Vonhof, Jagt, Immenhauser, Smit, Van den Berg, Saher, Keutgen, Reijmer, Jagt, Jagt-Yazykova and Schins2011). In addition, the positions of one large and three smaller hiatuses in the upper Maastricht Formation are indicated. The δ18O values are from micromilled portions of belemnites and bulk samples, the latter marked by arrows (source: Vonhof et al., Reference Vonhof, Jagt, Immenhauser, Smit, Van den Berg, Saher, Keutgen, Reijmer, Jagt, Jagt-Yazykova and Schins2011). The absolute numerical ages are deduced from the bioclast-based 400 and 100 kyr eccentricity cycles. The first (FAD) and last appearance datum (LAD) of index dinoflagellate cysts as recorded by Schiøler et al. (Reference Schiøler, Brinkhuis, Roncaglia and Wilson1997) and Slimani (Reference Slimani2001) and of calcareous nannofossils as recorded by Verbeek (Reference Verbeek1977), Van Heck (Reference Van Heck1979), Robaszynski et al. (Reference Robaszynski, Bless, Felder, Foucher, Legoux, Manivit, Meessen and Van der Tuuk1985) and Keutgen (Reference Keutgen1996) are indicated. In brackets, after each dinoflagellate and calcareous nannofossil species, the absolute numerical age of the event indicated for this species in the Stevns-1 borehole is taken from Surlyk et al. (Reference Surlyk, Rasmussen, Boussaha, Schiøler, Schovsbo, Sheldon, Stemmerik and Thibault2013) and Thibault (Reference Thibault2016). The FADs and LADs of the dinoflagellate species are used to establish a biozonation. Abbreviations: P. gr., P. grallator; P. tub., P. tubuloaculeatum.
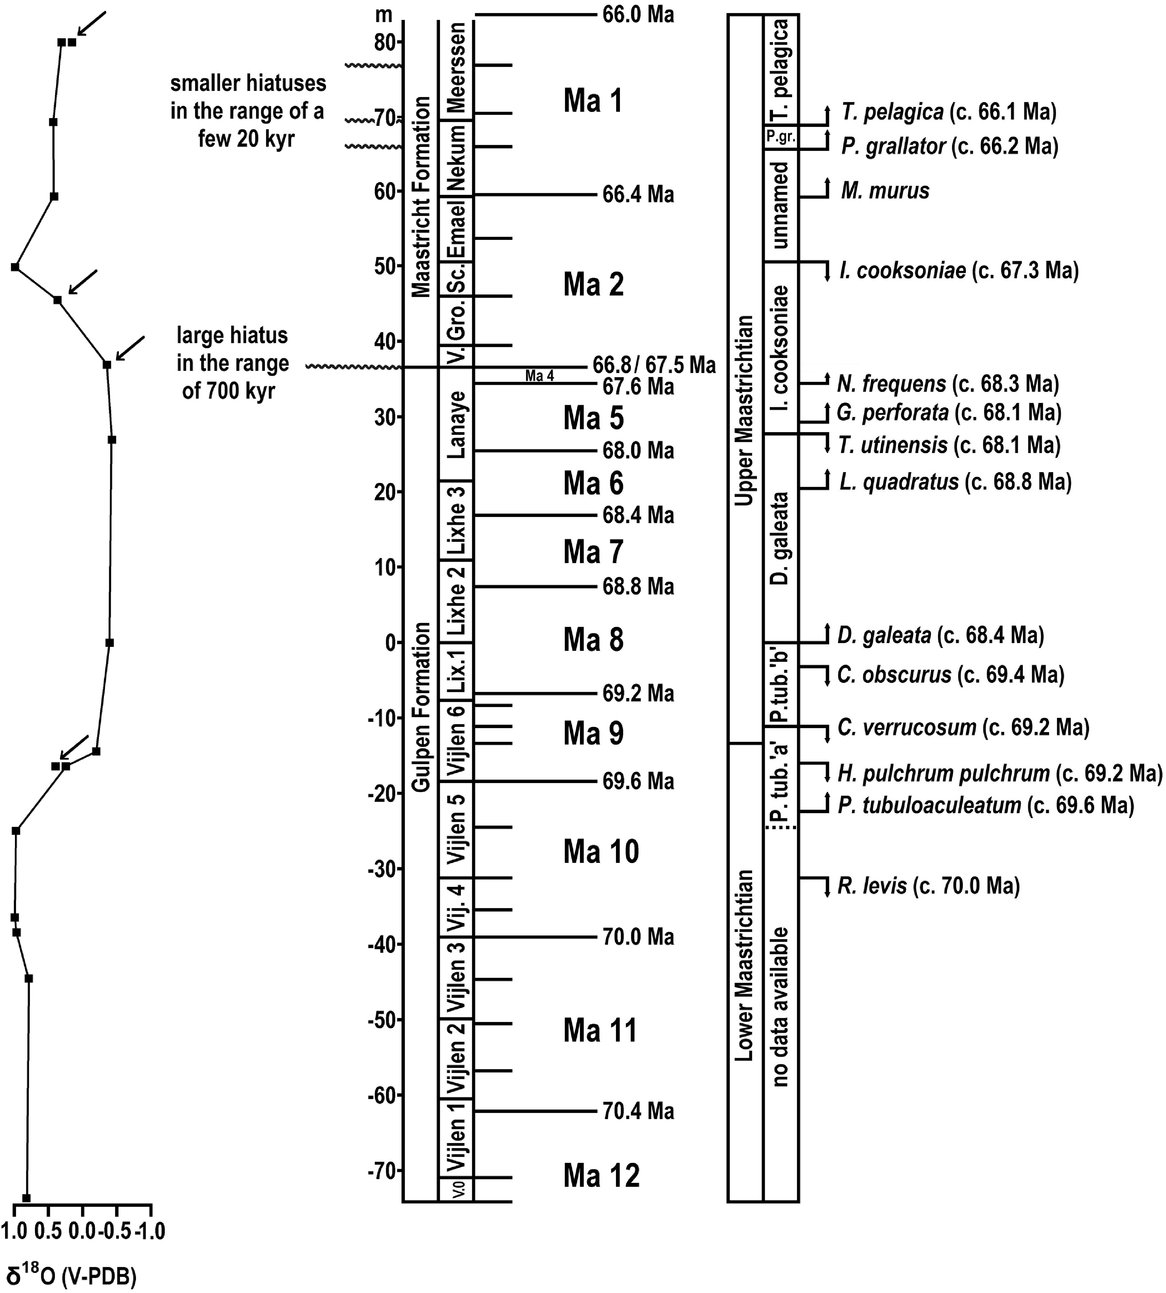
Three smaller-scale hiatuses occur in the upper Maastricht Formation and correspond to the Kanne and Caster horizons, in addition to the top of subunit IVf-3 of the Meerssen Member. At localities, where the Kanne and Caster horizons coincide, the hiatus may cover 100 kyr.
The correctness of the long eccentricity intervals of Milankovitch cyclicity identified here has been tested by dinoflagellate biostratigraphy. The FADs and LADs of index species in the Danish reference core Stevns-1 are adopted, and numerical ages deduced for these (Surlyk et al., Reference Surlyk, Rasmussen, Boussaha, Schiøler, Schovsbo, Sheldon, Stemmerik and Thibault2013, figs 2 and 3) are compared with the presence of these species in the Maastricht area. For this purpose, data published by Schiøler et al. (Reference Schiøler, Brinkhuis, Roncaglia and Wilson1997) and Slimani (Reference Slimani2001) were adopted. They cover the entire upper Maastrichtian and the uppermost part of the lower Maastrichtian in the study area.
The stratigraphically youngest event is the FAD of Thalassiphora pelagica (Eisenack, Reference Eisenack1954) Eisenack & Gocht, Reference Eisenack and Gocht1960, which occurs at the top of the Nekum Member, immediately below the Caster Horizon (Schiøler et al., Reference Schiøler, Brinkhuis, Roncaglia and Wilson1997). Its FAD is dated at 66.2 Ma at the ENCI-HeidelbergCement Group quarry (Fig. 11). In the Stevns-1 borehole core, the FAD of T. pelagica characterises the base of the T. pelagica subzone, which is dated at c.66.1 Ma (Surlyk et al., Reference Surlyk, Rasmussen, Boussaha, Schiøler, Schovsbo, Sheldon, Stemmerik and Thibault2013). For sake of completeness it should be mentioned that Thibault et al. (Reference Thibault, Harlou, Schovsbo, Stemmerik and Surlyk2016b) indicated a hiatus close to the K/Pg event in the Stevns-1 core, which should correspond to less than 150 kyr of the latest Cretaceous. This gap could well explain the difference of 100 kyr in the calculated numerical ages for the FAD of T. pelagica in both sections.
The P. grallator Zone underlies the T. pelagica Zone in the Maastricht area. The FAD of Palynodinium grallator Gocht, Reference Gocht1970 is recorded from immediately below the Kanne Horizon in the upper Nekum Member (Schiøler et al., Reference Schiøler, Brinkhuis, Roncaglia and Wilson1997) and is dated 66.3 Ma (Fig. 11). In the Stevns-1 borehole core, the FAD of P. grallator characterises the base of the P. grallator Zone, which is dated at c.66.2 Ma (Surlyk et al., Reference Surlyk, Rasmussen, Boussaha, Schiøler, Schovsbo, Sheldon, Stemmerik and Thibault2013).
The next event is the LAD (here taken as the last consistent occurrence) of Isabelidinium cooksoniae (Alberti, Reference Alberti1959) Lentin & Williams, Reference Lentin and Williams1977. This species seems to disappear close to the top of the Schiepersberg Member at the ENCI quarry (Schiøler et al., Reference Schiøler, Brinkhuis, Roncaglia and Wilson1997), which is dated at 66.55 Ma. In the Stevns-1 core, the LAD of I. cooksoniae occurs at a depth of 75.04 m, dated at c.67.3 Ma. Either the LAD of I. cooksoniae occurs at a stratigraphically distinctly younger level in the Maastricht area (c.750 kyr later), or specimens of I. cooksoniae found in the Maastricht Formation are to be considered reworked.
Two near-contemporaneous events, i.e. the FAD of Glaphyrocysta perforata Hultberg & Malmgren, Reference Hultberg, Malmgren and Hultberg1985 and the LAD of Triblastula utinensis Wetzel, Reference Wetzel1933 characterise the base of the following I. cooksoniae Zone in the Maastricht area. At the ENCI-HeidelbergCement Group quarry, both events occur in the middle Lanaye Member (Schiøler et al., Reference Schiøler, Brinkhuis, Roncaglia and Wilson1997), dated at c.67.9 Ma (Fig. 11). In the Stevns-1 core these events have been recorded at a depth of 115.26 m, which is dated at c.68.1 Ma (Surlyk et al., Reference Surlyk, Rasmussen, Boussaha, Schiøler, Schovsbo, Sheldon, Stemmerik and Thibault2013).
The next dinoflagellate index species considered is Deflandrea galeata (Lejeune-Carpentier, Reference Lejeune-Carpentier1942) Lentin & Williams, Reference Lentin and Williams1973. According to Schiøler et al. (Reference Schiøler, Brinkhuis, Roncaglia and Wilson1997), this was present already in the stratigraphically lowermost sample (base of the Lixhe 2 Member) studied by these authors from the ENCI-HeidelbergCement Group quarry. In contrast, Slimani (Reference Slimani2001) did not record any representative of D. galeata from his seven samples recovered from the Lixhe 2, Lixhe 3 and Lanaye members at the former CPL SA-Haccourt quarry, but Slimani et al. (Reference Slimani, Louwye, Dusar, Lagrou, Jagt, Jagt-Yazykova and Schins2011) did confirm that the record of D. galeata from the ENCI quarry represented the earliest known FAD of that species. The FAD is here dated at c.68.9 Ma (Fig. 11). In the Stevns-1 core, the FAD of D. galeata is at a depth of 144.65 m, which is dated at c.68.4 Ma (Surlyk et al., Reference Surlyk, Rasmussen, Boussaha, Schiøler, Schovsbo, Sheldon, Stemmerik and Thibault2013). This indicates that the FAD of D. galeata in the Maastricht region predates that in the Stevns-1 core by c.500 kyr.
As already mentioned above, the base of the Pervosphaeridium tubuloaculeatum ‘b’ dinoflagellate Zone in the Maastricht area is approximated by the LAD of Cladopyxidium verrucosum Marheinecke, Reference Marheinecke1992 and Hystrichodinium pulchrum pulchrum (Deflandre, Reference Deflandre1935) and is situated within the upper half of interval 6 of the Vijlen Member (Slimani, Reference Slimani2001). This interval corresponds roughly to a numerical age of c.69.3–69.4 Ma (Fig. 11). In the Stevns-1 core, the base of the P. tubuloaculeatum ‘b’ Zone corresponds to the top of the Alterbidinium acutulum subzone, which is dated at c.69.2 Ma.
The FAD of the index species Pervosphaeridium tubuloaculeatum Slimani, Reference Slimani1994 defines the base of the Pervosphaeridium tubuloaculeatum ‘a’ Zone. In the Maastricht area, it is known from the base of the Vijlen Member as exposed at the former CPL SA-Haccourt quarry (Slimani, Reference Slimani2001), which is roughly dated at 69.7 Ma (Fig. 11). Stratigraphically older deposits of the Vijlen Member have not yet been studied; thus, the exact FAD of this species remains a matter of debate. Surlyk et al. (Reference Surlyk, Rasmussen, Boussaha, Schiøler, Schovsbo, Sheldon, Stemmerik and Thibault2013) correlated the base of the P. tubuloaculeatum ‘a’ Zone with the top of the Eatonicysta hapala subzone, which is defined by the LAD of Eatonicysta hapala Schiøler & Wilson, Reference Schiøler and Wilson1993. It occurs at a depth of 205.18 m in the Stevns-1 core, which is dated at c.69.6 Ma. Thus, it is quite possible that the base of the P. tubuloaculeatum ‘a’ Zone is situated within interval 5 of the Vijlen Member, but further studies are needed to settle this matter.
In summary, six dinoflagellate events can be identified in the Maastricht and upper Gulpen formations. For four of these, similar absolute numerical ages have been confirmed in a comparison of strata in the Maastricht area with those in Denmark (Stevns-1 borehole), with differences of 200 kyr or less. This represents an acceptable match that justifies the interpretation of bioclast intervals proposed here as being indicative of orbital forcing, reflecting long and short eccentricity cycles. For intervals below interval 5 of the Vijlen Member, biostratigraphic data by dinoflagellates are not available.
Calcareous nannofossil control on the proposed bioclast sequences
Calcareous nannofossil events as well may contribute to the correlation of the Gulpen and Maastricht formations with the Danish reference core Stevns-1 (Table 1). Verbeek (Reference Verbeek1977) noted the FAD of Micula murus (Martini, Reference Martini1961) Bukry, Reference Bukry1973 in the Nekum Member of the ENCI-HeidelbergCement Group quarry, which is dated at 66.2–66.4 Ma. M. murus is considered an index species of the Tethyan Realm, where it appeared between 67.8 and 68.4 Ma (Thibault, Reference Thibault2016). Its FAD in the Maastricht area may be linked with a temperature increase starting 350–400 kyr before the K/Pg boundary (see discussion below).
Estimated ages of significant (consistent) stratigraphic nannoplankton events recorded in the Maastricht section and compared with the age intervals given by Thibault (Reference Thibault2016) for the Boreal and Tethyan Realm and average ages recorded by Batenburg et al. (2014) for the Zumaia and Sopelana sections.

Notes: levels according to aVerbeek (1977), bVan Heck (1979), cRobaszynski et al. (1985), dKeutgen (1996);
eaccording to Batenburg et al. (2014) specimens from the highest level may be reworked.
Nephrolithus frequens Górka, Reference Górka1957 appeared in the Maastricht area at c.67.6 Ma in the uppermost Lanaye Member of the ENCI-HeidelbergCement Group quarry (Van Heck, Reference Van Heck1979), which is slightly later (c.200 kyr) than could be expected from the information provided by Thibault (Reference Thibault2016). However, Van Heck's (Reference Van Heck1979) record from this member could not be substantiated by Verbeek (Reference Verbeek1983), indicating the general rarity of this index species in the Maastricht area. Sissingh (Reference Sissingh1977) recorded the FAD of N. frequens from the lower Maastricht Formation of the ENCI quarry.
The index species Lithraphidites quadratus Bramlette & Martini, Reference Bramlette and Martini1964 first appeared at the top of the Lixhe 3 Member at c. 68.2 Ma (Robaszynski et al., Reference Robaszynski, Bless, Felder, Foucher, Legoux, Manivit, Meessen and Van der Tuuk1985). Surlyk et al. (Reference Surlyk, Rasmussen, Boussaha, Schiøler, Schovsbo, Sheldon, Stemmerik and Thibault2013) mentioned the FAD of L. quadratus from the interval 175.22–170.50 m of the Stevns-1 borehole section, dated at c.68.8 Ma. Thibault (Reference Thibault2016) recorded the FAD of this species at 68.1–68.8 Ma in the Boreal and 68.1–69.4 Ma in the Tethyan Realm. Thus, in the Maastricht area the index species L. quadratus appeared comparatively late, but within the documented range.
Robaszynski et al. (Reference Robaszynski, Bless, Felder, Foucher, Legoux, Manivit, Meessen and Van der Tuuk1985) described the LAD of Calculites obscurus (Deflandre, Reference Deflandre1959) Prins & Sissingh in Sissingh, Reference Sissingh1977 from the middle of the Lixhe 1 Member at c.69.0 Ma. This is well within the interval (68.9–69.8 Ma) given by Thibault (Reference Thibault2016) for the Boreal Realm.
Other calcareous nannofossil index species documented in literature do not contribute to the correlation of the Maastricht area with the Stevns-1 borehole section. Especially the LADs of those index species that are considered typical of older stratigraphic events are critical, because the specimens found at the former CPL SA-Haccourt (now Kreco) quarry are most probably reworked. The LADs of Reinhardtites levis Prins & Sissingh in Sissingh, Reference Sissingh1977, Tranolithus orionatus Reinhardt, Reference Reinhardt1966, Broinsonia parca constricta Hattner, Wind & Wise (Reference Hattner, Wind and Wise1980), and Eiffellithus eximius (Stover, Reference Stover1966) Perch-Nielsen, Reference Perch-Nielsen1968 all lie within the interval upper Vijlen to Lixhe 3 members, which is considerably higher than in other sections (Table 1). An exception from this general conclusion might represent R. levis. For this species, data are also available from the Aachen region. Here, the LAD lies within interval 4 of the Vijlen Member (Keutgen, Reference Keutgen1996) at 69.8–70.0 Ma, which is well in line with the information supplied by Thibault (Reference Thibault2016) for the Boreal (69.5–70.2 Ma) and the Tethyan Realm (69.4–70.3 Ma).
Benthic foraminifer control on the proposed bioclast sequences
The benthic foraminiferal zonation of the Campanian and Maastrichtian of the Maastrichtian type area is based on assemblage zones defined by Hofker (Reference Hofker1966). However, especially for the Vijlen Member, more detailed information has been added by Felder & Bless (Reference Felder and Bless1994). The present subdivision of the Maastrichtian deposits is mainly based on their data (Fig. 12).
Composite stratigraphical log of the ENCI-HeidelbergCement Group quarry, combined with the Mamelis stratotype (cf. Fig. 11). Indicated are the absolute numerical ages deduced from the bioclast-based 400 and 100 kyr eccentricity cycles, in addition to the appearance of foraminifer, inoceramid and belemnite index species based on Hofker (Reference Hofker1966), Robaszynski et al. (Reference Robaszynski, Bless, Felder, Foucher, Legoux, Manivit, Meessen and Van der Tuuk1985), Felder & Bless (Reference Felder and Bless1994), Witte & Schuurman, (Reference Witte, Schuurman, Brinkhuis and Smit1996), Herngreen et al. (Reference Herngreen, Brinkhuis, Burnett, Felder, Kedves, Schuurman and Verbeek1998), Jagt (Reference Jagt1999), Robaszynski (Reference Robaszynski and Dejonghe2006), Keutgen et al. (Reference Keutgen, Jagt, Felder and Yazykova2010), Walaszczyk et al. (Reference Walaszczyk, Jagt and Keutgen2010), Renema & Hart (Reference Renema, Hart, Jagt, Donovan and Jagt-Yazykova2012), Keutgen et al. (Reference Keutgen, Remin and Jagt2017) and Jagt & Jagt-Yazykova (Reference Jagt, Jagt-Yazykova, Jagt-Yazykova, Jagt and Mortimore2018). Species mentioned in literature as ‘cf.’ are not included. Abbreviations: Bl., Belemnella.

The lowest Maastrichtian foraminifer assemblage zone of the Vijlen Member is characterised by the presence of Bolivinoides sidestrandensis Barr, Reference Barr1966 (B. regularis (Reuss) of Felder & Bless, Reference Felder and Bless1994), which is limited to interval 0 of the Vijlen Member. According to Dubicka & Peryt (Reference Dubicka and Peryt2016), B. sidestrandensis occurs in the middle upper Campanian up to the lower Trochoceramus radiosus inoceramid zone (lower Maastrichtian). Remin (Reference Remin2018) proposed to correlate this inoceramid zone roughly with the Belemnella sumensis Zone, implying that the presence and LAD of B. sidestrandensis in interval 0 of the Vijlen Member indicate the lower, latest the middle Belemnella sumensis Zone.
In general, the Vijlen Member is characterised by the presence of Neoflabellina reticulata (Reuss, Reference Reuss1851) and Bolivinoides australis Edgell, Reference Edgell1954 with five to six pustules on the last chamber, characterising Hofker's (1966) benthic foraminifer assemblage zone C. N. reticulata is known to first appear e.g. in northern Germany (Kronsmoor) and Poland (Middle Vistula River valley) high in the latest Campanian Belemnella lanceolata to Belemnella inflata zones (Friedrich et al., Reference Friedrich, Herrle and Hemleben2005; Niebuhr et al., Reference Niebuhr, Hampton, Gallagher and Remin2011; Peryt & Dubicka, Reference Peryt and Dubicka2015; Walaszczyk et al., Reference Walaszczyk, Dubicka, Olszewska-Nejbert and Remin2016). B. australis has traditionally been interpreted in the Maastrichtian type area as a form transitional between the ancestral Bolivinoides decoratus (Jones in Wright, Reference Wright1886) and the descendant Bolivinoides giganteus Hiltermann & Koch, Reference Hiltermann and Koch1950 (Hiltermann, Reference Hiltermann, Von Koenigswald, Emeis, Buning and Wagner1963; Barr, Reference Barr1966). However, Dubicka & Peryt (Reference Dubicka and Peryt2016) regarded Bolivinoides australis Edgell, Reference Edgell1954 as a synonym of Bolivinoides miliaris Hiltermann & Koch, Reference Hiltermann and Koch1950 and proposed a slightly different development: B. decoratus probably gave rise to B. miliaris, which has five to six pustules. Bolivinoides intermedius Dubicka & Peryt, Reference Dubicka and Peryt2016 is regarded as an immediate descendant of B. miliaris, which gave rise to both Maastrichtian species B. giganteus, having the largest number of pustules (six to nine), and Bolivinoides draco (Marsson, Reference Marsson1878). Judging from the documented stratigraphic range of B. giganteus in the Middle Vistula River valley, the specimens of B. australis from the lower Maastrichtian Vijlen Member would already be referred to B. giganteus (Dubicka & Peryt, Reference Dubicka and Peryt2016; Walaszczyk et al., Reference Walaszczyk, Dubicka, Olszewska-Nejbert and Remin2016), although the mean number of pustules on the last chamber of B. australis in the type area of the Maastrichtian Stage is 5.2–5.6 in intervals 0–5 of the Vijlen Member (Felder & Bless, Reference Felder and Bless1994). Starting with interval 6 of the Vijlen Member, the mean number (5.4–6.0) of pustules (Robaszynski et al., Reference Robaszynski, Bless, Felder, Foucher, Legoux, Manivit, Meessen and Van der Tuuk1985; Felder & Bless, Reference Felder and Bless1994) is in the lower range considered typical of B. giganteus by Dubicka & Peryt (Reference Dubicka and Peryt2016). For the Lixhe Member a mean value of six to seven pustules on the last chamber of B. australis is characteristic, while in the Maastrichtian type area, typical specimens of B. giganteus with more than seven pustules (mean value) on the last chamber are limited to the Lanaye Member (Robaszynski, Reference Robaszynski and Dejonghe2006). In the present study, the traditional nomenclature in the Maastricht region for the B. australis – B. giganteus lineage is maintained in Figure 12. B. giganteus disappears in the Maastricht region at the top of the Lanaye Member, while in the Middle Vistula River valley the latest records are from the lower upper Maastrichtian Belemnitella junior Zone (Dubicka & Peryt, Reference Dubicka and Peryt2016).
B. draco appears in the Maastrichtian type area close before the LAD of S. pommerana in the uppermost lower Maastrichtian. In the Middle Vistula River valley the FAD of this species is situated in the lower upper Maastrichtian, but transitional forms between B. intermedius and B. draco occur close to the lower/upper Maastrichtian boundary (Dubicka & Peryt, Reference Dubicka and Peryt2016). Another benthic foraminifer species marking the lower/upper Maastrichtian boundary represents Reussella cimbrica (Troelsen, Reference Troelsen1937). Although this species occurs very rarely in the uppermost Vijlen Member (Hofker, Reference Hofker1966), it becomes common in the Lixhe Member, characterising among other species Hofker's (Reference Hofker1966) benthic foraminifer assemblage zone E (dated here as early Late Maastrichtian). In Denmark, it is the index species of the lower upper Maastrichtian ‘Pseudouvigerina cimbrica Zone’ (Jagt, Reference Jagt1999).
Within the Maastricht Formation, the first important index species represents Pararotalia tuberculifera (Reuss, Reference Reuss1862), which marks the basis of Hofker's (Reference Hofker1966) benthic foraminifer zone H occurring in the Schiepersberg Member, possibly as early as in the Gronsfeld Member. P. tuberculifera is considered a warm water foraminifer (Szczechura & Pożaryska, Reference Szczechura and Pożaryska1971), and its FAD marks the first appearance of rare Tethyan benthic foraminifera. In this context, the appearance of the typically Tethyan Omphalocyclus macroporus (Lamarck, Reference Lamarck1816) in the basal Gronsfeld Member may be mentioned (Jagt, Reference Jagt1999). However, the sudden development of a rich Tethyan benthic foraminifer assemblage starts as late as in the Nekum Member above the Kanne Horizon, dated 300 kyr before the K/Pg boundary (Robaszynski, Reference Robaszynski and Dejonghe2006; Renema & Hart, Reference Renema, Hart, Jagt, Donovan and Jagt-Yazykova2012).
The latest benthic foraminifer Zone of the Maastricht Formation is best characterised by the FAD of Ceratolamarckina tuberculata (Brotzen, Reference Brotzen1948) characterising the lowermost Paleocene portion of the Meerssen Member (Witte & Schuurman, Reference Witte, Schuurman, Brinkhuis and Smit1996).
Correlation between the Maastricht and the Hemmoor section
Additional index fossils may be used to correlate the deposits in the Maastrichtian type area with the Hemmoor section in northern Germany. Of note are the fairly well-preserved specimens of the scaphitid ammonite Acanthoscaphites (Acanthoscaphites) tridens (Kner, Reference Kner1848) that have been recorded from interval 3 of the Vijlen Member, whereas material from interval 4 is fragmentary (Fig. 13). The latter specimens were considered to have been reworked (Keutgen et al., Reference Keutgen, Jagt, Felder and Yazykova2010). The documented range of A. tridens equates with the Belemnella lanceolata to Belemnella sumensis zones (sensu germanico; see Niebuhr, Reference Niebuhr2003; Kin, Reference Kin2010). The co-occurrence of A. tridens and Belemnella ex gr. sumensis/cimbrica sensu Keutgen (Reference Keutgen, Jagt, Jagt-Yazykova and Schins2011) in interval 3 in the Maastricht area may thus indicate the upper Belemnella sumensis Zone (Fig. 12). From interval 4 of the Vijlen Member, however, Jäger (Reference Jäger2005) recorded the serpulid Conorca trochiformis (Hagenow, Reference Hagenow1840), which displayed morphological features that favoured a dating as Belemnella cimbrica Zone. Another index species of correlative value represents the benthic foraminifer Stensioeina pommerana Brotzen, Reference Brotzen1936. The LAD of this species is c.4 m above the Zonneberg Horizon at the ENCI-HeidelbergCement Group quarry (Jagt & Jagt-Yazykova, Reference Jagt, Jagt-Yazykova, Jagt, Donovan and Jagt-Yazykova2012) and near the top of the Belemnella cimbrica Zone at ~10 m below the lower/upper Maastrichtian boundary at Hemmoor (Vonhof et al., Reference Vonhof, Jagt, Immenhauser, Smit, Van den Berg, Saher, Keutgen, Reijmer, Jagt, Jagt-Yazykova and Schins2011). In addition, Slimani (Reference Slimani2001) correlated the base of the Pervosphaeridium tubuloaculeatum ‘b’ dinoflagellate Zone in the upper portion of interval 6 of the Vijlen Member with the base of subzone 1b of the dinoflagellate Zone B of Marheinecke (Reference Marheinecke1992), which marks the base of the upper Maastrichtian in the Hemmoor quarry (Slimani, Reference Slimani2001, text-fig. 10). All of these biostratigraphic events imply a numerical age of c.69.2 Ma for the lower/upper Maastrichtian boundary, of c.69.5 Ma for the base of the Belemnella fastigata Zone and of c.70.0 Ma for the base of the Belemnella cimbrica Zone in the Hemmoor section. Note that if the top of the middle Belemnella sumensis Zone sensu Schulz (Reference Schulz1979) at Kronsmoor is dated at 70.4 Ma (Thibault et al., Reference Thibault, Husson, Harlou, Gardin, Galbrun, Huret and Minoletti2012b) and the lower/upper Maastrichtian boundary at 69.2 Ma, it follows that the 48 m of sediment at Hemmoor (as interpreted by Schulz, Reference Schulz1979) would correspond to 1.2 Ma, giving a mean sedimentation rate of c.250 kyr per 10 m. Thus, the lower/upper Maastrichtian boundary (as defined at Hemmoor) would be expected c.250 kyr above the LAD of S. pommerana in the Maastricht region, which is confirmed by the present data. In addition, at Hemmoor, the base of the Belemnella cimbrica Zone is situated 32 m below the lower/upper Maastrichtian boundary (69.2 Ma). Taking into account the sedimentation rate of 48 m per 1.2 Ma for the lower Maastrichtian at Hemmoor, the base of the Belemnella cimbrica Zone may be dated at 69.2 Ma + 800 kyr = 70.0 Ma at this locality. This absolute numerical age is similar to that established for the base of interval 4 of the Vijlen Member. For the sake of completeness, it may be mentioned that Schulz & Schmid (Reference Schulz and Schmid1983) suggested correlation of the base of the upper Maastrichtian argentea/junior Zone of the Hemmoor quarry with the base of the Lanaye Member in the Maastricht type area based on the FAD of N. frequens relative to the flint maximum in both sections. This correlation would imply a numerical age of c.68.2 Ma for the base of the argentea/junior Zone.
Composite stratigraphical log of the ENCI-HeidelbergCement Group quarry, combined with the Mamelis stratotype. Indicated are the absolute numerical ages deduced from the bioclast-based 400 and 100 kyr eccentricity cycles, in addition to the appearance of ammonites based on Jagt (Reference Jagt, Summesberger, Histon and Daurer2002, Reference Jagt, Summesberger, Histon and Daurer2012), Jagt & Felder (Reference Jagt and Felder2003), Landman et al. (Reference Landman, Goolaerts, Jagt, Jagt-Yazykova, Machalski, Klug, Korn, Baets, Kruta and Mapes2015) and Jagt et al. (Reference Jagt, Jagt-Yazykova, de Blok, Jagt-Yazykova, Jagt and Mortimore2018). Species mentioned in literature as ‘cf.’ are not included. Note that the range of ammonite species occurring in the Kunrade Formation is also not included, because their exact occurrence relative to the Maastricht Formation is not known, although a rough correlation (Lanaye to Nekum members) is available (Jagt et al., Reference Jagt, Jagt-Yazykova, de Blok, Jagt-Yazykova, Jagt and Mortimore2018). Abbreviations: E., Euroscaphites.
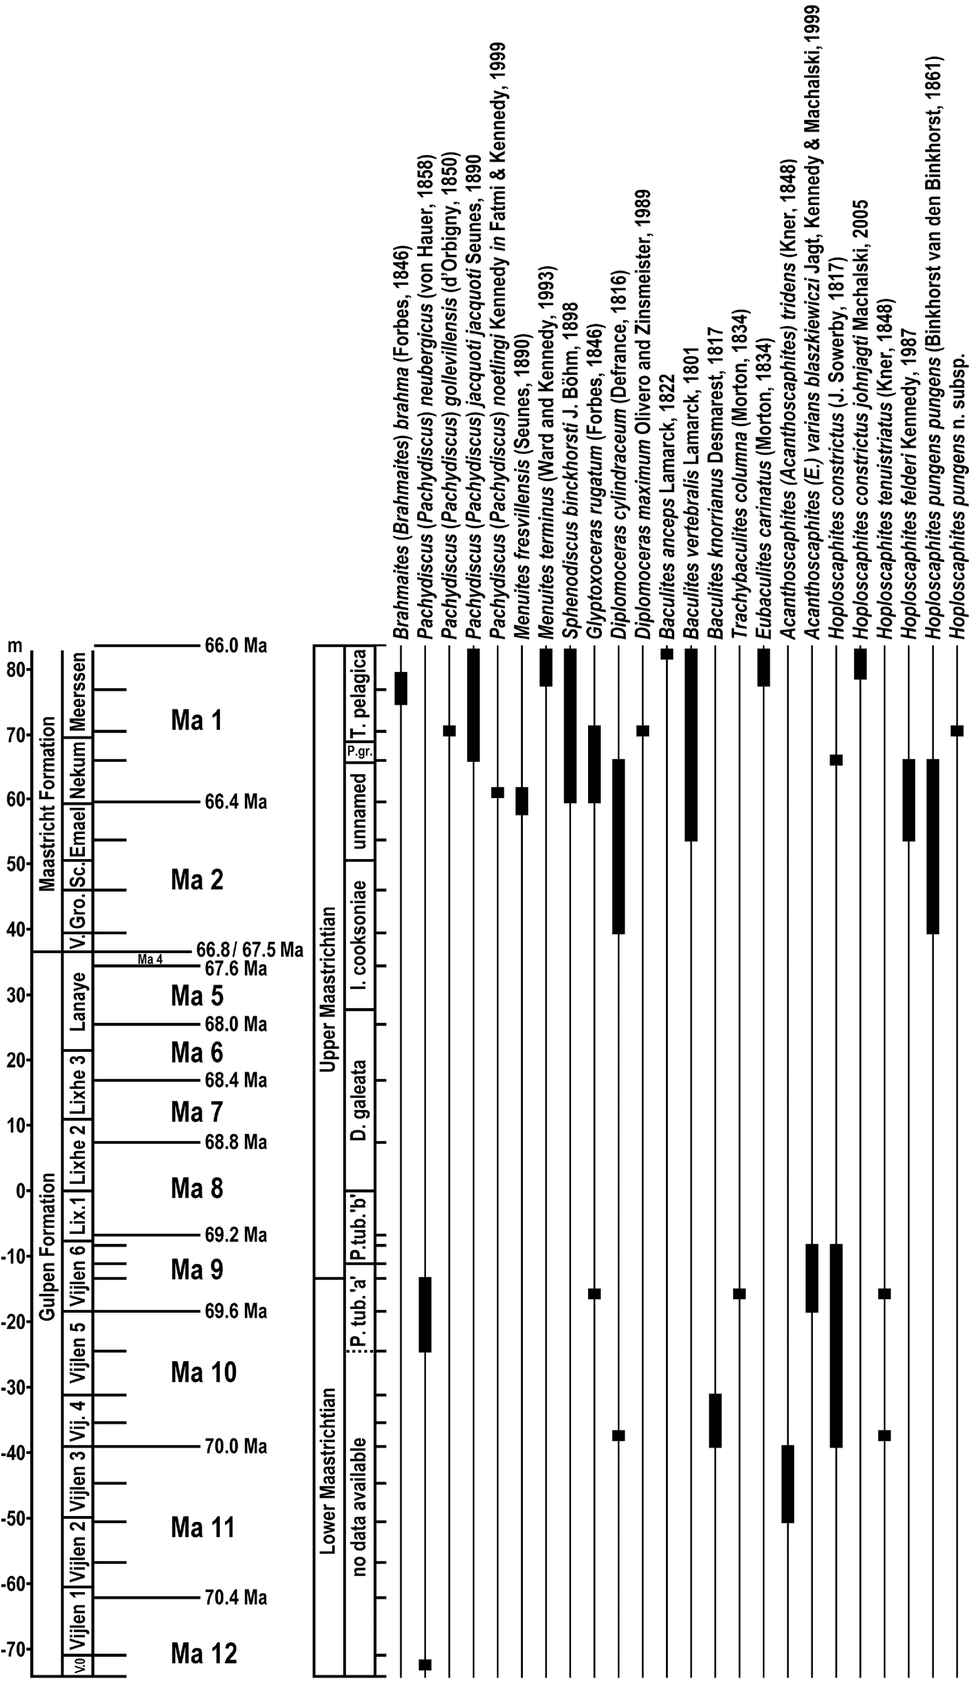
Although the index fossils mentioned above and the calculated numerical ages based on a mean sedimentation rate are consistent with respect to the correlation of the bases of the Belemnella cimbrica, Belemnella fastigata, tegulatus/junior (base of the upper Maastrichtian) and argentea/junior zones between the Maastricht and the Hemmoor sections, the above determination of numerical ages is obviously at odds with the correlation between the Stevns-1 core reference section in eastern Denmark and the Hemmoor section (Thibault et al., Reference Thibault, Husson, Harlou, Gardin, Galbrun, Huret and Minoletti2012b; Thibault, Reference Thibault2016). According to these latter studies, the bases of the Belemnella cimbrica, Belemnella fastigata, tegulatus/junior and argentea/junior zones in the Hemmoor section are dated c.69.0 Ma, 68.5 Ma, 68.3 Ma and 67.6 Ma, respectively. These numerical dates would place the base of the Belemnella cimbrica Zone within the Lixhe 1 Member, the base of the Belemnella fastigata Zone close to the base of the Lixhe 3 Member, and the base of the tegulatus/junior Zone close to the top of the latter member, whereas the base of the argentea/junior Zone would roughly correspond to the uppermost Lanaye Member or the beginning hiatus between the Gulpen and Maastricht formations. If the interpretation of Thibault and coworkers is accepted, the base of the upper Maastrichtian at Hemmoor corresponds fairly well to the FAD of Lithraphidites quadratus Bramlette & Martini, Reference Bramlette and Martini1964 (c.68.2 Ma) in the Maastricht region.
At present, it cannot be ruled out that the discrepancy in the numerical ages resulting from correlations between the Stevns-1 reference and Hemmoor sections on the one hand and between the Maastricht and Hemmoor sections on the other reflects nothing but another example of the diachronism of index fossils in the late Campanian–Maastrichtian as summarised by Thibault (Reference Thibault2016) for calcareous nanoplankton, implying that the index fossils used here for correlation between the Maastricht region and the Hemmoor section are not reliable. Further studies are necessary in order to settle this matter.
Sea-level fluctuations and sequence stratigraphy
Other aspects of chronostratigraphic significance represent sea-level fluctuations and the associated sequence boundaries that are of global importance. In the study area the following sequence boundaries were recognised (Felder, Reference Felder1996, Reference Felder1997a), which represent the basis of this comparison. The hiatus between the Gulpen and Maastricht formations marks a rather distinct sea-level drop representing the sequence boundary at the base of cycle TA 1.1 of Haq et al. (Reference Haq, Hardenbol, Vail, Wilgus, Hastings, St Kendall, Posamentier, Ross and Van Wagoner1988). In addition, Felder suggested that the Caster Horizon at the base of the Meerssen Member should correspond to the base of cycle TA 1.2. The Böckler Horizon at the top of interval 4 of the Vijlen Member was interpreted as a sequence boundary representing the base of cycle UZA 4.5 (Felder, Reference Felder1996, Reference Felder1997a).
In contrast to Felder (Reference Felder1996, Reference Felder1997a), Herngreen et al. (Reference Herngreen, Brinkhuis, Burnett, Felder, Kedves, Schuurman and Verbeek1998) regarded the base of the Meerssen Member as the sequence boundary of cycle TA 1.1. Schiøler et al. (Reference Schiøler, Brinkhuis, Roncaglia and Wilson1997) proposed the Kanne Horizon, which is situated slightly below the Caster Horizon, in the upper part of the Nekum Member, as a sequence boundary, however, as the base of TA 1.2, an interpretation that resembles that of Felder (Reference Felder1997a). Schiøler et al. (Reference Schiøler, Brinkhuis, Roncaglia and Wilson1997) did not interpret the base of the Maastricht Formation as a sequence boundary, but suggested the base of the Lanaye Member as the basis of the underlying cycle TA 1.1.
For the Zumaia section in the Basque country (northern Spain) Batenburg et al. (Reference Batenburg, Sprovieri, Gale, Hilgen, Hüsing, Laskar, Liebrand, Lirer, Orue-Etxebarria, Pelosi and Smit2012) mentioned a sedimentologic rhythmicity, following approximately a cycle of 1.2 Ma. The rhythmicity corresponds to a lithological shift from reddish limestone–marl alternations to purple marly intervals and is considered to reflect sea-level fluctuations, either by eustasy or local tectonics. Batenburg et al. (Reference Batenburg, Sprovieri, Gale, Hilgen, Hüsing, Laskar, Liebrand, Lirer, Orue-Etxebarria, Pelosi and Smit2012) suggested that during the sea-level lowstand increased erosion resulted in an increased input of clastic material. Following the interpretation of Batenburg et al. (Reference Batenburg, Sprovieri, Gale, Hilgen, Hüsing, Laskar, Liebrand, Lirer, Orue-Etxebarria, Pelosi and Smit2012), bases of the 1.2 Ma cycles should be placed at 66.2, 67.5 and 68.7 Ma. Batenburg et al. (Reference Batenburg, Sprovieri, Gale, Hilgen, Hüsing, Laskar, Liebrand, Lirer, Orue-Etxebarria, Pelosi and Smit2012, Reference Batenburg, Friedrich, Moriya, Voigt, Cournède, Moebius, Blum, Bornemann, Fiebig, Hasegawa, Hull, Norris, Röhl, Sexton, Westerhold and Wilson2018) also suggested that a negative shift of the δ13C profile at c.67.5 Ma is indicative of a distinct relative drop in sea level. In the ENCI-HeidelbergCement Group quarry this numerical age corresponds to the top of the Lanaye Member and indicates the beginning of the distinct hiatus between the Gulpen and Maastricht formations interpreted as the sequence boundary TA 1.1 by Felder (Reference Felder1997a). The numerical age of 66.2 Ma given by Batenburg et al. (Reference Batenburg, Sprovieri, Gale, Hilgen, Hüsing, Laskar, Liebrand, Lirer, Orue-Etxebarria, Pelosi and Smit2012) for their 1.2 Ma cycles corresponds to the basis of the Meerssen Member and also to the base of cycle TA 1.2 (see above). The numerical age of 68.7 Ma, however, cannot be assigned to a sequence boundary or another sedimentologic event in the Maastricht area, unless it is correlated with the basis of the Lixhe 3 Member at c.68.6 Ma, corresponding to a change in flint type and abundance.
According to Miller et al. (Reference Miller, Wright and Browning2005), in the upper Cretaceous of the New Jersey coastal plain (North America) the 2.4 Ma very long eccentricity cycle corresponds well to identified hiatuses and/or sequence boundaries there. For the Maastricht area, it is obvious that the numerical age of 67.5 Ma is associated with a major hiatus and a sequence boundary (TA 1.1 of Felder, Reference Felder1997a). Following the concept of Miller et al. (Reference Miller, Wright and Browning2005), the next sequence boundary should be expected at c.69.9 Ma. This numerical age corresponds well to the top of interval 4 of the Vijlen Member (Böckler Horizon), dated here at 69.8 Ma (Fig. 10). According to Felder (Reference Felder1997a), the Böckler Horizon corresponds to the sequence boundary characterising the base of cycle UZA 4.5.
Kominz et al. (Reference Kominz, Browning, Miller, Sugarman, Mizintsevaw and Scotese2008, fig. 10) plotted two major sea-level lowstands during the Maastrichtian from the New Jersey and Delaware coastal plain; however, they placed the K/Pg boundary at 65.5 Ma. Correcting their numerical ages for 500 kyr would place the first major lowstand between c.67.5 and 66.5 Ma, the second between c.72.0 and 69.5 Ma. The first lowstand corresponds fairly well to the hiatus between the Gulpen and Maastricht formations in the ENCI-HeidelbergCement Group quarry (67.5–66.8 Ma). The second lowstand commenced before deposition of the Vijlen Member started, and ended within interval 6 of the Vijlen Member (Fig. 11). The Vijlen Member in the type Maastrichtian area is special, because the oldest deposits of this unit are limited to channel-like structures. Only the stratigraphically youngest deposits belonging to interval 6 and possibly the uppermost portion of interval 5 are present everywhere in the distribution area of the Vijlen Member when not eroded (Felder, Reference Felder1997a). Felder (Reference Felder2001) placed the boundary between his ecozones III and IV close to the basis of interval 6 of the Vijlen Member, which is characterised among other things by the completed fill-up of the channel-like structures, which were cut into the seafloor during the late late Campanian. In this respect the ‘extended’ end of the Campanian–Maastrichtian boundary and early Maastrichtian lowstand of Kominz et al. (Reference Kominz, Browning, Miller, Sugarman, Mizintsevaw and Scotese2008) would have its equivalent in the Maastricht region approximately at the basis of interval 6 of the Vijlen Member (Zonneberg Horizon) dated at 69.6 Ma. Thus, the major Maastrichtian sea-level lowstands from the New Jersey and Delaware coastal plain (Kominz et al., Reference Kominz, Browning, Miller, Sugarman, Mizintsevaw and Scotese2008) have their counterparts in the type Maastrichtian area.
The hiatus between the Gulpen and Maastricht formations in the ENCI-HeidelbergCement Group quarry (67.5–66.8 Ma) is also very close to the assigned age for the Rørdal Member defined by Surlyk et al. (Reference Surlyk, Stemmerik, Ahlborn, Harlou, Lauridsen, Rasmussen, Schovsbo, Sheldon and Thibault2010) in the Danish Basin. This member is a prominent stratigraphic interval with the sudden development of Milankovitch-paced chalk–marl cycles, which likely represents a period of enhanced siliciclastic flux and, thus, probably a sea-level lowstand (N. Thibault, pers. comm., 2018). A total of six marl beds have been identified in the type section in the Rørdal quarry, but eight marl beds are visible in the eastern quarry wall. Eight beds have also been identified in gamma-ray logs in a borehole drilled immediately adjacent to the type section, but up to ten gamma-ray peaks are identifiable in the Stevns-1 reference section. Linking the chalk–marl cycles to 100 kyr eccentricity cycles would allow calculating the duration of the sea-level lowstand at 800–1000 kyr, starting close to the basis of Ma 4 at 67.6 Ma (Boussaha et al. Reference Boussaha, Thibault and Stemmerik2016). Consequently, the Rørdal Member may be regarded as a time equivalent of the hiatus (c.700 kyr) between the Gulpen and Maastricht formations (N. Thibault, pers. comm., 2018).
Haq (Reference Haq2014) identified five sea-level events in the Maastrichtian: KMa1 (72 Ma), KMa2 (70.6 Ma), KMa3 (69.4 Ma), KMa4 (68.8 Ma) and KMa5 (66.8 Ma). The latter obviously corresponds to the hiatus in the ENCI-HeidelbergCement Group quarry (67.5–66.8 Ma) at the contact of the Maastricht and Gulpen formations. As a consequence, the ‘Danian’ lowstand PaDa1 at 65.8 Ma may here tentatively be correlated with the sequence boundary at the base of the Meerssen Member (66.2 Ma); alternatively a sixth sea-level decrease KMa6 might be postulated for the Maastrichtian Stage. KMa4 dated at 68.8 Ma cannot (yet) be identified in the Maastricht area. Nevertheless, in the Zumaia section, a negative δ13C shift in combination with a change in lithology at that level could be interpreted in favour of a sea-level lowstand (Batenburg et al., Reference Batenburg, Sprovieri, Gale, Hilgen, Hüsing, Laskar, Liebrand, Lirer, Orue-Etxebarria, Pelosi and Smit2012). The sequence boundary at KMa3 (69.4 Ma) may be correlated with the Böckler Horizon in the Maastricht area (69.8 Ma), despite the relatively large difference in age of 400 kyr. The following sea-level lowstand is dated by Haq (Reference Haq2014) at 70.6 Ma (KMa2). This numerical age marks the beginning of the sedimentation of the Vijlen Member within the channel-like structures and, hence, a transgressive event. For the sake of completeness, it should be mentioned that the sequence boundary at KMa1 (72 Ma) may correspond to that identified by Engelke et al. (Reference Engelke, Linnert, Niebuhr, Schnetger, Brumsack, Mutterlose and Wilmsen2018) in the uppermost Campanian (Belemnella lanceolata Zone) of the Kronsmoor section (northern Germany). In the Maastricht area it might be linked with the formation of the ‘belemnite graveyard’ at the basis of the Vijlen Member in the so-called ‘Beutenaken area’, which may be regarded as a transgressive event as well, but further studies are needed to settle this matter.
In summary, the numerical ages of important sequences boundaries identified by Felder (Reference Felder1997a) in the Maastricht area correspond to records from Zumaia and New Jersey and the general concept of Haq (Reference Haq2014). The general agreement may be regarded as an additional argument for the correctness of the here deduced numerical ages for Maastrichtian deposits in its type area.
Maastrichtian temperature fluctuations of the Boreal Sea
Thibault et al. (Reference Thibault, Harlou, Schovsbo, Stemmerik and Surlyk2016b) recorded sea surface temperature fluctuations during the late Campanian and Maastrichtian of the Boreal Chalk Sea. Their records can be compared with the δ18O curve of Vonhof et al. (Reference Vonhof, Jagt, Immenhauser, Smit, Van den Berg, Saher, Keutgen, Reijmer, Jagt, Jagt-Yazykova and Schins2011), which is incorporated in Figure 11. In the Stevns-1 core, Thibault et al. (Reference Thibault, Harlou, Schovsbo, Stemmerik and Surlyk2016b) recorded two major cooling intervals, the first in the early, and the second in the late Maastrichtian. The transition between the early Maastrichtian cooling and mid-Maastrichtian warming was characterised by a rapid temperature increase between 69.8 and 69.5 Ma in the Boreal Chalk Sea. In the Maastricht area, the δ18O values indicated a rapid decrease between 69.7 and 69.5 Ma (Fig. 11), following almost perfectly the temperature increase at Stevns-1, and thus confirm the numerical ages calculated for this interval in the Maastricht area. The mid-Maastrichtian warming period lasted from 69.5 to 68.4 Ma in the Boreal Chalk Sea of Denmark, but may be extended up to c.68.0 Ma, depending on interpretation of the data supplied by Thibault et al. (Reference Thibault, Harlou, Schovsbo, Stemmerik and Surlyk2016b, their fig. 5). Sea surface temperature remained low until 66.3 Ma. This development in the Boreal Chalk Sea of Denmark is not reflected by the data available from Maastricht. Here, the δ18O values would favour a warm temperature as late as the top of the Lanaye Member at c.67.5 Ma indicated by the bulk sample from a level close to the Lichtenberg Horizon (Fig. 11). The warm temperature in the uppermost Gulpen Formation was accompanied by a distinct change in echinoid populations between 68.6 and 68.2 Ma (Jagt, Reference Jagt2000a). The stratigraphically youngest unequivocal records of the genus Echinocorys Leske, Reference Leske and Beer1778 (Echinocorys gr. conoidea (Goldfuss, 1826–44 (Reference Goldfuss1829)) stem from the Lixhe 2 Member with questionable records from Lixhe 3, whereas the genus Hemipneustes Agassiz, Reference Agassiz1836 (Hemipneustes oculatus Cotteau, Reference Cotteau1890 and Hemipneustes striatoradiatus (Leske, Reference Leske and Beer1778)) first appears in the overlying Lanaye Member. This characteristic faunal change may be interpreted in favour of a rise in the local sea-water temperature or, alternatively, of an increased influence of tethyan faunal elements. By contrast, the results of a palynologic and oxygen isotope study of the upper Lixhe 3 and lowermost Lanaye Member with high resolution demonstrated a general cooling trend during this period (Felder et al., Reference Felder, Keppens, Declercq, Normand and Streel2003). Altogether, these changes may reflect a palaeoceanographic reorganisation or, alternatively, a regional shift to a more restricted marginal-marine depositional environment in the Maastricht area resulting in lower δ18O values and less water exchange with the Boreal Chalk Sea of Denmark. As discussed by Bless (Reference Bless1991), the water exchange might have been impaired by (a) temporary barrier(s) created by inversion tectonic movements in the southwestern part of the North European shelf sea, which would have inhibited the transport of warm water masses towards the Boreal Chalk Sea and reinforced a cooling trend there. In this context, the increasing δ18O values documented for the lower Maastricht Formation would not necessarily indicate a temperature decrease, but rather an intensified water exchange with the Boreal Chalk Sea of Denmark due to the inundation of the barrier(s).
The δ18O value from a level close to the Schiepersberg Horizon in the Maastricht Formation is derived from a bulk sample similar to the value from the sample close to the Lichtenberg Horizon. Note that the majority of the δ18O data of Vonhof et al. (Reference Vonhof, Jagt, Immenhauser, Smit, Van den Berg, Saher, Keutgen, Reijmer, Jagt, Jagt-Yazykova and Schins2011) were measured from belemnite guards. Bulk samples have to be interpreted with care, because, in the material studied, bulk carbonate δ18O data were characterised by generally lower values than those deduced from belemnite samples, which was interpreted as the result of a significant diagenetic overprint on bulk carbonate samples (Vonhof et al., Reference Vonhof, Jagt, Immenhauser, Smit, Van den Berg, Saher, Keutgen, Reijmer, Jagt, Jagt-Yazykova and Schins2011). As a consequence, the δ18O value from the level close to the Schiepersberg Horizon could be slightly too low, indicating that the δ18O value from the level of the Romontbos Horizon may be considered the oldest reliable measurement for the Maastricht Formation. If this view is accepted, the slight decrease of δ18O close to the basis of the Nekum Member may be indicative of a temperature increase. This interpretation may be confirmed by the FAD of M. murus in the Nekum Member, a typical warm-water species. The almost contemporaneous appearance of M. murus in the Maastricht (66.2–66.4 Ma; Veerbeck, Reference Verbeek1977) and Zumaia sections (66.37 ± 0.16 Ma; Batenburg et al., Reference Batenburg, Gale, Sprovieri, Hilgen, Thibault, Boussaha and Orue-Etxebarria2014) likely corresponds to a colonisation event of cooler and northern, mid-latitude areas correlative to the base of the acme of the species at low latitudes (Thibault & Gardin, Reference Thibault and Gardin2010; Thibault & Husson, Reference Thibault and Husson2016). This colonisation event is the likely expression of the end-Cretaceous, Deccan-induced greenhouse warming, whose onset is indeed around 300 to 400 kyr before the K/Pg boundary (Thibault et al., Reference Thibault, Galbrun, Gardin, Minoletti and LeCallonec2016a). The warm water influence is also well documented by benthic foraminifers. Amongst the rich benthic assemblages, large ‘Tethyan’ forms, e.g. Orbitoides apiculata Schlumberger, Reference Schlumberger1902, Daviesina fleuriausi (d'Orbigny, Reference d’ Orbigny1826) and Siderolites laevigatus (d'Orbigny, Reference d’ Orbigny1826), predominate especially in the upper Nekum Member (above the Kanne Horizon) and throughout the overlying Meerssen Member (Jagt, Reference Jagt1999; Jagt & Jagt-Yazykova, Reference Jagt, Jagt-Yazykova, Jagt, Donovan and Jagt-Yazykova2012), although some species first occur lower in the section, e.g. Omphalocyclus macroporus (Lamarck, Reference Lamarck1816) in the basal Gronsveld Member (Jagt, Reference Jagt1999) and Siderolites calcitrapoides Lamarck in Faujas de Saint Fond, Reference Faujas de Saint Fond1799 [1801] in the Schiepersberg Member (Renema & Hart, Reference Renema, Hart, Jagt, Donovan and Jagt-Yazykova2012).
Discussion
Traditionally, the lower/upper Maastrichtian boundary in northwest Europe has been placed at the FAD of the belemnitellid Belemnitella junior Nowak, Reference Nowak1913 (e.g. Jeletzky, Reference Jeletzky1958; Christensen, Reference Christensen1997). Another criterion for recognition of this boundary is the FAD of the calcareous nannofossil Lithraphidites quadratus Bramlette & Martini, Reference Bramlette and Martini1964 (Ogg et al., Reference Ogg, Agterberg, Gradstein, Gradstein, Ogg and Smith2004). In the study area, the boundary is placed at the LAD of Stensioeina pommerana within interval 6 of the Vijlen Member (Jagt & Jagt-Yazykova, Reference Jagt, Jagt-Yazykova, Jagt, Donovan and Jagt-Yazykova2012), as suggested by Jagt et al. (Reference Jagt, Dortangs, Felder and Meessen1999); Figure 11 here matches their interpretation. At Hemmoor (northern Germany), the lower/upper Maastrichtian boundary is placed either at marl bed M900, or 5 m higher at the FAD of Belemnitella junior (cf. Niebuhr, Reference Niebuhr2006). This level is distinctly above the LAD of S. pommerana. In view of the fact that the FAD of Belemnitella junior in the Maastricht area is close to the base of interval 4 of the Vijlen Member and situated distinctly below the LAD of S. pommerana, it was suggested that the FAD of this belemnitellid was diachronous between Maastricht and Hemmoor (Vonhof et al., Reference Vonhof, Jagt, Immenhauser, Smit, Van den Berg, Saher, Keutgen, Reijmer, Jagt, Jagt-Yazykova and Schins2011), indicating that this index species might not represent an appropriate indicator of the upper Maastrichtian in the study area. Surlyk et al. (Reference Surlyk, Rasmussen, Boussaha, Schiøler, Schovsbo, Sheldon, Stemmerik and Thibault2013) placed the lower/upper Maastrichtian boundary in the Stevns-1 borehole section on the basis of nannofossil evidence, i.e. the FAD of L. quadratus, which is in the interval 175.22–170.50 m of the core, dated at c.68.8 Ma. According to Bless & Streel (Reference Bless, Streel, Streel and Bless1988) and Jagt (Reference Jagt1999), nannofossil assemblages of most of the Lixhe 1–3 members indicate a pre-L. quadratus Zone age, while the index species L. quadratus first appears above the Boirs Horizon in the higher Lixhe 3 Member (at c.68.2 Ma). This age difference between the Stevns-1 core and the ENCI-HeidelbergCement Group quarry would thus equal 600 kyr, which is acceptable, taking into account the general rarity of this species in the Boreal Realm (Boussaha et al., Reference Boussaha, Thibault and Stemmerik2016) and documentation of the FAD of L. quadratus between 68.1 and 68.8 Ma (Boussaha et al., Reference Boussaha, Thibault and Stemmerik2016; Thibault, Reference Thibault2016). This short discussion indicates that, depending on definition, the lower/upper Maastrichtian boundary in the Maastricht area could be placed between c.70.0 Ma (FAD of Belemnitella junior) and c.68.2 Ma (FAD of L. quadratus). In this study, the proposal of Jagt et al. (Reference Jagt, Dortangs, Felder and Meessen1999), the LAD of S. pommerana (69.5 Ma), is retained.
The present results also contribute to the discussion, when the genus Belemnella disappeared in the Maastricht area. Keutgen et al. (Reference Keutgen, Jagt, Felder and Yazykova2010) pointed out that the Belemnella specimens found in interval 3 of the Vijlen Member are original and of lower Maastrichian age. The present study confirms a late Belemnella sumensis Zone age for interval 3 of the Vijlen Member. Keutgen et al. (Reference Keutgen, Jagt, Felder and Yazykova2010, their fig. 9) also presented evidence that the Belemnella specimens collected from intervals 3 and 4 in the so-called ‘Aachen area’ had reached a developmental stage with respect to the shape of the guards that is transitional between Belemnella sumensis Jeletzky, Reference Jeletzky1949 and Belemnella cimbrica Birkelund, Reference Birkelund1957. However, interval 4 of the Vijlen Member at Altembroeck yielded several specimens of Belemnella sumensis considered reworked (Keutgen, Reference Keutgen1997, Reference Keutgen, Jagt, Jagt-Yazykova and Schins2011), which pose the question whether or not representatives of the genus Belemnella found in interval 4 are generally reworked. In addition, the genus Belemnella was not found in the Vijlen Member of the former CPL SA Haccourt (now Kreco) quarry, with the exception of a few specimens from local burrows in the Zeven Wegen Member underlying the Froidment Horizon (Keutgen & Van der Tuuk, Reference Keutgen and Van der Tuuk1991). This indicates that Belemnella is not present in the upper portion of interval 5 and in interval 6 of the Vijlen Member. Schulz & Schmid (Reference Schulz and Schmid1983) recorded Belemnella cf. cimbrica from the lowermost metre of the Vijlen Member in the former CBR Lixhe-HeidelbergCement group quarry, which was situated immediately north of the CPL SA Haccourt quarry. Here, the Vijlen Member reaches a thickness of c.25 m, which is c.10 m more than at CPL SA Haccourt. Taking into account that interval 6 of the Vijlen Member reaches a thickness of c.12 m at CPL SA Haccourt, about 13 m of sediments older than interval 6 remain in the CBR Lixhe quarry. Because interval 5 of the Vijlen Member, when completely developed, reaches a thickness between 12 and 15 m (Felder, Reference Felder1997a), the beginning of sedimentation at the CBR Lixhe quarry should have started close to the basis of interval Vijlen 5. This would imply that the genus Belemnella disappeared in the Maastricht area latest close to the Böckler Horizon. Note that Keutgen (Reference Keutgen1996) recorded six Belemnitella junior but a single Belemnella cf. cimbrica from the lowermost metre of Vijlen Member at CBR Lixhe, indicating the dominance of Belemnitella junior at that level. The present considerations allow the LAD of Belemnella in the Maastricht area to be confined to a narrow interval, between 70.0 and 69.8 Ma (Fig. 10), with limited evidence favouring the latter numerical age. Since the mean values for the shape of the guards of presumably non-reworked belemnite samples from interval 4 of the Vijlen Member are not different from those found in interval 3, but transitional between Belemnella sumensis and Belemnella cimbrica, it remains a matter of debate whether or not the specimens collected from interval 4 should be assigned to Belemnella cimbrica or Belemnella sumensis (Fig. 12). The reworked sample of Belemnella from Wilkensberg (interval 6 of the Vijlen Member) that revealed shape-values typical of Belemnella cimbrica (Keutgen & Van der Tuuk, Reference Keutgen and Van der Tuuk1991; Keutgen et al., Reference Keutgen, Jagt, Felder and Yazykova2010) cannot be taken as an argument in favour of the presence of Belemnella cimbrica, because the mean values of that comparatively small sample (16 specimens) are not significantly different from those of the samples from intervals 3 and 4 of the Vijlen Member.
Another interesting aspect represents information on the oldest deposits of Maastrichtian age in the Maastricht area, which are generally referred to the Vijlen Member, because these are rarely accessible. With reference to Thibault et al. (Reference Thibault, Husson, Harlou, Gardin, Galbrun, Huret and Minoletti2012b), the top of the middle Belemnella sumensis Zone at Kronsmoor is dated at 70.4 Ma. It follows from this absolute numerical age that this zone should be present in interval 1 of the Vijlen Member (Fig. 11). This is of significance in attempts to elucidate the origin of reworked specimens of Belemnella cf. praearkhangelskii Naidin, Reference Naidin1964 that occur in interval 4 at Altembroeck (Keutgen, Reference Keutgen1997, Reference Keutgen, Jagt, Jagt-Yazykova and Schins2011). Obviously, a sea-level fall (not ruling out a tectonic component) during or immediately before the sedimentation of this interval resulted locally in erosion of nearly the entire sequence of the Vijlen Member then deposited.
One of the few localities that exposed the lowermost portion of the Vijlen Member was the Bovenste Bos quarry, described in detail in Keutgen & Van der Tuuk (Reference Keutgen and Van der Tuuk1991) and Keutgen et al. (Reference Keutgen, Jagt, Felder and Yazykova2010). At that quarry, the Vijlen Member starts with a glauconitic greensand type of sediment that fills burrows piping down into the topmost Beutenaken Member and contains a multitude of belemnite guards (‘belemnite graveyard’). However, this glauconitic greensand type of sediment is separated from the ‘typical’ basal Vijlen Member (overlying the Beutenaken Member with the burrows) by a ‘conglomerate’ (up to 5 cm in thickness), which consists of a few rounded quartz grains and quartzite pebbles. These components are embedded in a glauconitic, yellowish grey marlstone that differs from the material in the burrows, but resembles that of the overlying Vijlen Member. The marlstones of the ‘typical’ Vijlen Member above the ‘conglomerate’ yield Belemnella sumensis with AV mean values (ventral shape of guard) and Lsn (standardised length of rostrum solidum) indicative of early forms of Belemnella sumensis. The base of the Belemnella sumensis Zone may be dated at c.70.8–70.9 Ma in the Kronsmoor section (Thibault et al., Reference Thibault, Husson, Harlou, Gardin, Galbrun, Huret and Minoletti2012b). For the Mamelis stratotype of the Vijlen Member, bioclasts indicate that the onset of deposition of this unit can be dated at c.70.6 Ma (Fig. 11), which matches the belemnite record above the ‘conglomerate’ at the Bovenste Bos quarry. In this respect, the Bovenste Bos quarry represents a locality that is adequate for determining the onset of sedimentation of the lowermost Vijlen Member (with the exception of the burrows in the Beutenaken Member). However, Felder (Reference Felder2001) interpreted the lowermost c.0.8 m of the Vijlen Member at the Bovenste Bos quarry as winnowed relicts of intervals 0–5 and referred the overlying portion to interval 6. Obviously, care has to be taken when interpreting the fossil record of the lowermost metre of Vijlen Member in the Bovenste Bos quarry. The majority of fossils may be typical of the lower Belemnella sumensis Zone, but the possibility of a ‘contamination’ with stratigraphically younger fossils must be taken into consideration. Considering winnowing processes as proposed by Felder (Reference Felder2001) would be well in line with the record of reworked Belemnella cf. praearkhangelskii in interval 4 at Altembroeck and would offer a potential source of the reworked belemnite material (Fig. 1).
Vandenberghe et al. (Reference Vandenberghe, Van Simaeys, Steurbaut, Jagt and Felder2004) interpreted strata in the Maastricht area in terms of sequence-stratigraphic concepts and regarded the so-called belemnite lag deposit (‘belemnite graveyard’) at the base of the Vijlen Member in the so-called ‘Beutenaken area’ as a separate sequence, followed by the next sequence starting in the Bovenste Bos quarry with the ‘typical’ Vijlen Member with the ‘conglomerate’ at the base. The beginning of the sedimentation of the ‘belemnite graveyard’ with Belemnella obtusa Schulz, Reference Schulz1979 as the dominating belemnite species may thus correlate with the lower transgressive system tract identified by Engelke et al. (Reference Engelke, Linnert, Niebuhr, Schnetger, Brumsack, Mutterlose and Wilmsen2018) in the Belemnella obtusa Zone of the Kronsmoor section. Keutgen et al. (Reference Keutgen, Jagt, Felder and Yazykova2010) summarised the belemnite sequence in the burrows that pipe down into the topmost Beutenaken Member typical of the ‘belemnite graveyard’ at the base of the Vijlen Member in the Bovenste Bos quarry as follows. The first set of belemnites that entered the burrows comprised mainly Belemnitella minor II Christensen, Reference Christensen1995, which is indicative of a latest Campanian age (Tercis definition; see Odin & Lamaurelle, Reference Odin and Lamaurelle2001). Subsequently, the burrows were filled mainly with Belemnella obtusa from different stratigraphic levels within the Belemnella obtusa Zone. Hence, at the Bovenste Bos quarry, the ‘graveyard’ yielded belemnite species that are typical of portions of the long eccentricity intervals Ma 13 to Ma 15, in addition to (an) uppermost Campanian interval(s) (Thibault et al., Reference Thibault, Husson, Harlou, Gardin, Galbrun, Huret and Minoletti2012b). However, the depositional history of the ‘belemnite graveyard’ at the base of the Vijlen Member is complex and more data are needed before an extension of the long eccentricity intervals to below Ma 12 may be considered for the Vijlen Member.
Conclusion
The present article aimed at relating bioclast cycles with Milankovitch cyclicity and, in doing so, to establish numerical ages for the Maastrichtian deposits in its type area. The methodological basics of this approach were elaborated between 1963 and 2009 by Peter Jozef (Sjeuf) Felder. The identified bioclast cycles based on Felder's concept were interpreted as either short or long eccentricity cycles by comparing them with the already established 20 kyr precession cycles reported by Zijlstra (Reference Zijlstra1994), Zijlstra et al. (Reference Zijlstra, Brouwers, Brinkhuis, De Boer, Brinkhuis and Smit1996) and Schiøler et al. (Reference Schiøler, Brinkhuis, Roncaglia and Wilson1997). Smaller hiatuses in the range of one to a few 20 kyr cycles could be identified in the upper Maastricht Formation in case a 100 kyr short eccentricity cycle contained fewer than five precession cycles. In addition, a large hiatus was recognised at the contact of the Gulpen and Maastricht formations. In order to date the period of non-deposition, it was necessary to establish numerical ages for certain reference levels in the Maastricht and Gulpen formations. For the Maastricht Formation, the K/Pg boundary dated at 66.0 Ma and placed in the Berg en Terblijt Horizon in the upper Meerssen Member (top of IVf-6) was selected as a reference. For the Gulpen Formation, the base of the Pervosphaeridium tubuloaculeatum ‘b’ dinoflagellate Zone in the Maastricht area was correlated with the top of the Alterbidinium acutulum subzone of the Triblastula utinensis Zone, which is dated at c.69.2 Ma in the Stevns-1 reference section. The so established numerical ages for the upper Gulpen (Vijlen to Lanaye members) and Maastricht formations indicated a hiatus of c.700 kyr between these formations. The hiatus is interpreted as a sea-level lowstand, which has its counterparts in Denmark (Rørdal Member), Spain (Zumaia section) and the USA (New Jersey and Delaware coastal plain). It also corresponds to the sequence boundary at the base of cycle TA 1.1 of Haq et al. (Reference Haq, Hardenbol, Vail, Wilgus, Hastings, St Kendall, Posamentier, Ross and Van Wagoner1988) as identified by Felder (Reference Felder1996). Based on the present results, this sequence boundary can be dated at c.67.5 Ma. The other sequence boundaries identified by Felder (Reference Felder1996), UZA 4.5 at the Böckler Horizon and TA 1.2 at the Caster Horizon, could be confirmed and dated at 69.8 and 66.2 Ma, respectively.
The Maastrichtian deposits in the Maastrichtian type region comprise the Vijlen, Lixhe and Lanaye members of the Gulpen Formation and the Valkenburg, Gronsfeld, Emael, Nekum and Meerssen Members of the Maastricht Formation. The deposits preserved here cover (parts of) the 400 kyr long eccentricity cycles Ma 1 to Ma 12 such as indicated by Surlyk et al. (Reference Surlyk, Rasmussen, Boussaha, Schiøler, Schovsbo, Sheldon, Stemmerik and Thibault2013) for the Stevns-1 core reference section in eastern Denmark. Except for the belemnite graveyard, which is locally developed at the base of the Vijlen Member and distinguished by the presence of Belemnella obtusa (Schulz, Reference Schulz1979), interval 0 of the Vijlen Member is characterised by the stratigraphically highest records of Bolivinoides sidestrandensis Barr, Reference Barr1966 co-occurring with Belemnella sumensis Jeletzky, Reference Jeletzky1949. The co-occurrence of both index species indicates the lower Trochoceramus radiosus inoceramid zone and the lower Belemnella sumensis Zone sensu germanico. With the present approach, the basis of interval 0 of the Vijlen Member could be dated at 70.6 Ma, which is slightly younger than the basis of the Belemnella sumensis Zone in the Kronsmoor section at c.70.8–70.9 Ma (Thibault et al., Reference Thibault, Husson, Harlou, Gardin, Galbrun, Huret and Minoletti2012b). The index coleoids Belemnella cimbrica Birkelund, Reference Birkelund1957 and Belemnella fastigata Schulz, Reference Schulz1979 have not yet been unequivocally identified in the Maastrichtian type area, which hampers a reliable correlation of upper lower Maastrichtian deposits with the Hemmoor quarry in northern Germany. With respect to the lower/upper Maastrichtian boundary in the Maastricht area, its position depends on the applied definition. If it is defined by the FAD of Belemnitella junior Nowak, Reference Nowak1913, it should be dated c.70.0 Ma, if defined by the FAD of Lithraphidites quadratus Bramlette & Martini, Reference Bramlette and Martini1964 dated at c.68.2 Ma, just to mention the maximum range. In the present study, the definition of the lower/upper Maastrichtian boundary proposed in Jagt et al. (Reference Jagt, Dortangs, Felder and Meessen1999), the LAD of S. pommerana (69.5 Ma), is retained.
For the Maastricht Formation, biostratigraphic relevant information is limited to the upper portion. Here, warm water species become frequent in the Nekum Member, especially above the Kanne Horizon (66.3 Ma). This faunal change correlates with the end-Cretaceous, Deccan-induced greenhouse warming. The index pachydiscid Menuites terminus (Ward & Kennedy, Reference Ward and Kennedy1993) is known from the upper Meerssen Member, but a single, flint-preserved fragment from the Nekum Member belongs either to Menuites fresvillensis (Seunes, Reference Seunes1890) or to Menuites terminus, which could potentially extend the range of the latter species (Jagt et al., Reference Jagt, Jagt-Yazykova, de Blok, Jagt-Yazykova, Jagt and Mortimore2018). The FAD of the index scaphitid Hoploscaphites constrictus johnjagti Machalski, Reference Machalski2005 is situated c.80 kyr before the K/Pg boundary (Jagt, Reference Jagt2012; Keutgen et al., Reference Keutgen, Remin and Jagt2017).
Acknowledgements
First of all, I am grateful to the late Sjeuf Felder for decades of field work, collecting and assessing bioclasts, refinement of analytical approaches and development of concepts for identification of sea-level fluctuations and Milankovitch cyclicity. A few years prior to his death, Sjeuf was able to convince me of the potential of his approach. Since then, I have been critically evaluating his data; in the great majority of cases, Sjeuf's conclusions have been corroborated, albeit with occasional, slight modifications. I also express thanks to John W.M. Jagt (Maastricht), who provided items of literature and sections for the present study and critically reviewed the manuscript; Nicolas Thibault (København) for critically reading the manuscript, helpful discussions and offering additional information on the Rørdal Member; Silke Voigt (Frankfurt am Main) for supplying stable isotope data of the Kronsmoor–Hemmoor section; Zbigniew Remin (Warszawa) for providing a rare literature source; and Hamid Slimani (Rabat-Agdal), Danuta Peryt (Warszawa) and Noël Vandenberghe (Leuven), who provided valuable and very helpful discussions on issues covered here. I would also like to thank Andrew Gale (Portsmouth) and Geert-Jan Vis (Utrecht) for their helpful comments on the manuscript and suggestions.
Supplementary material
To view supplementary material for this article, please visit https://doi.org/10.1017/njg.2018.15



