





1. Introduction
The High-Arctic is one of the most rapidly warming regions in the world (Nordli and others, Reference Nordli2020; Constable and others, Reference Constable and Pörtner2022), with Svalbard valley glaciers having receded and thinned substantially since their maximum extent during the Neoglacial (4.2 ka BP—1920 CE) (Martín-Moreno and others, Reference Martín-Moreno, Álvarez and Hagen2017; Farnsworth and others, Reference Farnsworth2020; Geyman and others, Reference Geyman, van Pelt, Maloof, Aas and Kohler2022). Consequently, many smaller ice masses on the archipelago have undergone, or are currently undergoing, a transition from a polythermal to a cold-based thermal regime (Hodgkins and others, Reference Hodgkins, Hagen and Hamran1999; Glasser and Hambrey, Reference Glasser and Hambrey2001). Modelling investigations of glaciers elsewhere in the Arctic reveal that present-day surface air temperatures and ice thicknesses are not in equilibrium with current basal ice temperatures. This discrepancy has been shown to depend on variables spanning centennial to decadal timescales. Glaciological conditions present as far back as the Little Ice Age can influence (at least in part) glacier thermal regime (e.g. Wohlleben and others, Reference Wohlleben, Sharp and Bush2009), whereas the up-glacier migration of equilibrium line altitudes, and the associated lack of surface latent heat release, has led to the cooling of ice masses on the order of decades (e.g. Delcourt and others, Reference Delcourt, Van Liefferinge, Nolan and Pattyn2013).
Reconstructing these thermal and associated dynamic changes is a fundamental challenge, especially as some have occurred over a period of time that is beyond the scope of direct observations. One approach is to analyse the structural characteristics of ice masses, which record ice-flow history in their three-dimensional (3-D) geometries. Even though the 3-D characteristics of many types of ice structures can be related to strain patterns to varying degrees (Jennings and Hambrey, Reference Jennings and Hambrey2021), the development and evolution of ductile structures are of particular interest for investigating changes in ice-flow dynamics. For example, longitudinal foliation is the product of high cumulative strain on previously formed structures, such as primary stratification and crevasse-trace assemblages (Hambrey, Reference Hambrey1977; Hooke and Hudleston, Reference Hooke and Hudleston1978; Jennings and Hambrey, Reference Jennings and Hambrey2021). Instead of chiefly reflecting localised strain rates, the 3-D geometry of foliation in valley glaciers preserves a record of cumulative strain that spans the residence time of the ice within the glacier system (Hambrey and others, Reference Hambrey2005). The formation, evolution and kinematic significance of the wide array of glaciological structures have been covered in detail by several review articles (e.g. Hambrey and Lawson, Reference Hambrey, Lawson, Maltman, Hubbard and Hambrey2000; Hudleston, Reference Hudleston2015; Jennings and Hambrey, Reference Jennings and Hambrey2021).
A flow unit is defined as any single unit of ice that contributes to a glacier from a discrete accumulation basin (Jennings and others, Reference Jennings, Hambrey and Glasser2014). Interactions among adjacent flow units can reveal important information about past ice-flow configuration and changes in ice flow within the glacier system (Jennings and others, Reference Jennings, Hambrey, Moorman, Holt and Glasser2022). By investigating the structural characteristics of flow units, it is possible to evaluate the context within which structures develop, as well as the dynamic history of an ice mass. As predominantly negative mass balances are shifting equilibrium lines higher (Hagen and others, Reference Hagen, Kohler, Melvold and Winther2003; Möller and Kohler, Reference Möller and Kohler2018; Schuler and others, Reference Schuler2020), glacier structures are being progressively revealed, rendering structural data increasingly available and maximising the span of time visible in the structural record.
The aim of this investigation is to document the structural characteristics of flow units and the evolution of their structures, in order to evaluate their utility for assessing ice-dynamic changes on centennial timescales. To achieve this, several specific objectives that are applied to four Svalbard valley glaciers are addressed: (i) large-scale structural characteristics are assessed through glacier-wide mapping of glacier structures visible in aerial and satellite imagery; (ii) meso-scale textural and macro-crystallographic characteristics of ice structures are evaluated from ground observations and structural measurements, especially in the vicinity of flow-unit boundaries; (iii) the genetic origin and evolution of ice facies are investigated through their geochemical (isotopic) signatures; and (iv) sedimentological characteristics of debris entrained in ice facies exposed at flow-unit boundaries are evaluated.
2. Geographical and glaciological context
The Norwegian High-Arctic archipelago of Svalbard lies between 76° and 81° N (Fig. 1), and at present, 57% of the land surface is glacierised, representing a total ice-covered area of 34 000 km2 (Nuth and others, Reference Nuth2013). This accounts for ∼10% of the glacierised area in the Arctic, excluding the Greenland Ice Sheet (Schuler and others, Reference Schuler2020). Svalbard’s contribution to global sea-level change over the last 40 years has been 0.026 mm a−1 (Nuth and others, Reference Nuth, Moholdt, Kohler, Hagen and Kääb2010).
Location map of study area. (a) Red marker pinpoints location of Kongsfjorden on NW coast of Spitsbergen. (b) Topographic map of Brøggerhalvøya with the locations of the four glaciers highlighted. Maps show position of flow-unit boundaries, sediment sampling sites and cryo-lithological log locations.

The four valley glaciers investigated in this study (Austre Brøggerbreen, Midtre Lovénbreen, Austre Lovénbreen and Pedersenbreen) are all located on Brøggerhalvøya (79°55′ N), a peninsula in north-western Spitsbergen (Fig. 1). The glaciers were selected as they are of broadly similar scale, geometry, aspect and location, yet they have contrasting thermal regimes, ice-flow dynamics and structural characteristics. Debris inputs predominantly comprise a combination of supraglacial entrainment of rockfall and avalanche debris (Porter and others, Reference Porter, Vatne, Ng and Irvine-Fynn2010) and the subglacial entrainment of basally derived material. The mass balance of the glaciers has been predominantly negative since records began (Lefauconnier and others, Reference Lefauconnier, Hagen, Orbaek, Melvold and Isaksson1999; WGMS, Reference Zemp, Nussbaumer, Gärtner-Roer, Bannwart, Paul and Hoelzle2021), and all the glaciers have receded substantially since their Neoglacial maxima (Farnsworth and others, Reference Farnsworth2020).
Austre Brøggerbreen had a maximum recorded thickness in the accumulation area of 110 m (Björnsson and others, Reference Björnsson1996), with temperate ice only beneath the thickest localities of the glacier. Subsequent ablation and surface-lowering has resulted in the glacier now being primarily composed of cold ice (Hagen and Sætrang, Reference Hagen and Sætrang1991). A lack of Aufeis (icing) formation in the proglacial zone during winter indicates there is little to no water production at the base of the glacier (Stuart and others, Reference Stuart, Murray, Gamble, Hayes and Hodson2003), and most runoff is directed to the margins by supraglacial streams or is routed through englacial channels (Vatne and Irvine-Fynn, Reference Vatne and Irvine-Fynn2016; Kamintzis and others, Reference Kamintzis2018, Reference Kamintzis2023). The glacier has recorded ice-flow velocities that range from 0.5 to 3.0 m a−1 (Hagen and Liestøl, Reference Hagen and Liestøl1990; Hagen and others, Reference Hagen, Liestøl, Roland and Jørgensen1993), and it has been the focus of a previous structural investigation (Jennings and others, Reference Jennings, Hambrey, Glasser, James and Hubbard2016).
Midtre Lovénbreen was shown to be polythermal with comparatively thick areas of temperate ice (up to 50 m) beneath its accumulation area (Björnsson and others, Reference Björnsson1996). However, the boundary between temperate and cold ice has been migrating up-glacier (Rippin and others, Reference Rippin, Willis and Kohler2007). The glacier had measured velocities taken at the equilibrium line that range from 4.4 to 7.3 m a−1 (Liestøl, Reference Liestøl1988; Björnsson and others, Reference Björnsson1996), and it has also been the focus of previous structural investigations (e.g. Hambrey and others, Reference Hambrey2005; Roberson and Hubbard, Reference Roberson and Hubbard2010). Complex sediment/landform associations related to ice structure can be found in the proglacial area of the glacier, while extensive Aufeis forms during the winter as drainage persists year-round (Hambrey and others, Reference Hambrey2005; Midgley and others, Reference Midgley, Glasser, Hambrey, Montanez, Hambrey, Christoffersen, Glasser and Hubbard2007). There has been some debate as to whether Midtre Lovénbreen is, or once was, a surge-type glacier. Photographs dating from 1882 CE (see Hamberg, Reference Hamberg1894) show Midtre Lovénbreen with a near vertical ice cliff, which was interpreted as evidence of the glacier being surge type (Liestøl, Reference Liestøl1988; Hansen, Reference Hansen2003). However, Jiskoot and others (Reference Jiskoot, Murray and Boyle2000) and Hambrey and others (Reference Hambrey2005) concluded that Midtre Lovénbreen was not surge-type, or if the glacier had surged, it had not done so in the past several hundred years.
Austre Lovénbreen has receded by ∼1 km since its Neoglacial maximum (Midgley and Tonkin, Reference Midgley and Tonkin2017). The glacier was known to be polythermal in 2010 with only a small region of temperate ice located at its thickest extent. Subsequent ablation and surface-lowering may have therefore impacted upon its thermal regime. An over-deepened subglacial basin is also present near the terminus of the glacier (Midgley and others, Reference Midgley, Cook, Graham and Tonkin2013; Saintenoy and others, Reference Saintenoy2013).
Pedersenbreen was determined to be polythermal in 2009 (Ai and others, Reference Ai2014), which is supported by the formation of Aufeis in the proglacial zone during the winter (Bennett and others, Reference Bennett, Huddart, Hambrey and Ghienne1996). There are no direct observations of Pedersenbreen being surge-type, but structural evidence and the presence of a deformed medial moraine in repeat photographs have been interpreted as indicators that the glacier, or one of its tributaries, may have surged in the past (Bennett and others, Reference Bennett, Huddart, Hambrey and Ghienne1996; Glasser and others, Reference Glasser, Coulson, Hodkinson and Webb2004).
3. Methods
3.1. Structural glaciological notation
Structural geological conventions were used whereby the sequential order of planar structures are identified using S 0, S 1, S 2 … in ascending order of formation, with associated fold phases denoted using F 1, F 2 … to identify discrete phases of deformation. A deformation phase is defined as deformation that is recognisable as a change in the geometry of a pre-existing body or structure. When defining the order in which structures form sequentially, primary stratification (S 0) is considered to be the first structure to develop as it is the layering of snow preserved during diagenesis into firm and then ice. Stratification thus pre-dates other structures and represents the initial ‘building blocks’ of a glacier (Jennings, Reference Jennings2017; Jennings and others, Reference Jennings, Hambrey, Moorman, Holt and Glasser2022).
A ‘parcel’ of ice may travel through several stress regimes without becoming deformed, or several contiguous stress regimes may contribute to a single phase of deformation. Even though it is not normal practice in structural geology to assign structural notation to joints or fracture sets, in structural glaciology, crevasses and crevasse traces (as well as other types of fracture) are included in the notation scheme. This is in recognition of the fact that fractures can evolve into other structures, for example, how arcuate (or transverse) foliation evolves from crevasse traces that enter a zone of longitudinal compression.
Glacier ice commonly undergoes polyphase deformation; however, suites of structures cannot be temporally separated. As the whole ice mass is deforming simultaneously, ‘early’ structures in the accumulation area form at the same time as ‘later’ structures further down-glacier. Consequently, structures and deformation phases are sequentially ordered in relation to a parcel of ice travelling from the accumulation area to the terminus of the glacier (Hambrey and Milnes, Reference Hambrey and Milnes1977; Jennings and Hambrey, Reference Jennings and Hambrey2021).
3.2. Satellite image and aerial photograph interpretation
Two-dimensional (2-D) surface features of each glacier, which were mapped at a scale of 1:6000, were identified from a combination of optical satellite imagery, aerial photography and field verification in 2013. Features include glacier outlines, areas of supraglacial debris and snow cover, as well as various glaciological structures. The identification of glaciological structures was conducted using the criteria outlined in Table 3 of Jennings and others (Reference Jennings, Hambrey, Moorman, Holt and Glasser2022).
Structural mapping of Austre Brøggerbreen and Midtre Lovénbreen was based on aerial photography obtained by the United Kingdom Natural Environment Research Council (UK NERC) Airborne Research and Survey Facility (ARSF) on 25 July 2004. The photographs were processed in BAE Systems’ SOCET SET digital photogrammetry suite using ground control points extracted from a 2 m resolution lidar digital elevation model (DEM) obtained by the ARSF in 2005. The final georeferenced orthomosaic has a pixel resolution of 0.25 m with a root mean square error of 1.27 m (Jennings and others, Reference Jennings, Hambrey, Glasser, James and Hubbard2016). Structural mapping of Austre Lovénbreen was conducted using a combination of aerial photography obtained during the summer of 2003 by the UK NERC ARSF and Digital Globe (now Maxar Technologies) optical satellite imagery with a resolution of 0.6 m obtained on 8 May 2011 and sourced through Google Earth Pro (Google Earth, 2016). The UK NERC ARSF imagery comprised 18 aerial photographs that were processed using Agisoft PhotoScan Structure-from-Motion software. Ground control points located in the proglacial area of the glacier were used to obtain a single georeferenced orthomosaic with a pixel resolution of 0.174 m and an overall reported error of 0.723 m. Structural mapping of Pedersenbreen was undertaken using Digital Globe (now Maxar Technologies) optical satellite imagery with a resolution of 0.6 m obtained on 8 May 2011 and sourced through Google Earth Pro (Google Earth, 2016).
3.3. Defining flow units and their boundaries
Flow-unit boundaries are delineated on the ground or in remotely sensed imagery by medial moraines, curvilinear ice-surface depressions, strong longitudinal foliation or a combination of the above, all of which can commonly be traced to the glacier terminus. Supraglacial streams also frequently flow in the vicinity of flow-unit boundaries, especially in the upper reaches of a glacier where they have yet to acquire meandering characteristics. Supraglacial drainage tends to become captured by ice-surface depressions, is channelised along the ridge-and-furrow topographic expression of longitudinal foliation or is constrained by elevated medial moraines.
Accumulation basins and their corresponding flow units are numbered sequentially in an anti-clockwise direction from the true-left of a glacier towards the true-right. Some cirques are considered to be composite and are enumerated with suffixes (a, b, c, …) along with their corresponding sub-flow unit. Sub-flow-unit boundaries commonly resemble flow-unit boundaries but can be more subtlety defined by narrow zones of tighter folding (in comparison with the surrounding ice) of primary stratification.
3.4. Cryo-lithological logs
Log sites were located along approximate flowlines, with the logs orientated perpendicular to flow. Structures were identified according to their dimensions, orientation, cross-cutting relationships and ice facies, following Jennings and others (Reference Jennings, Hambrey and Glasser2014) and the criteria outlined in Table 3 of Jennings and others (Reference Jennings, Hambrey, Moorman, Holt and Glasser2022). Areas of debris cover or supraglacial sediment patches were investigated by ‘washing’ the debris from the ice surface to reveal the structures below (Fig. 2a).
(a) Washing supraglacial sediments from the surface of Austre Brøggerbreen to reveal the underlying ice structures. Strong longitudinal foliation is orientated parallel to the medial moraine ridge. Ice flow is towards the left of the photograph. (b) Fine-grained white ice intersected by veins of coarse clear ice at Midtre Lovénbreen. Ice flow is from left to right. (c) Strong longitudinal foliation composed of alternating layers of coarse bubbly and coarse clear ice at boundary between Flow Units 1 and 2a at Pedersenbreen. Ice flow is from left to right. (d) Strong longitudinal foliation as above at Austre Brøggerbreen. Fine-grained sediment entrained in the strongly foliated layers with contrasts between red sediment on left and brown sediment on the right. Ice flow is towards top of the photograph. (e) Strong longitudinal foliation within coarse clear ice facies defined by planes accentuated by the presence of sub-millimetre clots of entrained fine-grained sediment. Ice flow is towards the top of the photograph. (f) Similar (almost isoclinal) folds visible at surface of Austre Lovénbreen, cross-cut by ‘cleavage-like’ longitudinal foliation that is parallel to the axial planes of the folds. Photograph was taken in the middle reach of the glacier, near boundary between Flow Units 2b and 3a. Ice flow is towards the photographer.

3.5. Stable isotope analysis
Oxygen isotope samples were taken in combination with cryo-lithological logs and extracted using an ice screw. Samples were collected in airtight high-density polyethylene vials and were allowed to melt in the shade (Glasser and Hambrey, Reference Glasser and Hambrey2002; Hubbard and Glasser, Reference Hubbard and Glasser2005), before being transported to the University of Birmingham’s School of Geography, Earth and Environmental Sciences stable-isotope facility (SILLA) for stable isotope (δ18O and δD) analyses.
3.6. Sedimentology
Sediment sample sites were selected with regard to structural and ice facies characteristics and sedimentological properties. Sediment that had melted out of the ice in situ and had not experienced any subsequent reworking was collected using a palette knife, whereas sediment-rich ice was extracted using an ice axe and allowed to melt. Samples were dried and gently disaggregated before being dry sieved and weighed (McManus, Reference McManus and Tucker1988; Hubbard and Glasser, Reference Hubbard and Glasser2005). To derive a full grain-size distribution, a sample of the pan fraction (grain diameter < 4.0 Φ [0.063 mm]) was introduced into a Mastersizer 2000 version 5.60 laser granulometer manufactured by Malvern Instruments Ltd (Buurman and others, Reference Buurman, Paper and Muggler1997; Hoey, Reference Hoey, Evans and Benn2004). Hydrochloric acid was added to a small sub-sample of the pan fraction and the effervescence was visually and auditorily assessed as an indication of the presence of calcium carbonate.
4. Glacier structure
The characteristics of ice facies observed at the surface of Svalbard valley glaciers are summarised in Table 1, with examples illustrated in Fig. 2.
Characteristics of ice facies exposed at the surface of Svalbard valley glaciers

4.1. Austre Brøggerbreen
As the surface structures of Austre Brøggerbreen have already been described (Jennings and others, Reference Jennings, Hambrey, Glasser, James and Hubbard2016), only a brief, updated structural summary is included here. The glacier is composed of six flow units (with Flow Units 2 and 5 further divided into three and two sub-flow units, respectively) (Fig. 3). The surface of the glacier is dominated by crevasse traces and, even though several suites of crevasse traces intersect a number of flow units, most remain within an individual flow unit. Once formed, the down-glacier ductile modification of transverse crevasse traces is location dependent. Crevasse traces in Flow Units 2a and 5b become re-orientated clockwise and anti-clockwise, respectively, whereas those in Flow Unit 4 become increasingly arcuate down-glacier, re-orientating their limbs into parallelism with ice flow (Fig. 3).
Structural glaciological map of Austre Brøggerbreen, modified from Jennings and others (Reference Jennings, Hambrey, Glasser, James and Hubbard2016). Background topographic information is sourced from ArcticDEM (Porter and others, Reference Porter2018). Rose diagrams depict strike of crevasse traces (S2) contained in Flow Units 2a and 5b, with ‘r’ values denoting scale (radius) of each diagram. Both rose diagrams are similar, despite the crevasse traces in each flow unit having contrasting down-glacier evolutions. ‘n’ values denote the number of mapped features.

Five cryo-lithological logs were collected along an approximate flowline at the boundary between Flow Units 5a and 5b (Fig. 1). All of the logs have moderate to steeply dipping layers, with the logs located further down-glacier having a lower proportion of moderately dipping layers. Various fractures, ice lenses and veins with differing degrees of ductile modification (folding) are also present. Several logs (especially ABB-LOG1 and ABB-LOG5) have a high proportion of fine-grained ice facies (Fig. S1).
4.2. Midtre Lovénbreen
Midtre Lovénbreen is composed of three flow units (with Flow Units 1 and 2 further divided into two sub-flow units) (Fig. 4). The glacier demonstrates transposition of primary stratification into longitudinal foliation (Hambrey and others, Reference Hambrey2005). Each flow unit within the glacier shares a similar sequential order of structural formation, although the distance down-glacier varies. This is most evident when comparing Flow Units 1b and 2b. Primary stratification in Flow Unit 1b is preserved comparatively far down-glacier (2–3 km), whereas the development of longitudinal foliation in Flow Unit 2b overprints primary stratification within ∼0.5 km (Fig. 4).
Structural glaciological maps of Midtre Lovénbreen and Austre Lovénbreen. Background topographic information is sourced from ArcticDEM (Porter and others, Reference Porter2018). ‘n’ values denote number of mapped features for Midtre Lovénbreen (ML) and Austre Lovénbreen (AL).

Low-medium-angle arcuate fractures that develop near to the terminus of the glacier are also structurally noteworthy. These closed fractures are orientated transverse to flow with a convex down-glacier surface profile. The fractures are not evident in the upper-reaches of the glacier and first appear 1 km up-glacier from the terminus. Down-glacier of this threshold, they become ubiquitous across the snout and cut across flow-unit boundaries (Fig. 4).
Two cryo-lithological logs were obtained, both of which were located on the true-left of the glacier in Flow Unit 1a (Fig. 1). Longitudinal foliation is generally moderately dipping and both logs are characterised by comparatively high concentrations of entrained fine-grained sediments. The proportion of ice facies varies considerably between the logs, with MLB-LOG1 containing a significant amount of fine-grained ice, whereas MLB-LOG2 contains predominantly coarse bubbly and coarse clear ice facies (Fig. S2).
4.3. Austre Lovénbreen
Austre Lovénbreen is composed of three flow units (with Flow Units 2 and 3 further divided into two sub-flow units) (Fig. 4). The glacier reveals transposition of primary stratification into longitudinal foliation, with each flow unit sharing a similar sequential order of structure formation. However, the distance down-glacier that structures form and persist varies among flow units. Strong longitudinal foliation develops at the boundary between Flow Units 1 and 2a and at both boundaries of Flow Unit 3a. Well-spaced low-angle arcuate fractures develop 1 km up-glacier of the terminus and, even though many fractures cross-cut flow-unit boundaries, the majority are contained within individual flow units (Fig. 4). Overall, structural evolution in this glacier resembles that of Midtre Lovénbreen.
Seven cryo-lithological logs were collected along an approximate flowline at the boundary between Flow Units 2b and 3a (Fig. 1). All of the logs comprise predominantly coarse bubbly ice facies, with well-developed longitudinal foliation delineated by sharp planar contacts and alternating ice facies. However, several examples of preserved primary stratification are evident (ALB-LOG1 and ALB-LOG7), with adjacent longitudinal foliation having an axial planar relationship with the folded stratification (Figs. 2f and S3).
4.4. Pedersenbreen
Pedersenbreen is composed of four flow units (with Flow Unit 2 further divided into two sub-flow units) (Fig. 5). The most striking structural element of the glacier is a deformed medial moraine located at the boundary between Flow Units 1 and 2a. The rest of the glacier is dominated by the transition of primary stratification into longitudinal foliation, with all flow-unit boundaries characterised by strong longitudinal foliation. A limited number of arcuate fractures are also present near the terminus, which are primarily concentrated within Flow Unit 2a (Fig. 5).
Structural glaciological map of Pedersenbreen. Background topographic information is sourced from ArcticDEM (Porter and others, Reference Porter2018). ‘n’ values denote number of mapped features.

Three cryo-lithological logs were collected at the surface of Pedersenbreen. All logs were taken across the medial moraine that separates Flow Units 1 and 2a, with the first log located near to their confluence (Fig. 1). The medial moraine comprises sandy gravel with some boulder-sized clasts of up to 0.5 m diameter. Clasts are predominantly subangular to angular, with lithologies including marble, psammite and phyllite, derived from a precipitous headwall. At the confluence, the medial moraine has no relief and comprises a thin and diffuse supraglacial cover of debris several metres wide. The relief of the moraine increases to 2 m and reaches 10 m in width towards the terminus. Each log is characterised by strong longitudinal foliation orientated parallel to the medial moraine, defined by alternating layers of coarse bubbly and coarse clear ice facies (Fig. S4).
5. Sedimentary facies and stable isotope analyses
5.1. Sedimentological analysis
Six sediment samples were obtained from the surface of Austre Brøggerbreen at the boundary between Flow Units 5a and 5b, and three sediment samples were obtained from the surface of Midtre Lovénbreen in Flow Unit 1a (Fig. 1). All samples comprised sorted fine-grained sediments derived from strongly foliated ice facies (Fig. 6a and b). Samples collected from Austre Brøggerbreen also had variable characteristics such as colour (Fig. 6b and c) and calcium carbonate content, suggesting multiple source lithologies.
(a) Fine-grained sediment melting out of strongly foliated ice at the surface of Midtre Lovénbreen. Contact between the sediment-rich ice and adjacent coarse bubbly ice is sharp. Ice-flow direction is from right to left. (b) Alternating layers of strongly foliated coarse bubbly and sediment-rich ice facies at Austre Brøggerbreen. The cross-cutting crevasse trace is composed of coarse clear ice that has been deformed into chevron folds. Reddish sediment is entrained within the crevasse trace, light brown sediments on the left and greenish brown sediments on the right. Ice-flow direction is towards the photographer. (c) Strongly foliated sediment-rich ice extracted from the surface of Austre Brøggerbreen. Crude layering indicates that the ice has experienced pronounced simple shear. (d) Dispersed facies basal ice at Austre Brøggerbreen, showing sub-millimetre clots of entrained fine-grained sediment and cross-cutting lenses of coarse clear ice. (e) Deformed crevasse trace composed of coarse clear ice that cross-cuts moderately foliated coarse bubbly ice at the surface of Austre Brøggerbreen. A central suture runs the length of the crevasse trace. (f) Supraglacial streams at Pedersenbreen, channelised along the topographic (ridge-and-furrow) expression of longitudinal foliation. (g) Strongly sheared dispersed facies basal ice at Midtre Lovénbreen. Clots of entrained sediments have been attenuated into sub-millimetre wavy lenses and layers separated by coarse clear ice facies. (h) Apex of a fold hinge of sediment-rich ice at Midtre Lovénbreen.

All of the samples show a bimodal or polymodal grain-size distribution, with six of the nine samples displaying a prominent spike around the 4 Φ [0.063 mm] particle size (Fig. S5). Generally, the samples with the prominent spike were collected from locations further down-glacier (Figs. 1 and S5). A notable exception is ABB-SED1, which not only has the largest spike of all the samples collected on Austre Brøggerbreen but is also the sample that was collected from the furthest up-glacier (Figs. 1 and S5).
5.2. Isotopic analysis
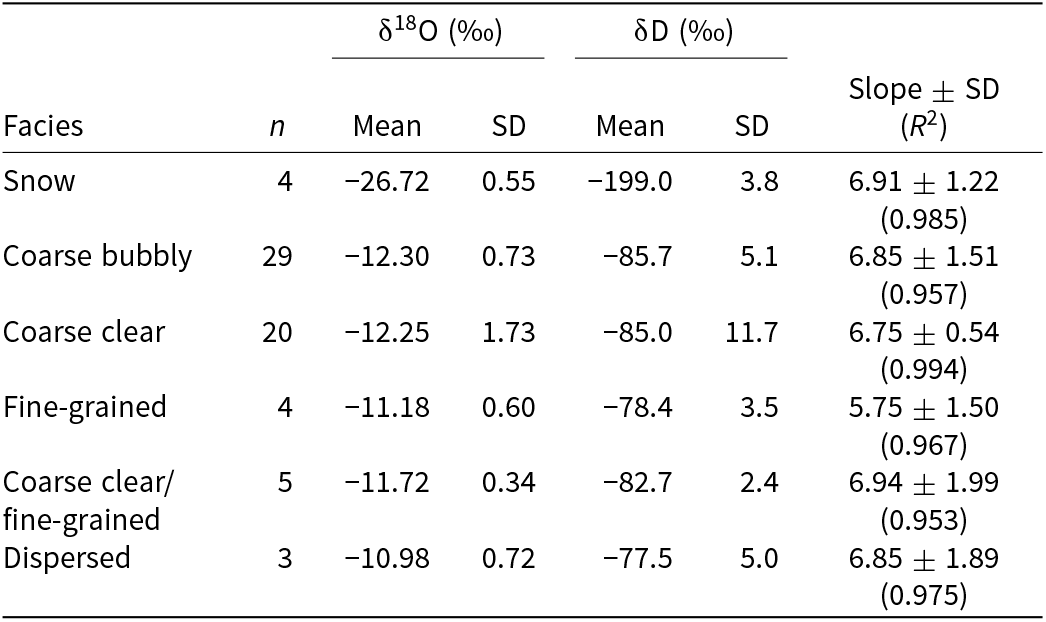
Oxygen isotope samples were collected at the surface of Austre Brøggerbreen, Midtre Lovénbreen and Austre Lovénbreen, with the number of samples dependent on the abundance of the ice facies exposed (Table 2). Fresh snow samples were also collected, which are typically isotopically light and become heavier during firnification as a result of the net loss of relatively isotopically light liquid water from the snowpack during melting and refreezing. Of the ice facies sampled, fine-grained ice and sediment-rich ice facies are isotopically heavier than coarse bubbly, coarse clear and coarse clear/fine-grained ice facies (Fig. 7).
Summary of co-isotopic data for all glaciers sampled. Fresh snow samples were collected from the surface of Midtre Lovénbreen. Strongly foliated ice comprises coarse clear/fine-grained ice facies. Number of samples was dependent upon the abundance of each ice facies
Box plots showing stable isotope analyses (δ18O) of ice facies, illustrating mean (blue square) and median (red line) values, as well as 1 standard deviation (blue box).

6. Interpretation of glacier structures
Surficial ice structures observed in this study include (i) primary stratification; (ii) longitudinal foliation; (iii) spatially limited open fractures (crevasses); (iv) crevasse traces that began as open-fractures and subsequently healed as they became infilled by meltwater, slush and snow (water-healed crevasses); (v) crevasse traces of the tensional vein variety; (vi) the ductile modification and re-orientation of crevasse traces; and (vii) arcuate convex-down-glacier closed fractures exclusively located within ∼1 km of the glacier termini.
6.1. Development and evolution of foliation
Longitudinal foliation observed in this study is commonly composed of closely spaced and often discontinuous planar layers of alternating ice facies orientated parallel to ice flow. The foliation is also recognisable at a crystallographic scale, where it is defined by variations in ice crystal size and shape, bubble concentration, and to a lesser extent, the elongation of air bubbles and ice crystals, the presence of planar contacts or a combination of the above. The transposition of primary stratification into longitudinal foliation (Hambrey, Reference Hambrey1977) is evident from the transitional relationship with distance down-glacier, which is visible at the surface of all the glaciers (Figs. 3–5). At the confluence of two flow units, enhanced pure and simple shear acting parallel to the plane of the shared flow-unit boundary leads to the development of a narrow zone of strong longitudinal foliation in the surrounding ice (Fig. 8). Simple shear in the body of each flow unit would be of the opposite sense, one sinistral and the other dextral, with the strongest shear occurring just up-glacier of the confluence. At and down-glacier of the confluence, the sinistral and dextral shear can be considered to cancel each other out, although they are unlikely to be equal (Fig. 8). Differential flow of the two flow units and simple shear acting along the shared boundary rarely persist for any great distance down-glacier, as illustrated by the continuity of later-forming cross-cutting features (Figs. 3 and 4). The contiguous and pronounced stress regimes found at and below a confluence results in large cumulative strains, which in turn leads to the development of strong longitudinal foliation. Therefore, the relative density of longitudinal foliation at the surface of a glacier acts as a visual representation of enhanced cumulative strains and can aid the identification of flow-unit boundaries (Fig. 9).
Plan view conceptual diagram illustrating the surface strain regimes present at the confluence of two flow units sourced from separate accumulation basins in an idealised glacier. The diagram has no scale and distances are not implied. Depending on the glaciological setting, the zone of simple shear may terminate much closer to the bedrock tip than illustrated.

(a) ‘Heatmap’ diagrams illustrating the relative density of longitudinal foliation in relation to flow unit and sub-flow-unit boundaries. Rose diagrams illustrate the strike of longitudinal foliation for each glacier, with ‘r’ values denoting the scale (radius) and ‘n’ values denoting the number of mapped features. (b) Elevation graph of Austre Brøggerbreen depicting surface topography along transect A–B (transect illustrated on top left heatmap) with the location of flow-unit boundaries marked.

A ‘cleavage-like’ longitudinal foliation that is not inherited from pre-existing structures and cross-cuts folded primary stratification is also evident. The best-defined examples of this type of foliation can be observed in Flow Unit 2a in Austre Brøggerbreen (Fig. 3) and in Flow Unit 3a in Austre Lovénbreen (Fig. 4). The cross-cutting nature and axial planar relationship with folded primary stratification are also clearly illustrated in ALB-LOG1 and ALB-LOG7 (Fig. S3). Although this cleavage-like foliation is readily observable in the field (e.g. Fig. S3), it is less evident in the aerial imagery (e.g. Figs. 3 and 4).
A longitudinal foliation derived from the re-orientation of crevasse traces is exclusively observed at the surface of Austre Brøggerbreen. The re-orientation of crevasse traces near to flow-unit boundaries is occasionally sufficient to produce a ‘fracture-derived’ longitudinal foliation (Jennings and others, Reference Jennings, Hambrey, Glasser, James and Hubbard2016). This is most apparent at the boundaries of Flow Units 4, 5a and 5b, where initially transverse crevasse traces rotate to flow-parallel orientations with distance down-glacier (Fig. 3).
6.2. Dominant structural attributes
In contrast to the other glaciers in this study that are characterised by the transposition of primary stratification into longitudinal foliation, Austre Brøggerbreen is structurally characterised by numerous sets of crevasse traces that persist through the ablation area to its terminus (Fig. 3). Most of these structures are not actively forming today but are relict features. Current low ice-flow velocities (Hagen and Liestøl, Reference Hagen and Liestøl1990; Hagen and others, Reference Hagen, Liestøl, Roland and Jørgensen1993) suggest that most crevasse traces may date from when the glacier was at its maximum extent. Then, ice-flow velocities were greater, and more pronounced velocity gradients resulted in stress levels that were sufficient to induce glacier-wide fracturing. The survival of the crevasse traces as far as the terminus, despite undergoing substantial ablation and surface-lowering, suggests that many penetrate to significant depth, possibly reaching the glacier bed.
Low-angle arcuate fractures that appear in the lower 1 km of Midtre Lovénbreen and Austre Lovénbreen, and to a lesser extent Pedersenbreen, are pervasive near to their termini. These structures commonly intersect multiple flow units and are absent at the surface of the glaciers in their upper and middle reaches. The mechanism by which these fractures form is not clear from the data collected in this study, although they were regarded as thrust-faults in an earlier study of Midtre Lovénbreen (Hambrey and others, Reference Hambrey2005).
6.3. Individual flow-unit characteristics
Whereas the constituent flow units in Midtre Lovénbreen, Austre Lovénbreen and Pedersenbreen follow the same structural sequence, several flow units contained in Austre Brøggerbreen have differing sequences (Flow Units 2a, 4 and 6) (Fig. 10). However, even among flow units with identical structural sequences, there are marked differences in their structural attributes. This is evident in all these glaciers, especially with regard to the distance down-glacier that structures form and the dominance of different structures in different flow units (Figs. 4, 5 and 10). A particularly well-illustrated example is Flow Units 2a, 4 and 5b in Austre Brøggerbreen, which have contrasting down-glacier evolutions of initially transverse crevasse trace sets in response to spatially variable ductile modification (Fig. 3).
Comparative diagram depicting type of structures, their sequential order and exposed extent in each flow unit in each glacier. Upper limit of bars represents distance down-glacier that structures are first visible, with lower limit illustrating furthest distance down-glacier that the structures can be observed. Colour-coded structural notation is located on the right.

6.4. Potential surge-related glacier structures
The presence of a deformed medial moraine between Flow Units 1 and 2a in Pedersenbreen is indicative of a flow instability, suggesting a pulse of increased ice flux has entered the main trunk of the glacier. The cryo-lithological logs taken across the medial moraine are characterised by very strong longitudinal foliation (Fig. S4), indicating the ice adjacent to the flow-unit boundary has experienced pronounced simple shear. A distinctive feature of the deformed medial moraine is the lack of lateral narrowing of Flow Unit 1 up-glacier of the lobe, so it is not strictly a closed loop, as would be expected following a surge (Fig. 5). Alternative explanations could, therefore, be (i) a slowing down of flow in the main glacier trunk, rather than an increase of discharge from the tributary (Flow Unit 1); or (ii) that the initial push of ice from the tributary was maintained as a new steady-state flow.
6.5. Sedimentological and isotopic interpretations
The grain-size distributions of all the sedimentological samples (Fig. S5) are consistent with subglacial material, with the bimodal or polymodal distributions resembling those found in subglacial tills (Dreimanis and Vagners, Reference Dreimanis, Vagners and Legget1971; Haldorsen, Reference Haldorsen1981; Evans, Reference Evans2018). The prominent spike at around the 4 Φ [0.063 mm] particle size is another characteristic that has been observed in sediments that have been subglacially transported (e.g. Dreimanis and Vagners, Reference Dreimanis, Vagners and Legget1971; Evans, Reference Evans2018). However, the sample with the largest spike on Austre Brøggerbreen (ABB-SED1) was collected from the furthest up-glacier, despite having been transported for the shortest distance. In this case, the presence of calcium carbonate may suggest differences in sediment source lithology, which can have an impact on grain-size distribution (Elson, Reference Elson, Penner and Butler1961; Haldorsen, Reference Haldorsen1981).
Co-isotopic analysis of glacier ice is an important tool for differentiating between ice facies with different origins (e.g. Glasser and Hambrey, Reference Glasser and Hambrey2002; Hubbard and others, Reference Hubbard, Glasser, Hambrey and Etienne2004), especially with regard to basal ice facies (Hubbard and Sharp, Reference Hubbard and Sharp1995; Knight, Reference Knight1997). Enrichment in heavy isotopes of fine-grained ice and sediment-rich ice facies (Fig. 7) is consistent with the ice having experienced some degree of melting, accompanied by incomplete refreezing since ice undergoes insignificant fractionation during melting and heavy isotope enrichment during the early stages of refreezing (Jouzel and Souchez, Reference Jouzel and Souchez1982). Light isotopes preferentially accumulate in the remaining reservoir of unfrozen water, and any liquid lost from the system is correspondingly isotopically light. The newly formed refrozen ice is, therefore, isotopically heavier than the bulk composition of the liquid forming the initial freezing reservoir.
In the case of the sediment-rich ice facies, the presence of dispersed clots of fine debris (Fig. 6d), the absence of gas bubbles and the loss of some liquid water during melting and refreezing (Fig. 7) indicate that this ice is ‘dispersed facies basal ice’ (Hubbard and others, Reference Hubbard, Cook and Coulson2009). The main distinguishing feature of this facies is the included debris, with dispersed facies basal ice typically containing 1–10 g L−1 of uniformly silt-sized debris, whereas ‘dispersed stratified facies basal ice’ typically contains 10–50 g L−1 of a broader range of debris textures that may be crudely layered (e.g. Lawson, Reference Lawson1979). At very low concentrations of included debris, dispersed facies may also be the equivalent of clear facies basal ice (Hubbard and Sharp, Reference Hubbard and Sharp1995).
The enrichment of heavy isotopes in fine-grained ice facies (Fig. 7) is probably the result of some liquid water loss associated with the melt of individual crystal edges. This process is consistent with the modification of the ice crystals in this facies.
6.6. Interpretations of ice-surface facies
The ice facies observed in this study can be separated into two main categories: (i) primary facies derived from the accumulation and modification of the snowpack and its subsequent diagenesis into glacier ice; and (ii) secondary facies that are either the product of intense ice deformation coupled with recrystallisation, the regelation of meltwater derived from primary ice facies or a combination of these.
Primary ice facies, comprising coarse bubbly and coarse clear ice, are the most abundant facies in all of the glaciers investigated (Table 1). Coarse-grained bubble-rich subfacies is interpreted to be winter snow accumulation that has undergone partial melt and refreezing during firnification, whereas coarse-grained bubble-poor subfacies is interpreted to be superimposed ice. The whitish appearance of this type of superimposed ice, in contrast to other types of superimposed ice (usually pale blue in colour), indicates that this subfacies probably developed during the early ablation period when melt and refreezing occurred over short time periods. Coarse clear ice is interpreted to be the product of slush and meltwater refreezing at the base of the snowpack prior to diagenesis. Melt at the snow surface percolates through the snowpack until it reaches an impermeable ice surface, filling any pore spaces and forcing out trapped air that would otherwise form bubbles.
Fine-grained ice facies observed in longitudinal foliation is not present in primary stratification. Furthermore, the facies is enriched with heavy isotopes (Fig. 7), and its surface distribution is almost exclusively found in the vicinity of flow-unit boundaries. Fine-grained ice is, therefore, inferred to be a secondary ice facies that develops as a result of grain-size reduction during ductile deformation and dynamic recrystallisation of pre-existing ice layers, analogous to the formation of mylonites in rocks through mylonitisation. This occurs in response to localised high stress and reflects greater cumulative strain that is inferred at flow-unit boundaries. Fine-grained ice layers are a near-vertical penetrative component of foliation, which is manifested as narrow zones of simple shear at the glacier surface. The enrichment of fine-grained ice facies with heavy isotopes (Fig. 7) lends support to this inference, as liquid water may be lost during dynamic recrystallisation as a result of strain-heating. However, the cryo-lithological logs from Austre Brøggerbreen reveal an apparent decrease in fine-grained ice abundance with distance down-glacier (Fig. S1). The potential reasons for this trend are twofold: (i) recrystallisation or annealing of the ice facies during advection into lower stress regimes; or (ii) as weathered fine-grained ice layers commonly form topographic lows and are saturated with meltwater, refreezing of the intercrystalline meltwater could lead to the amalgamation of fine-grained ice crystals with newly formed coarse clear ice.
Coarse clear ice is also evident as a secondary ice facies where surface meltwater refreezes, as in crevasse traces (water-healed crevasses). During the ablation season, it is common for open crevasses to fill with meltwater which, when refrozen, form discontinuous lenses of coarse clear ice. Columnar crystal growth develops perpendicular to the fracture edge, eventually forming a central suture defined by crystal boundaries with, or without, a plane of bubbles that represents the freezing front (Fig. 6e). Similarly, moulins, whose drainage has been cut off, fill with water that freezes into radiating crystals, producing features known as crystal quirks. A second type of crevasse trace forms narrow veins of coarse clear ice that develop under tension. These ‘tensional veins’ commonly extend into open crevasses and form by recrystallisation as the fracture walls separate (Hambrey and Müller, Reference Hambrey and Müller1978; Jennings and Hambrey, Reference Jennings and Hambrey2021). Tensional veins do not always have a central suture, and they may in some cases form coarse clear ice lenses with individual crystals spanning the full width of the fracture. This occurs when the rate of crystal growth in the fracture plane equals the rate at which the fracture walls separate.
7. Discussion
7.1. Surface characteristics of flow-unit boundaries
Flow-unit boundaries are flanked by narrow zones of steeply dipping planar structures orientated parallel to ice flow at the glacier surface (Fig. 9). In most cases, these structures comprise longitudinal foliation that is derived from the transposition of primary stratification, although less common instances of a fracture-derived longitudinal foliation have also been observed (see Section 6.1). The relative density of longitudinal foliation is often greater at flow-unit boundaries than at sub-flow-unit boundaries (Fig. 9). Differential ablation of the constituent ice facies results in a ridge-and-furrow surface topography that commonly captures supraglacial drainage (Fig. 6f) and aeolian sediment. Consequently, zones near flow-unit boundaries generally appear darker than areas further away (Jennings and others, Reference Jennings, Hambrey, Moorman, Holt and Glasser2022).
The suture between adjacent flow units develops as a planar structure or an anastomosing zone of ice facies that is near vertical with, or without, a debris septum exposed at the glacier surface. If there is a ready supply of supraglacial debris at the confluence of two flow units, angular clasts become entrained to form a debris septum. Subsequent ablation melts out the septum, forming a medial moraine that increases in width and thickness down-glacier (Mölg and others, Reference Mölg, Ferguson, Bolch and Vieli2020). Folding adjacent to the flow-unit boundary can elevate basal debris further down-glacier, which when exposed by ablation, can also form a medial moraine, albeit comprising basal debris with sub-rounded and sub-angular clasts. It is not always possible to identify the exact location of a suture that defines a flow-unit boundary, as the suture may be composed of an ice facies that is indistinguishable from the surrounding foliated ice. It is, therefore, beneficial to consider flow-unit boundaries as narrow zones of near-vertical anastomosing structures (e.g. Fig. 9).
7.2. Formation of basal ice facies
The crystallographic characteristics of dispersed facies basal ice are similar to coarse clear ice facies, yet they have unique sedimentological and isotopic attributes. Dispersed facies basal ice has been observed in basal ice sequences of many glaciers (Lawson, Reference Lawson1979; Hubbard and others, Reference Hubbard, Cook and Coulson2009) and has been interpreted to form by two main processes: (i) as a result of primary accretion occurring at the bed (e.g. Lawson, Reference Lawson1979; Sugden and others, Reference Sugden, Clapperton, Campbell Gemmell and Knight1987); or (ii) in response to ice-tectonic processes (e.g. Sharp and others, Reference Sharp, Jouzel, Hubbard and Lawson1994; Hubbard and others, Reference Hubbard, Tison, Janssens and Spiro2000). The characteristics of the dispersed facies observed in this study are consistent with a tectonic interpretation, whereby it is the end-product of strain-induced metamorphism of other ice facies (Hubbard and others, Reference Hubbard, Tison, Janssens and Spiro2000, Reference Hubbard, Cook and Coulson2009; Waller and others, Reference Waller, Hart and Knight2000). The bubble-deficient nature of the ice suggests that gas expulsion occurred during melt and refreezing at ice-crystal boundaries as a result of strain-induced heating near to the bed (Lovell and others, Reference Lovell2015). Strong foliation within the ice facies (Fig. 6a) lends support to this inference as it indicates the ice experienced pronounced simple shear. Highly pressurised sediment-laden water at the ice/bed interface is inferred to have permeated the overlying ice facies, migrating through the intercrystalline vein network and emplacing the fine-grained sediment (Fig. 6g and h). Even though exposures of dispersed facies basal ice are present at the surface of Austre Brøggerbreen, it is probable that the formation of the facies is now a spatially limited or relict processes on account of the glacier being predominantly cold-based (Hagen and Sætrang, Reference Hagen and Sætrang1991; Björnsson and others, Reference Björnsson1996). In the case of Midtre Lovénbreen and Austre Lovénbreen, their current polythermal regimes may still permit the formation of dispersed facies basal ice.
7.3. Kinematic significance of flow units and their boundaries
The surface distribution of structures within flow units illustrates the 2-D spatial variations in strain at the glacier surface. It is evident that strain patterns are not only variable perpendicular to ice-flow direction but also in the direction of flow (Fig. 8). This is most apparent at the confluence of two flow units, where non-co-axial (simple shear) regimes at the common flow-unit boundary are transformed with distance down-glacier into a co-axial (pure shear) regime (see Section 6.1) (Fig. 8). When a flow-unit boundary enters a co-axial strain regime, its constituent longitudinal foliation is attenuated and progressively transported down-glacier in a passive manner. Advection of the longitudinal foliation into a different strain regime sufficient to create a new deformation phase would imprint this information into the geometry of the foliation as a zone of folding.
In Austre Brøggerbreen, Midtre Lovénbreen and Austre Lovénbreen, longitudinal foliation at flow-unit boundaries has not undergone any significant geometric evolution following its formation (Figs. 3 and 4). The lack of deformation suggests that ice-flow configuration has remained comparatively stable spanning the residence time of the ice within the glaciers. However, the characteristics of the ice facies contained within the foliation also provides compelling evidence of changing thermal and dynamic behaviour over the same period. Strong longitudinal foliation and the exposure of dispersed facies basal ice at flow-unit boundaries reflect the more dynamic and polythermal history of the glaciers prior to their declining activity and ongoing transition to cold-based ice masses. The best examples illustrating this can be found at the surface of Austre Brøggerbreen. Exposures of dispersed facies basal ice at flow-unit boundaries indicate the glacier formerly had areas of its bed at the pressure melting point that overlaid a saturated and deformable substrate (see Section 6.5). This evidence correlates well with the abundance of crevasse traces at the surface of this glacier (Fig. 3), which also indicates that it must have been much more dynamic in the past in order to initiate glacier-wide fracturing.
In contrast to the other glaciers investigated, the deformed flow-unit boundary in Pedersenbreen indicates that its ice-flow configuration has changed. The lobate surface geometry of the boundary with its main tributary reveals a dynamic instability, yet the lack of lateral narrowing of the flow unit up-glacier of the lobe implies that its ice flux has been maintained since it advanced (see Section 6.4). Surge-type glaciers in Svalbard are well documented (e.g. Jiskoot and others, Reference Jiskoot, Murray and Boyle2000; Murray and others, Reference Murray, Strozzi, Luckman, Jiskoot and Christakos2003; Sevestre and Benn, Reference Sevestre and Benn2015), and previous structural investigations of Pedersenbreen have suggested the glacier may be surge-type but in its quiescent phase (Bennett and others, Reference Bennett, Huddart, Hambrey and Ghienne1996; Glasser and others, Reference Glasser, Coulson, Hodkinson and Webb2004). However, the structural observations in this study raise questions about the exact nature of the flow instability and the longevity of diagnostic features used to identify historic surge-type activity.
Although Pedersenbreen has a prominent moraine complex in its forefield, Bennett and others (Reference Bennett, Huddart, Hambrey and Ghienne1996) found nothing to distinguish it from those in front of adjacent non-surge-type glaciers. Extensive fracture sets at the surface of the glacier were, nevertheless, interpreted to be evidence that the glacier was once heavily crevassed, as would be expected during a surge (Bennett and others, Reference Bennett, Huddart, Hambrey and Ghienne1996). However, after an elapse of approximately 17 years, no extensive fracture sets remained at the surface of Pedersenbreen in this study. From investigations undertaken soon after the ‘slow surge’ of Trapridge Glacier, Yukon (Hambrey and Clarke, Reference Hambrey and Clarke2019), it is evident that crevasses may not survive ablation more than several years. As the return period of cyclic unstable ice-flow can significantly exceed the longevity of surface crevassing and crevasse traces, they cannot be regarded as reliable diagnostic features for determining surge-type behaviour.
In contrast to surge-related brittle structures, deeply penetrating ductile structures at flow-unit boundaries have a greater preservation potential. Although primarily associated with deformation during quiescent phases, a record of cumulative strain is imprinted into the geometry of the structures and dynamic information is preserved in their constituent ice facies. The analysis of flow-unit boundaries and their structural characteristics is, therefore, one of the few ways to identify prior surge-type behaviour over longer timescales, which can also be used to decipher complex ice-flow dynamics (Lovell and Fleming, Reference Lovell and Fleming2022). In Pedersenbreen, the geometry of the deformed flow-unit boundary reveals an ice-flow instability that differs somewhat from an ephemeral pulse of increased ice flux. This is in agreement with other investigations that indicate a spectrum of unstable ice-flow behaviour and suggest qualitative classifications of ‘surge-type’ and ‘non-surge-type’ are overly simplistic (e.g. Herreid and Truffer, Reference Herreid and Truffer2016). The dynamic information that structural analyses can reveal offers a promising avenue for assessing a broader spectrum of ice-flow behaviour (e.g. Benn and others, Reference Benn, Hewitt and Luckman2023), especially if combined with newly emerging numerical modelling approaches (Clarke and Hambrey, Reference Clarke and Hambrey2019; Young and others, Reference Young, Flowers, Jiskoot and Gibson2022, Reference Young, Flowers, Jiskoot and Gibson2024).
7.4. Comparison with flow-unit confluences in other valley glaciers
In the absence of field measurements of strain on the four Svalbard glaciers, it is instructive to evaluate investigations of strain rates along flow-unit boundaries in other valley glaciers. The measurement of strain rates in relation to ductile structures was pioneered on Blue Glacier, Washington State (Allen and others, Reference Allen, Kamb, Meier and Sharp1960) and Saskatchewan Glacier (Meier, Reference Meier1960) but the relationship between foliation and stain rates was inconsistent. The complexities were illustrated by investigations of White Glacier in the Canadian Arctic (Hambrey and Müller, Reference Hambrey and Müller1978) and Griesgletscher, Switzerland (Hambrey and others, Reference Hambrey, Milnes and Siegenthaler1980), where surface strain rates were measured across flow-unit boundaries. Expected simple shear, indicated by a 45° orientation of principal strain-rates relative to the flow-unit boundary, was evident at the confluence in both cases. In White Glacier, this strain regime died out within several tens of metres down-glacier. Field-based and numerical modelling investigations of Unteraargletscher, Switzerland (Gudmundsson and others, Reference Gudmundsson, Iken and Funk1997; Gudmundsson, Reference Gudmundsson1999), also indicated that simple shear along the flow-unit boundary did not persist for more than a few tens of metres down-glacier of a confluence (Fig. 8). Conversely, in Griesgletscher, simple shear continued for over a kilometre down-glacier.
It is more beneficial to take a structural geological approach and relate the development of longitudinal foliation to cumulative strain, depicted as strain ellipses, which takes full account of the strain history of a parcel of ice (Hambrey and Milnes, Reference Hambrey and Milnes1977; Hooke and Hudleston, Reference Hooke and Hudleston1978). Following longitudinal foliation in Griesgletscher, strain ellipses progressively rotated from 45° into parallelism with foliation, typical of a simple shear regime. A similar result for longitudinal foliation at Midtre Lovénbreen was obtained using a numerical modelling approach (Hambrey and others, Reference Hambrey2005). Modelled strain ellipses also showed that areas of high cumulative strain coincided with the zones of greater longitudinal foliation density mapped in this study (Fig. 9). This approach demonstrates that strong longitudinal foliation is concentrated in narrow zones that flank a flow-unit boundary, highlighting the spatial variability of cumulative strain and its concentration in the immediate vicinity of flow-unit boundaries.
7.5. Comparison with longitudinal surface structures in ice sheets
The findings of this study and other field-based investigations of valley glaciers represent the small-scale end of a spectrum of geometrically similar structures. At the other extreme, longitudinal surface structures (commonly referred to as flowlines or flow stripes) have been widely mapped at the surface of converging ice streams in the Antarctic Ice Sheet and its peripheral ice shelves (Fahnestock and others, Reference Fahnestock, Scambos, Bindschadler and Kvaran2000; Glasser and others, Reference Glasser, Jennings, Hambrey and Hubbard2015; Ely and Clark, Reference Ely and Clark2016). Various modes of formation of flowlines have been proposed, but scaling up structural observations from valley glaciers does prove insight. Linking both ends of the size spectrum, an investigation of large valley glaciers on Bylot Island, Nunavut, Canada, highlighted the similarity of flow regimes at the different scales (Jennings and others, Reference Jennings, Hambrey, Moorman, Holt and Glasser2022). Whereas investigations of small valley glaciers are grounded in field-based measurements that allow the 3-D geometry of structures to be directly ascertained, the scale and predominantly snow-covered surface of the Antarctic Ice Sheet precludes this approach for vast swathes of the ice mass. Consequently, the majority of studies have utilised optical and synthetic aperture radar satellite imagery to map and analyse surface features in 2-D (e.g. Glasser and others, Reference Glasser, Jennings, Hambrey and Hubbard2015; Ely and Clark, Reference Ely and Clark2016). Where bare ice surfaces do exist (e.g. Amery Ice Shelf), the similarity with foliation in valley glaciers, such as those described here from Svalbard, is striking (Hambrey and Dowdeswell, Reference Hambrey and Dowdeswell1994; Jennings and Hambrey, Reference Jennings and Hambrey2021). Common strain regimes and structural development, whatever the scale, can thus be inferred. These concepts have been fully explored in Jennings and others (Reference Jennings, Hambrey, Moorman, Holt and Glasser2022).
8. Conclusions
The glaciers investigated in this study are typical of many small valley glaciers in the High-Arctic, and they exhibit a wide array of surface ice structures. Glacier-wide and field-based mapping of glacier surfaces have illustrated that longitudinal foliation is primarily concentrated in narrow zones flanking flow-unit boundaries, with the relative density of longitudinal foliation providing a visual representation of the magnitude of cumulative strain. It has been demonstrated that the analysis of flow-unit boundaries can be a valuable tool for assessing past glaciological characteristics over periods of time that exceed that of direct observations. The 3-D geometry of longitudinal foliation, along with the isotopic and sedimentological properties of its constituent ice facies, provides a record of prior dynamic behaviour and basal conditions. High cumulative strains at flow-unit boundaries can lead to the exposure of basally derived ice facies in response to strong folding. These surface exposures of ice enable past basal conditions to be investigated, which can complement direct observations of the glacier bed via borehole/coring techniques, speleological investigations or the investigation of vertical sections exposed in ice cliffs. Dispersed facies basal ice at the surface of the glaciers in this study reveal that areas of their beds were at the pressure melting point in the past, even though this is not always the case at present as glaciers thin and become cold-based. Strong foliation within the ice facies suggests that the ice experienced enhanced cumulative shear strain, most likely in response to higher ice-flow velocities. In Austre Brøggerbreen, this correlates closely with the ubiquitous distribution of crevasse traces. The relative inactivity of the glacier at present indicates that many crevasse traces are probably relict features that are no longer actively forming. Rather, the magnitude of ice-flow velocity gradients must have been sufficient in the past to initiate glacier-wide fracturing.
The geometry of flow-unit boundaries also provides information about ice-flow configuration spanning the residence time of the ice. The lack of a second phase of deformation in three of the glaciers indicates their configurations have remained comparatively stable during this period. In contrast, in Pedersenbreen, the deformation of a flow-unit boundary, and by extension its constituent foliation and medial moraine, indicates a switch in ice-flow configuration, probably as a result of a sustained pulse of ice from a tributary. As it has been shown that ductile structures concentrated at flow-unit boundaries can record dynamic information over significant time scales, their analysis can be a valuable tool for assessing a broader spectrum of dynamic traits.
Supplementary material
The supplementary material for this article can be found at https://doi.org/10.1017/jog.2024.103.
Acknowledgements
SJAJ acknowledges funding from the U.K. Natural Environment Research Council (Reference no. J65727D) and additional support from the Institute of Biochemistry and Biophysics, Polish Academy of Sciences. SJAJ and MJH acknowledge logistical support from Nick Cox, James Wake and the U.K. Arctic Research Station, Ny-Ålesund, Svalbard. Wynne Ebenezer and Andrew Brown are thanked for their laboratory expertise, Ian Boomer for undertaking isotopic analyses and David J. A. Evans and Toby N. Tonkin for their constructive comments. Geospatial support was provided by the Polar Geospatial Center under NSF-OPP awards 1043681 and 1559691, and DEMs were provided under NSF-OPP awards 1043681, 1559691 and 1542736. The authors thank Hester Jiskoot for editing and two anonymous reviewers for their valuable insights.
Competing interests
There are no competing interests.


 Open access

