


1. Introduction
An increasing number of studies have analyzed socioeconomic disparities by sexual orientation and gender identity (Badgett et al., Reference Badgett, Carpenter, Lee and Sansone2024). Most of these papers have focused on health and labor market disparities in the US and other high-income countries (Badgett et al., Reference Badgett, Carpenter and Sansone2021). These analyses are timely and policy-relevant, as a large and growing share of individuals worldwide identify as LGBTQ+ (Dunne, Reference Dunne2025; Jones, Reference Jones2025), and multiple pro- and anti-LGBTQ policies are being introduced in several countries, such as same-sex marriage legalization (Badgett et al., Reference Badgett, Carpenter, Lee and Sansone2025; Sansone, Reference Sansone2019), decriminalization of same-sex sexual activity (Ciacci and Sansone, Reference Ciacci and Sansone2023), and anti-trans bills (MAP, 2023).
This substantial body of research in high-income countries consistently documents specific patterns of labor market disparities by sexual orientation and gender identity. Indeed, gay men and bisexual individuals typically face wage penalties compared to their heterosexual counterparts, transgender individuals experience lower incomes than cisgender individuals, while lesbian women often show positive wage differentials relative to heterosexual women (Badgett et al., Reference Badgett, Carpenter, Lee and Sansone2024; NASEM, 2020, 2022). Beyond wages, distinct employment patterns emerge across LGBTQ+ subgroups. Lesbian and bisexual women demonstrate higher labor force participation rates than heterosexual women, potentially reflecting different patterns of household specialization, while gay men show somewhat lower employment probabilities. Employment disparities are most pronounced for transgender individuals, who face large negative employment gaps and higher unemployment rates, with outcomes varying by transition status and gender expression. These employment disparities are at least partly explained by discrimination: evidence from correspondence experiments reveals that sexual and gender minority job applicants are substantially less likely to receive interview callbacks compared to their heterosexual and cisgender counterparts (Badgett et al., Reference Badgett, Carpenter, Lee and Sansone2024).
Due to data limitations, disparities faced by LGBTQ+ individuals have remained largely ignored outside rich countries, raising questions about whether these well-documented patterns hold across different economic and cultural contexts. This data gap has profound policy implications, as it allows myths and misconceptions about LGBTQ+ people to persist (Badgett, Reference Badgett2001). Worse still, politicians can exploit this lack of data to justify passing discriminatory laws, as LGBTQ+ individuals are made scapegoats in political discourse. These negative attitudes and policies prevent LGBTQ+ individuals from reaching their full potential and result in economic losses for individuals, businesses, and society at large (Badgett, Reference Badgett2020). To address the invisibility of LGBTQ+ communities, in recent years, some low- and middle-income countries have started to collect data on sexual orientation and gender identity, especially in Latin America (Muñoz et al., Reference Muñoz, Saavedra and Sansone2025; Muñoz et al., Reference Muñoz, Sansone and Ysique2024; Muñoz and Sansone, Reference Muñoz and Sansone2024; Tampellini, Reference Tampellini2024).
These pioneering studies from low- and middle-income countries suggest that these disparities may be partly context-specific, though some patterns remain consistent across settings. For instance, studies in Brazil found large wage premiums for lesbian women relative to heterosexual women but no wage premiums or penalties for gay men and bisexual individuals relative to their heterosexual counterparts, with lesbian women also more likely to be employed and work full-time (Tampellini, Reference Tampellini2024). Similarly, research in Chile and Uruguay documented that partnered gay men are less likely to participate in the workforce compared to heterosexual men, while lesbians are significantly more likely to participate in the labor force than heterosexual women, with differences in magnitude between countries suggesting that cultural and legal contexts do matter (Brown et al., Reference Brown, Contreras and Schmidt2019).
In this study, we aim to contribute to this literature by providing novel key demographic and labor market statistics on LGBTQ+ individuals in Mexico. Our analysis reveals pronounced levels of self-reported discrimination and rejection among LGBTQ+ individuals throughout their lives, alongside different raw rates of labor force participation and unemployment from their heterosexual and cisgender counterparts. Furthermore, we examine heterogeneity across LGBTQ+ subgroups, as well as analyzing differences by sex assigned at birth.
To contextualize these findings, it is important to understand Mexico’s legal and social landscape regarding LGBTQ+ rights. Among Latin American countries pushing for better data collection, Mexico represents a particularly compelling case study as the nation exhibits a complex interplay between progressive legal reforms and persistent sociocultural challenges. The country has indeed recently made significant strides in advancing LGBTQ+ rights. For instance, same-sex marriage has achieved legal recognition across the entire country, beginning with Mexico City in 2009 (the first jurisdiction to do so in Latin America), with Tamaulipas being the latest state to legalize it in 2022 (Reuters, 2022). Mexico has developed a robust anti-discrimination legal framework that includes Article 1 of the Constitution, which was reformed in 2011 to explicitly prohibit discrimination based on sexual orientation and gender. This constitutional protection is reinforced by several laws, such as the Federal Law to Prevent and Eliminate Discrimination, reformed in March 2014, which defines discrimination as any situation that hinders the exercise of human rights based on sexual orientation (Art. 1) and considers as discrimination any promotion of violence motivated by publicly assumed sexual orientation (Art. 9); the Federal Labor Law, which through 2012 reforms to Articles 2 and 3 prohibits workplace discrimination based on sexual orientation and establishes equal working conditions for all (Art. 56); and the Federal Penal Code, which since 2012 has criminalized discrimination motivated by sexual orientation (Art. 149 ter). The National Council to Prevent Discrimination (CONAPRED) oversees the implementation of these protections, though enforcement remains uneven across the country. Regarding gender identity recognition, as of September 2024, 21 of Mexico’s 32 states have enacted laws recognizing self-determined gender identity.
Despite these legal advances, it is particularly important to focus on emerging economies since sexual and gender minority individuals still face numerous barriers in these countries: for instance, countries such as Mexico or Brazil have some of the world’s largest numbers of gender minority individuals murdered every year (TMM, 2023). According to data from the international organization Transrespect, which maintains an updated map of violence against transgender people worldwide, Mexico recorded 772 murders of transgender individuals between 2008 and September 2024, making it the second country globally in terms of anti-trans violence, only behind Brazil with 1,947 murders (TMM, 2024). This combination of progressive legal reforms and ongoing violence against LGBTQ+ individuals underscores the complex social landscape in which the disparities occur and highlights the importance of examining the socioeconomic conditions for LGBTQ+ populations in Mexico.
2. Materials and methods
2.1. Terminology
LGBTQ+ refers to individuals who identify as lesbian, gay, bisexual, transgender, queer, or other sexual and gender minorities. Individuals with same-sex attraction and/or same-sex sexual activity – as well as those who identify with certain categories such as lesbian women, gay men, bisexual and queer individuals – are generally referred to as sexual minorities. Gender minority individuals (trans+, as defined by the national statistics office in Mexico) include transgender and non-binary individuals whose current gender does not match their sex assigned at birth. Cisgender individuals are people whose current gender aligns with their sex at birth.
2.2. National survey on sexual and gender diversity (ENDISEG)
We use anonymized publicly available data from ENDISEG (INEGI, 2022a), the first nationally representative survey conducted by a National Statistics Office in a developing country focused on LGBTQ+ populations. The survey’s primary objective was to identify, from the population aged 15 years and over, those with non-normative or nonconventional sexual orientation and/or gender identity. The survey was carried out across Mexico between August 2021 and January 2022.
The ENDISEG survey follows the sampling framework developed by the National Institute of Statistics and Geography (INEGI), which is a stratified, three-stage, and cluster-based framework. First, geographical clusters such as blocks and localities, i.e., primary sampling units (PSUs), were selected. Next, households within these PSUs were randomly sampled. Finally, one respondent was randomly selected from each household roster to answer the entire questionnaire.
Interviews were conducted face-to-face using a hybrid CAPI-ACASI methodology (Computer Assisted Personal Interview-Audio Computer Assisted Self Interview). While general demographic questions were administered through direct interviewer interaction, sensitive questions, including those on sexual orientation and gender identity, were collected through an audio self-interview using electronic devices rather than asked directly by enumerators. Questions were answered directly by the selected respondent rather than by proxy respondents. This approach is designed to enhance respondents’ privacy and reduce social desirability bias when disclosing sensitive information (Park et al., Reference Park, Aggarwal, Jeong, Kumar, Robinson and Spearot2024; Peterman et al., Reference Peterman, Dione, Le Port, Briaux, Lamesse and Hidrobo2024), though it places complete responsibility for question interpretation on respondents, who may hesitate to seek clarification to avoid feeling exposed (INEGI, 2022b).
To ensure representativeness, survey weights were constructed through a multistep process. Expansion factors were calculated based on the probability of selection at each stage and were then adjusted to account for nonresponse at the household and individual levels. A final calibration aligned the weighted totals with mid-survey population projections to accurately reflect demographic distributions. These adjustments ensure reliable population estimates while accounting for potential biases. Additional technical details are provided in the Online Appendix.
The final sample includes 44,189 people aged 15 and over, representing 97.2 million people. For our main analysis, we focus specifically on the working-age subsample of 37,742 respondents aged 15–64, representing 85.5 million people (Table 1). Descriptive statistics for this working-age sample are presented in Table A1. This sample restriction allows us to better examine labor market outcomes and economic disparities. All relevant variables are described in the Online Appendix.
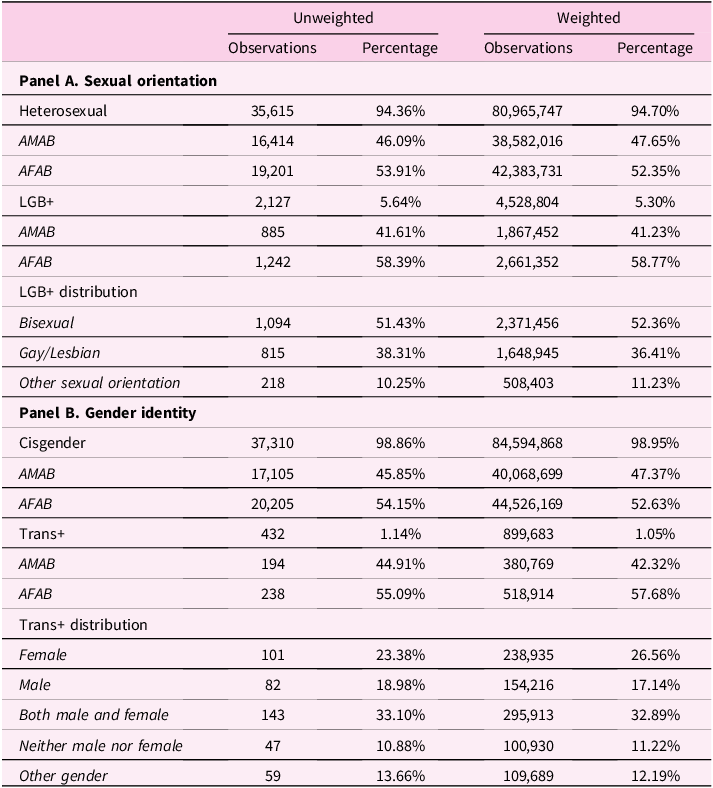
Sample size, individuals aged 15–64

Note: AFAB denotes individuals assigned female at birth and AMAB denotes individuals assigned male at birth. The categories for sexual orientation consider individuals of all gender identities, and the categories for gender identity encompass individuals of all sexual orientations. Sample sizes for the samples including individuals aged 65 or more are presented in Table A2.
Questions on sexual orientation and attraction were designed to allow respondents to describe their romantic and sexual attraction. The survey began by explaining “sexual orientation” as the capacity to feel attracted, romantically or sexually, to women, men, individuals of both sexes, or others, or not to feel attracted. After assuring confidentiality, respondents were asked:
According to the above, do you consider yourself…
-
(1) a woman who is only attracted to women?
-
(2) a man who is only attracted to men?
-
(3) a person who is attracted to both men and women?
-
(4) a woman who is only attracted to men?
-
(5) a man who is only attracted to women?
-
(6) with another orientation?
Respondents who consider themselves attracted to individuals of a different gender than their own, as indicated by options 4 and 5, are coded as heterosexual. Respondents who consider themselves attracted to individuals of the same gender, or of more than one gender, as indicated by options 1–3 and 6, are coded as sexual minority individuals. Subsequently, respondents who selected options 1–3 and 6 were asked to specify:
Do you consider your orientation to be:
-
(1) Lesbian
-
(2) Gay or homosexual
-
(3) Bisexual
-
(4) Other, for example: pansexual, asexual
These classifications were self-selected by respondents themselves during the interview. Using this self-reported information, we further divided sexual minority respondents into three categories: Bisexual, Gay or Lesbian, and Other sexual minorities.
It is important to note that ENDISEG’s approach differs from surveys in other contexts by first asking about attraction rather than sexual identity directly. This methodological choice was informed by consultation of various international sources, which identified three main dimensions of sexual orientation: sexual identity, sexual behavior, and sexual attraction. Building on these international frameworks but adapting them to the Mexican cultural context, INEGI chose to prioritize the attraction dimension as the primary screening question, recognizing that culture significantly influences the declaration of sexual orientation and that some groups are more familiar with certain terms than others.
From a theoretical perspective, this distinction between attraction and identity is meaningful for understanding discrimination. Taste-based and statistical discrimination models (Becker, Reference Becker2010; Phelps, Reference Phelps1972) suggest that labor market penalties may arise from perceived sexual orientation (observable through behavior, appearance, or social cues) rather than requiring explicit identity disclosure (Tilcsik, Reference Tilcsik2011). Thus, measuring both attraction-based and self-identified sexual orientation may better capture the population at risk of discrimination, particularly in contexts where openly identifying as LGBTQ+ carries social costs.
INEGI designed this approach to ensure that respondents could hear all non-normative orientation options before self-selecting the identity category that best represented them, while protecting privacy and facilitating accurate declaration (INEGI, 2022b).
Additionally, gender identity questions allowed respondents to self-identify their gender based on personal feelings and societal experiences. The survey defined “gender identity” as the way each person perceives themselves as male, female, or another gender, which may or may not correspond to their assigned sex at birth. Respondents were then asked:
You consider yourself:
-
(1) male
-
(2) female
-
(3) both male and female
-
(4) neither male nor female
-
(5) another gender
To determine gender minority status, responses to this gender identity question were compared with sex assigned at birth, collected through a separate demographic question that asked:
What is your sex assigned at birth?
-
(1) Man
-
(2) Woman
Respondents whose gender identity aligned with their sex assigned at birth are classified as cisgender, while those with a gender identity different from their assigned sex are classified as trans+. Following INEGI’s terminology, we use the abbreviation “trans+” to refer to gender minority individuals throughout the paper. This category encompasses individuals whose internal experience of gender does not conform to societal norms based on the sex assigned at birth, reflecting how they navigate and express their identity in both private and public contexts.
Similarly to the sexual attraction and identity questions, the gender identity questions were developed drawing from international statistical frameworks, particularly considering the statistical standard created by Statistics New Zealand (2014), which addressed the need for standardized definitions and measures of gender identity. However, INEGI adapted these international references to develop their own approach, incorporating consultations with experts and users to include non-binary response options (“both male and female” and “neither male nor female”) that would better capture gender diversity in the Mexican context. This culturally-adapted framework recognizes that gender identity is subjective, self-defined, and may change throughout a person’s life (INEGI, 2022b).
2.3. Sample size by sex at birth, sexual orientation, and gender identity
Table 1 shows that heterosexual individuals represent approximately 95 percent of the population in our sample, while sexual minorities account for just over 5 percent. Both groups present a higher representation of individuals assigned female at birth than individuals assigned male at birth. In terms of the distribution within sexual minorities, bisexual individuals represent the largest share (Panel A). This aligns with compositional breakdowns observed in other countries, such as the United States (Jones, Reference Jones2025).
Regarding gender identity, approximately 1 percent of respondents identified themselves as gender minorities (trans+). There is a greater presence of individuals assigned female at birth than assigned male at birth for both the cisgender and trans+ groups. Among trans+ individuals, the largest share of respondents selected the option both male and female as their gender (Panel B).
Overall, almost 6 percent of respondents identified as LGBTQ+. This estimate is similar to, though somewhat lower than, the 9 percent reported in previous studies (Dunne, Reference Dunne2025). This difference is unsurprising, as the IPSOS sample includes a higher proportion of urban, educated, and affluent respondents and is therefore not nationally representative.
The complete sample characteristics, including respondents aged 65 and over, are presented in Appendix Table A2 for reference and comparison.
3. Results
3.1. Descriptive statistics
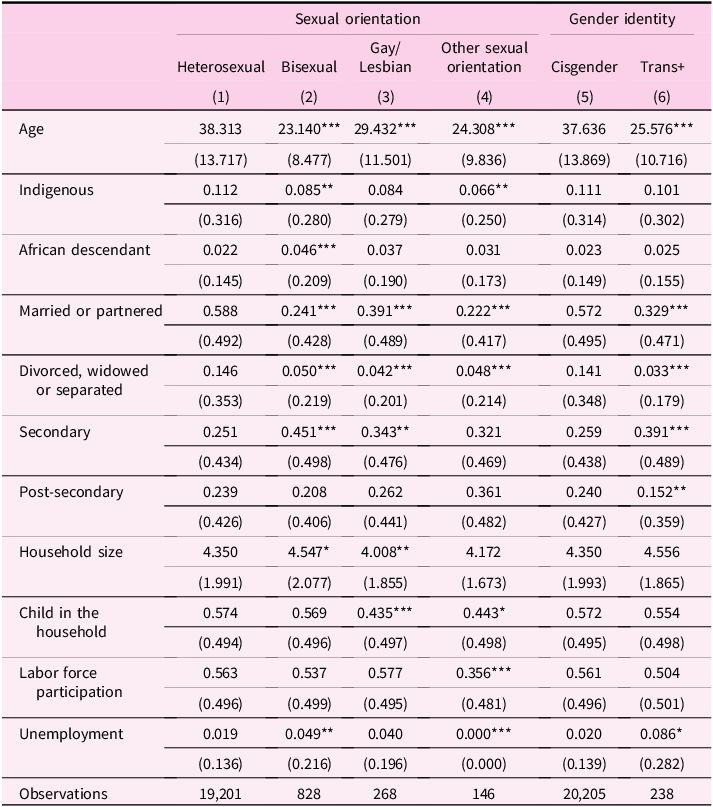
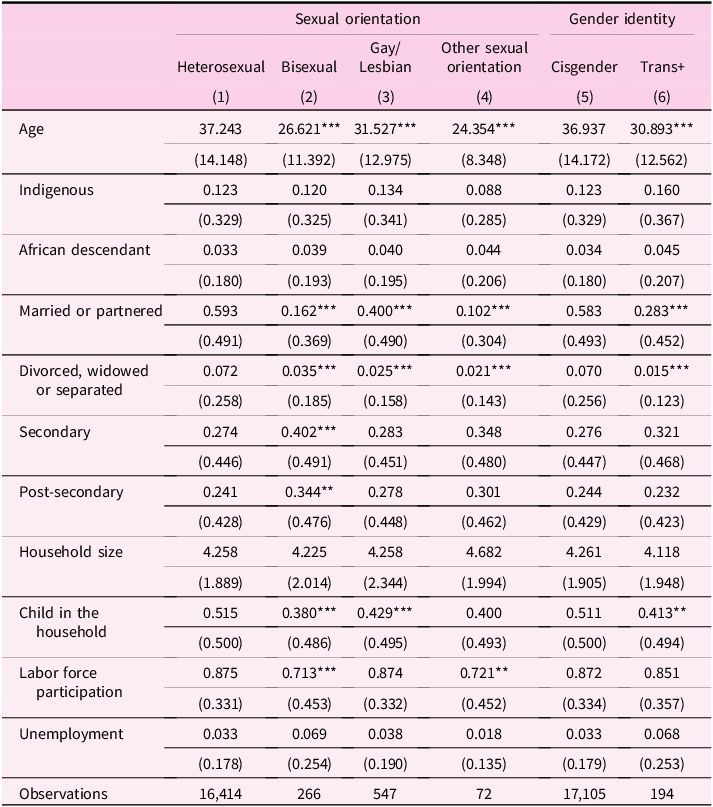
Various socioeconomic statistics by sex, sexual orientation, and gender identity are reported in Tables 2 and 3 and confirm several key patterns reported in the literature (Badgett et al., Reference Badgett, Carpenter and Sansone2021). Notably, heterosexual and cisgender individuals tend to be older on average: the age distributions for sexual and gender minority individuals are concentrated below age 30, while those for cisgender and heterosexual individuals are close to uniform across different age groups (Figure A1). There is a lower percentage of Indigenous people among sexual minorities assigned female at birth, whereas the share of gay and bisexual Indigenous individuals assigned male at birth is similar to that for heterosexual counterparts. Conversely, percentages for African descendants are higher among sexual minorities, both assigned female at birth and assigned male at birth, although the differences are not always significant. Additionally, sexual minority individuals report lower rates of marriage (as well as lower separation rates). Regarding the probability of having a child in the household, respondents assigned female at birth show higher averages than individuals assigned male at birth across all categories. Lesbian individuals assigned female at birth and bisexual or gay individuals assigned male at birth notably report significantly lower probabilities. Additionally, cisgender individuals are on average more likely to have children than trans+ individuals.
Descriptive statistics for individuals assigned female at birth

Note: ***p<0.01, **p<0.05, *p<0.1 denote statistically significant differences between Columns 2–4 and Column 1; and between Columns 6 and 5. Weighted means for individuals aged 15–64 years assigned female as sex at birth by sexual orientation and gender identity, using ENDISEG sample weights and sampling design. Standard deviation reported in parenthesis. The categories for sexual orientation consider individuals of all gender identities, and the categories for gender identity encompass individuals of all sexual orientations. See Table A17 for descriptive statistics for individuals in the labor force.
Descriptive statistics for individuals assigned male at birth

Note: ***p<0.01, **p<0.05, *p<0.1 denote statistically significant differences between Columns 2–4 and Column 1; and between Columns 6 and 5. Weighted means for individuals aged 15–64 years assigned male as sex at birth by sexual orientation and gender identity, using ENDISEG sample weights and sampling design. Standard deviation reported in parenthesis. The categories for sexual orientation consider individuals of all gender identities, and the categories for gender identity encompass individuals of all sexual orientations. See Table A18 for descriptive statistics for individuals in the labor force.
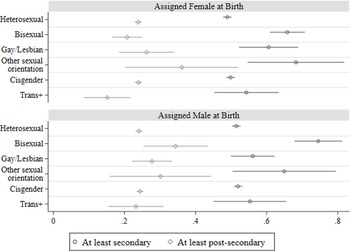
Focusing on human capital accumulation, both sexual and gender minorities are more likely to have at least a secondary education than heterosexual and cisgender individuals (Figure 1). Bisexual individuals – both assigned female at birth and assigned male at birth – are particularly likely to have at least secondary education (over 65 percent). Age fixed effects attenuate these effects: significant educational advantages in secondary education persist, particularly among individuals assigned female at birth, while for LGBTQ+ individuals assigned male at birth the difference becomes insignificant once age fixed effects are included (Table A3).
Education by sex, sexual orientation, and gender identity. Note: All estimates are derived from OLS models for individuals aged 15–64 years, estimated separately for sexual orientation and gender identity, with one model per outcome. No controls, no constant, with robust standard errors, and using ENDISEG sample weights and sampling design. 95% confidence intervals included. The categories for sexual orientation consider individuals of all gender identities, and the categories for gender identity encompass individuals of all sexual orientations.

When analyzing post-secondary education levels, differences emerge by sex: bisexual individuals assigned male at birth have among the highest probabilities of achieving at least a post-secondary education (34 percent), while bisexual individuals assigned female at birth have among the lowest likelihoods (21 percent). These post-secondary patterns are significant primarily for individuals assigned male at birth, even after controlling for age fixed effects (Table A4). Similarly, trans+ assigned male at birth respondents have post-secondary education levels comparable to cisgender individuals, while trans+ individuals assigned female at birth are substantially less likely to obtain a post-secondary education.
3.2. Self-reported experience of discrimination throughout the life cycle
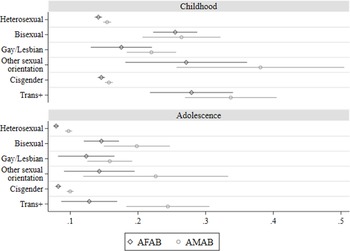
Beyond these demographic and educational differences, LGBTQ+ individuals in Mexico also report substantially higher rates of discrimination throughout their lives. Figure 2 shows the percentage of respondents who experienced rejection during childhood and adolescence, categorized by sexual orientation, gender identity, and sex assigned at birth. When analyzing by sexual orientation, we observe that heterosexual individuals report the lowest rates of rejection in both childhood and adolescence. In contrast, those with other sexual orientations report the highest rates of perceived rejection and social isolation, particularly among individuals assigned male at birth (38 percent in childhood and 22 percent in adolescence), followed by bisexual, gay, and lesbian individuals.
Rejection experiences in childhood and adolescence by sexual orientation, gender identity, and sex assigned at birth. Note: All estimates are derived from OLS models for individuals aged 15–64 years, estimated separately for sexual orientation and gender identity, with one model per outcome. No controls, no constant, with robust standard errors, and using ENDISEG sample weights and sampling design. 95% confidence intervals included. The categories for sexual orientation consider individuals of all gender identities, and the categories for gender identity encompass individuals of all sexual orientations. AFAB denotes individuals assigned female at birth and AMAB denotes individuals assigned male at birth. ENDISEG asks about five types of rejection experiences during childhood and adolescence, such as exclusion from social activities, insults, theft, threats, and violence, using the questions: “During your childhood (up to 11 years old), to upset you or make you feel bad, were you…?” and “From 12 to 17 years old, to upset you or make you feel bad, were you…?” In each case, our variable represents the average response to these questions, ranging from 0 to 1. A value closer to 0 indicates a lower perception of rejection, while a value closer to 1 indicates a higher perception of rejection. For more details, see Appendix.

When examining results by gender identity, trans+ individuals report higher rates of rejection in both childhood and adolescence compared to cisgender individuals. This trend is particularly notable in childhood, where rejection experiences for trans+ individuals assigned male at birth are more than double those of cisgender individuals assigned male at birth (34 percent versus 16 percent, respectively). Moreover, trans+ individuals assigned male at birth report more experiences of rejection than individuals assigned female at birth, especially during adolescence (24 percent and 10 percent, respectively).
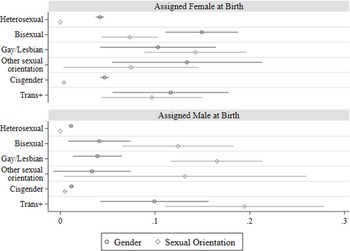
In adulthood, gender and sexual orientation-based discrimination rates further reflect these disparities. Figure 3 shows the percentage of respondents who had experienced discrimination (in any context, not only the labor market) in the previous year based on gender or sexual orientation. Regarding gender-based discrimination, individuals assigned female at birth, particularly bisexual individuals, are the most affected, with almost 15 percent reporting discrimination, compared to 4 percent of heterosexual individuals assigned female at birth. In addition, approximately 10 percent of gender minorities – irrespective of their sex at birth – report gender-based discrimination.
Perceived discrimination due to gender or sexual orientation, by sex, sexual orientation, and gender identity. Note: All estimates are derived from OLS models for individuals aged 15–64 years, estimated separately for sexual orientation and gender identity, with one model per outcome. No controls, no constant, with robust standard errors, and using ENDISEG sample weights and sampling design. 95% confidence intervals included. The categories for sexual orientation consider individuals of all gender identities, and the categories for gender identity encompass individuals of all sexual orientations. The question used for perceived discrimination due to gender is: “In the past 12 months, from August 2020 to date, have you been discriminated against or felt undervalued for being a woman (man)?” The question used for discrimination due to sexual orientation is: “In the past 12 months, from August 2020 to date, have you experienced discrimination or felt undervalued because of your [sexual] orientation?” For more details, see Appendix.

Sexual orientation discrimination rates are considerably higher than gender-based discrimination rates (10–17 percent) for all assigned male at birth sexual minorities and for gay/lesbian individuals assigned female at birth. Relatedly, 20 percent of assigned male at birth trans+ and 10 percent of trans+ individuals assigned female at birth experienced discrimination due to their sexual orientation.
In addition, LGBTQ+ people report higher rates of workplace rejection (Figure 4). When examining the estimates by sexual orientation, it becomes evident that bisexual individuals assigned male at birth are the most affected, with over 35 percent reporting perceived workplace rejection. When analyzing by gender identity, trans+ individuals, particularly individuals assigned male at birth, experience a significantly higher prevalence of rejections than cisgender individuals (37 percent and 27 percent versus 20 percent approximately, based on unconditional means from Figure 4).
Rejection experiences at work, by sex, sexual orientation, and gender identity. Note: All estimates are derived from OLS models for individuals aged 15–64 years, estimated separately for sexual orientation and gender identity, with one model per outcome. No controls, no constant, with robust standard errors, and using ENDISEG sample weights and sampling design. 95% confidence intervals included. The categories for sexual orientation consider individuals of all gender identities, and the categories for gender identity encompass individuals of all sexual orientations. AFAB denotes individuals assigned female at birth and AMAB denotes individuals assigned male at birth. ENDISEG asks about five types of rejection experiences at work (i.e., offensive comments, exclusion from activities, harassment, unequal treatment regarding benefits or career, and physical violence). The indicator in this figure considers the existence of at least one of them. For more details, see Appendix.

Given the large age differences by sexual orientation and gender identities documented in Tables 2–3, to ensure that these discrimination patterns are not simply artifacts of age differences between groups, we conducted additional analyses controlling for age fixed effects (Tables A5–A9). While age appears to be an important factor, with effect magnitude decreasing for some estimates when age controls are included, the significance and direction of effects remain consistent across most discrimination measures. This suggests that LGBTQ+ individuals face discrimination experiences that persist beyond what can be explained by generational differences alone.
Together, these findings underscore a continuity in the effects of perceived rejection and discrimination across life stages. Early experiences of rejection in childhood and adolescence appear to be followed by greater exposure to discrimination in later stages, suggesting that these experiences are cumulative and reinforce patterns of marginalization that impact LGBTQ+ individuals in educational, social, and professional contexts.
3.3. Labor market disparities
We analyze two main labor market indicators: labor force participation and unemployment. It is worth noting that the ENDISEG dataset does not contain any information on incomes or wages.
Labor force participation captures whether respondents were actively engaged in the labor force. This indicator is equal to one if the respondent was actively engaged in the labor force, including scenarios where they worked (for at least an hour), had a job but did not work in the reference period, or were actively looking for work. This indicator is also equal to one for respondents who were retired or pensioned, students, engaged in household chores or caregiving, or in a situation different from the aforementioned ones but performed activities such as helping in a business (either family-owned or not), selling or producing goods for sale, assisting with farming or animal husbandry, undertaking paid tasks, serving as an apprentice, or completing social service. In all other cases, it is set to zero. The original questions are as follows:
Last week, did you…
-
work (at least one hour)
-
have a job but didn’t work?
-
look for work?
-
Are you retired or pensioned?
-
Are you a student?
-
Are you engaged in household chores or caregiving for your household members?
-
Do you have a permanent physical or mental limitation that prevents you from working?
-
Were you in a different situation than the ones above?
Although you already told me about your condition, last week did you…
-
help in a business (family or non-family)?
-
sell or make any products to sell?
-
help with farming or animal husbandry?
-
perform other activities for payment? (For example: washing clothes or ironing for others, caregiving)
-
work as an apprentice or do your social service?
-
not help or work?
Among those classified as participating in the labor force, unemployment is an indicator equal to one if the respondent was looking for a job and zero otherwise. Individuals not in the labor force have been coded as missing.
We focus on both indicators because they capture complementary aspects of labor market exclusion. Labor force participation reveals whether individuals withdraw from the labor market entirely, potentially due to discouragement or social barriers, while unemployment measures job search difficulties among those actively seeking work. This dual approach is consistent with recent research on transgender labor market outcomes (Campbell et al., Reference Campbell, Badgett, Dalton-Quartz and Campbell2024) and is crucial because LGBTQ+ individuals may exit the labor force due to discrimination-related discouragement (thus not appearing as unemployed) or may remain actively job-searching despite facing hiring barriers documented in correspondence studies. Research further shows that unemployment disparities can vary significantly by subgroup, with some differences only emerging when accounting for gender expression and perception (Campbell et al., Reference Campbell, Badgett, Dalton-Quartz and Campbell2024).
To estimate socioeconomic disparities based on LGBTQ+ status, we consider the OLS model in Equation (1): ${y_{is}} = {\alpha _0} + {\beta _1}LGBT{Q_{is}} + x^{\prime}_{is}\lambda + {\mu _s} + {\varepsilon _{is}}$
where ${y_{is}}$
is the labor force participation or unemployment status of individual i living in state s. The vector
${y_{is}}$
is the labor force participation or unemployment status of individual i living in state s. The vector $x^{\prime}_{is}$
includes the following demographic controls: age fixed effects, African descendant, indigenous status, marital status, education, children in the household, household size. This equation also includes state-of-residence fixed effects
$x^{\prime}_{is}$
includes the following demographic controls: age fixed effects, African descendant, indigenous status, marital status, education, children in the household, household size. This equation also includes state-of-residence fixed effects $\left( {{\mu _s}} \right)$
. The binary indicator
$\left( {{\mu _s}} \right)$
. The binary indicator $LGBT{Q_{is}}\;$
equals one for sexual and gender minority individuals, zero otherwise.
$LGBT{Q_{is}}\;$
equals one for sexual and gender minority individuals, zero otherwise.
Then, we estimate the same model disaggregated by sexual orientation and gender identity, as shown in Equation (2): ${y_{is}} = {\alpha _0} + {\beta _1}\;{B_{is}} + {\beta _2}G{L_{is}} + \;{\beta _3}{O_{is}} + \;{\beta _4}{T_{is}} + x^{\prime}_{is}\lambda + {\mu _s} + {\varepsilon _{is}}$
Here, the binary indicator ${B_{is}}$
is for bisexual individuals,
${B_{is}}$
is for bisexual individuals, $G{L_{is}}$
is for gay or lesbian individuals,
$G{L_{is}}$
is for gay or lesbian individuals, ${O_{is}}$
is for other sexual minority individuals, and
${O_{is}}$
is for other sexual minority individuals, and ${T_{is}}$
is for gender minority individuals.
${T_{is}}$
is for gender minority individuals.
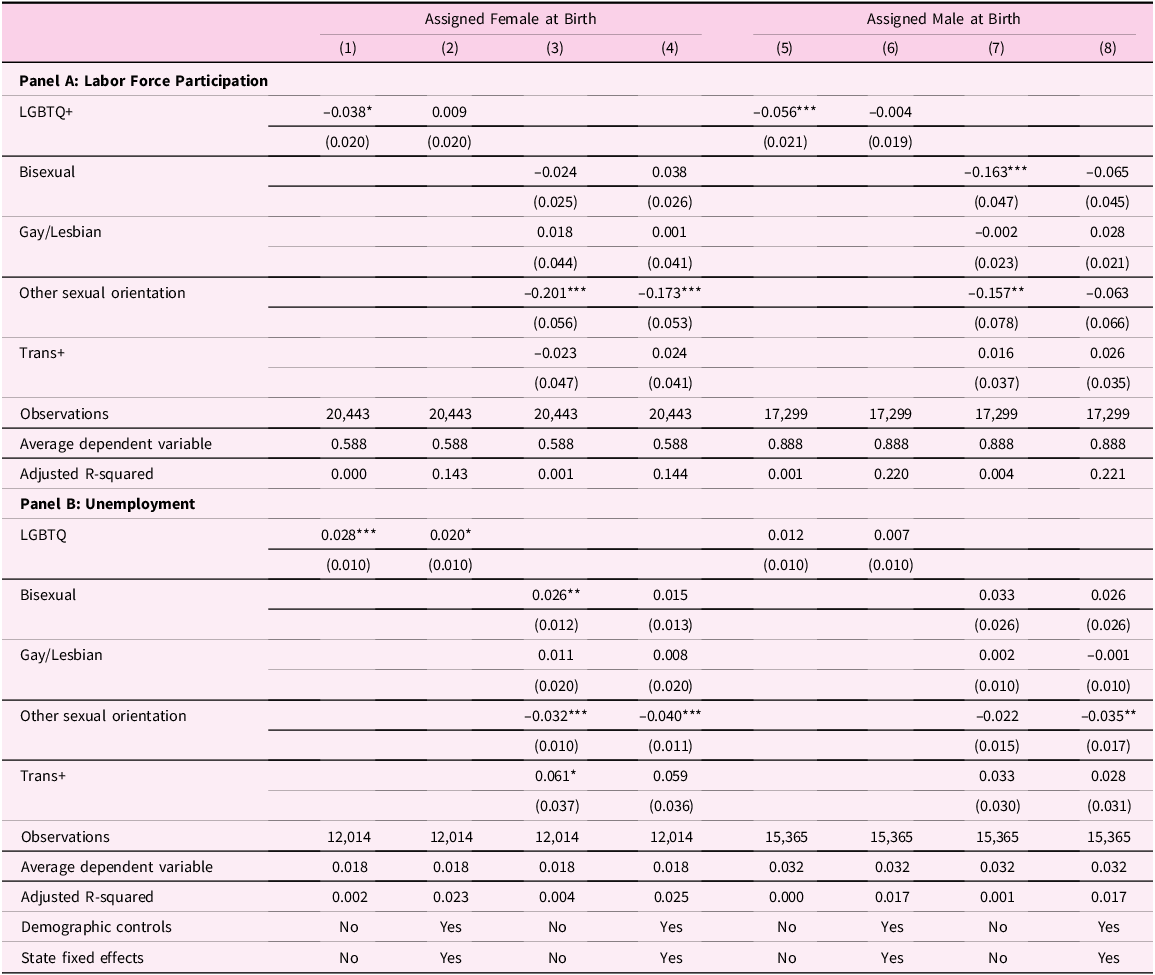
Table 4 presents the results for Equations (1) and (2), estimated separately by sex at birth. Our findings indicate that individuals identifying as LGBTQ+ have lower raw rates of labor force participation than the rest of the population (Panel A, Columns 1 and 5), although these differentials are no longer significant once demographic controls are included (Panel A, Columns 2 and 6). In relative terms, these participation gaps represent approximately 6% of the average for both individuals assigned female at birth and individuals assigned male at birth, but the magnitude is larger in standard deviation terms for individuals assigned male at birth: roughly 0.1 standard deviations for individuals assigned female at birth and 0.2 standard deviations for individuals assigned male at birth.
Labor force participation and unemployment rate by sex, sexual orientation, and gender identity

Note: Heteroskedasticity-robust standard errors in parentheses. ***p<0.01, **p<0.05, *p<0.1. Demographic controls include: age fixed effects, household size, and dummies for African descendant, Indigenous status, married/partnered, separated/divorced/widowed, secondary education, post-secondary education, and children in household. All estimates are from OLS models accounting for ENDISEG sample weights and sampling design, based on the sample of respondents aged 15–64. The categories for sexual orientation consider individuals of all gender identities, and the categories for gender identity encompass individuals of all sexual orientations.
Furthermore, LGBTQ+ individuals experience higher raw unemployment rates, especially individuals assigned female at birth (Panel B, Column 1). These differences correspond to about 0.2 standard deviations for individuals assigned female at birth.
Upon disaggregating the results (Columns 3–4 and 7–8), we observe substantial heterogeneity across LGBTQ+ subgroups, often with large point estimates compared to the baseline average. Nevertheless, it is important to note that most of these estimates are noisy due to small sample sizes, particularly when focusing on certain LGBTQ+ minorities. For instance, individuals with other sexual orientations show participation levels that are roughly one-third lower than the average and unemployment levels that fall well below the average. These results should be interpreted with caution: as already mentioned, this group has a very small sample size (N=218 unweighted) and pools individuals with potentially very different labor market profiles, such as pansexual and asexual individuals. Turning to the remaining subgroups, bisexual individuals assigned female at birth experience unemployment rates more than double the mean, corresponding to around 0.2 standard deviations. We also find higher unemployment rates among the trans+ population, likely driving the aggregate LGBTQ+ result. In particular, transgender individuals assigned female at birth face unemployment gaps of close to half a standard deviation. Overall, these results underscore how some minorities may be discouraged from entering the labor market (or be pushed out of it), thus leading to lower labor force participation rates, while others may struggle to find a job, resulting in higher unemployment rates.Footnote 1
To understand which demographic factors drive these disparities, we conducted a progressive specification analysis examining the impact of different control variables (Tables A12 and A13). Age emerges as the most influential factor in most cases, consistent with the pronounced age differences documented in Figure A1. For individuals assigned male at birth, the unconditional participation gap becomes statistically insignificant once age fixed effects are included, while unemployment differentials remain broadly consistent across specifications. For individuals assigned female at birth, the pattern is more nuanced. The unconditional participation gap not only disappears but reverses sign in intermediate specifications, reflecting that conditional on age and basic controls, LGBTQ+ individuals in this group are if anything more likely to participate in the labor market, though this positive coefficient becomes insignificant once education is accounted for. Unemployment differentials for this group show less sensitivity to controls and remain broadly consistent across specifications. Household characteristics also matter, especially for the labor force participation of individuals assigned female at birth, though these variables (marital status, household size, children) are likely endogenous to LGBTQ+ status. By contrast, education and geographic controls show minimal additional impact in most specifications.Footnote 2
Additionally, while conscious of the endogeneity of these variables, we explored whether including discrimination variables as controls affects our main estimates (Table A16). We do not find evidence that controlling for these (self-reported) discrimination experiences affects the estimated labor market disparities, as the LGBTQ+ coefficients remain similar in size and statistical significance in most specifications.Footnote 3
4. Discussion and conclusions
We provide novel sociodemographic statistics about LGBTQ+ individuals in Mexico, as well as self-reported experiences of perceived discrimination and workplace rejection. Our findings reveal that LGBTQ+ respondents face higher levels of discrimination in both social and professional settings. This discrimination is especially pronounced among trans+ individuals.
These disparities extend to the labor market, where many LGBTQ+ individuals show lower rates of labor force participation and higher rates of unemployment compared to their heterosexual and cisgender counterparts. Such patterns may be influenced by multiple structural barriers. For example, limited access to higher education among some LGBTQ+ individuals assigned female at birth constrains career prospects, while discriminatory hiring practices may further limit opportunities.
Our findings from Mexico both align with and diverge from existing evidence in important ways. Consistent with research from Chile and Uruguay (Brown et al., Reference Brown, Contreras and Schmidt2019), we find lower labor force participation among sexual minorities. However, when examining specific subgroups, the differences are not uniformly significant: while the aggregated LGBTQ+ category shows reduced unconditional labor market participation and higher unemployment, lesbian and gay individuals do not show statistically significant differences from their heterosexual counterparts in most specifications (Table 4). This differs from studies from high-income countries that document higher labor force participation rates for lesbian women (Badgett et al., Reference Badgett, Carpenter, Lee and Sansone2024). On the other hand, our findings on transgender individuals experiencing substantial (although not always significant) unemployment disparities are consistent with patterns documented globally, suggesting that employment challenges for trans+ individuals may be particularly persistent across different economic and cultural contexts.
A key limitation of this study is that it does not provide causal evidence of discrimination. However, given the scarcity of data on sexual orientation and gender identity highlighted in the introduction, we believe that these descriptive statistics are an important first step in addressing the historical invisibility of the LGBTQ+ communities.
In addition, while perceived discrimination and rejection are intrinsically subjective and potentially biased, such perceptions are key determinants of individual well-being. Indeed, if people believe they have been discriminated against, this can affect their mental health and future decisions. These effects can occur even if an individual has not actually been discriminated against: perception itself matters independently of actual discrimination. These perceptions can in turn cause a kind of rumination whose emotional strain can be taxing, also leading to minority stress (Meyer, Reference Meyer1995).
Overall, despite these limitations, our results suggest that unequal opportunities persist for LGBTQ+ respondents in the Mexican labor market. Addressing these disparities is likely to require policies and workplace practices that promote inclusion and provide protections against discrimination, as well as improvements in attitudes among the general population towards LGBTQ+ individuals.
Supplementary material
The supplementary material for this article can be found at https://doi.org/10.1017/dem.2026.10020.
Data availability
All data are available at: https://www.inegi.org.mx/programas/endiseg/2021/#datos_abiertos.
Funding statement
Financial support through the Inter-American Development Bank ESW RG-E1952 is gratefully acknowledged. We thank Caridad Araujo and Nadin Medellin for their helpful comments. All errors are our own. The views expressed in this paper are those of the authors and should not be attributed to the Inter-American Development Bank. For the purpose of open access, the authors have applied a Creative Commons Attribution (CC BY NC ND) license to any Author Accepted Manuscript version arising.
Competing interests
During the preparation of this work the authors used ChatGPT in order to improve language and readability. Refine.ink was used to check the paper for consistency and clarity. After using these tools/services, the authors reviewed and edited the content as needed and take full responsibility for the content of the published article.
Author contributions
All authors contributed to the data analysis and preparation of the manuscript. All authors approved the final draft.


 Open access