

1. Introduction
The design of structures and vessels for arctic and subarctic waters requires knowledge of ice loads and their distribution in space and time. In turn, this requires analysis of the interaction between the structure and the ice at the appropriate rate corresponding to the interaction being studied. These range from less than 1 m d−1 to several metres per second. Here we shall for the most part be concerned with the interaction at strain rates last enough to cause brittle failure of ice. Field experiments show that this occurs at rales above abour 1 mm s1. The experiments concentrate on the zones where the ice is under predominantly compressive stresses, as typically occurs in ice-vessel interaction or the interaction of icebergs with fixed or floating structures.
Under these circumstances, the ice will fail in a brittle manner dominated by two processes. The first corresponds to the formation of macrocracks and consequent spalling-off of ice pieces. The second includes an intense shear-damage process in zones where high pressures are tansmitted to the structure. This is a process where high shearing stresses, combined with hydrostatic pressure, lead to significant microstructural changes in the ice. The zones are termed critical zones (Reference Jordaan,, Kennedy, McKenna, Maes and Sodhi.Jordaan and others, 1991). Figure 1 shows an idealization of a critical zone. At B the ice is well confined, whereas al A there is much less confinement. One of the objects of this work was to study the effect of such confinement in triaxial compressive tests. In field experiments, pressures up to 70 MPa have been observed on small sensors 13 mm in diameter (Reference Frederking,, Jordaan and McCallumFrederking and others, 1990). Ice-indentation experiments in the field have also shown that forms of microstructural change other than microcracking occur, resulting in a fine-grained distinct layer of ice adjacent to the structure. This layer of crushed ice was about 25-65 mm in mean thickness for indenters up to 3 m2 in area (Reference Kennedy,, Jordaan, Maes and ProdanovicKennedy and others. 1994). Reference should also be made to the pioneering work of Reference Kheisin. and Cherepanov.Kheisin and Cherepanov (1973). There is considerable dynamic activity during the interaction process (Reference Jordaan, and Timco.Jordaan and Timco, 1988; Reference Frederking,, Jordaan and McCallumFrederking and others, 1990). During this process the microstructurally modified, crushed ice is extruded from the layer adjacent to the structure. The rapid drop in load in these tests is associated with this crushing and extrusion process. The processes that result in changes to the microstructure and in the sudden reduction in load with associated deformation and temperature variation include (1) microfracturing, (2) pressure melting, and (3) dynamic recrystallization.
Schematic illustration of high-pressure contact zones, termed critical zones.

Recrystallization has often been observed in the slow flow of ice, e.g. glaciers (Reference Hobbs,Hobbs, 1974). This process was also studied in tests on friction (Reference Barnes,, Tahor and Walker,Barnes and others, 1971; Reference Offenbacher,, Roselman, Tabor, Whalley,, Jones and GoldOffen-bacher and others, 1973), in which recrystallization occurred under loading rates greater than observed in slow-flow, and resulted in enhanced creep rates, with a c-axis orientation favourable to creep in the basal plane. Reference Duval,, Ashby and AndermanDuval and others (1983) provide an explanation of tertiary creep based on the recrystallization process. According to these authors, the ouset of dynamic recrystallization occurs at a critical difference in the free energy of adjacent grains, and moves as a wave through the material. Reference Frederking and Gold.Frederking and Gold (1975) observed recrystallization in indentation experiments, in areas of relatively high shear stress.
The present research group introduced an innovative experimental procedure, in which the ice specimen is subjected to prescribed histories of stress and strain, thus causing microstructural change before the test. Damage is defined as change to the microstructure caused by previous history of stress and strain. It is characterized by recrystallization and the presence of microcrarks. In order to take into account the changing microstructure (microcrack formation and recrystallization), state variables to represent the prior stress-strain history have been introduced. These are typically of the following form (Reference SchaperySchapery, 1981, Reference Schapery,, Jones,, McKenna, Tillotson and Jordaan1991; Reference Jordaan, and XiaoJordaan and Xiao, 1993; Reference Xiao. and Jordaan.Xiao and Jordaan, 1996):
where σ is stress, σ1 is nominal reference stress and q is a constant (≈5). The state variable S therefore takes into account stress history. Shear stresses are the predominant cause of damage, but concurrent hydrostatic pressure must also be taken into account. Previous experimental work by the present research group on ice that has undergone changes to its microstructure (Reference Stone,, Jordaan, Jones, McKenna., Axelsson, and Fransson.Stone and others, 1989; Reference Jordaan,, Stone, McKenna and FuglemJordaan and others, 1992) was focussed on the effects of microcracking on the stress-strain response of ice. The main effect of microstructural change was a reduction in elastic modulus and a large enhancement in the creep rate. In addition to microcracking, as noted, other mechanisms such as pressure melting and recrystallization could have been present, especially under triaxially confined states of stress.
Clarification of the processes and their effects is important to the understanding of the mechanics of ice structure interaction. Also, in the characterization of damage, assumptions have been made which require validation or correction. Therefore, an experimental programme was conducted. This programme also served to clarify the following issues:
-
(1) The intrinsic creep response of ice in the intact, undamaged state is required for analysis of creep response in the damaged state (Reference Xiao. and Jordaan.Xiao and Jordaan, 1996). Tests have been conducted to study this aspect, in particular the question of the minimum creep rate.
-
(2) The kinds of microstructural change are important for the sound application of damage mechanics. The changes include microcracking and recrystallization which result from stress and strain history. Evidence from thin sections is the principal method.
-
(3) The stress-strain relationship as a function of previous stress-strain history, is essential to analysis of the critical zones, as is the effect of stress path on the response of ice, particularly under the unloading conditions described above.
2. Experimental Programme
2.1. Notation
The convention adopted here is that which is most used in the geophysical sciences, whereby σ1 ≥ σ2 ≥ σ3 and compressive stresses are assumed positive. The stress and strain can be expressed in terms of the volumetric and deviatoric components. In the tests under triaxial conditions to be described, the specimen was subjected to hydroslatic pressure and an axial stress (Fig. 2). The value (σ1 − σ3) is denoted the stress difference, and it can be shown that this is equal to the von Mises stress s, given by
where s 1, s 2 and s 3 are the deviatoric stresses corresponding to directions 1, 2 and 3.
Triaxial test, specimen subjected to hydrostatic pressure and an axial stress.

The tests on stress path are demonsirated in Figure 3. The path OA is along the hydrostatic axis (σ1 = σ2 = σ3). The path AB illustrates the conventional triaxial test, corresponding to the increase of axial stress σ1 on a cylindrical specimen. Stress in the deviatoric plane (AE) can be applied (see Reference Singh.Singh, 1993). The path BD illustrates a possible path for removal of hydrostatic pressure while maintaining axial pressure. This path was used in three tests (see section 3.3).
Stress paths in principal stress space.

2.2. Test Specimens
All tests were conducted using laboratory-prepared granular ice following the procedure detailed by Reference Stone,, Jordaan, Jones, McKenna., Axelsson, and Fransson.Stone and others (1989). To minimize the final air content of the ice while maintaining control over grain-size, the following equipment and procedure were used (Fig. 4). Bubble-free Columnar grained ice produced from distilled, deionized and deaerated water frozen unidirectionally was crushed and sieved to produce 2.00-3.36 mm seeds. A cylindrical, acrylic mould, 229 mm in diameter, 303 mm in length, was filled with this seed. The bottom of the mould, constructed of aluminium, was sealed with O-rings and equipped with an airtight valve. The top of the mould consisted of a flexible latex membrane sealed against the wall of the mould using elastic bands and silicone grease. The filled mould was attached, via rubber tubing and a three-way valve, to both a vacuum pump and deaerator.
Equipment and procedure, laboratory-prepared granular ice.

The mould, with seed ice and connecting tubing, was placed under a vacuum of 270-400 Pa (2.0-3.0 torr) for a period of 1.5-2h. After evacuation, distilled and deionized water cooled to 0 ° C was transferred to the deaerator and deaerated for 15 min. The mould was then completely flooded with this deaerated water via the evacuated tubing and three-way valve without any further contact with the atmosphere.
After flooding, the airtight valve was closed and the mould disconnected. The mould, supported above floor level, was then covered with an insulating jacket leaving the bottom exposed. Freezing was primarily unidirectional from the exposed bottom up, and was completed in approximated 3 d, at a cold-room temperature of −10 ° C. The ice was removed from the mould by allowing it to warm slightly and slide IVom the mould.
Typically, the freezing procedure produced larger than desired grains near the bottom and outside perimeter, and a higher density of bubbles near the top. To ensure consistent repeatable ice quality, the top and bottom 30 mm were removed and discarded. Four cylindrical samples were then cut from the large cylinder such that the outside perimeter was also discarded.
The rough-cut specimens were machined to the desired diameter using a lathe. Subsequently, the desired length, with ends parallel and perpendicular to the centre axis, was obtained using a special double fly cutter in a horizontal milling machine with the specimen held in a precision vice. Both ends were machined simultaneously. The final test specimens used measured 70 ± 0.05 mm diameter by 175 ± 1.0 mm length.
The crystal structure of each batch of four specimens was checked by taking a thin section at the immediate top and bottom of random specimens throughout a given batch. Mean grain diameter based on the number of grains per unit area and assuming spherical grains of constant size (Reference Cole,Cole, 1986) was 3.5 mm. The c-axis orientation was determined using a universal stage with azimuths and inclinations plotted on a Lambert equal-area projection. Random c-axis orientation was evident in each case.
The ice produced by the above procedure is largely transparent through the 70 mm diameter with minimal bubble content. Reference Stone,, Jordaan, Jones, McKenna., Axelsson, and Fransson.Stone and others (1989) demonstrated that density measurements did not provide an adequate quantitative measure of the low bubble content achieved by the ice-production process used. The values were, in fact, equal to 0.917 ± 0.0005 g cm−3 at −4 ° C.
2.3. Test Equipment and Procedure
An MTS Systems Corp. Teststar Material Test System integrated with a Structural Behaviour Engineering Laboratories (SBEL) Model 10 triaxial cell was used for all tests (Fig. 5). The dual-axis digital control system permitted full, uninterrupted closed-loop feedback control of both the axial load frame and the triaxial cell confining pressure across the full range of control modes. The four-column axial load frame and actuator have a dynamic capacity of 500 kN. Both the MTS Confining Pressure Intensifier and the triaxial cell have a capacity of 69 MPa. In all cases, the complete test sequence, including machine operation, test execution, control-mode changes and data acquisition, was pre-programmed using MTS Test ware SX software.
Test apparatus: MTS dual-axis Teststar system with SBEL triaxial cell.

The triaxial cell with overall internal dimensions of 241 mm diameter by 358 mm height supports a specimen size of up to 102 mm in diameter, confining pressures to 69 MPa (10000 psi), and axial loads to 1300 kN (300 000 1b). Dow Corning silicone 200 fluid with a viscosity of 10−5 m2s−1 (10 cSt) was used as the confining fluid. This non-conducting transparent fluid has a relatively flat viscosity-temperature curve, permitting easy serviceability at temperatures down to −40 ° C. Four-pin hermetically sealed electrical feed-throughs permit easy access to in-vessel instrumentation. The transfer of confining fluid to and from the cell was done using the valve-control system and pump of the confining-pressure intensifier.
Data recorded included time, stress difference, axial strain, lateral strain and triaxial confining pressure. The acquisition rates were varied depending on the test process and its duration, so as to keep data files to a reasonable size, for example, from 25 samples per second during the damage step to 25 per second during pulse loading. The Teststar data acquisition provides 16-bit resolution across 16 channels, with simultaneous sample and hold providing sampling across all channels at the same time.
The stress difference applied was measured using the load cell of the axial load frame external to the triaxial cell. The total force measured included a component attributable to the counteracting force of the hydrostatic confining pressure. This force due to the hydrostatic pressure was measured, and subtracted from the measured total force to give the force difference.
Axial strain was measured using two in situ linear variable differential transformers mounted directly on the sample 180 ° apart over an initial gauge length of approximately 120 mm using specially designed collars. The two linear variable differential transformers outputs were averaged to provide both an in situ measurement of strain and a closed-loop feedback-control signal when needed.
Lateral strains were measured using specially designed double cantilever beams with a full-bridge strain gauge array. Three transducers were mounted across the diameter of the sample at approximately the top, centre and bottom of the gauge length. The gauge length of these transducers could be varied to apply a gentle pressure to the sample for mounting, and they were further secured by elastic bands. The change in diameter at the three locations as measured by the transducer was measured and recorded separately. After testing, an average value was used to obtain radial strain. The volumetric strain was then obtained using axial strain and radial strain.
The temperature during each test was measured using fast-response resistance temperature detector elements immersed in the confining fluid and implanted in the centre of a specimen within the triaxial cell. All tests were conducted at an initial confining-fluid and specimen temperature of −10 ± 0.5 ° C. The results indicate that under the highest pressure of 20 MPa, the temperature of the specimen increased by 0.3 ° C immediately upon application of the confining pressure. A further increase of 0.8 ° C could occur during the test as a result of heat transfer from the confining fluid.
3. Test Programme and Results
The test series was designed to study three aspects: the intrinsic creep properties of intact (i.e. undamaged) ice; the enhancement of creep and changes in microstructure due to damage; and effects of different stress paths.
3.1. Intrinsic Creep Properties
3.1.1. Rationate and Programme
The creep properties of intact (i.e. undamaged) granular ice were measured by applying a small stress difference, up to 2.3 MPa, over a long time duration, up to 12h. A hydrostatic pressure was applied in order to suppress the initiation of cracks, and then the creep response that resulted from a small stress difference was measured for a period of time. It should be noted that the existence of a minimum creep rate has been questioned (Reference Schapery,, Jones,, McKenna, Tillotson and JordaanSchapery, 1991). At low stresses and strain rates, Reference Jacka,Jacka (1984) has shown, a minimum strain rate occurs in the creep of ice at a total octahedral strain of about 0.6%. At higher strain rates, Reference Sinha.Sinha (1989, Reference Sinha,, Ayorinde., Sinha and Sodhi1990) has suggested, microcracking and accumulated damage during primary creep may be so important that a minimum creep rate is of limited value. One of the aims of this work was to study ice under relatively high strain rates but under confined conditions where tracking would be suppressed.
In accordance with this objective, three tests have been conducted on intact specimens under 20 MPa triaxial confinement;
-
Test 1: 1.8 MPa stress difference applied for 12 h followed by 12 h relaxation.
-
Test 2: 2.0 MPa stress difference applied for 12 h followed by 12 h relaxation.
-
Test 3: 2.3 MPa stress difference applied for 8 h followed by 8 h relaxation. The initial load and relaxation sequence was immediately followed by a repeat sequence.
3.1.2 Results and Discussion
The Creep response of these tests is shown in Figure 6. For test 3 the creep following first loading only is shown. Figure 7 shows the creep response of the initial and repeat test sequence of test 3.
Creep response of intact ice under 20 MRa triaxial confinement and stress differences of 1.8, 2.0 and 2.3 MPa.

Axial and volumetric strain of initial and repeat 8 h 2.3 MPa pulse-load and 8 h relaxation sequence under 20 MPa triaxial confinement (test 3).

Using the conventional division of creep into three phases — primary, secondary and tertiary — the 1.8 MPa stress applied in test 1 clearly demonstrates the primary and secondary phases of creep in ice. The transition to tertiary does occur at about 7 h in test 2, where the applied stress difference was increased to 2.0 MPa. The 2.3 MPa stress difference of test 3 reduces the time to minimum creep rate to about 4 h. The repeat load sequence of test 3 indicates that the specimen had undergone significant change, since the strain response was quite different when compared to the initial load sequence. Maximum total strain at the end of the second 8 h load pulse is 5%. 2.5 times that of the initial test, with tertiary creep occurring earlier at about 2.7 h.
Typical cross-polarized thin sections of the ice prior to and after testing are shown in Figure 8 and 9. In all cases, there was a breakdown of grain structure and associated recrystallization. The change in grain-size was more marked for higher stress differences. It should be noted that the after-test thin section of test 3 (Fig. 9c) was taken after completion of the repeat load sequence and a total strain of 7%. In this case, the change in structure is uniform across the specimen, with a reduction in mean grain diameter from 35 to 23 mm. A number of small voids between crystals was also observed in the after-test thin section during microtorning.
Typical thin section of ice prior to testing.

Thin sections after testing: (a) test 1,1.8 MPa stress difference: (b) test 2.2.0 MPa stress difference; and (c) test 3, 2.3 MPa stress difference.
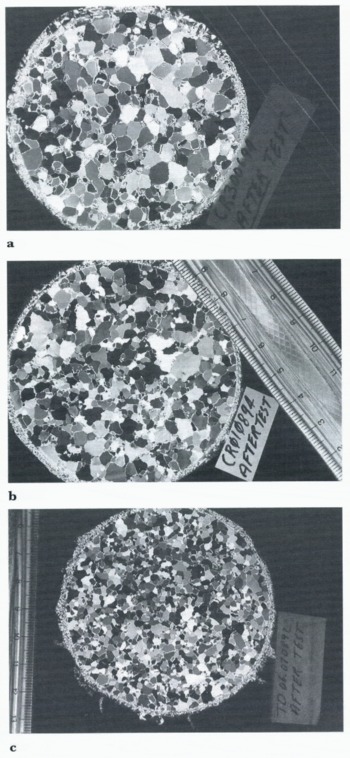
Although the confining pressure suppressed micro-cracks as observed in thin sections after the test compared to uniaxially loaded specimens, the microstructure did not remain unaltered, and two modifications, recrystallization and void formation, were observed. The acceleration of creep is likely to be associated with these microstructural changes. It is likely that the greatly enhanced Strains observed in the repeat load sequence of test 3 are associated with void formation since the increased strain rate occurred concurrently with the volume increase (Fig. 7).
Compression tests with a number of sequential pulse loads of short duration (20 and 100 s) were also conducted on intact ice. These were essentially companion tests for comparison with those on damaged ice and will therefore be presented in section 3.2.
3.2. Damaged Ice and Creep Enhancement
3.2.1. Ationale and Programme
Compression tests were conducted on both intact and damaged specimens under uniaxial conditions and triaxial confining pressures (5,10 and 20 MPa). The stress-strain and strain-time curves were used to quantify the creep response as a function of damage and triaxial confinement pressure. Any microstructural changes occurring were defined through thin sections taken before and after the test. A variety of damage levels was created by compressing otherwise undamaged, intact samples at a strain rate of 10−4s−1 to a total axial strain of 2% or 4%. These damage steps were applied either uniaxially or under the triaxial confinement pressure (5, 10 and 20 MPa) to be applied in the particular test. Typical stress-strain curves for each of the 2% and 4% total strain damage steps are shown in Figure 10. The damage-level notation is X%U, X%5. X%10 and X%20 where X is percentage strain achieved at a rate of 10−4s−1 uniaxially (U) or under triaxial confining pressure (5,10 or 20 MPa). Following the damage step, the specimen was unloaded. It was then subjected to a test sequence involving the application of a number of 1, 2 and 3 MPa stress differences (instant load and unload each for a period of 20s followed by either a 200 or 400 s relaxation period. In most cases, the initial stress sequence above was common to all tests, and was followed by a sequence of higher pulse loads, up to 10 MPa, for a longer duration (100 s). These were, in turn, followed by a longer relaxation period (800 s). The small stress pulses were designed to avoid further damage, while giving the strain compliance. The higher pulses gave information on non-linearities with stress, but further damage was likely to occur concurrently with the stress.
Damage states created by compressing undamaged intact samples at a strain rate of 10−4s−1 to a total strain of 2% or 4%.

3.2.2. Results and Discussion
In earlier tests, Reference Jordaan,, Stone, McKenna and FuglemJordaan and others (1992) examined the creep response of intact (i.e. undamaged) and damaged ice (to 2% total strain at 10−4 s−1) under uniaxial conditions. The results are shown in Figure 11. Comparison of the creep response of intact and 2% uniaxialiy damaged ice shows that elastic strain has not increased significantly as a result of the damage; delayed elastic strain was increased by several orders of magnitude. The stress pulses used for these tests (0.25, 0.5 and 0.75 MPa) resulted in negligible additional damage after repealed loadings.
Creep response of intact (solid line) and 2% uniaxially damaged ice (dashed line) for 20 s pulse-load sequence of 0.2/0.5/0.25/0.75 MPa under uniaxial conditions (Reference Jordaan,, Stone, McKenna and FuglemJordaan and others, 1992).

Figures 12 – 14 show the creep response of intact ice, as well as 2% and 4% uniaxialiy damaged ice, all tested sub-sequently to the damage step under triaxial confining pressures of 5,10 and 20 MPa. The damage state has virtually no effect on the elastic-strain component under each of the three confining pressures. At a confining pressure of 5 MPa there is virtually no difference in the creep response of intact and 2% uniaxialiy damaged ice for any of the three pulse-loads (Fig. 12). For intact ice and damage states, 2% U and 4% U, tested at 10 and 20 MPa confining pressure, the strain-compliance enhancement associated with damage is clearly evident for the 3 MPa pulse, and less so for smaller (1 and 2 MPa) pulses. Unlike the large increases shown in the previous uniaxial tests (Fig. 11), relatively small increases in delayed elastic creep as a function of uniaxial damage state were observed under triaxial confinement.
Creep response of intact (I) and 2% uniaxially damaged ice (2% U), under 5 MPa triaxial confinement for 1,2 and 3 MPa, 20 s, pulse loads.

Figures 15 – 17 show the creep response of 2% and 4% triaxially damaged ice along with that of the intact ice previously shown in Figure 12 – 14. In these tests, the 2% and 4% total strain at 10−4s−1 damage step was executed under the same triaxial confining pressure as the pulse loads of the particular test. As previously, there is virtually no effect on elastic strain. However, the delayed elastic or primary creep strain, is larger for those samples damaged under triaxial conditions than for those damaged under uniaxial conditions, although there is little difference between those damaged under 5, 10 and 20 MPa. In other words, there is little difference between the 4%5, 4% 10 and 4%20 curves in Figure 15,16 and 17a when they are compared at the same pulse load, but all are significantly different from the 4%U curve of Figure 14. Figure 17b shows the effect of larger load pulses, up to 7 MPa, for a longer duration, 100 s. Clearly the strain developed is greater, as expected for a larger applied stress, because, for ice, strain rate is proportional to stress to a power of about 3. A reduced grain-size was noted in the thin section shown in Figure 9c, taken at the end of an extended creep test on an intact specimen under 20 MPa confining and 2.3 MPa additional stress difference. Figure 18 shows the thin section of a specimen after 2% uniaxial damage and a 1,2,3,1 MPa, 20 s, pulse-load sequence under triaxial confinement of 10 MPa. Cracks along and across grain boundaries, with fine particles dispersed throughout the section, are readily apparent on the magnified section (Fig. 18b).
Creep response of intact (I) and 2% and 4% uniaxially damaged ice (2% U, 4% U), under 10 MPa triaxial confinement for 1,2 and 3 MPa, 20 s, pulse loads.

Creep response of intact (I) and 2% and 4% uniaxially damaged ice (2% U, 4% U), under 20 MPa triaxial confinement for 1, 2 and 3 MPa, 20 s. pulse loads.

Creep response of intact (I) and 2% and 4% triaxially damaged ice (2%5, 4%5), under 5 MPa triaxial confinement for 1,2 and 3 MPa, 20 s, pulse loads.

Creep response of intact (I) and 4% triaxially damaged ice (4%10), under 10 MPa triaxial confinement for 1, 2 and 3 MPa, 20 s, pulse loads.

(a) Creep response of intact (I) and 2% and 4% triaxially damaged ice (2%20, 4%20), under 20 MPa triaxial confinement for (a) 1, 2 and 3 MPa, 20 s, pulse loads, (b) 3, 5 and 7 MPa, 100 s, pulse loads.

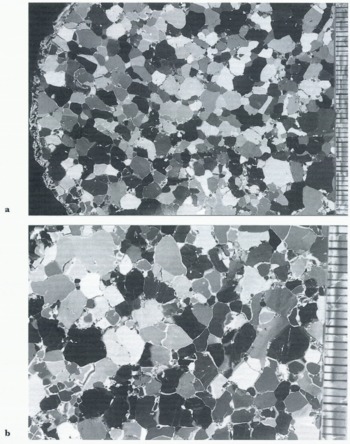
Thin section of a specimen having undergone 2% uniaxial damage (2%U) and a 1,2,3,1 MPa, 20 s, pulse-load sequence under triaxial confinement of 10 MPa.

A significant difference between the damage states under uniaxial and triaxial stress states is the introduction of microcracks. Under uniaxial conditions, the damage introduced by a 4% strain consists mainly of microcracks parallel to the axis of loading. These microcracks will tend to introduce anisotropy. Under triaxial conditions, these microcracks will be suppressed (see Fig. 19), and the damage introduced will be mostly dislocation generation and plastic deformation. Figure 20 shows two strain-history curves for creep tests under 10 MPa triaxial confinement on damaged samples I (4% 10) and II (4% U). The strain history from 0 to A corresponds to the formation of the damage. The period A-B corresponds to the sequence of creep tests. In the case of uniaxial damage (4% U), microcracks were developed along the direction of loading stress, thereby introducing anisotropy. Upon the application of confinement, this sample returned much closer to its original volume. This response would result from the closure of cracks. Ice with closed cracks (due to confinement) behaves similarly to intact ice, resulting in reduced elastic and creep strains (Reference Rist,, Jones and Slade.Rist and others, 1994). The friction between crack surfaces plays an important role in this case. The effect of friction between closed-crack surfaces may also explain why under 5 MPa confinement, the creep strain of damaged ice was almost the same as that of intact ice. When the confinement was increased to 10 or 20 MPa. recrystallization and pressure melting between grains or along crack surfaces could occur, and the creep response of uniaxially damaged ice was increased.
Thin section of a specimen having undergone 4% strain at a strain rate of 10−4s−1 under triaxial confinement of 20 MPa.

Comparison of creep response of uniaxially (sample 11. 4%U) and triaxially (sample 1, 4% 10) damaged ice under 10 MPa triaxial confinement.

The ice went through substantial microstructural change during testing Figure 21, a thin section of a sample damaged uniaxially to a total strain of 2% at 10−4s−1, shows the formation of cracks along the axis of loading and the development of a fine-grained structure between a number of grain boundaries, or along cracks.
Thin section through a uniaxially damaged sample (Reference KennyKenny, 1992).

Figures 18 and 22 show the microstructure of specimens subject to confining pressure and to load pulses after a 2% U damage step. A small number of stress-difference pulses, up to 3 MPa, were used under 5 MPa (Fig. 22) and 10 MPa (Fig. 18) confinement. The cracks and fine-grained structure produced by the damage step were observed. At 10 MPa (Fig. 18) the higher confinement resulted in a clear increase in the extent and degree of recrystallization to a finer-grained structure.
Thin section of a specimen having undergone 2% uniaxial damage (2% U) and a 1,2,3,1 MFa, 20 s, pulse-load sequence under triaxial confinement of 5 MPa.
The structure after damage under a triaxial stress state, 4%20, is shown in Figure 19. Craeks are no longer apparent, and the fine-grained Structure now extends throughout the sample, with few grains unaffected. An extensive number of stress-difference pulses, up to 7 MPa, were applied under the higher 20 MPa confinement. Ice damaged to 4%20 showed no cracks and an extensive and complete recrystallization to a fine-grained structure (Fig. 23). Attempts were made to identify any changes in the crystal orientations before and after tests. Two samples were examined before and after a total axial sirain of 2%. The orientation of approximately 100 grains was examined with no significant preferred orientation evident (personal communication from S. K. Singh, 1996).
Thin section of a specimen having undergone 4% damage at 20 MPa confinement (4%20) and a 1, 2, 3, 1 MPa, 20 s. and a 3, 1, 5, 1, 7, 1 MPa, 100 s, pulse-load sequence under triaxial confinement of 20 MPa.

3.3. Pressure Reduction Tests
3.3.1. Rationale and Programme
Extrusion and Spalling of crushed ice in actual ice structure interaction (Reference Frederking,, Jordaan and McCallumFrederking and Others, 1990) may result in sudden reductions in confining pressures and a corresponding increase in stress difference. In addition to the compression tests to characterize creep enhancement as described above, a preliminary investigation of the effect of sudden confinement-pressure drops on creep rate has been undertaken.
Three tests contrast two confining pressures and two damage levels:
-
Test A: 2% 10 damage, 7 MPa load for 100 s, under 10 MPa triaxial confinment reduced to 5 MPa at 20 s.
-
Test B: 2% 10 damage, 7.65 MPa load for 100 s, under 20 MPa triaxial confinement reduced to 5 MPa at 20 s.
-
Test C: 4% 20 damage, 7.65 MPa load for 100 s, under 20 MPa triaxial confinement reduced to 5 MPa at 20 s.
After damaging in each test, a pulse load of 7 MPa for test A, and 7.65 MPa for tests B and C was applied for 100 s under the corresponding confining pressure. After 20 s of this 100 s period had elapsed, the triaxial confining pressure was instantaneously dropped from its initial level to 5 MPa for the rest of the pulse load. This pressure drop was executed without a corresponding drop in the applied force as measured by the external load cell, effectively increasing the stress difference to 10.14 M Pa for test A and 16.77 MPa for tests B and C.
3.3.2. Results and Discussion
Figure 24 shows the strain-time curves for the three tests. During test A the drop in confinement from 10 to 5 MPa resulted in a substantial increase in deformation rate from 0.025% s−1 at 0-20 s to 0.175% s−1 at 20-40 s. Therefore, a 7-fold increase in deformation rate occurred compared to a 1.45-fold increase in stress difference. Test B with the same damage but a pressure drop from 20 to 5 MPa showed a deformation rate of 1.49% s−1 after 20 s. This reflects a 60-fold increase in deformation rate for a 2.19-fold increase in stress difference. The greater damage of test C results in a marginal increase in creep during the 0-20 s period compared to tests A and B. It has little effect on the deformation rate after the release of pressure relative to test B. conducted at a lower level of damage.
Effect of sudden confinement-pressure drops on the axial strain rate: test A, 2% 10 damage, 7 MPa load for 100 s, under 10 MPa triaxial confinement reduced to 5 MPa at 20 s; test B, 2% 10 damage, 7.65 MPa load for 100 s, under 20 MPa triaxial confinement reduced to 5 MPa at 20 s; and test C, 4%20 damage, 7.65 MPa load for 100 s, under 20 MPa triaxial confinement reduced to 5 MPa at 20 s.

4. Discussion
A range of tests has been conducted to determine fundamental behaviour of ice under a range of stress states and stress history. The lest programme was aimed at understanding the response of ice within high-pressure zones that occur during ice-structure interaction (e.g. critical zones in Reference Jordaan,, Kennedy, McKenna, Maes and Sodhi.Jordaan and others, 1991). As part of the work on critical zones, analyses of stresses and strains using finite-element methods have been carried out (Reference Xiao,, Jordaan, McKenna, Frederking,, Muggeridge,, Colbourne and MuggeridgeXiao and others, 1991). These analyses require appropriate constitutive models, based on state variables, as mentioned earlier. The key innovation has been to cause certain damage states by imposing a defined stress history, and then to investigate the response of the damaged ice. The present paper gives an overview of the test programme aimed at improved modelling of the processes involved. Other tests include, first, a brief investigation on intact ice with confining pressures and a small stress difference aimed at obtaining the intrinsic response to stress, and secondly, tests on damaged ice in which changes in hydrostatic pressure occur, simulating the fluctuation of loads in the field (“pressure drop” tests).
The tests on intact ice with confining pressures and low shear stresses aimed at defining the intrinsic creep response in the absence of microcracking showed that an accelerated creep rate occurred at relatively low shear stresses. Hence, a minimum creep rate occurred under these conditions. Although microcracking was suppressed, recrystallization and, in one case, void formation occurred. The intrinsic behaviour in the absence of any microstructural changes is rather elusive!
Ice damaged uniaxially and triaxially showed enhancement of creep under triaxial loading conditions. This was much more pronounced in the case of damage created under triaxial conditions. For example, in Figure 14, the response of the specimen damaged to 4% uniaxially (4%U) is not very different from the response of the intact ice (I) specimen, whereas in Figure 17, the specimen damaged to 4% triaxially (4%20) is significantly softer than the intact ice (I) specimen. The 4%20 sample is only slightly softer than the 2%20 sample.
The type of damage was also different, resulting in the difference in response noted. Uniaxially damaged specimens contained microcracks parallel to the stressed direction which tend to close under triaxial confinement. Damage under triaxial conditions was largely associated with recrystallization, and some cracking at the lower confining pressures. The samples damaged uniaxially therefore would be highly cracked by the damage. When retested under confined conditions, the confinement would close the cracks, resulting in a sample close to the original intact ice. Hence, a strain-time curve not very different from that of an undamaged sample resulted. Samples damaged under confining pressure exhibit reduced microcracking at a strain of 2% or 4%. Considerable dislocation multiplication would occur and the ice would be in the tertiary creep range where recrystallization is known to occur (Reference Glen, and Ives.Glen and Ives, 1988). Both these effects would lead to softer ice, which is what was observed when the samples were reloaded under the pulse loads. The remaining question is why a 2%20 and a 4%20 sample showed little difference on reloading. It is known that in single crystals of ice the initial dislocation content has a large effect on the peak stress, but has little effect on the flow stress at strains beyond the peak value (Reference Jones, and GlenJones and Glen, 1969). Thus, for the present polycrystals, damaged beyond the peak stress to either 2% or 4% strain (usually the peak stress occurs at 1% or less) the flow stress would be similar, and hence, when reloaded, they would behave similarly, as was indeed found. From another perspective, the value of state variable S from Equation (1) would be very similar in the case of the two damage states. The ensuing strains would be expected to be similar.
Of particular importance were the very high creep rates in triaxially damaged ice at high deviatoric stresses (Fig. 17b). Very high strain rates were also observed in the pressure-drop tests (Fig. 24). The creep is highly non-linear with stress. The high rates could be associated with the formation of critical zones. Figure 25 shows the strain rate in various tests. It is clear that stress history has a very significant effect on strain rate. This will be particularly evident in those tests, such as the pressure-drop tests, where the ice was significantly damaged and yet sustains very high shear stresses. A specimen under 22 MPa stress difference under these conditions creeps at a rate approximately 106 times the rate for intact ice at 1 MPa proposed by Reference Sinha,Sinha (1981). As mentioned earlier, the elastic strain is not strongly influenced by the damage state, whereas the delayed elastic and secondary creep strain are significantly enhanced. Triaxially damaged ice showed insignificant change in elastic strain.
Strain rate of pressure-drop tests relative to previous work.

The importance of shearing can be seen by contrasting two tests. In the first, under high confinement, typically 10-20 MPa, the ice undergoes a complete recrystallization (breakdown of structure) when subjected to a stress deviator at a rate of 10−4 s−1 reaching a maximum stress of about 10 MPa. On the other hand, hydrostatic pressure (40 MPa) applied for 1.5 h resulted in no observable change in crystal size. The tests show clearly that shear stress results in recrystallization, and that hydrostatic pressure alone has little effect on crystal size. At the same time, hydrostatic pressure can permit the application of the high shear necessary to cause extensive recrystallization. Tests in the field (Frederking and others, 1990) show that these states of stress and associated changes to the microstructure occur during ice-structure interactions.
As noted, the present tests show that a reduction in grain-size occurs under the action of shear stress. Under uniaxial stress, the recrystallization occurs near zones where microfracturing takes place. This was also observed in large-grained (5 mm) specimens by Reference Cole,Cole (1987). In the presence of confining pressure, the recrystallization is spread uniformly across the Specimen, including cases where there is no evidence after the test of microfracturing. The process is deformation-induced and therefore, by definition, dynamic (Reference Poirier,Poirier, 1985). The relative roles of sub grain development by dislocation walls and by microfracturing are not clear. The recrystallization mechanisms do not appear to correspond to grain-boundary migration and enlargement of grains associated with the difference in strain energy between grains. This mechanism was suggested by Reference Duval,, Ashby and AndermanDuval and others (1983), who associated dynamic recrystallization with a critical strain-energy difference. Rather, an overall reduction in grain-size and release in strain energy of the grains with an increase in shear deformation rate is found. In the review paper by Reference Urai,, Means, Lister, Hobbs, and HeardUrai and others (1986), the mechanism of diffusive mass transfer associated with decrease in grain-size by recrystallization is discussed. This can lead to a softening of the material. The relationships show strain rates that are linear with stress. In the present case, extreme non-linearity has been found. In a recent publication, Reference Jacka, and JunJacka and Li (1994) have suggested that an equilibrium crystal size is a “balance” between crystal growth with time as a function of temperature and crystal size as a result of deformation. The temperature dependence of these two effects is similar, and consideration of the activation energies for the two processes indicates that it may be appropriate to cancel these effects. Under these conditions, very small grain-sizes for the high stresses used in the present experiments are indicated. Our strain rates are much higher than those considered by Reference Jacka, and JunJacka and Li (1994). The formation of small grains at high stresses is well known in other materials (Reference Derby,, Barber, and MeredithDerby, 1990) and may result from a high nucleation rate of new crystals for a given rccrystallized volume. The enhanced creep rale in the damaged specimens is associated with the recrystallization process. Increased grain-boundary volume and associated sliding, or favourable orientation (for creep) of the c-axis direction after recrystallization could also contribute to higher creep rates.
Reference Duval,, Ashby and AndermanDuval and others (1983) quote a value of 1000 Jm−3 as critical strain-energy density for grain-boundary migration. In their tests, which were uniaxial at low stress levels (1-2 MPa), this was shown to exist only at local stress concentrations. In our tests, the strain-energy density associated with the stress difference could be as high as 5000 J m−3, excluding terms associated with volume change. The latter could amount to almost 40000J m−3. This would become available in situations where the volumetric stress is relieved, as occurs in the pressure-reduction tests reported here. This also happens repeatedly in field situations where confining pressures are released.
Acknowledgements
Financial support for this research was provided through the Canada-Newfoundland Offshore Development Fund, Natural Sciences and Engineering Research Council of Canada, Mobil Oil Canada Properties, National Energy Board and Memorial University of Newfoundland. The authors wish to thank Dr R. A. Schapery of the University of Texas at Austin for his helpful suggestions.


