


Introduction
Lasing spectroscopy
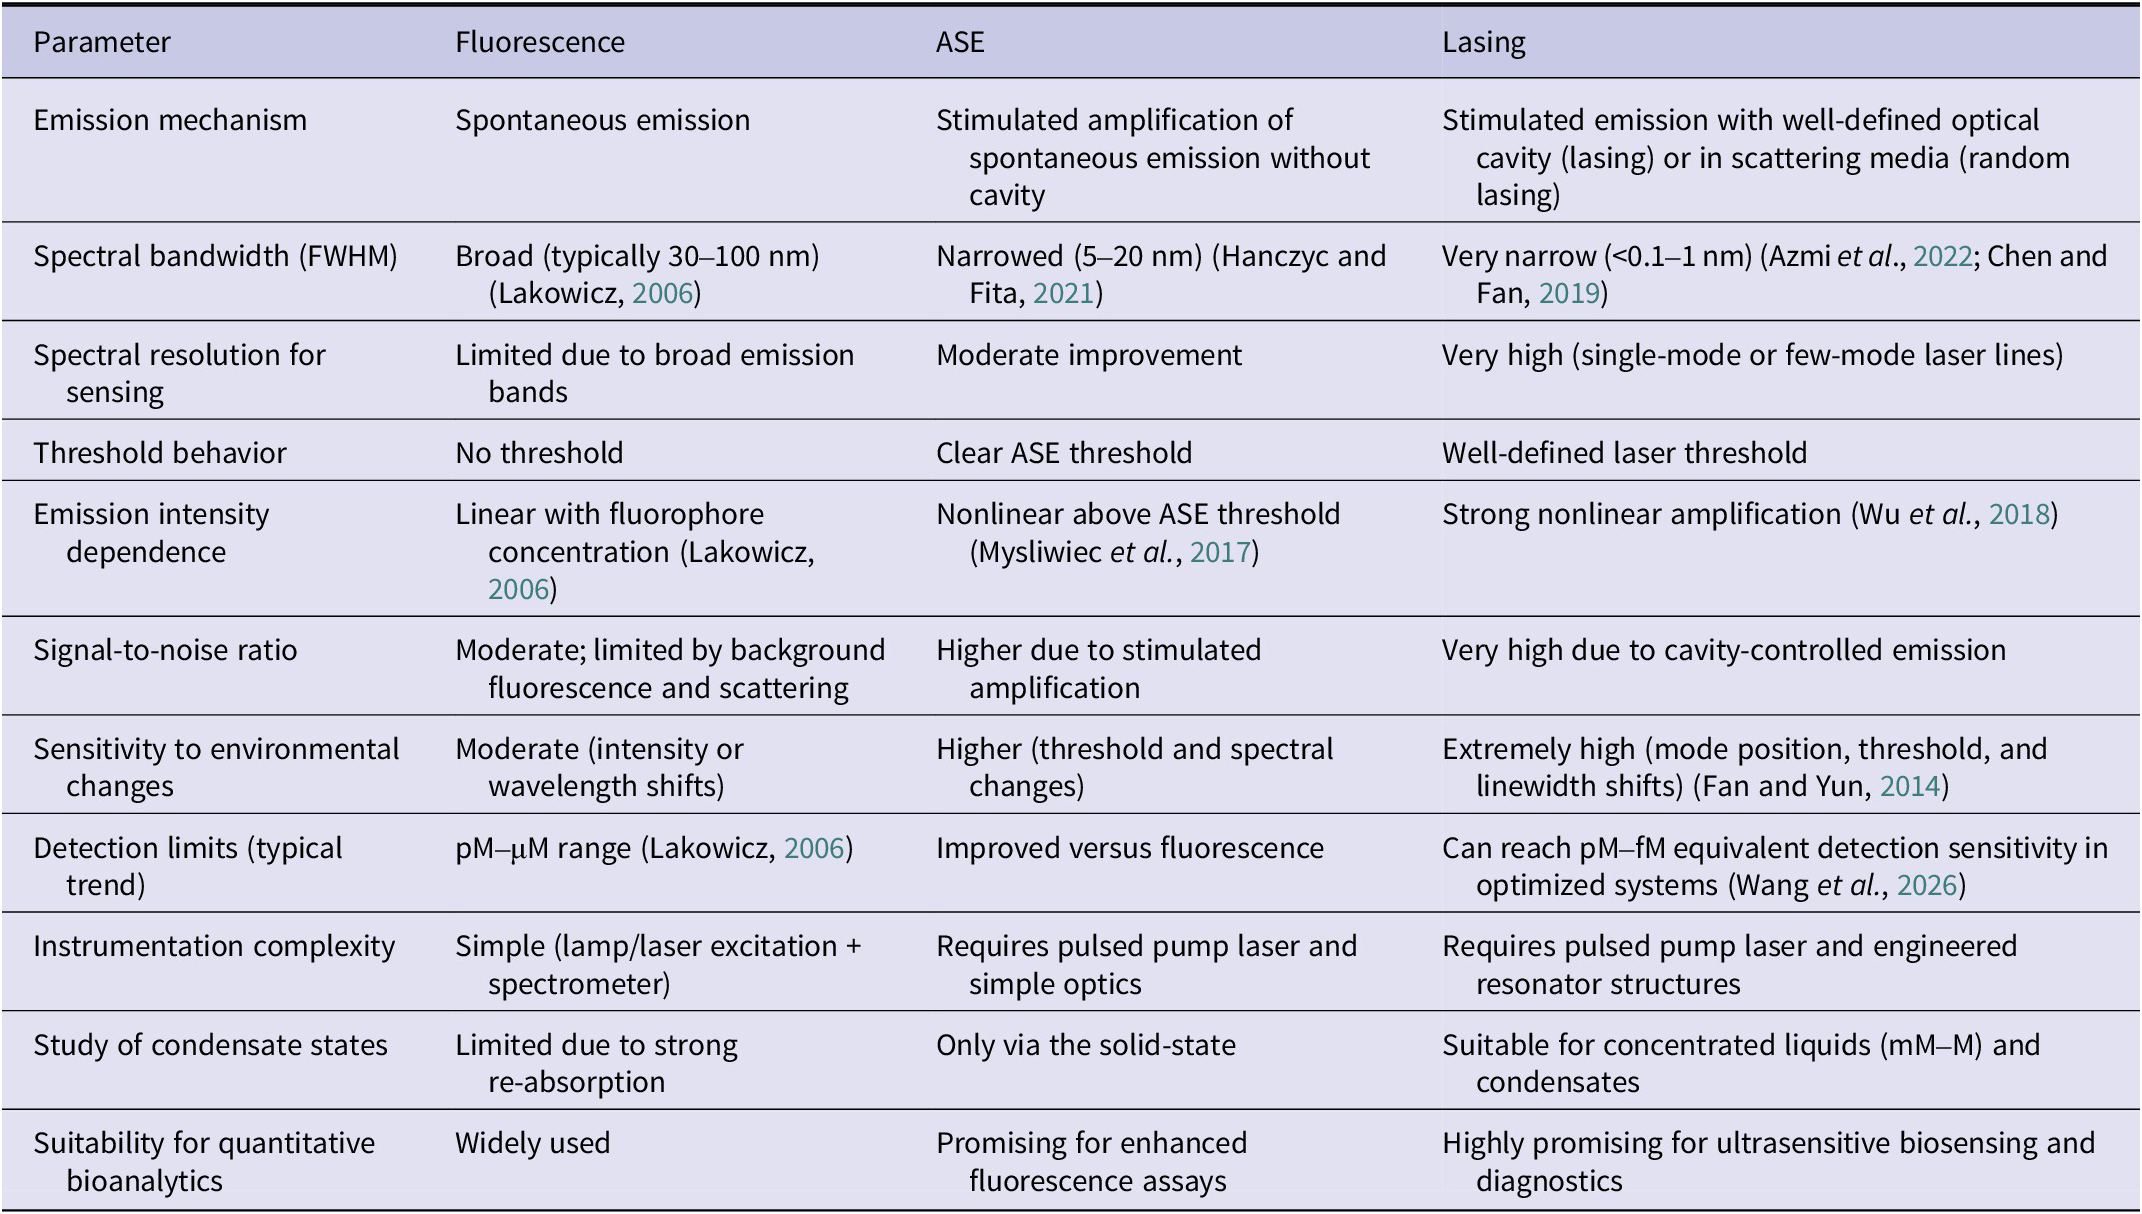
In this review, we use the term ‘lasing spectroscopy’ (LS) to refer to an advanced analytical technique that leverages the unique properties of laser emission to achieve sensitive and highly selective molecular and biochemical analysis (Table 1). At its core, LS exploits stimulated emission phenomena, in which molecules excited by external energy sources emit coherent, monochromatic, and directional light (Scherf et al., Reference Scherf2001; Wu et al., Reference Wu2022; Piedra et al., Reference Piedra2025). The resulting radiation is characterized by a narrow spectral linewidth and high intensity, providing substantial improvements over conventional fluorescence spectroscopy and enabling significant enhancements in sensitivity and resolution (Figure 1(a)) (Fan et al., Reference Fan and Yun2014; Chen et al., Reference Chen2017). Subtle molecular changes such as conformational transitions, binding events, refractive index shifts, or local environmental perturbations can induce nanometer-scale shifts in the lasing wavelength or abrupt intensity changes due to modifications of the cavity resonance or gain profile. Likewise, structural heterogeneities within biological systems and multiple scattering processes in disordered media give rise to speckle-like emission patterns whose spatial and spectral signatures respond exquisitely to microscopic changes in the sample.
Comparison of key parameters of conventional fluorescence measurements and stimulated emission with respect to their performance in bioanalytical sensing
(a) Schematic of spectral narrowing associated with stimulated emission and (b) ASE/lasing threshold measurement: output intensity versus pump fluence showing an exponential rise at the onset of population inversion (Hanczyc and Fita, Reference Hanczyc and Fita2021). Reproduced and adapted with permission, Copyright 2021, American Chemical Society.
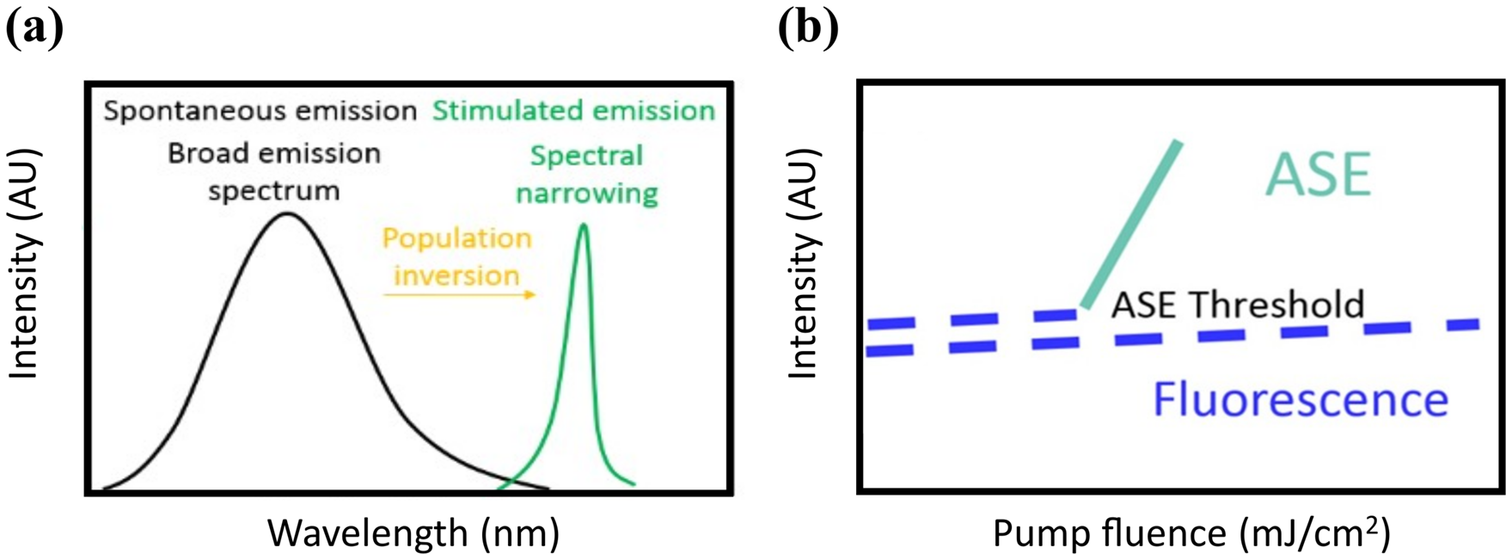
A spectroscopic parameter uniquely accessible in LS is the lasing threshold, the minimum excitation energy (or pump intensity) required to achieve population inversion and initiate stimulated emission (Figure 1b). Physically, the threshold reflects the balance between optical gain and total losses in the system, including absorption, scattering, and cavity outcoupling; lasing occurs only when the gain exceeds these losses (for more details, see the section ‘Optical amplification methodologies’). Because this balance is exquisitely sensitive to molecular concentration, quantum yield, local refractive index, and non-radiative decay pathways, even subtle biochemical interactions can shift the threshold condition. In bioanalytical contexts, monitoring variations in lasing threshold, therefore, provides a highly responsive metric of molecular binding, conformational changes, or environmental perturbations.
Subsequent sections of this review will explore the specific principles and methodologies of LS, and the recent technological innovations that are driving its growing relevance in bioanalytics and biomedicine. The potential of LS refers to the development of fluorophores (Sasaki et al., Reference Sasaki2016; Jiang et al., Reference Jiang2020; Lovell et al., Reference Lovell2024), optical biosensing (Fan et al., Reference Fan2008; Toropov et al., Reference Toropov2021; Javaid et al., Reference Javaid2024; Mostufa et al., Reference Mostufa2024), and application of lasers in bioanalytics (Yeung, Reference Yeung1988; Chen and Fan, Reference Chen and Fan2019). In this review, we focus on the fundamental physical principles underlying LS across different states of matter, including solid-state systems and liquids, together with the diverse methodological strategies developed to enhance its sensitivity and analytical performance. Ultimately, we assess the current methodological toolkit of LS with respect to its transformative potential and prospective impact in bioanalytical and biomedical applications.
Dyes for lasing spectroscopy
Organic dyes are essential for fluorescence spectroscopy of biomolecules (Lakowicz, Reference Lakowicz2006). They also serve as gain media in lasing for studying biomolecules (Pan et al., Reference Pan2021). However, only a small subset of dyes is usable because most dyes relax through pathways that do not support stimulated emission. The requirement of a high fluorescence quantum yield of ϕ > 0.5 (high radiative efficiency) is substantial for effective competition of stimulated emission with internal conversion and intersystem crossing. Rapid radiative decay assures short singlet-state lifetimes (τₛ ≈ 1–4 ns), minimizing excited-state losses and maintaining the population-inversion threshold within practical pump fluences. The extinction coefficient of the dye should vary between 12,000 M−1 cm−1 and 200 000 M−1 cm−1, ensuring appropriate absorption of photoexciting light (Lovell et al., Reference Lovell2024). The intersystem-crossing yield must remain low (typically < 10%) to avoid triplet-state absorption and photochemical degradation, both of which introduce additional loss channels. Photostability under high photon flux: the molecule must withstand pump intensities of about 106 Wcm−2 without undergoing irreversible photobleaching, because cavity feedback concentrates both the optical field and the local excitation density.
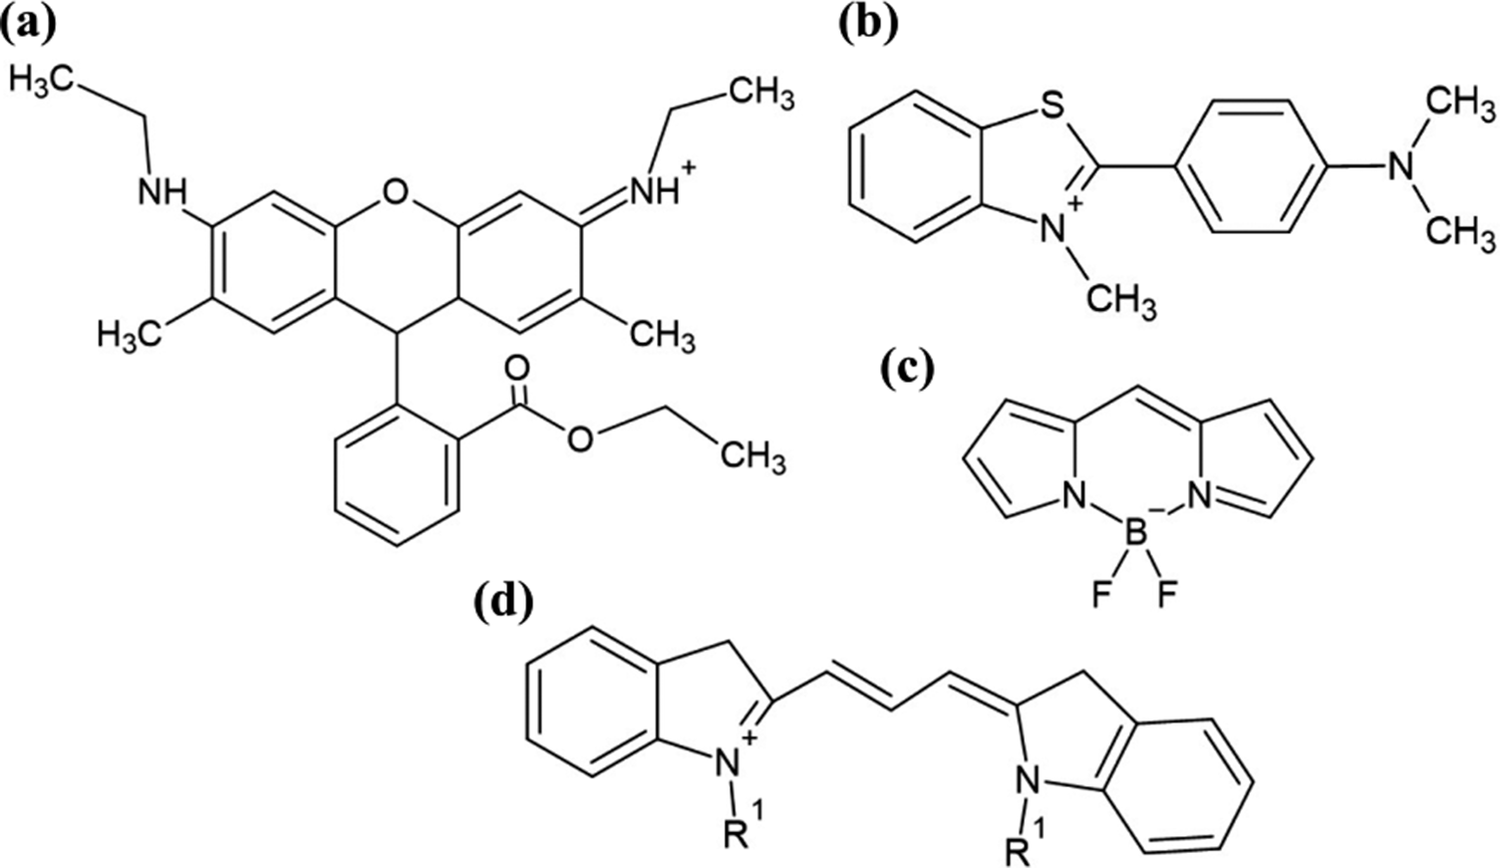
Even when a chromophore fulfills the photophysical requirements for laser action, its limited characterization in biological media can render it unsuitable for bioanalytical applications. A laser dye intended for bioanalytical applications must be water-soluble, display thoroughly documented interactions with biomolecules, and avoid disrupting biomolecular architectures. Currently, the number of biocompatible laser dyes is limited to a set of water-soluble xanthene dyes (Humar and Yun, Reference Humar and Yun2015; Mendicuti et al., Reference Mendicuti2024; Zhang et al., Reference Zhang2025), a few boron-dipyrromethene (BODIPY) derivatives (Fang et al., Reference Fang2024), certain well-studied cyanines (Aas et al., Reference Aas2014), and molecular rotors such as Thioflavin T (ThT) (Rusakov et al., Reference Rusakov2023) (Figure 2). Thus, the set of chromophores suitable for lasing-based bioanalytics is much smaller than the extensive catalog available for conventional fluorescence assays. The synthesis of novel fluorophores, facilitating laser action, is a crucial effort performed in the frameworks of organic and supramolecular chemistry (Jiang et al., Reference Jiang2020; Schade et al., Reference Schade2020; Lei et al., Reference Lei2024). However, when progressing from molecular synthesis toward biomedical implementation, each newly developed dye must undergo thorough biocompatibility and photophysical characterization, and it should demonstrate clear advantages over already well-established fluorophores. An optimal lasing dye for bioanalytical applications should exhibit absorption and emission in the red to near-infrared spectral region, thereby minimizing photodamage, reducing strong blue-light scattering, and limiting interference from water absorption (Lovell et al., Reference Lovell2024). Furthermore, a sufficiently large separation between the absorption and emission bands (i.e., a large Stokes shift) is essential to suppress reabsorption losses and ensure efficient lasing performance (Liu et al., Reference Liu2024).
Chemical structures of representative lasing dyes used in bioanalytical applications: (a) rhodamine 6G, (b) thioflavin T, (c) BODIPY, and (d) cyanines.
Fundamentals of lasing spectroscopy in solid-state films and liquids
When molecules absorb light, some of their electrons transition from the ground state (S0) to higher energy levels (S1, S2, Sn, etc.), placing the system in an excited state (Figure 3(a)) (Lakowicz, Reference Lakowicz2006). The relaxation of absorbed energy occurs through radiative or non-radiative pathways. In the case of the radiative pathway, the energy dissipation can occur through the transition back from S1 to S0 (fluorescence) or from the triplet state (T1) to S0 (phosphorescence). The common non-radiative pathways are internal conversion (relaxation from a higher excited state to S1), molecular vibration, bond rotation, or intersystem crossing (S1 to Tn). Optical amplification is only possible after external pumping establishes a population inversion of radiative relaxation, meaning that the number of particles in the S1 exceeds that in the S0. This allows stimulated emission to overpower absorption and losses (Svelto and Hanna, Reference Svelto and Hanna2010). The emitted photons then propagate in the same direction and share the same polarization and phase (Hirlimann, Reference Hirlimann and Rullière2005).
(a) Jablonski energy-level diagram illustrating relaxation via the fluorescence pathway and the ASE/lasing pathway. (b) Schematic of the ASE experiment in which the emission is collected perpendicular to the excitation beam. (c) Fabry–Pérot cavity configuration with a dye solution confined between two reflective mirrors acting as the gain medium, with emission collected parallel to the excitation beam. (d) Spectral comparison for the dye gain medium: steady-state absorption (green, dashed) and photoluminescence (black, dotted) versus amplified spontaneous emission (ASE) traces obtained from solid films at increasing pump fluence (light gray → red) and the laser output recorded in a Fabry–Pérot cavity (dark blue, solid). Left inset: optical micrograph of a representative drop-cast dye film used for ASE measurements. Right inset: CCD image of the bright lasing spot that appears inside the cavity once the pump crosses threshold (Rusakov et al., Reference Rusakov2023). Reproduced and adapted with permission, Copyright 2023, American Chemical Society.
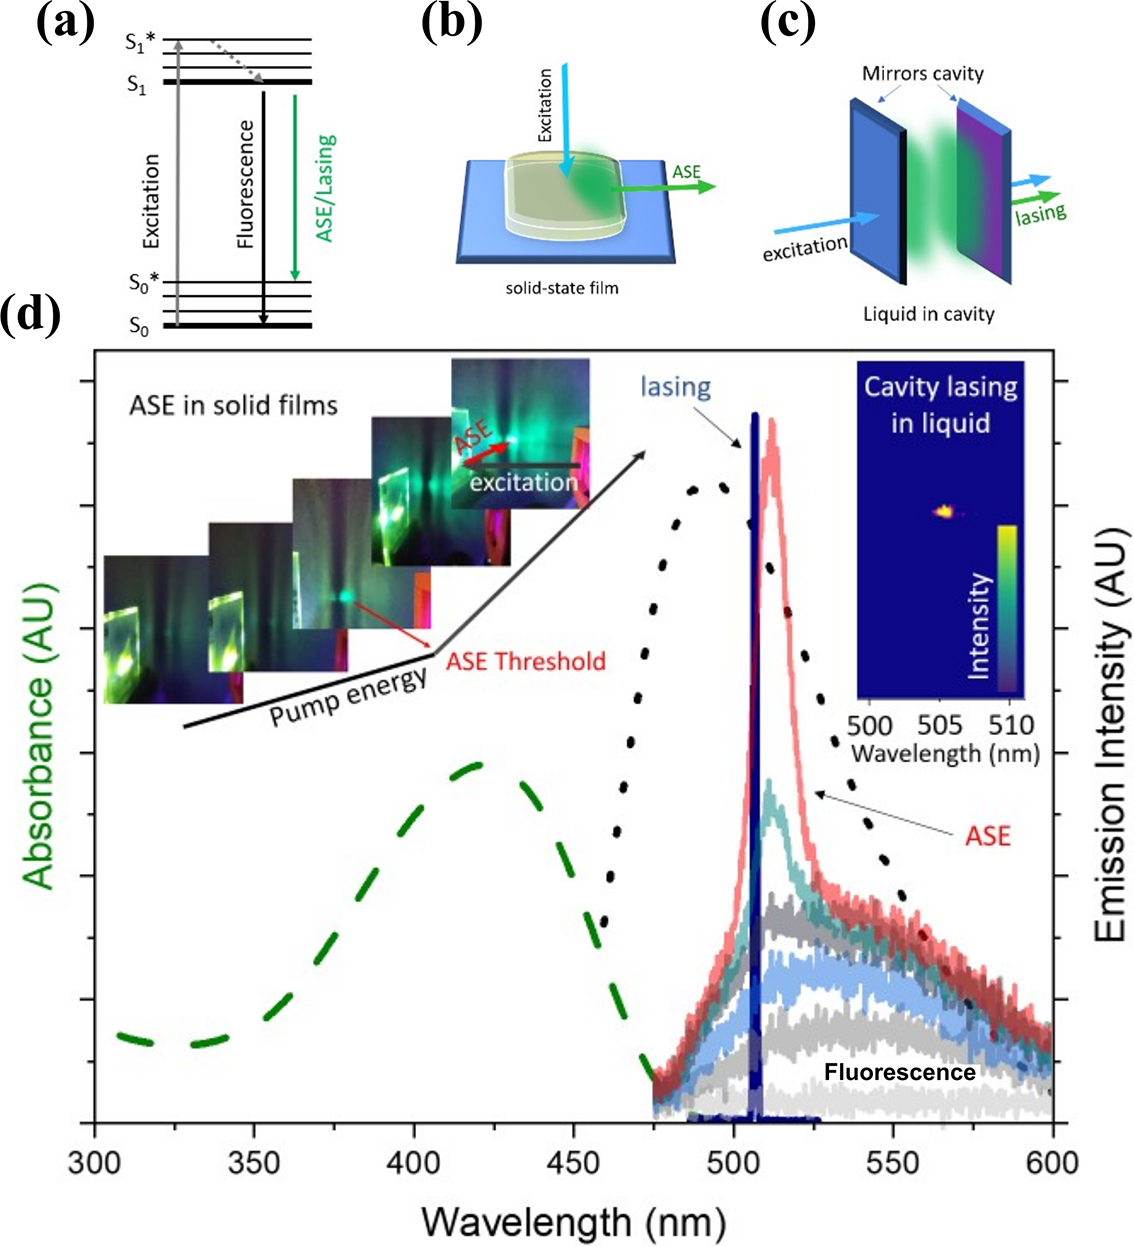
Optical gain can be achieved either with or without resonant feedback (laser oscillation) (Figure 3b, c). With resonant feedback, it takes the form of laser oscillation; without it, it takes the form of amplified spontaneous emission (ASE) (Figure 3(d)). In the absence of a cavity, ASE occurs when stimulated emission along the propagation path gradually exceeds spontaneous relaxation. This behavior is particularly evident in solid-state gain media. Figure 3(d) illustrates this transition: as the pump fluence increases, the emission intensity grows linearly, and at a well-defined threshold, the spectrum markedly narrows in linewidth and intensity grows exponentially.
The optical amplification can be additionally enhanced by optical feedback, which is typically realized by a pair of mirrors oriented on opposite sides of the gain medium (Figure 3(c)). This geometry forces light to propagate back and forth. This is called a laser resonator or laser cavity. Often one of the mirrors is nearly perfectly reflective (R~100 %), while the other allows some light to escape from the resonator, forming a coherent, highly directional laser beam (Hirlimann, Reference Hirlimann and Rullière2005). The orientation of the mirrors can be configured in many ways, depending on the specific purpose. The most basic mirror configuration is the Fabry–Pérot (FP) cavity, which has two plane-parallel mirrors that lie a certain distance apart (Duarte, Reference Duarte2015).
In the process, the gain medium is continually excited through nano- or femtosecond pulses, discharge excitation, microwave excitation, etc. (Hirlimann, Reference Hirlimann and Rullière2005). The pumping efficacy can be described by two parameters. Firstly, power gain ( $ G=\frac{P_{output}}{P_{input}} $
) refers to how well the gain medium amplifies photons by stimulated emission. It is often defined as the ratio of the laser’s output power Pout to the pumping source’s input power Pin (Siegman, Reference Siegman1986). Secondly, the optical gain coefficient represents the amount of amplified light per unit length, as it propagates through the excited gain medium (Vellaichamy et al., Reference Vellaichamy2023). Additionally, optical feedback provided by an optical resonator or cavity is essential for sustaining and amplifying stimulated emission. The resonator selectively reinforces photons that resonate at specific frequencies, determined by the cavity’s geometric and optical properties. This resonant feedback creates a coherent, monochromatic, and highly directional laser beam. The performance of a laser system, including its spectral purity, stability, and Pout, depends on various factors such as the type of lasing material, cavity configuration, pump source, and operating conditions. Understanding these principles is essential for the development and optimization of laser systems tailored for specific bioanalytical and biomedical applications.
$ G=\frac{P_{output}}{P_{input}} $
) refers to how well the gain medium amplifies photons by stimulated emission. It is often defined as the ratio of the laser’s output power Pout to the pumping source’s input power Pin (Siegman, Reference Siegman1986). Secondly, the optical gain coefficient represents the amount of amplified light per unit length, as it propagates through the excited gain medium (Vellaichamy et al., Reference Vellaichamy2023). Additionally, optical feedback provided by an optical resonator or cavity is essential for sustaining and amplifying stimulated emission. The resonator selectively reinforces photons that resonate at specific frequencies, determined by the cavity’s geometric and optical properties. This resonant feedback creates a coherent, monochromatic, and highly directional laser beam. The performance of a laser system, including its spectral purity, stability, and Pout, depends on various factors such as the type of lasing material, cavity configuration, pump source, and operating conditions. Understanding these principles is essential for the development and optimization of laser systems tailored for specific bioanalytical and biomedical applications.
Scope and objectives of the review
This review primarily aims to provide a comprehensive examination of LS, with particular emphasis on its application in bioanalytics within a medicinal context. The objective is to systematically present the current state of the art in LS methodologies, emerging technological advancements, and their practical implications in diverse bioanalytical scenarios. Given the dynamic evolution of the field, the review also outlines potential future directions and translational opportunities.
The structure of this review is organized according to the increasing level of methodological complexity of the respective lasing configurations. The review is organized starting with solid-state configurations, which represent the conceptually and experimentally simplest platforms for observing ASE and random lasing (RL) phenomena. In these systems, the gain medium is typically embedded in a solid matrix, offering high mechanical stability, straightforward optical alignment, and reduced degrees of freedom compared to fluidic or biological environments. Such configurations provide the most accessible route to studying ASE thresholds, emission narrowing, and gain dynamics, thereby serving as a foundational reference point for more complex systems.
Subsequent sections introduce progressively more advanced optical strategies, including the implementation of distributed feedback (DFB) grating structures, microcavities, and other resonator engineering approaches. These architectures increase structural and fabrication complexity but enable enhanced optical confinement, reduced lasing thresholds, improved spectral selectivity, and stronger emission intensities. The introduction of periodic grating patterns and resonant feedback mechanisms represents a key technological step toward controlled, efficient, and miniaturized lasing platforms.
Across all levels of complexity, a unifying objective underlies these advancements: to amplify and stabilize the lasing signal in order to maximize sensitivity, improve signal-to-noise ratio, and enable reliable detection in biologically relevant environments. As configurations evolve from simple solid-state systems to more sophisticated resonant systems, the methodological complexity increases in parallel with analytical performance.
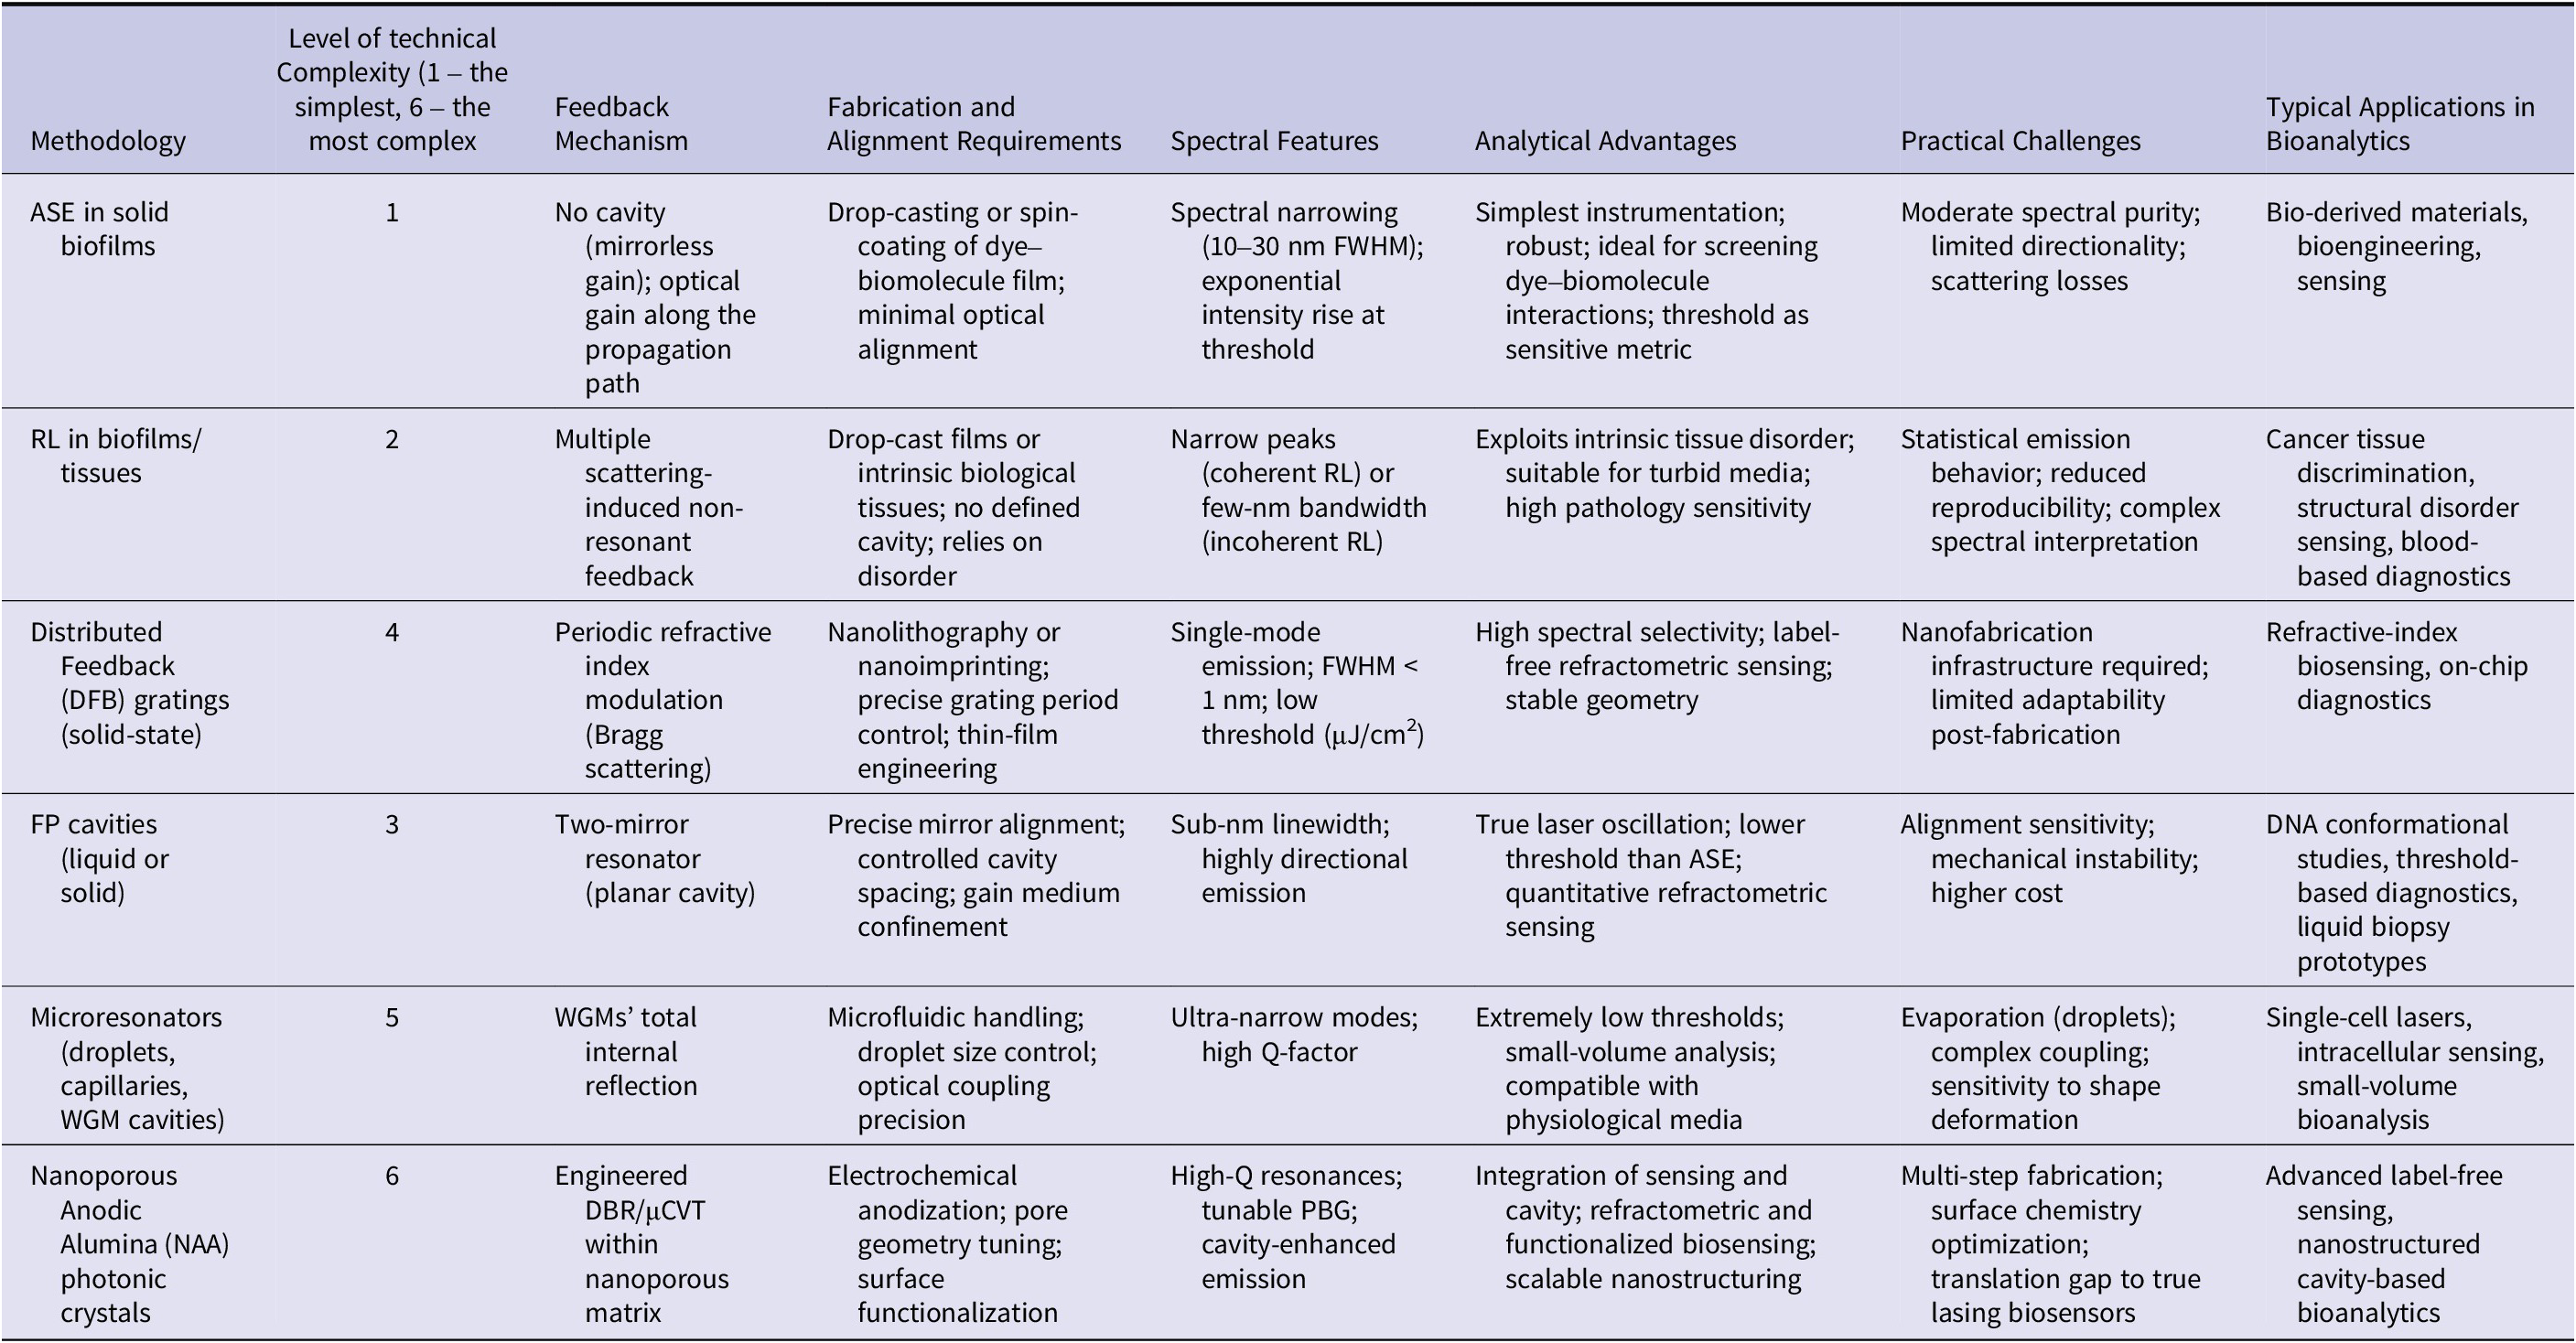
By structuring the review according to this graded complexity framework (Table 2), we aim to provide readers with a clear conceptual pathway – from fundamental ASE effects in simplified optical systems to advanced, application-ready lasing architectures for studying biomolecules in liquids, thereby facilitating both foundational understanding and critical evaluation of current and emerging LS methodologies.
Graded complexity of lasing spectroscopy methodologies (from simplest to most complex)
Optical amplification methodologies
Light enhancement in optically pumped mirrorless solid-state matter
Light enhancement in solid-state systems without resonators relies primarily on the intrinsic optical gain and scattering effects of the materials. Optical amplification is typically studied by dispersing an organic laser dye and the target biomolecule into a thin solid film. The high chromophore density achieved in the solid state enables population inversion with pulsed laser pumping, allowing ASE/RL. The technical simplicity makes this approach particularly attractive for studying biomaterials for device-oriented demonstration concepts (Hung et al., Reference Hung2012; Sznitko et al., Reference Sznitko2015; Umar et al., Reference Umar2019; Shi et al., Reference Shi2022), as well as for evaluating whether new water-soluble dyes are suitable for LS in bioanalytics.
Amplified spontaneous emission in solid biofilms
The most basic form of optical amplification that does not require an external resonator is ASE, which was first described by Dicke (Reference Dicke1954). ASE produces incoherent or partially coherent, broadband radiation with moderate directionality; thus, the output spectrum remains relatively broad, typically 10–30 nm FWHM (Feng et al., Reference Feng2023). This cavity-free geometry makes detecting the onset of optical gain straightforward. Once the pump fluence exceeds the ASE threshold, the emission intensity rises exponentially, and the bandwidth narrows abruptly – a transition clearly visible in (Figure 3(d)).
Cavallini et al. (Cavallini et al., Reference Cavallini2015) report a ‘from-diet’ method for producing optically active silk. In this method, Bombyx mori larvae ingest laser dyes Stilbene 420 or rhodamine B (RhoB) that are subsequently integrated into the fibroin during cocoon formation, eliminating the water- and solvent-intensive post-dyeing steps required by conventional protocols (Figure 4(a)). Stilbene 420 fails to show ASE, but RhoB-fed silk retains the dye’s high quantum yield. In 12 μm drop-cast films, the silk supports ASE: the emission bandwidth contracts from ≈45 nm to ≈20 nm, confirming efficient optical amplification. Importantly, Sodium Dodecyl Sulfate – Polyacrylamide Gel Electrophoresis (SDS–PAGE) and Fourier Transform Infrared Spectroscopy (FT–IR) analyses indicate that dye ingestion does not disrupt the integrity of the fibroin’s heavy chains or its β-sheet structure. This preserves the mechanical robustness necessary for device integration (Figure 4(b)). Thus, the work establishes naturally functionalized silk as a biodegradable and biocompatible gain medium, paving the way for low-cost, large-area bio-derived lasers and fluorescence-based lab-on-a-chip platforms.
(a) Amplified spontaneous emission (ASE) spectrum recorded from silk fibroin extracted directly from the middle glands of Bombyx mori larvae that had been fed rhodamine B (RhoB), Nile Blue (NB), or Stilbene 420 (St 420). Only the RhoB-functionalized silk reaches population inversion, exhibiting spectral narrowing and intensity rise (Cavallini et al., Reference Cavallini2015). Reproduced and adapted with permission, Copyright 2015, Elsevier. (b) Scanning-electron micrograph of a silk inverse-opal whereby periodic air voids were promoting light amplification (Umar et al., Reference Umar2019). Reproduced and adapted with permission, Copyright 2019 Nature Publishing Group. (c) Schematic of a stripe-pump arrangement for ASE detection (left) and the resulting threshold fluences for ThT bound to four DNA topologies: (i) canonical duplex, (ii) single-stranded DNA, (iii) duplex with two-base mismatches, and (iv) G-quadruplex (Hanczyc et al., Reference Hanczyc2021). Reproduced and adapted with permission, Copyright 2021, American Chemical Society.
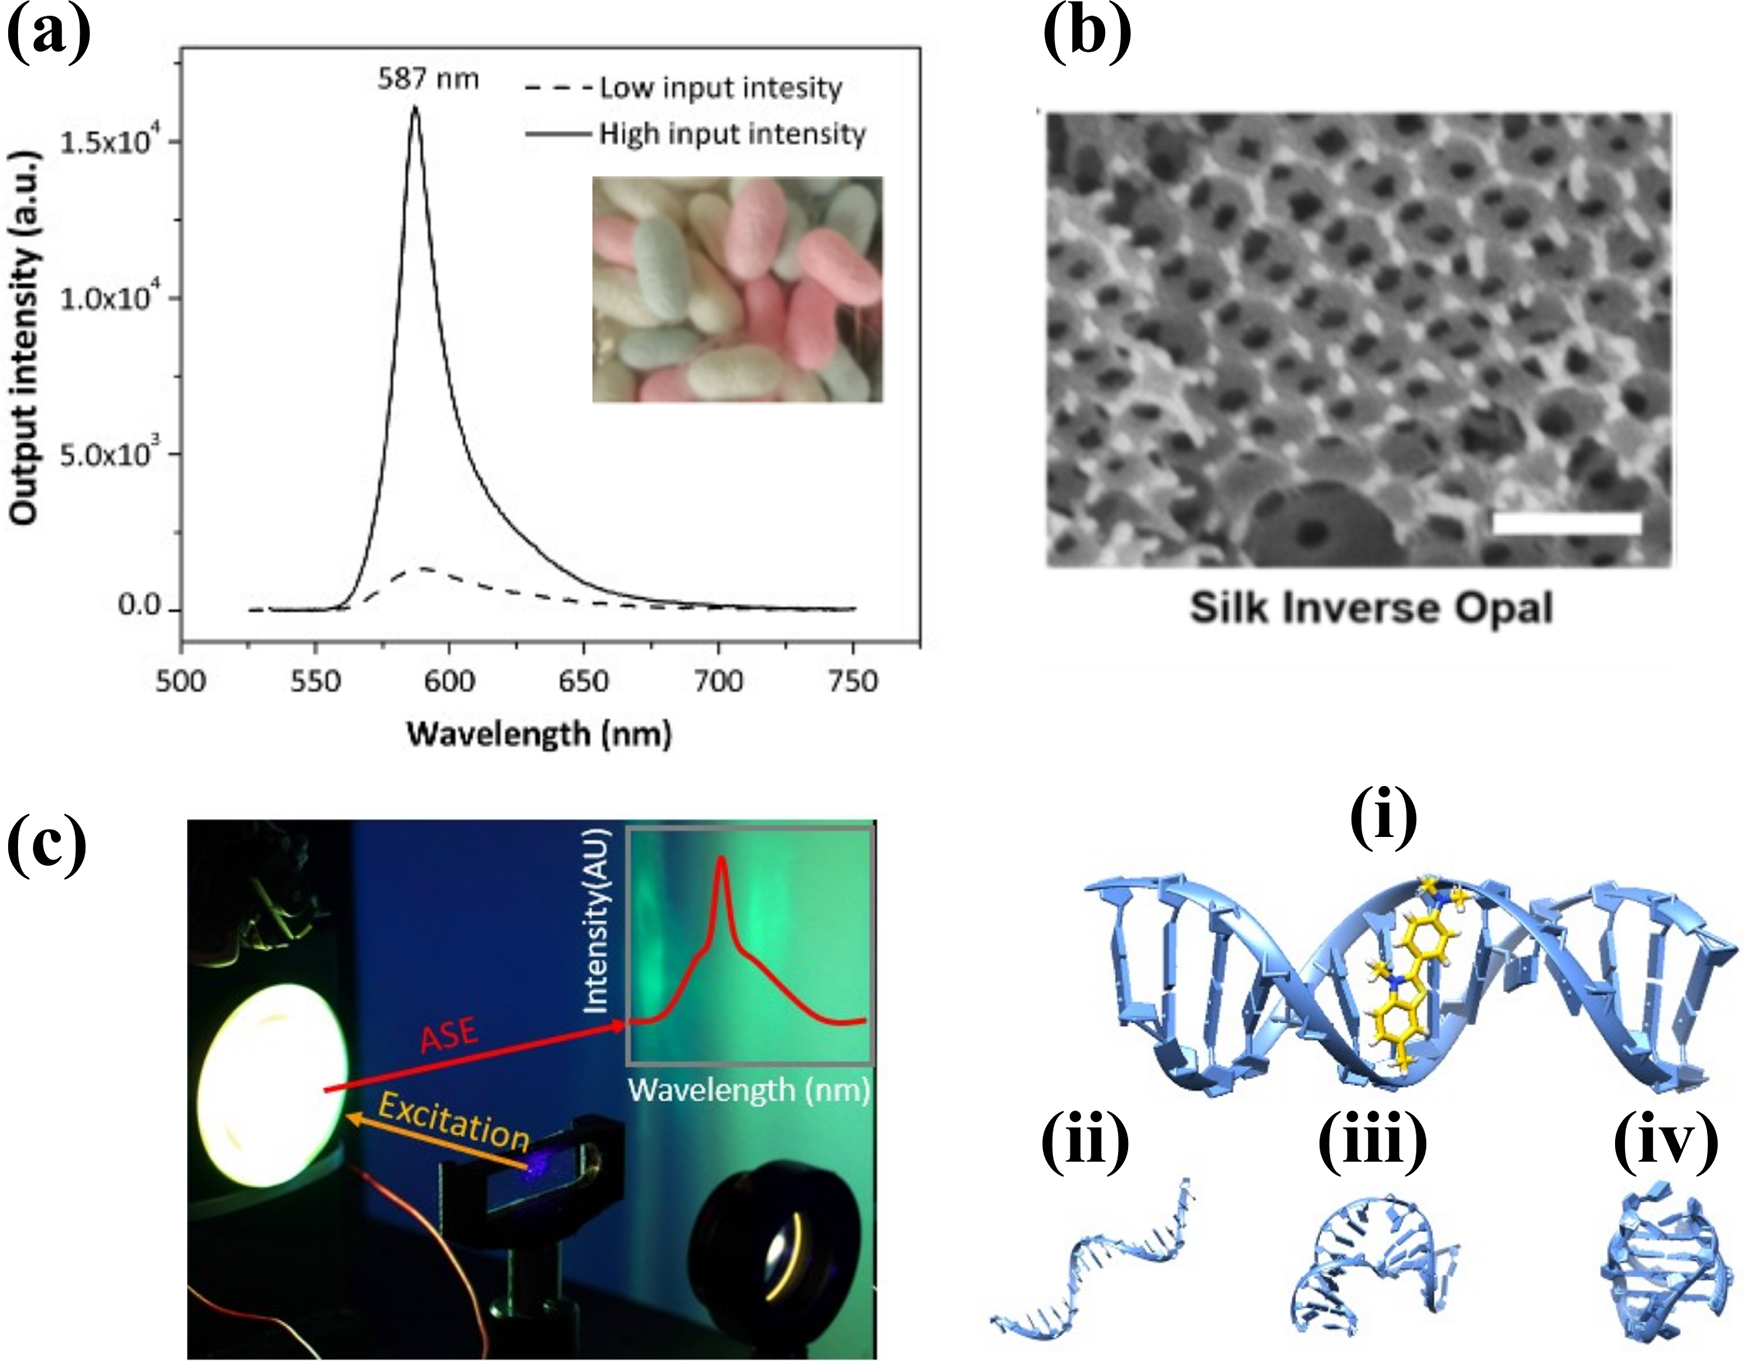
Umar et al. (Reference Umar2019) demonstrated another advancement by embedding sodium-fluorescein into a silk inverse-opal matrix, achieving ASE that was used to enhance chemical sensing of HCl acid. This acid quenched the ASE intensity 600-fold faster than fluorescence decay in an unstructured film, illustrating the analytical leverage provided by solid-state ASE in silk inverse-opal system. Rau et al. (Reference Rau2012) demonstrate that pure DNA can serve as a host for optical gain by embedding rhodamine 6G (Rho6G) in thin drop-cast films.
Hanczyc et al. (Reference Hanczyc2021) developed the ASE concept using a molecular rotor thioflavin T (ThT), which interacts specifically with various DNA architectures. They demonstrate that these binding modes dictate ASE parameters (thresholds and wavelength tunability). The authors exploit this sensitivity to distinguish between cavity-containing duplexes and G-quadruplexes, positioning ThT probes to detect disease-relevant DNA motifs (Figure 4(c, d)).
Hanczyc et al. (Reference Hanczyc2015) show that amyloid fibrils are not only pathological hallmarks but also versatile nanoscaffolds that facilitate the self-assembly of Rho6G into gain-active aggregates with broadband, low-threshold optical amplification. Lysozyme and insulin fibrils predominantly template dye J- and imperfect H-aggregates, respectively, producing distinct thin-film morphologies (tile-like versus granular). The study establishes amyloid fibrils as tunable, bio-derived ASE hosts whose intrinsic polymorphism can be read out optically (Hanczyc and Sznitko, Reference Hanczyc and Sznitko2017).
Random lasing in biofilms
In 1966, Ambartsumyan, Basov, Kryukov, and Letokhov proposed a laser in which the resonator was replaced by the ‘scatterer-mirror’ (Ambartsumyan et al., Reference Ambartsumyan1966a; Ambartsumyan et al., Reference Ambartsumyan1966b). Since the cavity was removed, it is called a laser with non-resonant feedback. RL was observed in a dispersed powder containing irregularly shaped particles (Varsanyi, Reference Varsanyi1971; Fork et al., Reference Fork1974; Nikitenko et al., Reference Nikitenko1981; Markushev et al., Reference Markushev1986; Markushev et al., Reference Markushev1986). A direct demonstration of laser action in a colloidal suspension of rhodamine 640 perchlorate dye in methanol containing Al2O3-coated rutile particles (Lawandy et al., Reference Lawandy1994) triggered controversy and scientific discussion about the origin of optical amplification. In the article entitled ‘Random laser?’ (Wiersma et al., Reference Wiersma1995) the authors suggest an alternative explanation where ASE is responsible for optical amplification and the ASE signal is scattered by particles to a detector. However, it has been proven that scattering particles are necessary for generating feedback in a suspension. This excludes ASE as the optical amplification mechanism and establishes the term random laser for lasers with non-resonant feedback (Cao, Reference Cao2003).
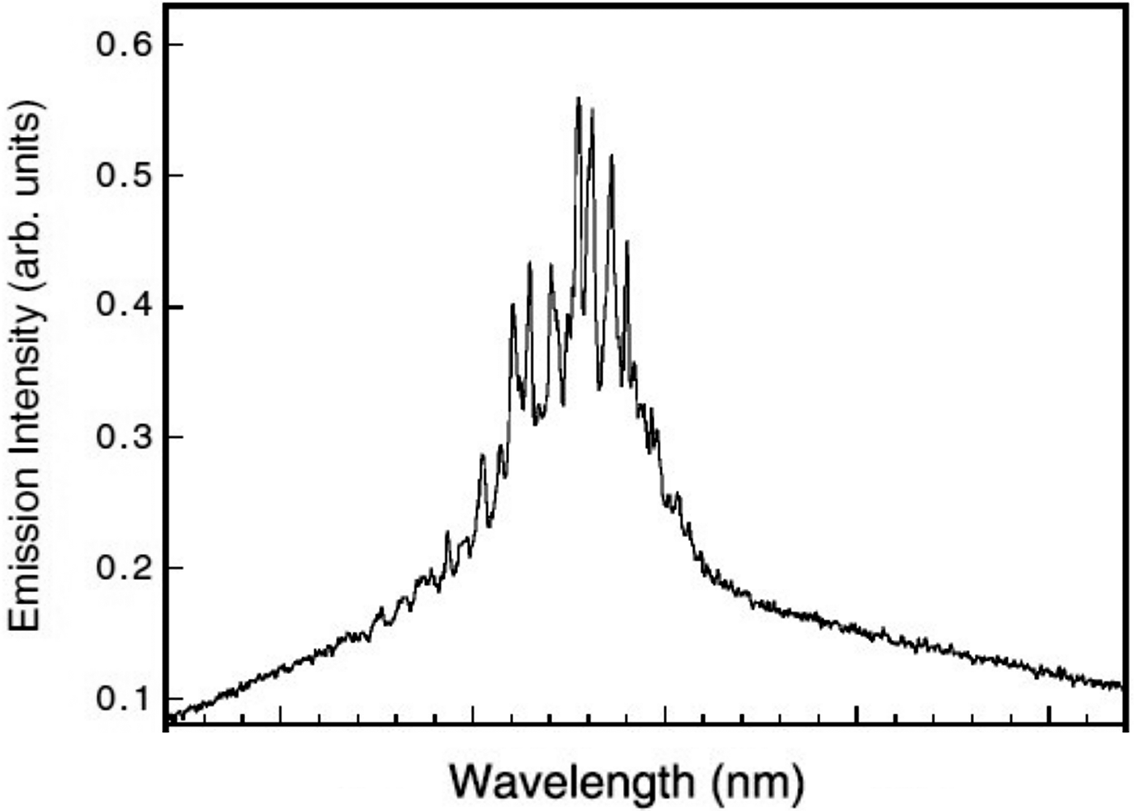
RLs are randomly distributed in frequency (Figure 5). As with ASE and classical lasing action, RL appears when the energy threshold is exceeded (Cao, Reference Cao2003; Noginov et al., Reference Noginov2004). Increasing the pumping energy further causes the emission spectrum to narrow toward the center of the lasing peak (Zhang et al., Reference Zhang1995; Machado et al., Reference Machado2022). Moreover, the spatial coherence of RLs is much smaller than that of conventional laser light sources (Redding et al., Reference Redding2012). As Wiersma has memorably observed, ‘What do lotus flowers have in common with human bones, liquid crystals with colloidal suspensions, and white beetles with the beautiful stones of the Taj Mahal? The answer is that they all feature disordered structures that strongly scatter light, in which light waves entering these materials are scattered several times before exiting in random directions’. Such structural disorder, ubiquitous in biology, can be transformed from a hindrance into a diagnostic asset by harnessing the random lasing phenomenon, in which the same multiple-scattering events provide the optical feedback necessary for laser action. In living systems, deviations from native order (e.g., DNA–membrane interactions (Galisteo-López et al., Reference Galisteo-López2014), protein misfolding (de Armas-Rillo et al., Reference de Armas-Rillo2021) or incipient cellular dysplasia (Polson and Vardeny, Reference Polson and Vardeny2004) often modify the local scattering landscape. The resulting changes in random-laser threshold, emission bandwidth, or speckle statistics are sensitive markers of pathology. Because RL uses a sample’s intrinsic scatterers as its cavity, it is well-suited to turbid tissues and other optically intractable media where conventional cavity-based lasers fail. Exploiting this built-in feedback, therefore, yields heightened sensitivity and spatial specificity in spectroscopic readouts.
Random lasing (RL) depends on the gain and scattering medium. RL is characterized by multiple narrow emission peaks (spikes) with sub-nanometer linewidth appearing from the emission/ASE spectrum (Cao, Reference Cao2003). Reproduced and adapted with permission, Copyright 2003, IOP Publishing Ltd.
Lin et al. (Reference Lin2023) transformed a drop-cast silk-fibroin film into a fully biocompatible RL by coating it with highly emissive donor-acceptor-donor chromophores and embedding silver nanoprisms that function as plasmonic scatterers. This hybrid biofilm supports ASE bands spanning blue-to-green wavelengths. However, when side-pumped at 355 nm the Ag-enhanced scattering and localized-surface-plasmon resonance provide the coherent feedback needed for RL. Multiple sharp spikes emerge atop the broadband dye emission, and the threshold is reduced by about 35% relative to nanoparticle-free films. Compared to the speckle image produced by a Q-switched laser shown in Figure 6(a), the plasmonic RL output, due to its intrinsically low spatial coherence, produces speckle-suppressed imaging (contrast 0.024). This illustrates how structurally simple, biodegradable biofilms can be engineered into low-threshold, speckle-free light sources for sensing and biomedical photonics.
(a) Schematic illustration of the random lasing from a dye-silk fibroin/AgNP film and the recurrent light scattering that forms a closed loop and speckle image resolution comparison between random lasing (RL) from dye-SF films with embedded AgNP (left-hand side) and a Q-switched laser (Lin et al., Reference Lin2023). Reproduced and adapted with permission, Copyright 2023, Royal Chemical Society. (b) RL in spin-coated dye-doped DNA (Camposeo et al., Reference Camposeo2014), (c) The lasing spectra of bovine serum albumin within polystyrene beads (10 wt%) creating microlasers with diameters of 29, 48, 78, and 119 μm, respectively. Below 50 μm, RL speckles are clearly seen (Nguyen et al., Reference Nguyen2025), reproduced and adapted with permission, Copyright 2025, IOP Publishing Ltd. (d) Random laser emission spectra of human colon tissues infiltrated with a concentrated laser dye, namely, R6G. Two typical random laser emission spectra from a healthy, grossly uninvolved tissue (blue), of which a microscopic image is shown in the right top (d). The narrow spectral lines are coherent laser emission modes. The inset shows schematically closed random laser resonators formed due to scatterers in the gain medium. The bottom panel in (d) is the same, but for a malignant colon tissue (red). There are more lines in the laser emission spectra in malignant tumors because of more resonators in the tumor; these are caused by the excess disorder (Polson and Vardeny, Reference Polson and Vardeny2004). Reproduced and adapted with permission, Copyright 2004, AIP Publishing Group.
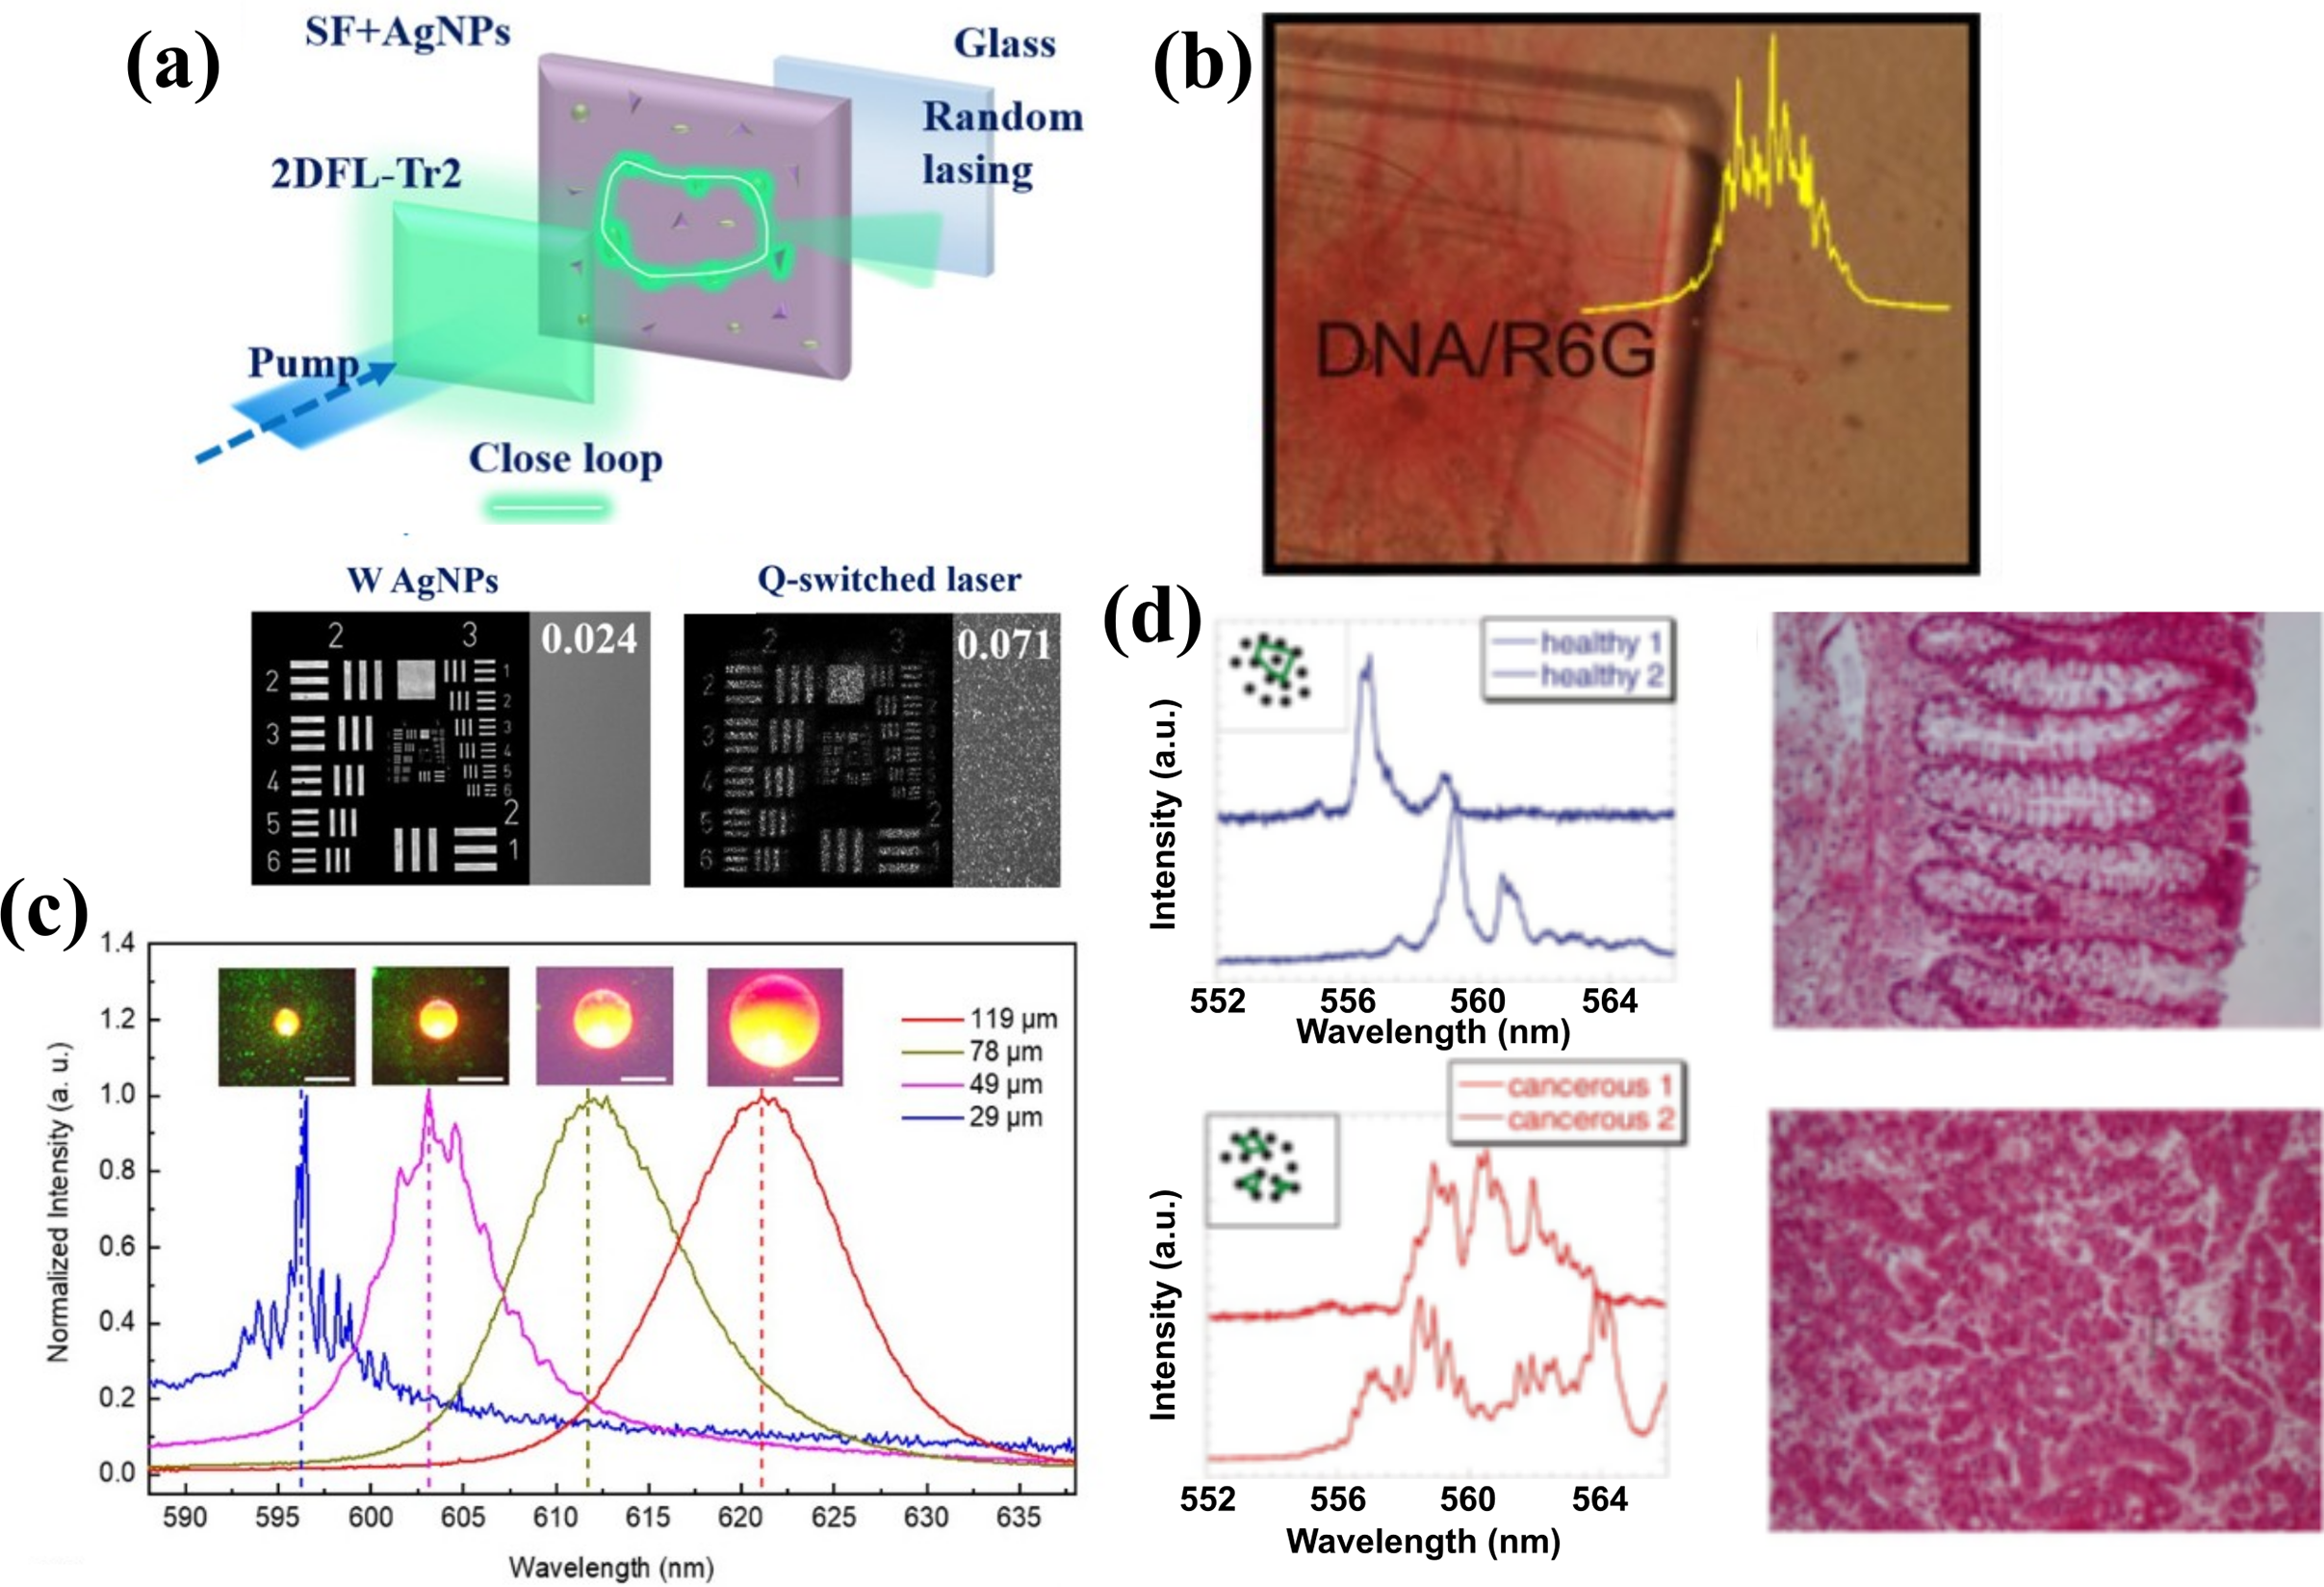
Camposeo et al. (Reference Camposeo2014) convert pure, water-processable DNA into a biodegradable RL film by doping it with Rho6G and simply drop-casting the mixture onto quartz (Figure 6(b)). Above a certain pump fluence, the broadband fluorescence narrows into a band only a few nanometers wide, dotted with spikes less than 0.3 nm. Fourier analysis attributes this feedback to light loops ranging from 10 to 20 μm, which are formed by intrinsic refractive-index fluctuations in the biopolymer matrix. These are definitive signatures of coherent RL. Since the non-patterned DNA film already provides both gain and multiple scattering, resonator fabrication is unnecessary.
Nguyen et al. (Reference Nguyen2025) show the critical role of microsphere diameter in governing coherent RL from the RhoB-doped BSA matrix (Figure 6(c)). Below a diameter of 50 μm, the emission shows punctuated sub-0.3 nm spikes, which are the fingerprint of RL. The authors achieve size-selectable bio-derived microlasers by leveraging dye–protein interactions to immobilize the fluorophore and tune scatterer density through a single dehydration step.
Polson and Vardeny (Reference Polson and Vardeny2004) provided one of the first demonstrations that fully biological matrices can sustain RL (Figure 6(d)). In their study, human tissues were soaked in concentrated Rho6G, and the multiple scattering of the tissue’s intrinsic refractive-index created the necessary feedback for laser action. Malignant samples display significantly more laser lines and a broader distribution of resonator lengths than adjacent healthy tissue, enabling discrimination using RL.
Advanced engineering in solid-state for applying lasing in bioanalytics
Building on the fundamentals of ASE and RL, advanced solid-state engineering strategies are increasingly transforming lasing from a proof-of-concept phenomenon into a reliable analytical tool. A particularly important approach involves integrating organic solid-state dyes with periodic nanostructures. These structures allow controlled optical feedback, improved spectral selectivity, and reduced lasing thresholds.
The concept of controlling light propagation in periodic structures was introduced by Eli Yablonovitch and Sajeev John in 1987 (Yablonovitch, Reference Yablonovitch1987). In such structures, light can be effectively confined, providing optical feedback without the need for conventional mirrors. This mechanism is associated with Bragg scattering, which occurs at the periodic modulations in the refractive index of the gain or gain medium (Bonal et al., Reference Bonal2019; Fu and Zhai, Reference Fu and Zhai2020):
 $$ m{\lambda}_{Bragg}=2{n}_{eff}\varLambda $$
where m is an order of diffraction, λBragg is the wavelength of Bragg reflection/PBG, neff is the effective refractive index of the waveguide, and Λ is the grating period.
It enables spectral selection through wavelength tunability due to photonic bandgap (PBG) engineering (Kogelnik and Shank, Reference Kogelnik and Shank1971). A periodic variation of the refractive index acts as a diffraction grating, which provides optical feedback throughout the structure (Kogelnik and Shank, Reference Kogelnik and Shank1971, Reference Kogelnik and Shank1972; Nojima, Reference Nojima2005).
When the PBG is tuned to overlap with the absorption band of the dye, excitation becomes more efficient. When it overlaps with the emission band, radiative emission is enhanced and spectrally narrowed. As a result, lasing thresholds decrease, and emission becomes more stable and better defined. This is particularly important in biological systems, where high pump intensities may lead to photodamage.
In practical implementations, solid-state dyes incorporated into DFB structures or nanoporous dielectric platforms such as anodic alumina have demonstrated low-threshold, spectrally stable lasing suitable for sensing and imaging.
Distributed feedback structures
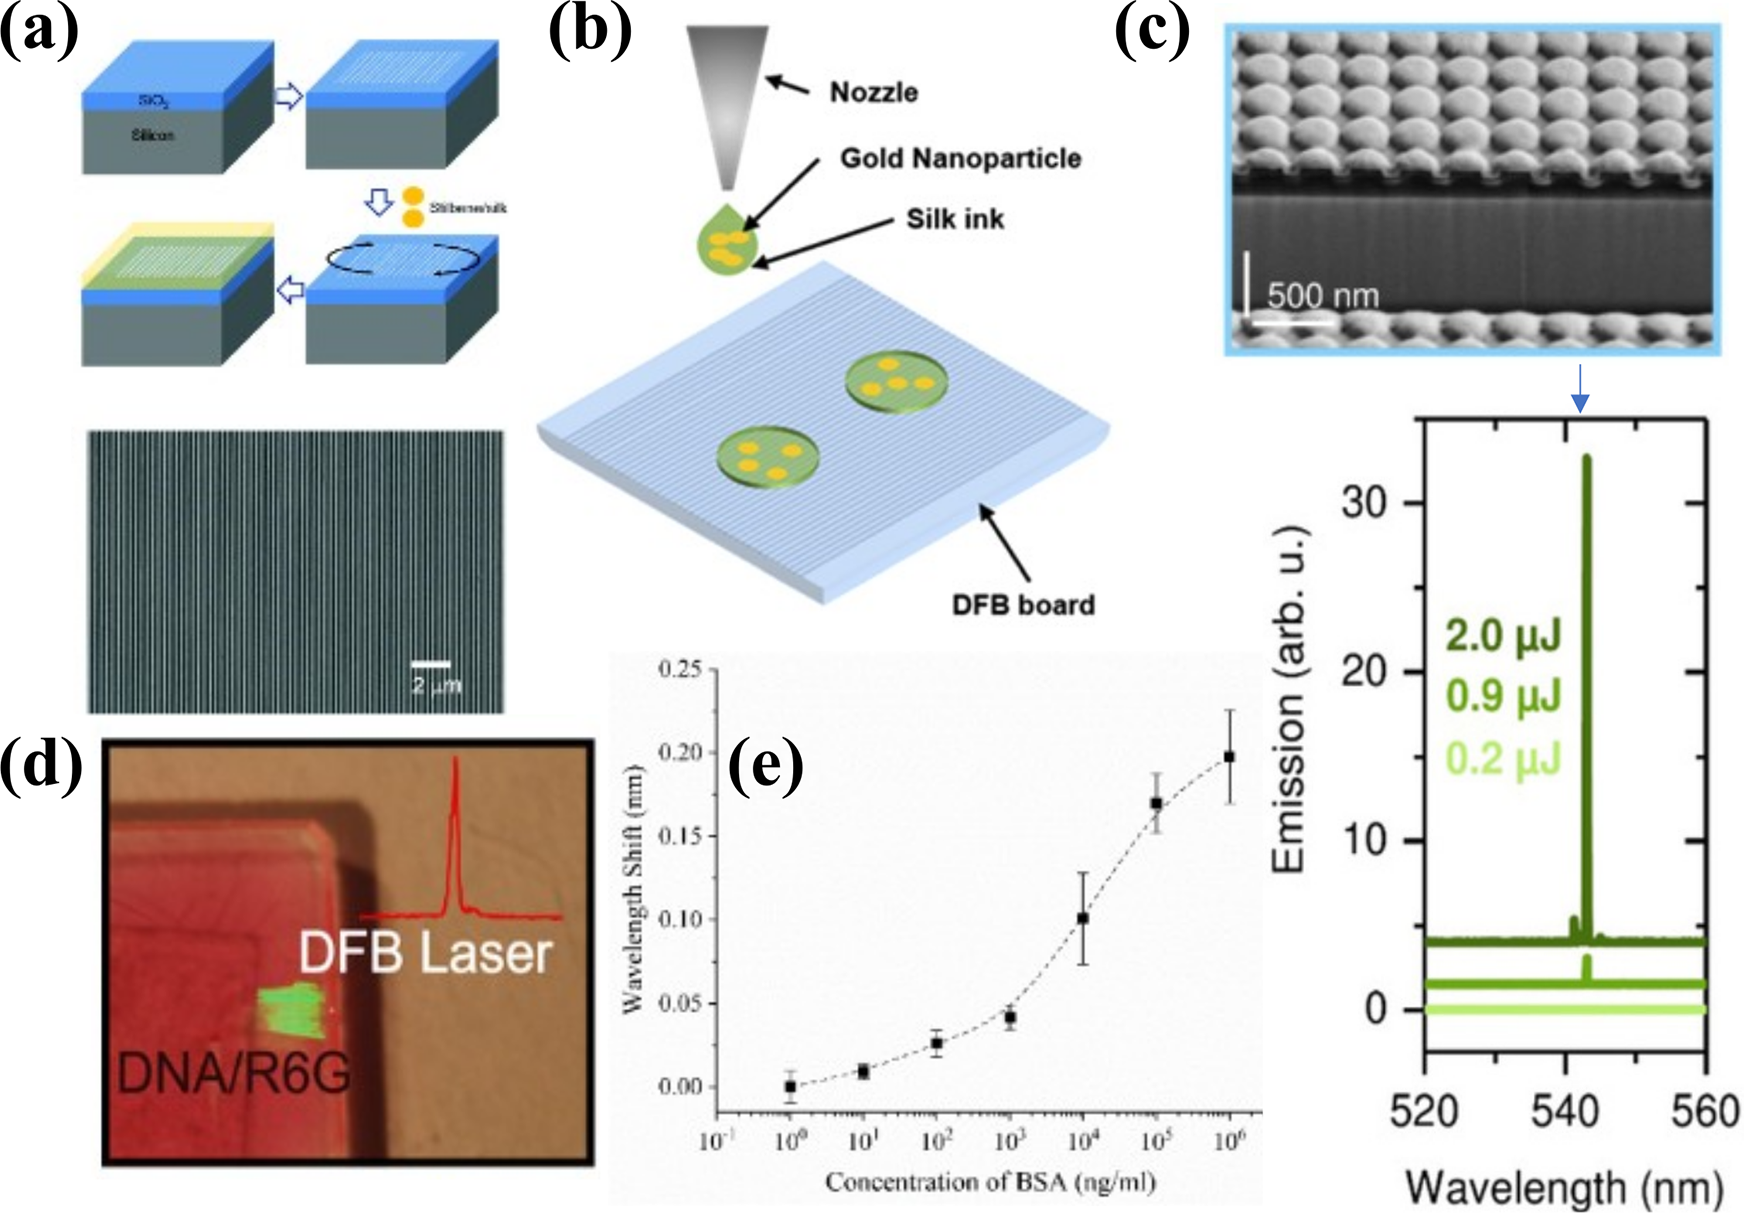
Gratings in organic DFB-based LS enable precise molecular detection through subtle refractive index variations. DFB structures consist of an organic gain medium (active film) and an inorganic or polymeric relief grating as an optical resonator (Figure 7(a)). They offer several advantages over other types of organic lasers (Tsutsumi et al., Reference Tsutsumi2008; Cunningham and Lu, Reference Cunningham and Lu2012; Bonal et al., Reference Bonal2019). DFBs typically generate a low threshold of a few μJ/cm2, which is typically one order of magnitude lower than the lasing threshold of standard drop-casted films and they exhibit a narrow-band peak (FWHM < 1 nm).
(a) Sketch of the procedure for the fabrication of a dye-silk DFB laser (top panel), ad an SEM microphotograph of the DFB grating obtained by nanolithography on Si/SiO2 substrate (bottom panel) (Toffanin et al., Reference Toffanin2012). Reproduced and adapted with permission, Copyright 2012, AIP Publishing group. (b) Schematic illustration for inkjet printing of the gold nanoparticle mixed with silk/RhoB ink (Umar et al., Reference Umar2020), Reproduced and adapted with permission, Copyright 2020. Optica Publishing Group. (c) SEM image of a 2D second-order grating for DFB lasing and an arrow pointing to lasing spectra of DFB eGFP laser for input pump power densities below, just above, and well above threshold (spectra vertically shifted for clarity) (Karl et al., Reference Karl2020). Reproduced and adapted with permission, Copyright 2020, Wiley Publishing Group, (d) Reddish DNA-R6G, with the nanopatterned region constituting the DFB laser imaged in green due to light diffraction (Camposeo et al., Reference Camposeo2014). Reproduced and adapted with permission, Copyright 2014, American Chemical Society, (e) lasing emission wavelength changes affected by bovine serum albumin (BSA) concentration. The error bars originate from the standard deviation calculated from four data points (Zeng et al., Reference Zeng2020). Reproduced and adapted with permission, Copyright 2020, Elsevier B.V.
Three standard architectures of DFB regarding a top-to-down placement of the gain medium can be distinguished, that is, gain-medium/waveguide/substrate, waveguide/gain-medium/substrate, and gain-medium being waveguide/substrate (Fu and Zhai, Reference Fu and Zhai2020). The directivity of emission is affected by the dimensionality of the DFB and the diffraction order (Bonal et al., Reference Bonal2019; Fu and Zhai, Reference Fu and Zhai2020). For example, a second-order DFB laser acts as a vertical-surface emitter, enabling user-friendly pumping and detection systems. Such DFB lasers are often used as label-free sensors suitable for robust detection of the binding of biological analytes by monitoring the spectral shift of the resonance wavelength caused by changes in neff (Lu et al., Reference Lu2008; Haughey et al., Reference Haughey2013; Diao et al., Reference Diao2014; Haughey et al., Reference Haughey2014; Farrando-Pérez et al., Reference Farrando-Pérez2024).
Low-threshold lasing was achieved in DFB by applying a stilbene-silk fibroin (5 wt%) mixture that was spin-coated onto a silica grating (Figure 7(a)) (Toffanin et al., Reference Toffanin2012). The Λ varied from 265 to 275 nm to align with the absorption band of the active layer. Lasing associated with scattering occurs at an energy threshold of 180 μJ/cm2. Umar et al. (Reference Umar2020) took a step forward by using RhoB dye-silk with gold particles as an ink-jet printing blend and depositing it directly onto a TiO2-coated quartz grating (Λ ≈ 375–385 nm) (Figure 7(b)). The printed gain layer delivered single-mode emission at 588 nm, with a 2.2 nm FWHM limited by the spectrometer. Adjusting the concentration of gold nanoparticles can blue-shift the lasing spectrum by > 4 nm.
Karl et al. (Reference Karl2020) demonstrated that enhanced green fluorescent protein (eGFP) can operate as a solid-state gain medium when embedded in a DFB architecture (Figure 7(c)). A 65-nm zirconium-oxide (ZrO2) waveguide was deposited onto a polymer grating with periods tuned between 325 nm and 375 nm. Meanwhile, a thin eGFP overlayer supplies the required optical gain. This results in single-mode surface emission, whose wavelength can be shifted from 525 nm to 577 nm simply by changing the grating period. The lasing threshold is only around 1 μJ.
A surface- and edge-emitting DFB laser with a DNA-Rho6G gain medium has been proposed as a biodegradable light source and sensor (Figure 7(d)) (Camposeo et al., Reference Camposeo2014). DNA was added to the organic dye to reduce the self-quenching effect of Rho6G, which occurs when the dye binds preferentially to DNA. After coupling an organic mixture with electron-beam lithographed quartz gratings (Λ = 200 nm and 400 nm), the coherent feedback generates the sub-nanometer-linewidth emission at 605 nm. Since 200 nm and 400 nm are designated for the first and second order emission, respectively, laser emission occurs from the DFB’s edge and in the normal direction to the surface.
A 1D linear silicon grating with a Λ of 410 nm and 150 nm groove depth was fabricated using electron beam lithography. This grating was then used as a stamp for a low refractive-index fluoropolymer SPC-347 substrate (Zeng et al., Reference Zeng2020). The surface of the substrate was covered with a 30-nm-thick silica film (Figure 7(e)). A single layer of RhoB dye-mixed with SU-8 photoresist sensor was spin-coated on top of the fluorine polymer grating for label-free refractive index sensing of bovine serum albumin (BSA) in the range of 1 ng/ml–1,000 μg/ml. The DFB laser acts as a ratiometric refractive-index sensor because the shift in the emission wavelength is proportional to the concentration of BSA. The detection limit was estimated to be 10 ng/ml.
Nanoporous anodic alumina
The nanoporous anodic alumina (NAA) platform, fabricated through the electrochemical oxidation (anodization) of aluminum (Thompson and Wood, Reference Thompson and Wood1981), is a nanomaterial eligible for use in multiple optical technologies (Acosta et al., Reference Acosta2020; Law et al., Reference Law2020; Gunenthiran et al., Reference Gunenthiran2022; Szwachta et al., Reference Szwachta2023) and as a template material for growing nanowires with various chemical compositions (Hnida et al., Reference Hnida2013) The structure of NAA contains an array of hexagonally arranged cells with cylindrical pores at their center (Figure 8(a)), which are perpendicular to the aluminum substrate. A hemispherical oxide barrier layer tip is formed between the interior of the pores and the aluminum substrate (Masuda and Fukuda, Reference Masuda and Fukuda1995). The pore length (LP) and diameter (DP) are fully tunable with nanoscale precision by controlling the voltage–current parameters of anodization (Choudhari et al., Reference Choudhari2012; Wang et al., Reference Wang2013; Bellemare et al., Reference Bellemare2014). The waveguiding properties of NAA-based nanostructures result from the averaging of the refractive index (neff) and dielectric constant of the NAA individual constituents, that is, air and alumina (Figure 8(b)). The tunability of DP (filtering properties) in NAA has potential applications in biomolecule sensing in biological milieus.
(a) Geometric features of the NAA nanostructure (nanopore diameter = DP, interpore distance = DInt, and pore length = LP. The refractive index of nanopores consists of two individual constituents of air (nAir) and alumina (nAl2O3) (Gunenthiran et al., Reference Gunenthiran2022), Reproduced and adapted with permission Copyright 2022, American Chemical Society Publications, (b) Conceptual illustration showing surface-immobilization of ThT-SDS micelles after functionalization in the NAA platform with straight pores (Szwachta et al., Reference Szwachta2025), Reproduced and adapted with permission, Copyright 2025, ACS Publications. (c) The simplified schematic of a nanopore’s structure of anodic alumina-based photonic crystals comprising (i) Fabry–Pérot resonator (FPR), (ii) distributed Bragg reflector (DBR), and (iii) microcavity (μCVT). The blue line on the right of NAA shows the intrinsic relationship between nanoporous structure and effective-refractive-index distribution, (d) The simplified schematic of the experimental setup for lasing with an example of a lasing spectrum gathered from RhoB-stained NAA (Gunenthiran et al., Reference Gunenthiran2022). Reproduced and adapted with permission, Copyright 2022, ACS Publications.
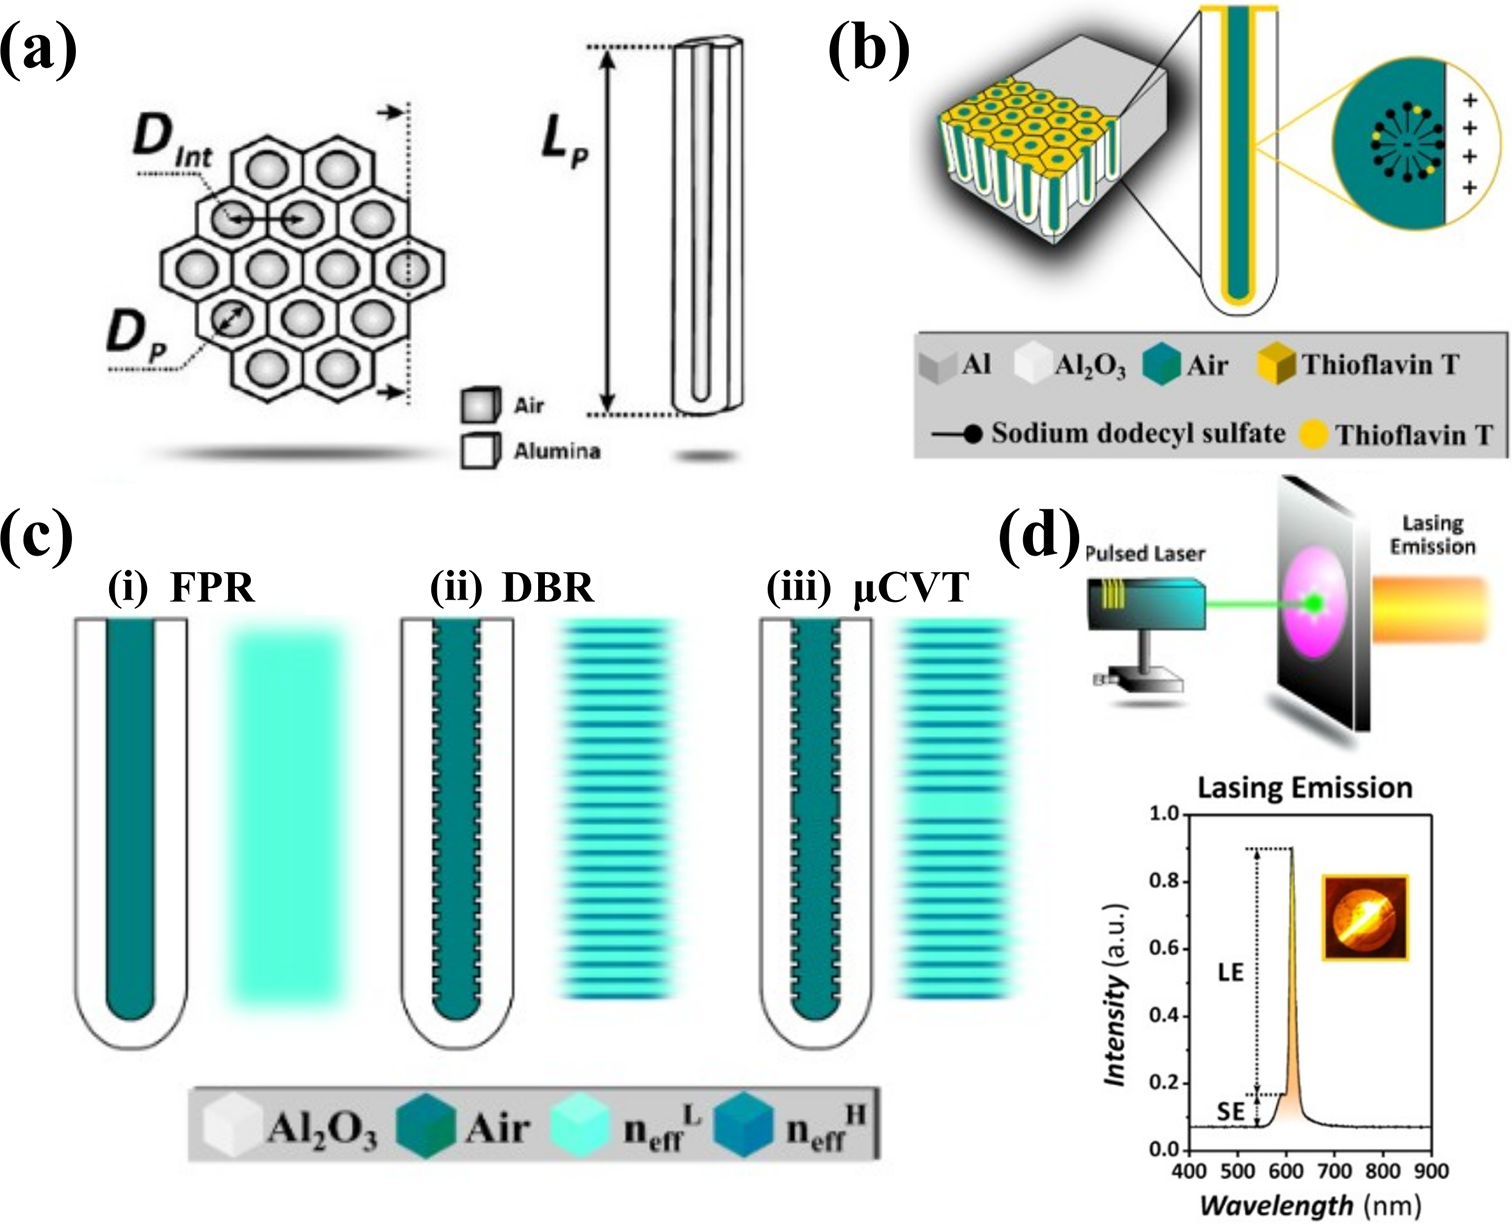
The development of pulse aluminum anodization unlocks the fabrication of a wide variety of nanostructures. The basic architectures of NAA-based PCs include the FP resonator (FPR) (Masuda et al., Reference Masuda1999), distributed Bragg reflector (DBR) (Sulka et al., Reference Sulka and Hnida2012; Rahman et al., Reference Rahman2013; Chen et al., Reference Chen2015; Białek et al., Reference Białek2020), and microcavity (μCVT) (Wang et al., Reference Wang2015; Liu et al., Reference Liu2019; Acosta et al., Reference Acosta2021) (Figure 8(c)).
Durable embedding of organic dyes or biomolecules in the interior of nanopores requires the utilization of surface chemistry functionalization. Common surface chemistry functionalization of NAA platforms relies on the hydroxylation of the NAA surface, followed by silanization using various organosilanes (Demé and Marchal, Reference Demé and Marchal2005; Takmakov et al., Reference Takmakov2006; de la Escosura-Muñiz and Merkoçi, Reference de la Escosura-Muñiz and Merkoçi2011; Joung et al., Reference Joung2013; Yu et al., Reference Yu2014; Sypabekova et al., Reference Sypabekova2022; Ren et al., Reference Ren2025), special linkers (Vlassiouk et al., Reference Vlassiouk2004; Cantons et al., Reference Cantons2025; Ren et al., Reference Ren2025), or other chemical compounds (Dai et al., Reference Dai2006; Joung et al., Reference Joung2013). A biosensor requires the creation of an additional biorecognizing linker with analytes, which can be divided into different categories such as an immunosensor, aptasensor, enzyme sensor, nucleic-acid sensor, genosensor, or peptide-based sensor (Amouzadeh Tabrizi et al., Reference Amouzadeh Tabrizi2020).
Santos et al. (Reference Gunenthiran2022) have made significant contributions to the understanding of PBG-induced optical-gain enhancement in NAA platforms, as well as the influence of geometric features on lasing these platforms. For example, they fabricated 1D and 2D NAA platforms with sinusoidally modulated pores and stained them with RhoB that exhibited ASE (Figure 8(d)) (Gunenthiran et al., Reference Gunenthiran2022, Reference Gunenthiran2022). They claimed that scattering events occurring within the NAA platform itself increase the rate of radiative relaxation, and are sufficient to generate ASE. The work demonstrated that the energy threshold required for the transition from ASE or RL is higher when DP increases. Conversely, smaller DP have been observed to result in better G and Q-factor, as represented by NAA platforms anodized in sulfuric acid. Thus, modulation of NAA could be the key to applying it in bioanalytics.
Optical resonators and feedback mechanisms for lasing in liquids
Optical resonators, also known as optical cavities, play a critical role in laser operation by providing feedback that reinforces coherent stimulated emission. The most common resonator consists of two mirrors aligned parallel to each other, creating a cavity in which photons oscillate back and forth. This type of resonator is called a Fabry–Pérot cavity (FPC) (Sauleau, Reference Sauleau and Chang2005). The mirrors are designed with specific reflectivity characteristics, where one mirror is highly reflective, while the other is partially transmissive, allowing a fraction of the amplified light to escape as the laser beam.
FPC-like architectures have demonstrated considerable potential in bioanalytics, since optical amplification of stained biomolecules in liquid environments enables the investigation of molecular dynamics (Yuan et al., Reference Yuan2021), structural changes (Gong et al., Reference Gong2021), and the surrounding microenvironment (Rusakov et al., Reference Rusakov2024). Several extensions of the basic FPC have been developed. One example is the FPC with two openings through which the liquid can be injected, creating a fluidic system (Fang et al., Reference Fang2024). A miniaturized version of the FPC is represented by microresonators, which possess a hollow core and resonating walls that act as an optical cavity. This configuration enables exceptionally long light-matter interaction lengths within ultralow volumes. In their simplest form, these structures are liquid-core optical ring resonators (LCORRs) (Lacey et al., Reference Lacey2007). Numerous variations of LCORR systems have been reported, in which the capillary is modified to form microbubbles or microbottles (Li et al., Reference Li2021). Another configuration is a hybrid FPC/droplet resonator, in which a reflective mirror forms the bottom of the cavity while a microscale droplet is deposited on top (Qiao et al., Reference Qiao2021). The surface of the droplet acts as a second mirror. Related designs include droplet resonators, where the edge of the microdroplet functions as a mirror, reflecting and enhancing the light (Wang et al., Reference Wang2016; MCGloin, Reference MCGloin2017).
Fabry–Pérot cavities
Hanczyc et al. (Reference Hanczyc2024) employ the FPC to transform the amyloid reporter dye ThT into a lasing-based, ultrasensitive probe for detecting protein aggregation in its early stages (Figure 9(a)). The study tracks how the lasing threshold evolves as Aβ(1–42) progresses from monomer to oligomer and mature fibril by sandwiching concentrated ThT-peptide solutions between highly reflective mirrors. An initial drop in the threshold within the first 100 min indicates subtle conformational changes that remain invisible to conventional ThT fluorescence (so-called fluorescent lag phase), whereas the subsequent rise indicates light-scattering losses introduced by growing fibrils.
(a) Fluorescence assay results for ThT-stained Aβ(1−42) (cyan diamonds) and kinetic analysis of lasing thresholds (black dots). Data were collected at set time intervals (Hanczyc, Reference Hanczyc2024). Reproduced and adapted with permission, Copyright 2024, American Chemical Society, (b) Visualization of lasing in ThT-stained G4 by Mg2+ stabilization: top-view left panel shows lasing images captured at different thermal stages, top-view right panel shows spectral shifts in lasing signals during thermal processing, and bottom panel shows lasing thresholds observed in G4-ThT during melting experiments at a specific temperature (Hanczyc, Reference Hanczyc2024). Reproduced and adapted with permission, Copyright 2024, American Chemical Society, (c) Fabry–Pérot cavity whereby the upper mirror was spin-coated with a dye-doped PS layer, functioning as the gain medium. By adjusting the pump energy, lasing emissions can be achieved only within the nucleolus regions (Fang et al., Reference Fang2024). Reproduced and adapted with permission, Copyright 2024, Nature Publishing Group.
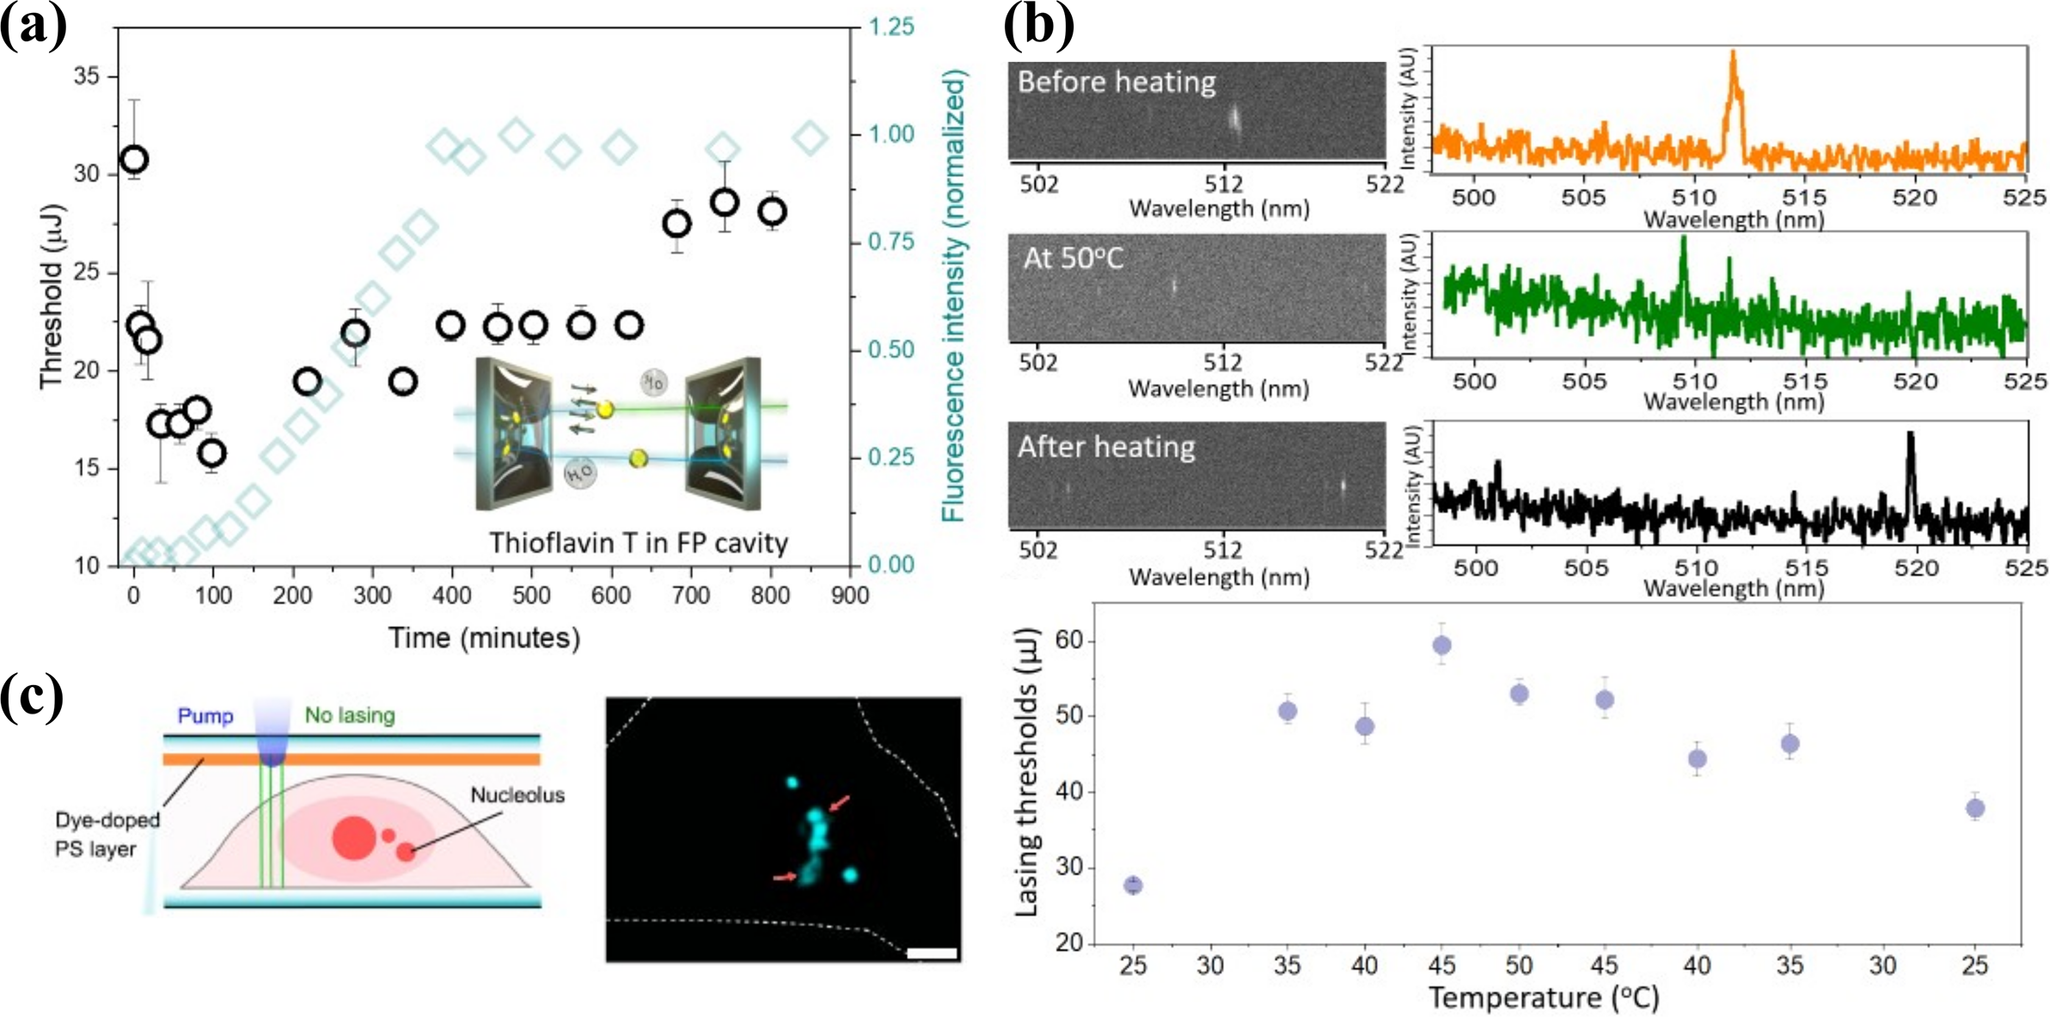
The example with DNA shows the strong influence of DNA counterions on the lasing characteristics, which reflects the secondary structure of nucleic acids (Hanczyc, Reference Hanczyc2024). In the case of G-quadruplex (G4), lasing was only detected in the presence of Mg2+, and the lasing threshold serves as a sensitive reporter of G4 melting (Figure 9(b)). In its native form, G4 exhibited laser action at a pump fluence of ~28 μJ. Upon heating the sample to 50 °C, partial unfolding of the quadruplex disrupts favorable dye stacking and increases the lasing threshold to ~55 μJ. Slow re-annealing lowers the threshold again, but only to ~38 μJ, indicating that the original G4-dye configuration has not been fully recovered. This study demonstrates that FP lasing can detect subtle, thermally induced conformational changes in DNA.
Fang et al. (Reference Fang2024) introduce ‘single-cell laser-emitting cytometry’, in which live mammalian cells flow through the FPC (Figure 9(c)). The nucleolus, which has a higher refractive index than the surrounding nucleoplasm, acts as an intrinsic lens that locally lowers the lasing threshold. The resulting images quantify the number, size, and temporal dynamics of nucleoli. When applied to mouse colon slices, the method distinguishes tumor from healthy tissue by the density and morphology of nucleolar lasing spots, highlighting FP cell lasers as powerful, non-perturbative probes for subcellular structure and pathology.
Liquid droplet resonators
Liquid droplet resonators use micrometer-scale liquid spheres as optical cavities. These cavities have intrinsically smooth, spherical interfaces that sustain whispering-gallery modes (WGMs) with exceptionally high Q-factors (Qian et al., Reference Qian1986; Piedra et al., Reference Piedra2025). It is important to note that generating monodisperse droplets with reproducible positioning is more challenging than simply enclosing a bioanalyte in the planar FPC. The main practical drawback is the rapid evaporation of the solvent, which complicates long-term measurements in aqueous systems and limits the usefulness of droplet lasers for routine bioanalytical assays.
Ultrasonic levitation provides a contact-free method for forming nearly perfect spherical microresonators. Azzouz et al. (Reference Azzouz2006) trapped 750-nL droplets of 0.02 M Rho6G in ethylene glycol at the pressure node of a 100 kHz standing acoustic wave and optically pumped them (Figure 10(a)). Above the lasing threshold, the broadband dye fluorescence collapsed into discrete laser lines between 610 nm and 650 nm, confirming coherent lasing from the levitated droplet. The technique combines computer-controlled picoliter dispensing for droplet reproducibility with the intrinsic sensitivity of an intra-cavity geometry.
(a) Schematic illustration of an aerosol generator creating microdroplets for lasing. Photograph of a lasing levitated micro-droplet (image on the left) (Azzouz et al., Reference Azzouz2006) and the first example of lasing in hanging droplets with dye irradiated by a pulsed green (532 nm) laser (right bottom image) (Qian et al., Reference Qian1986), Reproduced and adapted with permission Copyright 2006, Optica Publishing Group and Copyright 1986, The American Association for the Advancement of Science, (b) Encapsulation of a biomaterial vitamin microdroplets in a polymer substrate to avoid evaporation during the lasing experiments (Nizamoglu et al., Reference Nizamoglu2013). Reproduced and adapted with permission, Copyright 2013, Wiley, (c) Schematic of a microdroplet resonator. A dye-doped droplet is formed on a highly reflective dielectric mirror. Angle-dependent lasing modes will oscillate from strong reflections between the mirror and the droplet–air interface (Qiao et al., Reference Qiao2021). Reproduced and adapted with permission, Copyright 2021 SPIE.
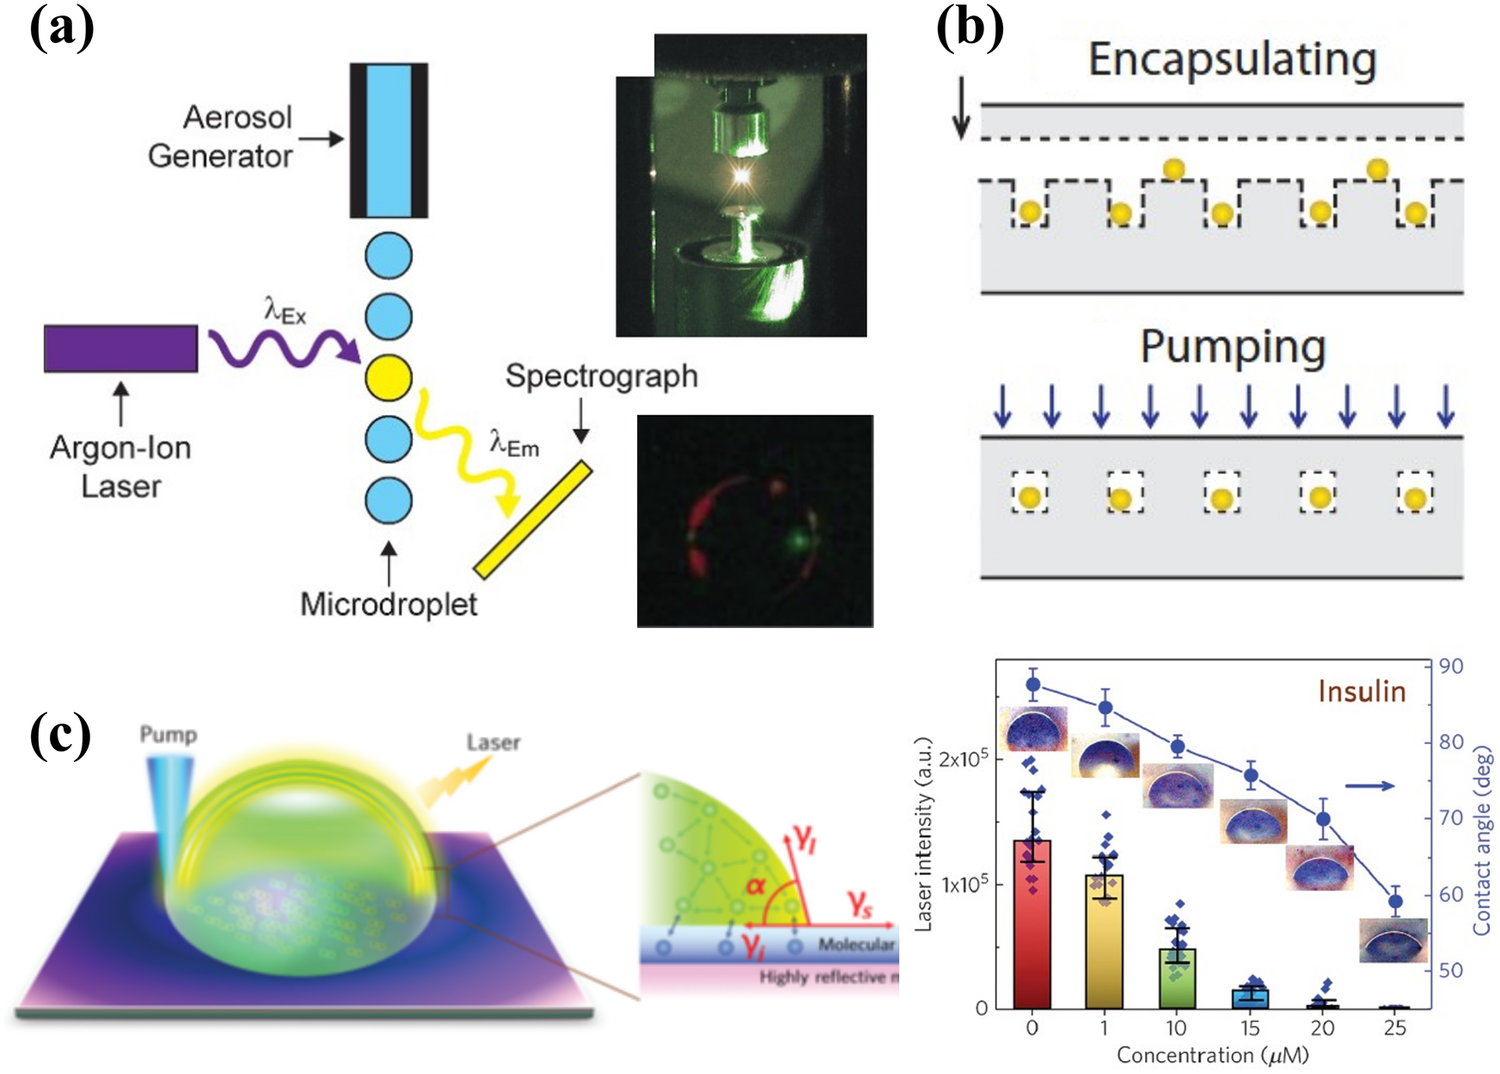
Nizamoglu et al. (Reference Nizamoglu2013) encapsulated aqueous flavin-mononucleotide (vitamin B2) microdroplets inside super-hydrophobic, nano-imprinted polylactic-acid (PLLA) microwells and sealed the array with a transparent PLLA cap (Figure 10(b)). The textured PLLA yields a contact angle, so 10–40 μm droplets retain nearly perfect spherical geometry and support high-Q modes that reach lasing. Importantly, encapsulation suppresses solvent evaporation and enables performance measurements over days in ambient conditions without loss of performance.
In droplet resonators, droplets deposited on a reflective mirror are placed on a reflective mirror to create an optical cavity. The interface between the droplet and the mirror provides partial reflection, enabling photons to circulate within the droplet cavity and interact with analytes inside. This approach simplifies experimental setups and enhances optical feedback, making it suitable for compact, robust analytical devices, including point-of-care diagnostic tools. Qiao et al. (Reference Qiao2021) demonstrated that placing aqueous microdroplets on a high-reflectivity dielectric mirror transforms the droplet edge into a second mirror-like reflective structure whose lasing behavior is highly sensitive to the interface conditions (Figure 10(c)). Increasing the contact angle raises the Q-factor from 103 to 107. Since the contact angle is determined by interfacial chemistry, the adsorption of nanomolar concentrations of proteins or peptides onto the mirror decreases the interfacial tension, flattens the droplet and quenches the laser output, providing a highly sensitive readout of biomolecules.
Microresonators
Microresonators in their simplest form use the capillary wall to guide WGMs around the circumference, while the inner channel carries the analyte (Liang et al., Reference Liang2025). Extensions such as microbubble or microbottle resonators, which are formed by locally heating and pressurizing a capillary, further enhance lasing signals. Walls as thin as 1–2 μm support a Q factor of > 106, enabling the detection of single nanoparticles and proteins. Overall, capillary microresonators stand out due to their ultra-low sample consumption (from picoliter to nanoliter volumes). These attributes make capillary microresonators a good option for the optofluidic biochemical sensing. However, the drawback is that they are a single-use technology.
The work by George et al. (Reference George2025) demonstrates lasing in a liquid-core silica capillary resonator filled with a BSA-RhoB composite (Figure 11(a)). Optical pumping of the capillary hollow core results in sharp multimode lasing peaks with as low lasing threshold as <0.5 mJ/cm2. The lasing threshold and emission wavelength are tunable via the BSA concentration (0.3–0.6 g/mL), which modulates the back-scattering feedback.
(a) Photograph of emission from the capillary and capillary filled with RhoB-BSA biopolymer solution (George et al., Reference George2025). Reproduced and adapted with permission, Copyright 2025, Elsevier (b) Experimental setup for the sequential bioconjugation of the fiber optofluidic laser with biotin and dye Cy3 for sensitive detection of avidin (Yang et al., Reference Yang2021). Reproduced and adapted with permission, Copyright 2021, The Royal Society of Chemistry. (c) Spectra of the mCherry lasing under different pump energies. The arrow indicates the pump energy increment, inset: upper left corner: microbubble image excited by the pump light, lower right corner: spectrum collected using a high-resolution grating of 2,400 g/mm (Ma et al., Reference Ma2023). Reproduced and adapted with permission, Copyright 2023, Applied Physics Letters (d) Reaction mechanism of dye and homocysteine forming an additional aromatic ring in the dye structure, which is affecting the electric field intensity distribution of a WGM in a microcavity and, in consequence, changing the position of the lasing spectra (Li et al., Reference Li2022). Reproduced and adapted with permission Copyright 2021, Wiley-VCH Publishing Group.
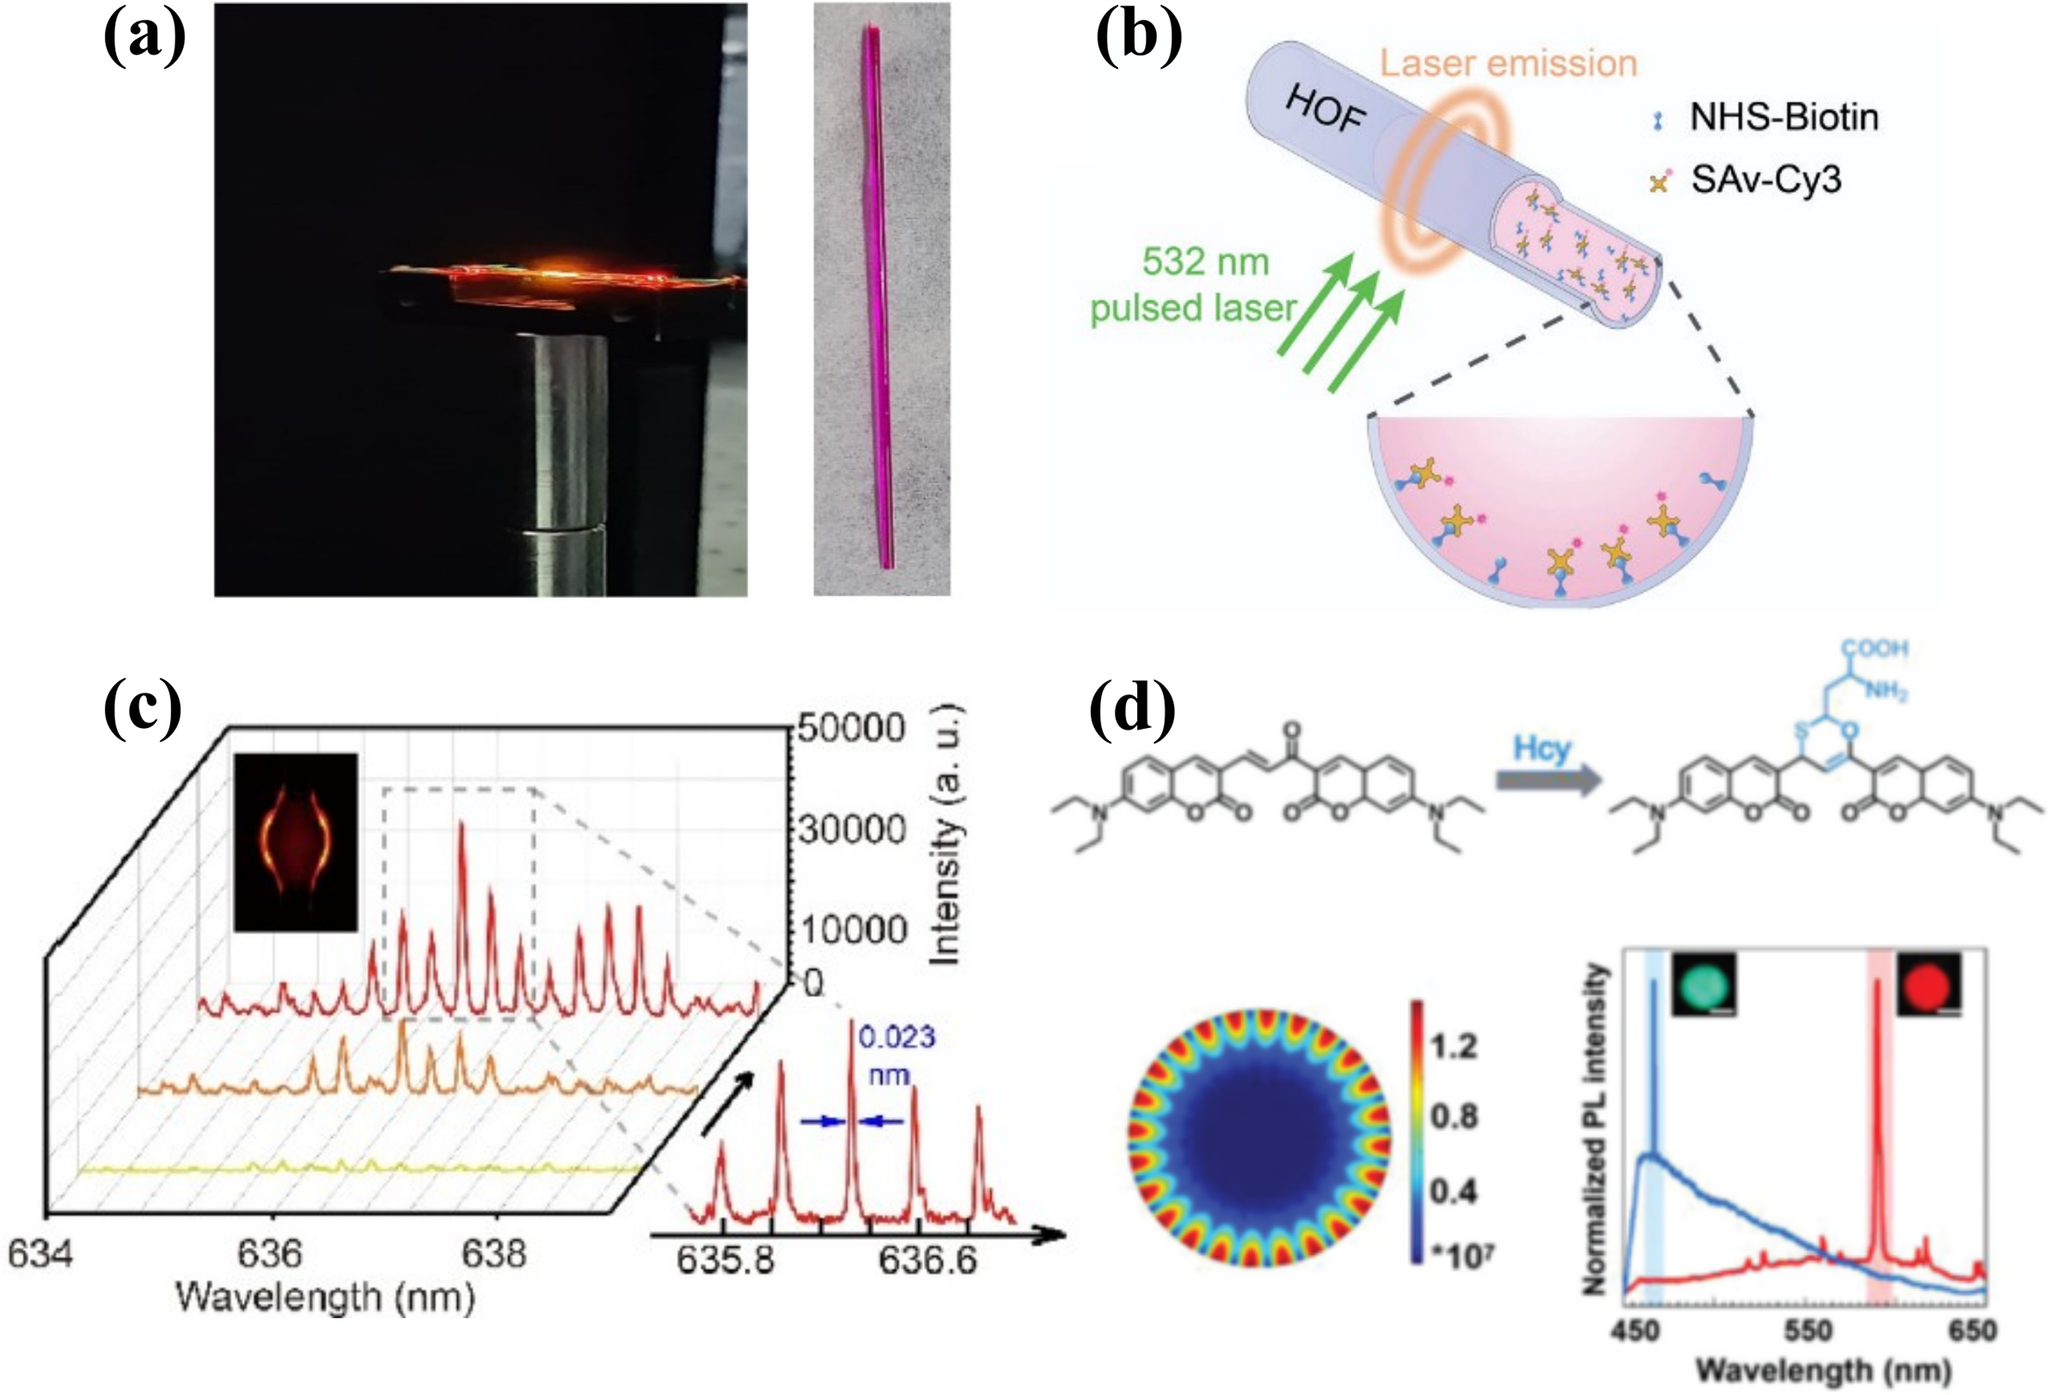
The work by Yang et al. (Reference Yang2021) shows a sequentially bioconjugated fiber optofluidic laser in which a hollow optical fiber simultaneously serves as the liquid-core resonator and microfluidic channel. Reagents are drawn in by capillary action and Cyanine3(Cy3)-labeled streptavidin monolayers on the inner silica wall provide the gain medium for WGM lasing (Figure 11(b)). Employing competitive binding between biotin-coated fiber walls, avidin, and SAv-Cy3, causes the laser intensity to decrease linearly with increasing avidin concentration. This yields a limit of detection of picomolar concentrations, which can be measured over a dynamic range of 10 pM–100 nM in just 25 min using < 0.6 μL of sample. This is one of the most sensitive avidin assays reported – surpassing conventional fluorescence ELISA, colorimetric methods, and polarized-microscope assays, and even edging out resonance Rayleigh scattering, which shows similar sensitivity levels.
In the study by Ma et al. (Reference Ma2023), a highly stable mCherry fluorescent-protein laser was realized by filling a silica microbubble drawn from a liquid-core capillary. This microbubble acts as both a microfluidic channel and a WGM resonator when filled with an aqueous mCherry solution (Figure 11(c)). The ultrathin (~1.7 μm) bubble wall supports a record-high Q ≈108, yielding an ultra-low lasing threshold of just 1.15 μJ/mm (Piedra et al., Reference Piedra2025) at 550 nm pumping. It also exhibits sharp multimode emission around 636 nm with linewidths < 0.023 nm. Lasing persists unchanged after 30 days of storage at 4°C and across pH 3–12, and mCherry’s superior photobleaching resistance enables sustained operation well beyond EGFP benchmarks. Exploiting the threshold-dependent onset of lasing causes the system to function as a high-sensitivity concentration sensor. It can detect mCherry down to 1.33 μM at a sensitivity of 42 μJ/mm (Piedra et al., Reference Piedra2025) within sub-picoliter mode volumes in a liquid-core fiber format.
In a study by Li et al. (Reference Li2022), a permeable polystyrene-sphere WGM microresonator serves as both a microlaser cavity and a microreactor (Figure 11(d)). The dye embedded in the sphere chemically reacts with homocysteine, forming a stable six-membered ring and disrupting conjugation. This shifts the dye’s emission from red (~590 nm) to blue (~466 nm). Inside the WGM cavity, this spectral change amplifies into color-switchable lasing, with clear threshold behavior (≈ 3.5 mW before adding homocysteine and ≈ 3.0 mW after adding homocysteine) and narrow cavity modes. The result is an unambiguous lasing readout that detects homocysteine-induced molecular transformation. Compared to conventional fluorescence, this approach lowers the homocysteine detection limit by five orders of magnitude (from ~10−4 to ~10−9 mg/mL) thanks to lasing.
Lasing bioanalytics for diseases diagnostics
LS has found growing applications in bioanalytics, particularly in studies related to neurodegenerative disorders (Chan et al., Reference Chan2022), cancer (Guo et al., Reference Guo2026), diabetes (Hanczyc et al., Reference Hanczyc2015), myocardial infarction (Niu et al., Reference Niu2022), and infectious diseases (Gather and Yun, Reference Gather and Yun2011). Importantly, in the context of biomedical diagnostics, LS is generally applied ex vivo, meaning that measurements are performed on biological samples obtained from patients rather than directly inside the patient’s body. The technique, therefore, functions as an analytical tool for laboratory diagnostics, similar in concept to fluorescence assays or other spectroscopic methods used in clinical bioanalysis.
Most LS-based biomedical studies focus on the analysis of biological fluids and biomolecular samples collected from patients, where subtle biochemical or structural changes associated with disease can be translated into measurable lasing parameters such as emission wavelength, intensity, spectral linewidth, or lasing threshold. Typical analyzed samples include blood plasma, serum, cerebrospinal fluid (CSF), urine, saliva, and cell lysates, as well as isolated biomolecules such as proteins, nucleic acids, or extracellular vesicles. In some cases, LS is also applied to cells (Gather and Yun, Reference Gather and Yun2011; Schubert et al., Reference Schubert2017), tissue (Lahoz et al., Reference Lahoz2019; Hanczyc et al., Reference Hanczyc2022), or biopsy-derived materials that are stained with suitable laser dyes and analyzed under controlled laboratory conditions (Suo et al., Reference Suo2024).
Much of the research in lasing-based bioanalytics, therefore, spans multiple levels of biological organization from fundamental biomolecular interactions (e.g., protein aggregation or DNA conformational changes) to complex clinical samples obtained from patients. By converting subtle biochemical variations into highly sensitive optical signatures, LS provides a promising analytical framework for detecting disease-associated molecular processes in biologically relevant media.
Neurodegenerative diseases
Parkinson’s disease
Clinical background
Parkinson’s disease (PD) is a neurodegenerative disorder, and current trends indicate that the number of patients is expected to double within a generation. PD is currently the second most common neurodegenerative disease, affecting 6 million people worldwide. Clinical manifestations of PD include movement disorders, such as bradykinesia, resting tremor, and rigidity. These can lead to non-motor symptoms, including hyposmia, constipation, urinary dysfunction, orthostatic hypotension, memory loss, depression, pain, and sleep disturbances. α-synuclein has been identified as a PD biomarker, making its detection clinically significant (Tolosa et al., Reference Tolosa2021) LS for diagnosis of PD.
In response to the need for early diagnostics of this disease, research into LS is underway, with a focus on the role of ThT – a gold-standard dye in neurodegeneration studies. The application of ThT facilitates the observation of the aggregation process, thus enabling the distinction between amyloid fibrils and non-aggregated proteins. A significant increase in fluorescence is observed when ThT molecules are trapped in the grooves formed by β-sheets in the fibrillar structure of amyloid. In the case of the native protein configuration or oligomeric forms, there are no long grooves, so ThT fluorescence is negligible. Thus, the protein forms can be distinguished (Rusakov et al., Reference Rusakov2024).
Lasing spectroscopy for early detection of PD
From a clinical standpoint, it is crucial to understand the mechanisms underlying amyloid formation. This process involves a nucleation-dependent polymerization reaction and consists of three primary phases: an initial lag phase, an elongation phase (fiber formation), and a plateau phase (no further fiber growth).
Early detection of amyloids offers the potential for earlier disease diagnosis and, in the long term, enhanced treatment outcomes (Michaels et al., Reference Michaels2023). In recent studies, Rusakov et al. (Reference Rusakov2024) employed the property of ThT as a reliable reporter of viscosity in their research on intermediate forms of proteins. ThT displays minimal fluorescence in environments of low viscosity, a property that is enhanced in viscous media. This enhanced fluorescence is due to the decreased rotational motion of the ThT rings, analogous to the phenomenon of protein binding to ThT (Stsiapura et al., Reference Stsiapura2008; Mukherjee and Ganai, Reference Mukherjee and Ganai2023). Hanczyc group used the technique of LS in the FPC to conduct a study of protein structures in the condensed phase. Studies were conducted on α-synuclein, insulin, and lysozyme. Recombinant α-synuclein was expressed in transformed E.coli BL21(DE3) competent cells and then purified with small modifications. The goal was to enhance emissions due to viscosity. Changes in microviscosity have been found to facilitate fluorescence enhancement, which could lead to further research on intermediate forms of amyloids. LS has been demonstrated to be an effective method for identifying early-stage intermediate protein structures and transiently populated states during protein aggregation (Rusakov et al., Reference Rusakov2024).
Discrimination of α-synuclein fibril polymorphism
Another important direction in PD research uses LS to study the polymorphism of α-synuclein fibrils and their final conformation, which are strongly influenced by the conditions of the aggregation process (Tycko, Reference Tycko2015; Szwachta et al., Reference Szwachta2026). This is particularly important for understanding the mechanisms of pathological amyloid formation associated with neurodegenerative diseases under physiological conditions. Consequently, ongoing efforts aim to investigate the interactions between amyloids and other molecules, as well as to develop experimental models that resemble human physiology (O’Leary and Lee, Reference O’Leary and Lee2019). For instance, fibril samples can be generated under controlled stress conditions to induce clear structural polymorphism. In this context, lasing provided by FPC gives the highly sensitive readouts for discriminating fibril polymorphs. The experiments were conducted in an environment resembling human cerebrospinal fluid (Szwachta et al., Reference Szwachta2026). A comprehensive machine-vision-assisted analysis of lasing supported with conventional characterization techniques establishes a multiparametric photophysical ‘barcode’ that qualitatively resolves α-synuclein fibril polymorphism beyond the capabilities of conventional ThT assays.
Alzheimer’s disease
Clinical background
Alzheimer’s disease (AD) is a neurodegenerative disorder characterized by progressive and irreversible cognitive decline. Currently, there is no cure, and it is estimated that there will be over 20 million patients in the United States by 2050 (Huang and Isidoro, Reference Huang and Isidoro2017). Three biomarkers have been defined for AD: amyloid deposition (A), tau pathology (T), and neurodegeneration (N), known as the ATN (Jack et al., Reference Jack2016).
Lasing spectroscopy for early detection of AD
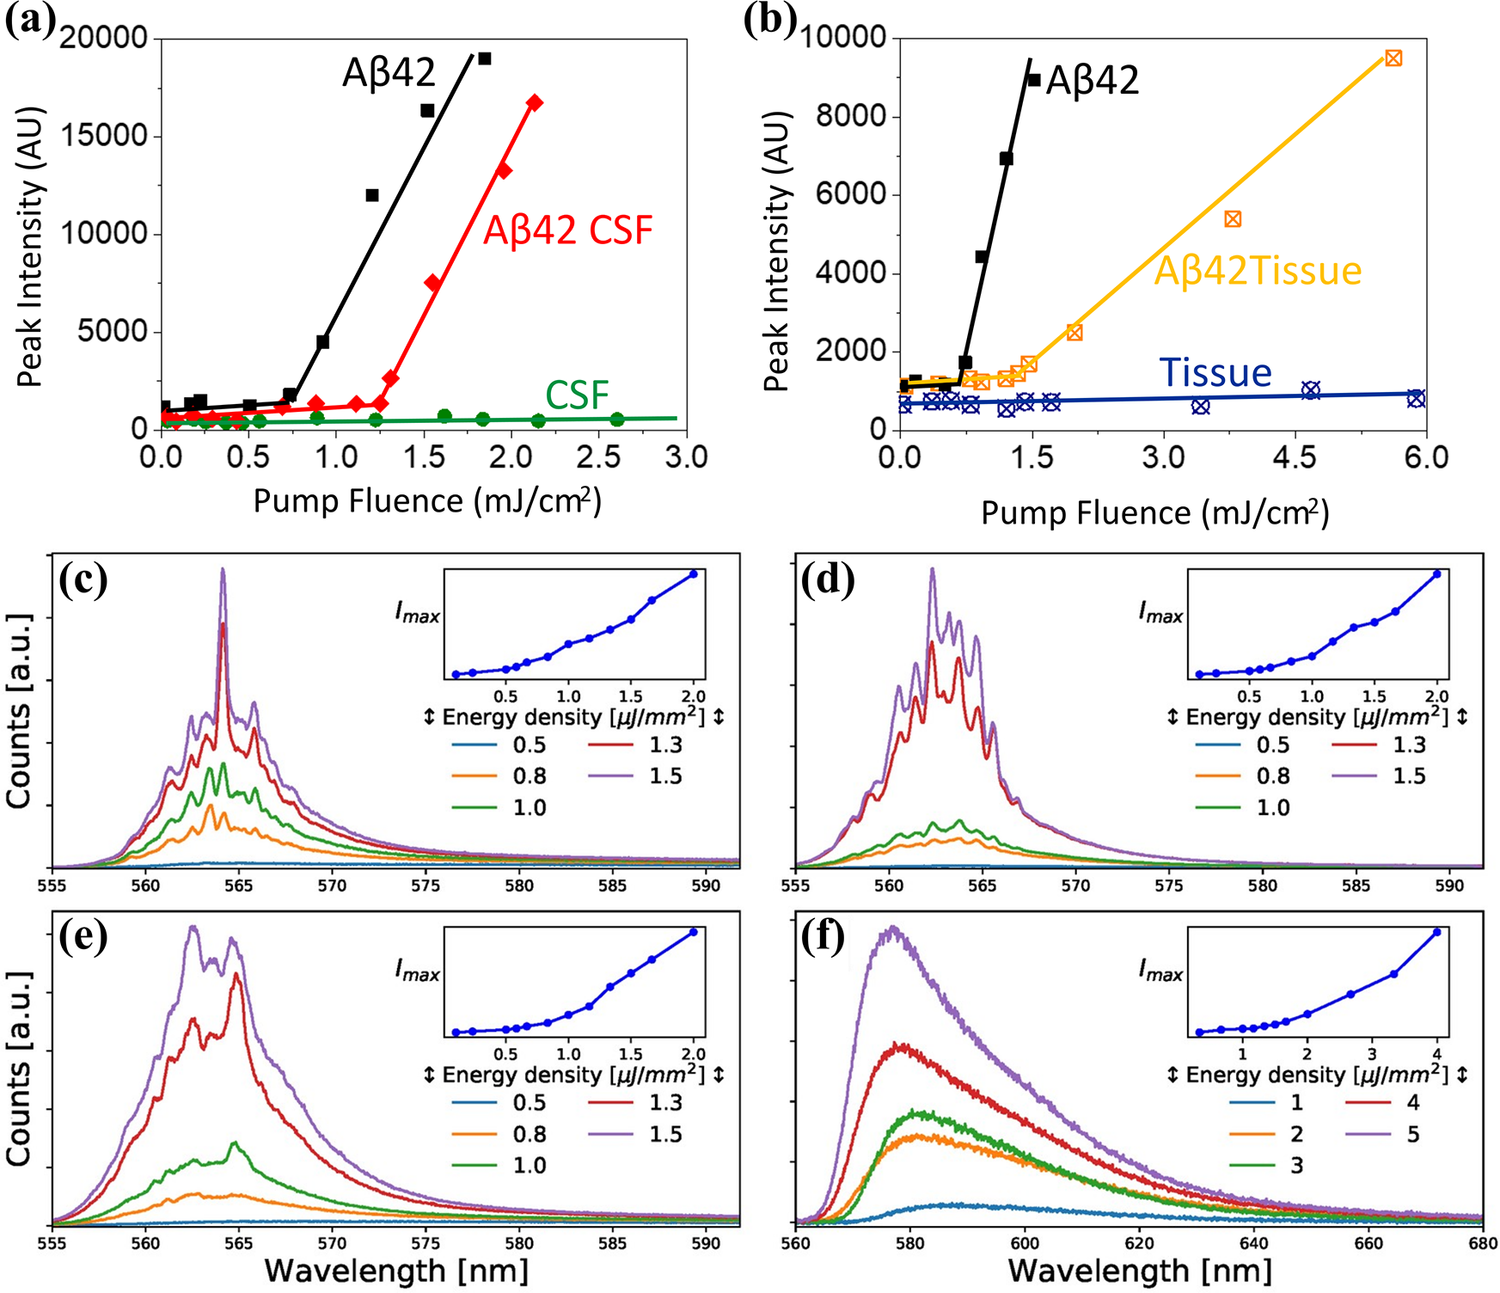
Similar to PD, early detection of AD is critical because therapeutic interventions are more effective in the early stages of pathology. It is important to detect oligomeric-protein aggregates, such as Aβ42, prior to their conversion into neurotoxic amyloid structures (Bitan et al., Reference Bitan2003). However, conventional ThT protocols are insufficient for this purpose. Hanczyc and Fita (Reference Hanczyc and Fita2021) demonstrated that the histological dye ThT can function as an efficient gain-medium whose ASE threshold reports, with unprecedented sensitivity, on the earliest stages of amyloid formation. By drop-casting ThT-protein mixtures into thin solid films, the authors showed that prefibrillar oligomers of Aβ42 trigger ASE well before conventional ThT fluorescence becomes detectable. Systematic variation of the incubation time and light scattering analysis, as well as variable-stripe gain measurements, confirm that the evolving ASE threshold reflects a competition between the stimulated-emission gain of ThT bound to β-sheet-rich aggregates and loss channels introduced by the growing aggregates’ dependent scattering. The study further extends this approach to clinically relevant matrices by enabling the detection of Aβ42 oligomers in the CSF of Alzheimer’s patients via protein-misfolding cyclic amplification and in tissue doped with Aβ42 oligomers (Figures 12(a,b)). Importantly, the method also discriminates these oligomers from Tau species, highlighting ASE as a powerful, cavity-free photonic readout for early detection of amyloid oligomerization.
(a) Dependence of the intensity of the emitted light on the excitation energy in ThT-stained Aβ42 oligomers (black) and CSF mixed with Aβ42 (red); no ASE was detected in CSF doped only with ThT (green), (b) dependence of the intensity of the emitted light on the excitation energy (pump fluence) used for the determination of the ASE thresholds in ThT-stained Aβ42 oligomers (black) and homogenized tissue with Aβ42 amyloid oligomer phantoms (orange); for tissue doped only with ThT (blue), no ASE was detected (Bitan et al., Reference Bitan2003). Reproduced and adapted with permission, Copyright 2021, American Chemical Society, (c–f) Evolution of the emission of the sample with increases in the pumping energy-density. The blueshift of the spectra, the emergence of narrow (FWHM < 1 nm) lines, and the dramatic increase in emission intensity were all due to the coherent RL, (c) NT (non-transfected N2A cells), (d) HTT-Q23 (N2A cells transfected with the non-pathogenic pEGFP-Q23), (e) HTT-Q74 (N2A transfected with the pathogenic pEGFP-Q74), (f) Petri dish without cells. In this case, an ASE, but not RL, was detected Armas-Rillo et al. (Reference de Armas-Rillo2021). Reproduced and adapted with permission, Copyright 2021, MDPI.
Huntington’s disease
Clinical background
Huntington’s disease (HD) is an incurable, autosomal dominant, neurodegenerative disease caused by a mutation in the huntingtin (HTT) gene. This mutation leads to the improper folding and aggregation of HTT proteins, affecting the functions and structural properties of cells. Symptoms include motor, cognitive, and psychiatric symptoms that appear around the age of 40 and progress leading to death within 10–20 years (Bates et al., Reference Bates2015).
Random lasing for diagnosis of HD
Armas-Rillo et al. (Reference de Armas-Rillo2021) demonstrated the possibility of detecting mutant huntingtin expression in cells using RL (Figure 12(c–f)). They successfully discriminated among three cell profiles: non-transfected N2A cells (NT), which served as the control, N2A cells transfected with a non-pathogenic form of Huntingtin (HTT-Q23), and N2A cells transfected with a pathogenic form of Huntingtin (HTT-Q74), which served as a cell model for HD. Their multivariate statistical analysis of RL signals, based on principal component analysis (PCA) and linear discriminant analysis (LDA) revealed significant differences between cells expressing the pathogenic and non-pathogenic forms of HTT. The lasing thresholds for all samples were low – around 0.5–0.7 μJ/mm (Piedra et al., Reference Piedra2025). The low pumping energy-densities required for RL prevented damage to cell cultures, even after extensive measurements. The analyses tested on several models were accurate to approximately 94%. Further validation in cells and tissues with endogenous mutant HTT expression is required, but the study by de Armas-Rillo et al. (Reference de Armas-Rillo2021) highlights the potential of RL as a diagnostic tool for HD.
From a clinical perspective, it is important that the mutated HTT protein is present not only in the brain, but also in peripheral tissues. This finding further underscores the rationale for developing an HD diagnostic test that uses minimally invasive samples. Subsequent research by de Armas-Rillo et al. (Reference de Armas-Rillo2025) involved experiments on blood samples from mice, comparing RL signals from blood samples taken from five R6/1 mice (a mouse model of HD) with samples taken from five control littermates. They achieved an over 80% success rate in discriminating between the blood samples of the R6/1 mice and their wild-type littermates.
Oncology diseases
Oncological diagnostics at various levels of organism complexity
In oncological studies, LS has been applied by encapsulating tissue within the FPC (Humar, Reference Humar2017) or microresonators (Schubert et al., Reference Schubert2017). The latter was developed for identifying mitotic and non-phagocytic cells. Using LS, the researchers successfully labeled the cells and observed them over time, including several subsequent cell generations. These studies represent an important advance in distinguishing cell subtypes, which has the potential to be translated into oncology diagnostics (Schubert et al., Reference Schubert2017). However, cancer detection is not limited to the analysis of single molecules or cells. Identifying more complex structures, such as tissues, biofluids, and early-stage cancerous polyps or tumors, is equally important. The example of breast cancer described below illustrates this approach.
Breast cancer
He et al. (Reference He2019) proposed using a biofluidic random laser cytometer to achieve biophysical phenotyping of cell suspensions. This platform successfully distinguished breast cancer cell suspensions from healthy controls by analyzing parameters such as lasing threshold and spectral peak shifts. Notably, the spectral peak shifts were found to be strongly influenced by subcellular structures, including cortical and nuclear lamina shells. Wang et al. (Reference Wang2017) demonstrated a correlation between lasing spectra and the malignancy grade of human breast cancer. They observed that, as breast cancer progressed from Grade I to Grade III breast cancer tissue, the output intensities and the sharpness of spectral peaks gradually increased. This can be explained by the fact that higher-grade tumors are more disorganized, creating more closed-loop scattering paths for light. Gayathri et al. (Reference Gayathri2023) investigated the potential use of RL to diagnose breast cancer polyps using a specially prepared tissue phantom. While healthy tissue areas exhibited normal fluorescence, areas with elevated levels of disorder within the tumor region produced a distinct lasing peak at the apex of the fluorescence emission.
Lung and colon cancers
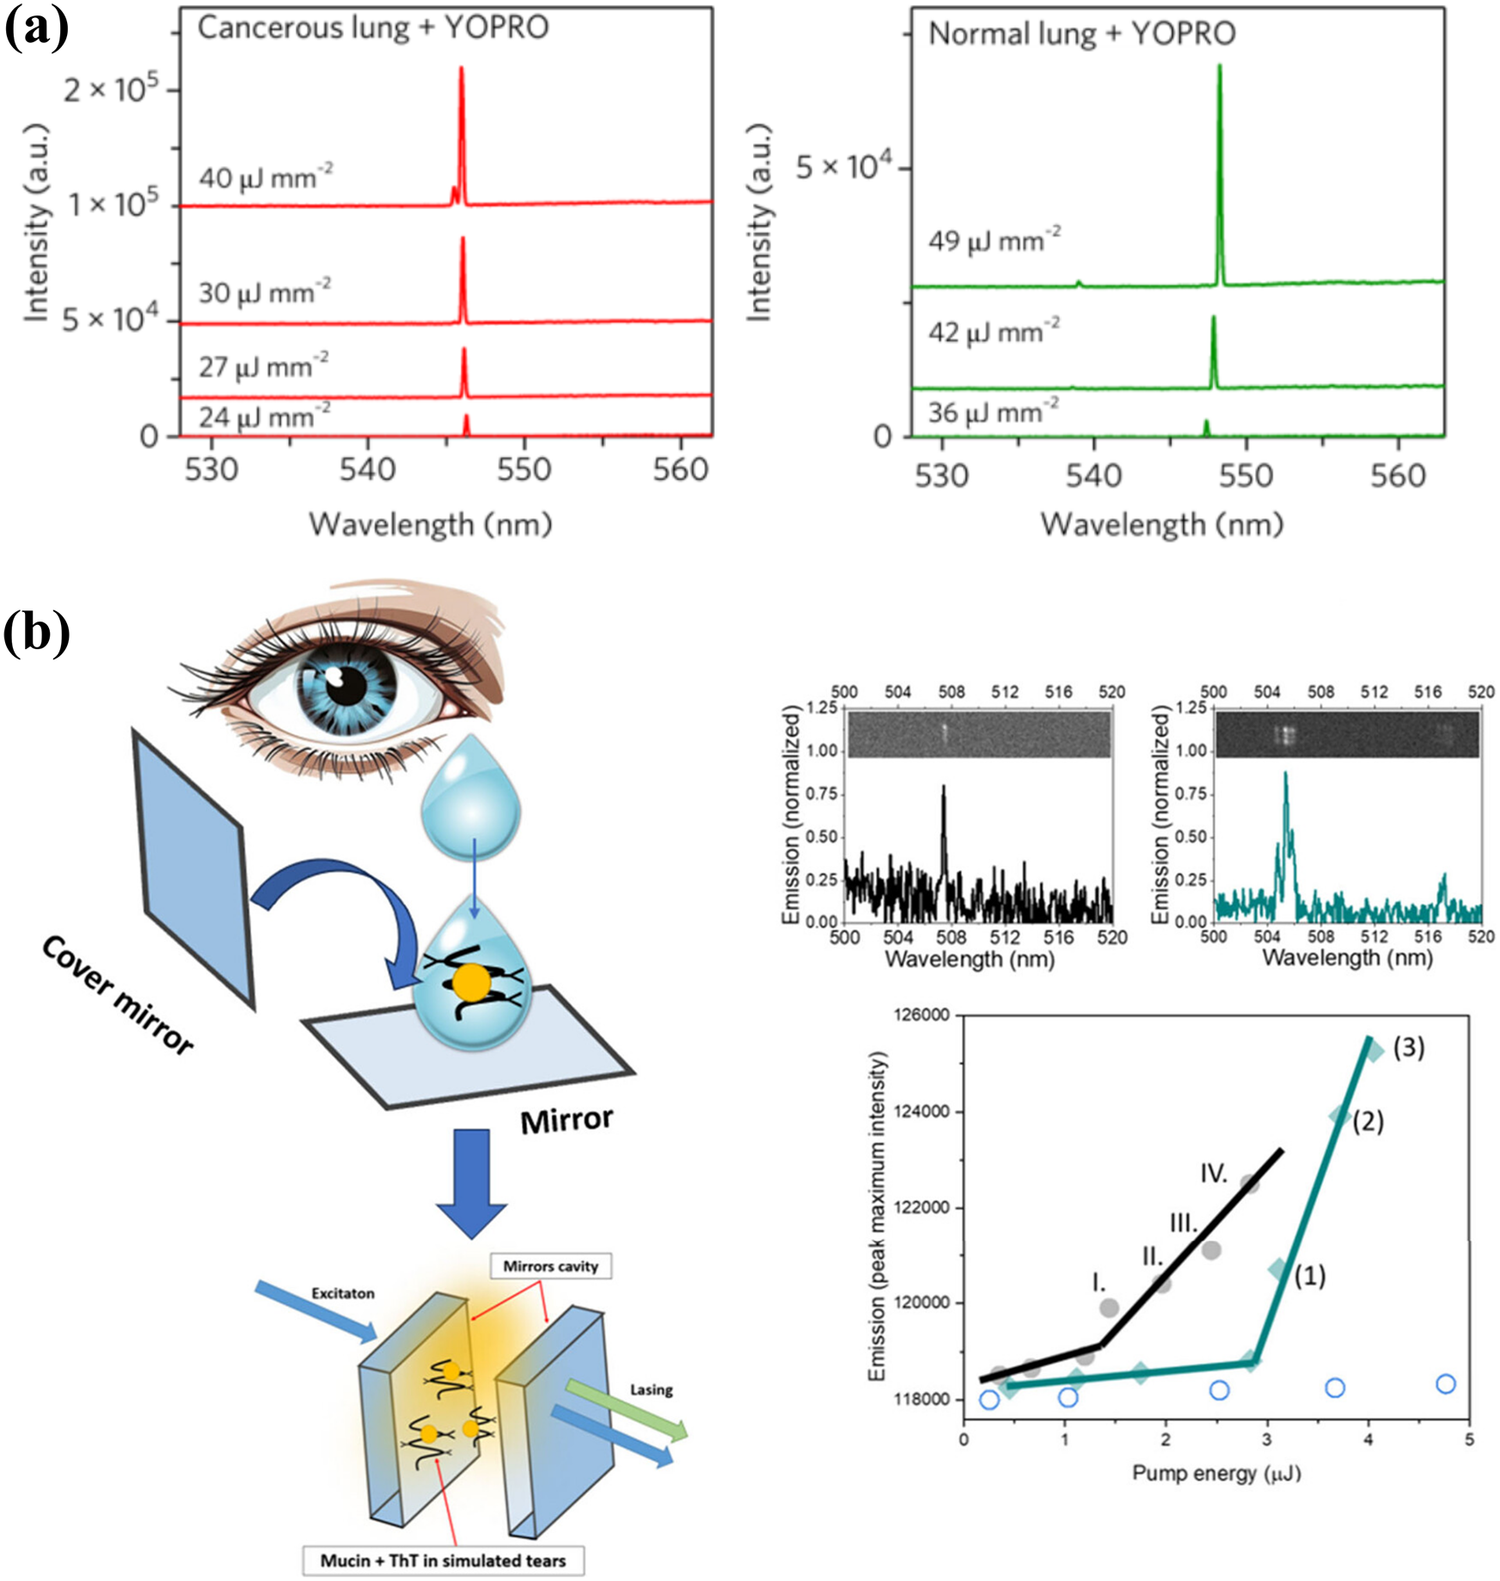
Chen et al. (Reference Chen2017) performed lasing of human tumor and healthy lung and colon tissues with nucleic acid probes using a laser-emission-based microscope (Figure 13(a)). This approach allowed mapping of laser emissions from specific markers, such as nucleic acids or selected antigens, with submicron resolution (< 700 nm) and a lasing threshold of tens of μJ/mm (Piedra et al., Reference Piedra2025). The lasing threshold for lung cancer cell nuclei was generally lower than that for normal cell nuclei. A lasing threshold histogram clearly showed a cutoff of approximately 30 μJ/mm (Piedra et al., Reference Piedra2025) between normal and tumor cells. In contrast, colon cancer tissues exhibited a higher lasing threshold, around 200 μJ/mm (Piedra et al., Reference Piedra2025).
(a) Examples of lasing spectra of a human lung cancer tissue (red diagram on the left) and normal lung tissue (green diagram on the right), stained with YOPRO under various pump energy densities (curves are vertically shifted for clarity) (Chen et al., Reference Chen2017). Reproduced and adapted with permission, Copyright 2017, Springer Nature. (b) The figure presents a proposed concept for the diagnosis of brain tumors based on the detection and analysis of mucins based on ThT staining and the lasing effect in Fabry–Pérot cavities. The figure presents a sample preparation diagram (left). The top shows the lasing spectrum of ThT in simulated tears solution (black graph on the left) and the lasing emission spectrum of ThT with the addition of mucins (0.2 mg/mL) to simulated tears solution (cyan graph on the right). The plot below shows pump energy versus emitted intensity, illustrating the exponential rise in intensity once the lasing threshold is surpassed. Black dots represent ThT dissolved in simulated tears, and cyan diamonds represent ThT-mucin in simulated tears. Open circles represent a control lasing experiment of ThT in simulated tears without condensation, where no lasing was detected. Lasing was measured in a condensed phase, achieved by a 10-fold volume reduction using column filters (Jalonicka et al., Reference Jalonicka2025). Reproduced and adapted with permission, Copyright 2025, American Chemical Society.
Brain tumors
Clinical background
Brain and central nervous system tumors are a diverse and extremely lethal group of malignant tumors. According to Global Cancer Statistics, there were 308,102 new cases and 251,329 deaths from brain and central nervous system cancers in 2020 (Fan et al., Reference Fan2022). Glioblastoma (Grade IV) is one of the most common and aggressive types of brain tumors. This disease has an extremely poor prognosis; the 5-year survival rate is only 4%–5% (Batash et al., Reference Batash2017). The median overall survival is less than 2 years (Cella et al., Reference Cella2024).
Currently, there is no screening test capable of reliably detecting brain tumors in asymptomatic individuals. Imaging techniques, such as MRI, can non-invasively detect and characterize brain tumors, but a definitive diagnosis and precise differentiation typically require histopathological confirmation through biopsy or surgical resection. MRI can be expensive and may have limitations in specificity in certain cases (Fan et al., Reference Fan2022).
Lasing spectroscopy for brain tumors
Recent research increasingly links mucin subtypes to brain tumors, highlighting their role in tumor pathophysiology and emphasizing their clinical potential (Kim et al., Reference Kim2021). Building on this, Jalonicka et al. (Reference Jalonicka2025) proposed a non-invasive diagnostic method that analyzes mucins in tears. Using FPC-based laser spectroscopy, the authors were able to resolve distinct spectral signatures of the ThT–mucin complex. These signatures included the appearance of double laser peaks and an elevated laser threshold in mucin-rich samples compared to control samples without mucin (Figure 13(b)). These optical fingerprints provide compelling evidence of specific ThT–mucin interactions that conventional fluorescence techniques cannot detect. The research was conducted on commercially available type 3 mucin and a fluid resembling human tears.
Hematological and hemato-oncological diseases
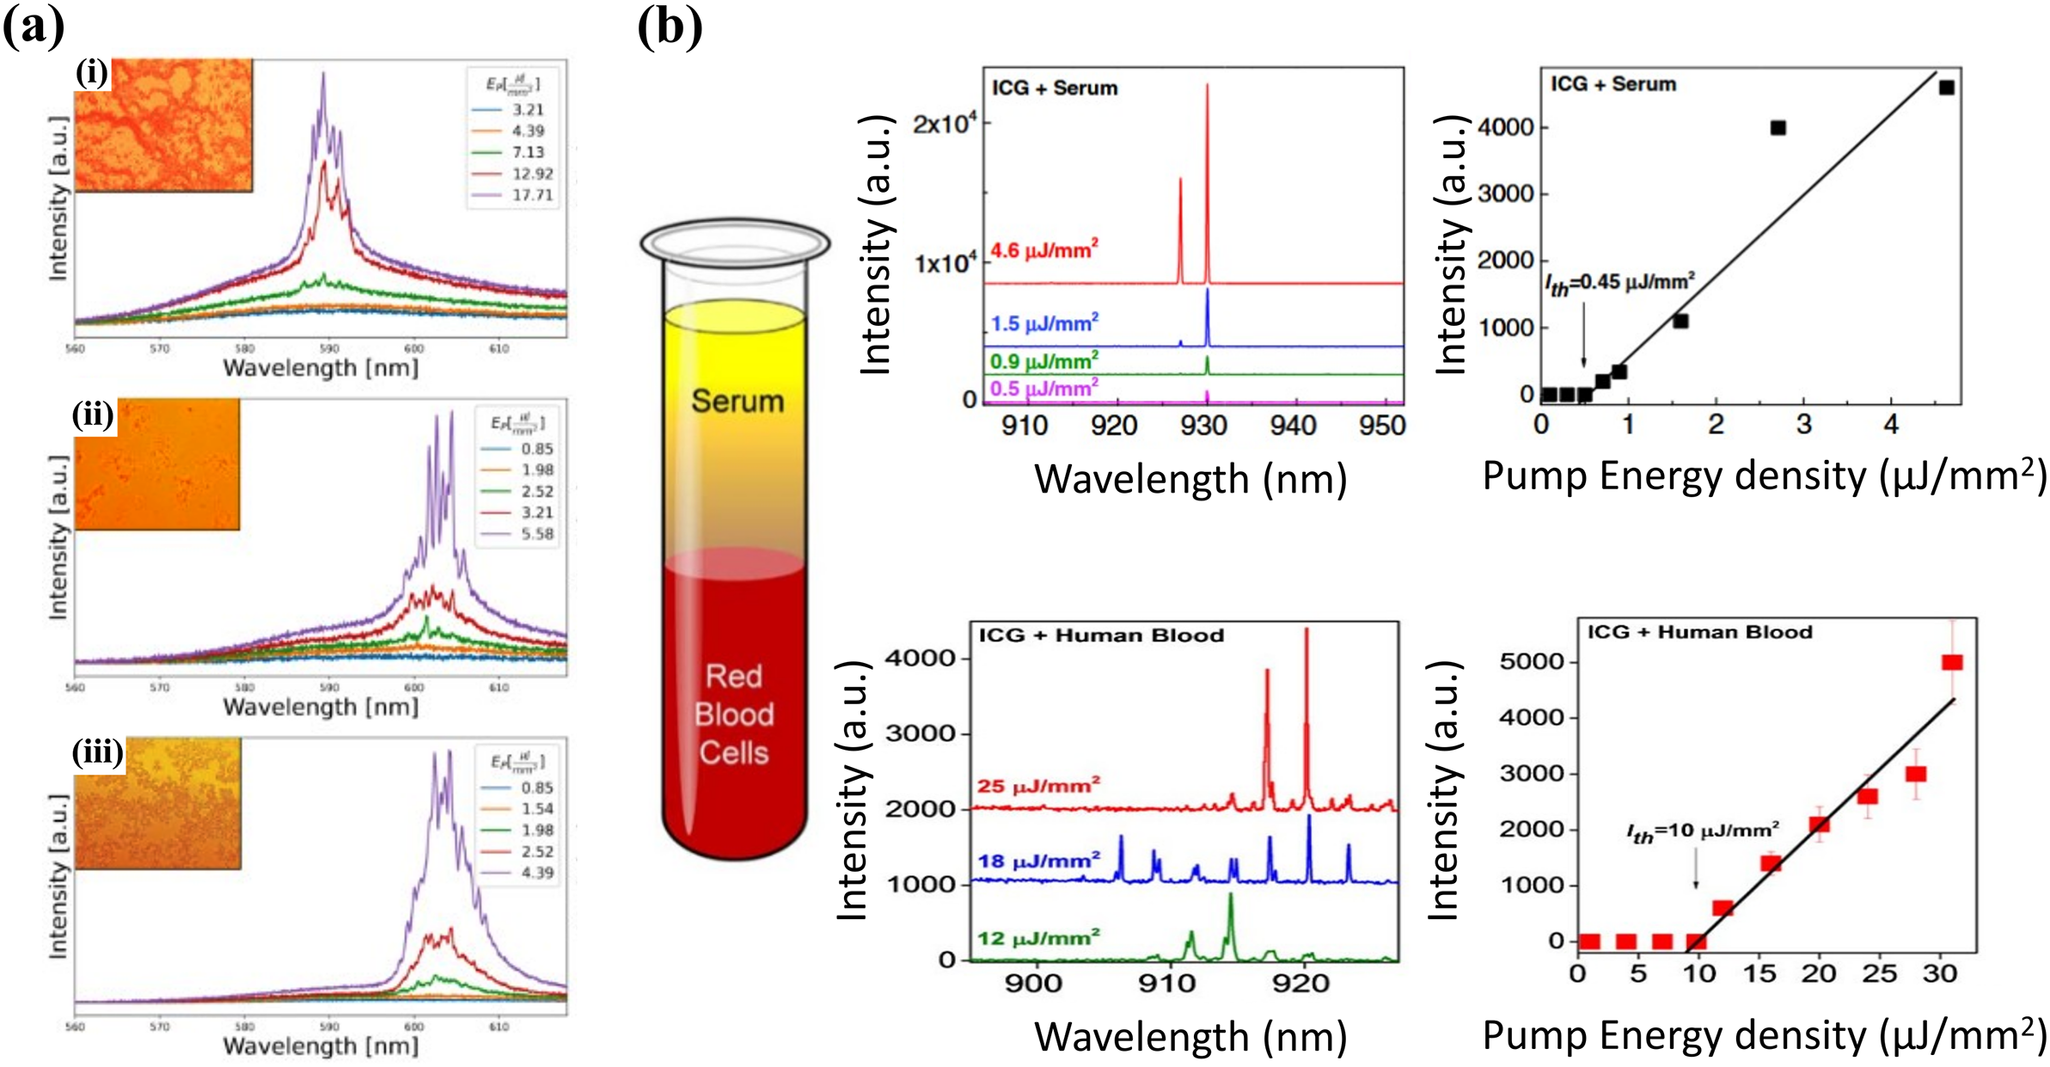
de Armas-Rillo et al. (Reference de Armas-Rillo2024) tested mixtures of RhoB dye solutions with various blood components, including platelets, lymphocytes, erythrocytes, and whole blood. Intense coherent RL was observed in all cases except with erythrocytes, occurring at relatively low pumping energy-densities (Figure 14(a)). Furthermore, blood samples from patients with chronic lymphocytic leukemia (CLL), a disease characterized by an elevated lymphocyte count, were distinguished from samples from healthy individuals with 86.7% efficiency (de Armas-Rillo et al., Reference de Armas-Rillo2024).
(a) Evolution of random lasing spectra in (i) whole blood, (ii) platelets, (iii) lymphocytes (de Armas-Rillo et al., Reference de Armas-Rillo2024). Reproduced and adapted with permission, Copyright 2024, MDPI. (b) Lasing spectra and lasing thresholds measured in optofluidic ring resonators filled with ICG-stained serum (top panel) and blood (bottom panel) (Chen et al., Reference Chen2016). Reproduced and adapted with permission, Copyright 2016, Optica Publishing Group.
From a clinical perspective, developing diagnostics for circulating tumor cells (CTCs) in the blood is crucial because CTCs serve as key biomarkers for cancer prognosis. Wu et al. (Reference Wu2025) presented an antigen-independent method for single-cell detection of CTCs using deep learning-assisted biolasers. The model was trained on pancreatic cells with single-cell lasers measured from nucleic acid-stained cells inside optical cavities. This approach achieved a sensitivity of 94.3% and a specificity of 99.9%, demonstrating its potential as a highly accurate platform for CTC detection.
Another medical example was shown by Chen et al. (Reference Chen2016) whereby authors used ICG dye in their LS studies to examine blood components, such as lipoproteins, albumins, globulins, as well as whole blood (Figure 14(b)).
Diabetes
Diabetes is a serious, long-term disease characterized by abnormal levels of glucose in the blood. This occurs when the pancreas does not produce enough insulin or when the body’s cells do not respond effectively to the insulin that is produced, leading to impaired regulation of blood sugar levels. In 2021, 529 million people worldwide were living with diabetes. It is estimated that more than 1.31 billion people will have diabetes by 2050.
Beyond impaired insulin production and action, diabetes is also associated with pathological structural transformations of insulin itself. Under destabilizing conditions such as low pH, elevated temperature, high ionic strength, or prolonged storage at high concentration, native insulin can undergo amyloidogenesis, forming β-sheet-rich oligomers, protofibrils, and mature fibrils (Hanczyc, Reference Hanczyc2014). These fibrillar deposits are frequently found at sites of repeated insulin injection and can impair local drug resorption and glycemic control.
Chan et al. (Reference Chan2022) stained native insulin (commercial human recombinant insulin) with Rho6G dye and an inkjet-printed microdroplet. As insulin aggregated from monomers through oligomers and protofibrils to mature fibrils, the internal refractive index and dye aggregation state within each droplet changed, giving rise to pronounced red-shifts of the lasing wavelength, even though conventional fluorescence and absorption spectra remained nearly unchanged. This lasing readout thus acted as an ultrasensitive optical sensing of subtle conformational changes of insulin. By extending this concept to arrays of microdroplet lasing and coupling the far-field laser images to a multimodal deep-learning model, the authors achieved high-throughput, image-based classification of aggregation stages.
Myocardial infarction
One biomarker of myocardial infarction is the cTnI–C complex, which consists of cardiac troponin I and troponin Niu et al. (Reference Niu2022) experimentally demonstrated the real-time monitoring of the dynamic binding and dissociation process of the cTnI–C antigen–antibody (commercially sourced) using LS, which provided feedback within ~15 minutes. They also proposed and demonstrated a disposable optofluidic microtubule WGM immunosensor for label-free detection of cTnI–C complexes with active interrogation enhancement.
The dynamic binding and unbinding processes of the cTnI–C antigen–antibody complex were illustrated by continuously monitoring the lasing peak wavelength.
Infections
Experiments involving LS and bacteria or infections are appearing more frequently in the literature. One example is the demonstration of lasing action after colonies of Escherichia coli bacteria genetically programmed to synthesize GFP. When embedded in the FPC and excited with blue light pulses (465 nm), the bacteria emitted green laser light (∼520 nm). Broad illumination of the pump light ensures simultaneous laser radiation over a large area within the bacterial colonies (Gather and Yun, Reference Gather and Yun2011).
Perspectives
Lasing readouts are beginning to reveal disease phenotypes that conventional fluorescence only hints at. Further research will require analysis of results not only within a single disease entity but also across different disease entities. This will enable the validation of results and increase the accuracy of results, especially when a patient presents with nonspecific symptoms (symptoms that occur in multiple disease entities).
Lasing parameters, such as thresholds, mode structures, and spectra, are highly sensitive to sub- and cellular structures and disorders. Recently, new directions in LS for applied bioanalytics and biomedicine have emerged. Good examples are monitoring protein aggregation in the context of neurodegeneration progression (Szwachta et al., Reference Szwachta2026), antigen-independent single-cell biolasers for oncology (Wu et al., Reference Wu2025), organelle-resolved lasing cytometry, (Fang et al., Reference Fang2024) or RL sensing from complex biofluids (de Armas-Rillo et al., Reference de Armas-Rillo2025). These examples show that the next steps are to converge on clinical translation, scaling data analysis, and multi-disease panels.
Oncology: Toward marker-agnostic liquid biopsy and therapy monitoring
A new system uses single-cell biolasing inside micro-FP cavities to separate CTCs from white blood cells (WBCs) without the need for antigen detection. The system learns power-dependent lasing mode ‘hyper-signatures’ with a dedicated Deep Cell-Laser Classifier. The system achieved 94.3% sensitivity and 99.9% specificity. A model trained on one pancreatic cancer cell line was also effective on other pancreatic lines without any retraining (‘zero-shot’). When applied to lung cancer patient samples, it produced CTC counts that closely matched standard immunofluorescence measurements. These data strongly suggest the need for clinical studies focused on monitoring longitudinal responses and minimal residual disease, as antigen drift often renders antibody panels ineffective.
Short-term priorities are largely engineering and workflow, moving from benchtop cavities to microfluidic cavities to lift throughput and reduce losses, co-integrating on-chip collection and sorting for downstream omics, and deploying physics-informed or weakly supervised models so training can occur directly on patient samples while reducing compute. In the future, larger patient cohorts for clinical validation will be required. The same antigen-independent logic applies to oncology subtype expansion (e.g., sarcoma, hematologic malignancies) and phenotypically diverse cases that evade marker-based assays. Note that a very small subpopulation of WBCs can show atypical higher-order lasing modes, whereby future classifiers should explicitly model these edge cases.
Organelle-resolved disease phenotyping: Nucleolus-guided laser cytometry
In single-cell laser-emitting cytometry, the nucleolus itself becomes a selective lasing region when the gain medium is separated from the cell. The nucleolus’s higher refractive index acts as a lens, amplifying a 36x threshold contrast compared to the surrounding nucleoplasm while suppressing high-order modes. This yields sub-micrometer, ultrahigh contrast emission maps and spectral fingerprints that report nucleolar size and inhomogeneity – features tightly linked to tumor prognosis and cellular stress pathways implicated in cancer and neurodegeneration.
First, single-cell laser-emitting cytometry has produced label-free emission from tissue sections, suggesting the potential for additional contrast in grading tumors or mapping nucleolar stress in neurodegenerative tissues. Second, throughput phenotyping: a flow-based single-cell laser emitting cytometry chip can distinguish multiple cell types by nucleolar spectral features and t-SNE clustering, paving the way for organelle-aware cytometry for drug screening (e.g., rRNA biogenesis inhibitors, nucleolar stress modulators). It is important to keep pump energies in the low-order mode regime for robust fingerprints and to reduce phototoxicity for live-cell work, which the study begins to address (thresholds of tens of μJ/mm (Piedra et al., Reference Piedra2025) and no damage under such protocols).
Neurodegeneration and systemic disorders: Random-lasing from blood as a non-invasive window
RL leverages the intrinsic disorder of cells, proteins, and microstructures in biofluids and tissues to provide feedback. In the HD mouse model, RL spectra of whole-blood (RhoB gain in EtOH) achieved ~80.7% classification accuracy (PCA→LDA, leave-one-out) between HD and wild-type animals, with an RL threshold ~16.7–17 μJ/mm (Piedra et al., Reference Piedra2025). These results demonstrate the non-invasive potential of RL and suggest its sensitivity to disease-driven compositional and/or microstructural changes in blood.
Future directions here include (i) artificial complex biological milieus such as CSF, saliva, blood etc. (ii) moving to human serum and plasma cohorts, (iii) extending panels to include other protein-aggregation diseases (e.g., ALS, PD, AD) and inflammatory states, (iv) coupling RL with learners that ingest power-Fourier spectra and shot-to-shot variability – features that are already informative in the mouse studies, (v) standardizing sample chemistry to balance gain, scattering, and coagulation artifacts.
Future challenges
Translating LS from elegant demonstrations to dependable bioanalytical tools will hinge on coordinated progress in engineering, modeling, standardization, and data integration. In terms of engineering, biolaser platforms must become more automated, robust, and disposable. One solution is microfluidic cavity cartridges with stable mirror stacks and bead-set gap control to ensure consistent cavity lengths and alignment across large sample runs. The same philosophy applies to single-cell laser readouts: flow-compatible chips with integrated scanning and synchronized acquisition are favored so that cell handling, pumping, and signal capture can occur in a single, closed workflow. RL assays require standardized beam geometries, collection optics, and on-the-fly quality metrics that identify outliers from one shot to the next and stabilize thresholds in the presence of biological heterogeneity. Several of these elements have already been highlighted in CTC studies and demonstrated in nucleolus-resolved laser cytometry, providing a practical blueprint for scale-up.
Modeling should evolve from pattern recognition toward physics-informed learning. Future classifiers should encode the core photonic constraints of these systems, such as threshold behavior, mode evolution with pump power, and cavity boundary conditions. This will allow models to generalize across instruments, laboratories, and sample types. Embedding physically meaningful priors (e.g., how longitudinal modes appear or disappear as pump fluence increases) reduces data requirements, improves interpretability, and mitigates failure modes when biological or optical conditions change. This is particularly important for assays intended to operate without immunochemical labels, where the optical signature itself is the primary ground truth.
Another priority is metrology. Community reference materials, such as optical phantoms, should span the refractive index and absorption regimes of intracellular compartments, such as the nucleolus versus the nucleoplasm. This allows for the calibration of mode structures and thresholds against known standards. For RL, disordered test standards with controlled scatterer densities and path length spectra will enable cross-site comparisons and rigorous sensitivity analyses. With these references, interlaboratory studies can distinguish true biological signals from artifacts caused by instrumentation or sample handling and establish acceptance criteria for clinical-grade measurements.
The analytic payload of lasing assays will also grow richer through multi-omics integration. Rather than relying on a single optical metric, next-generation studies should combine lasing fingerprints: thresholds, peak counts, mode textures, and spectral intermittency with orthogonal molecular and histopathology data. Practical combinations include pairing CTC lasing signatures with single-cell genomics or transcriptomics, coupling blood-based RL readouts with plasma proteomics and metabolomics, or aligning organelle-resolved lasing maps with digital pathology features. Composite scores built from these multimodal layers are more resilient to single-modality drift and better suited to clinical decision support.
These platform advances unlock a range of near- to mid-term disease applications. Marker-agnostic lasing can support the diagnosis, risk stratification, and therapy monitoring of solid tumors across all stages without depending on fixed surface epitopes. Since optical phenotypes can be transferred with minimal or no retraining, tumor-agnostic deployment is a plausible possibility. On-chip sorting also enables the downstream culture and multi-omics of the very cells that triggered a lasing signature. In hematologic malignancies and rare cell disorders, mode structure and threshold shifts may indicate abnormal chromatin organization or nuclear architecture, opening avenues for label-free triage prior to targeted assays. In neurodegeneration, lasing and RL from minimally processed blood provide a scalable and repeatable readout of disease state and drug response. These methods can be extended to other protein-aggregation conditions where scattering and gain pathways are reshaped by misfolded species and vesicles. Finally, nucleolus-guided single-cell laser-emitting cytometry yields functional biomarkers of ribosome biogenesis stress, senescence, and metabolic rewiring. These phenotypes are central to both cancer progression and aging biology, and provide a photonic handle for screening nucleolar-targeted therapies or quantifying chemotherapy-induced nucleolar stress.
The path from proofs-of-concept to practice should begin with rigorous, multisite study designs that establish analytical and clinical validity. A priority should be fully blinded diagnostic studies of human blood that define analytical sensitivity and specificity across centers while systematically varying pre-analytical factors such as choice of anticoagulant, storage time and temperature, and solvent composition. Standardized hardware, shared phantom-based calibration, and physics-aware analytics will ensure comparable and defensible outcomes. These developments can transform LS from a highly sensitive laboratory probe into a clinically useful, marker-agnostic platform for disease detection and monitoring across oncology, neurology, and hematology.
Acronyms
- AD
-
Alzheimer’s disease
- ASE
-
amplified spontaneous emission
- BODIPY
-
boron-dipyrromethene
- BSA
-
bovine serum albumin
- CSF
-
Cerebrospinal fluid
- CTC
-
circulating tumor cells
- DFB
-
distributed feedback gratings
- DFB
-
distributed-feedback
- FDA
-
Food and Drug Administration
- FP
-
Fabry–Pérot mirror cavity
- FWHM
-
full width at half maximum
- G4
-
G-quadruplex
- GFP
-
green fluorescence protein
- HD
-
Huntington’s disease
- HTT
-
Huntingtin gene
- ICG
-
indocyanine green
- LS
-
lasing spectroscopy
- NAA
-
Nanoporous anodic alumina
- PBG
-
photonic bandgap
- PD
-
Parkinson’s disease
- Rho6G
-
Rhodamine 6G
- RhoB
-
Rhodamine B
- RL
-
random lasing
- ThT
-
Thioflavin T
- WGM
-
Whispering Gallery Modes
Acknowledgments
The authors thank Aleksandra Konopka for proofreading the manuscript. During the preparation of this manuscript, the authors used the generative AI tool ChatGPT (OpenAI, San Francisco, USA; accessed via https://chat.openai.com to assist with rephrasing and improving the clarity and grammar of some sentences. All suggestions generated by the tool were critically reviewed, edited, and approved by the authors, who take full responsibility for the content of this work. The tool was not used to generate original scientific results, to analyze data, or to create images or figures.
Financial support
The work was funded by the National Science Centre, Poland, under Sonata 17 ref. No: 2021/43/D/ST4/01741 and OPUS LAP ref. No: 2024/55/I/ST4/00958 granted to P.H.
Competing interests
The authors declare that they have no conflicts of interest.
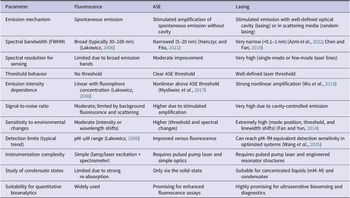
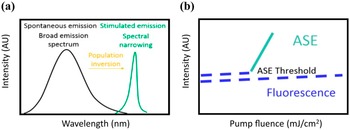
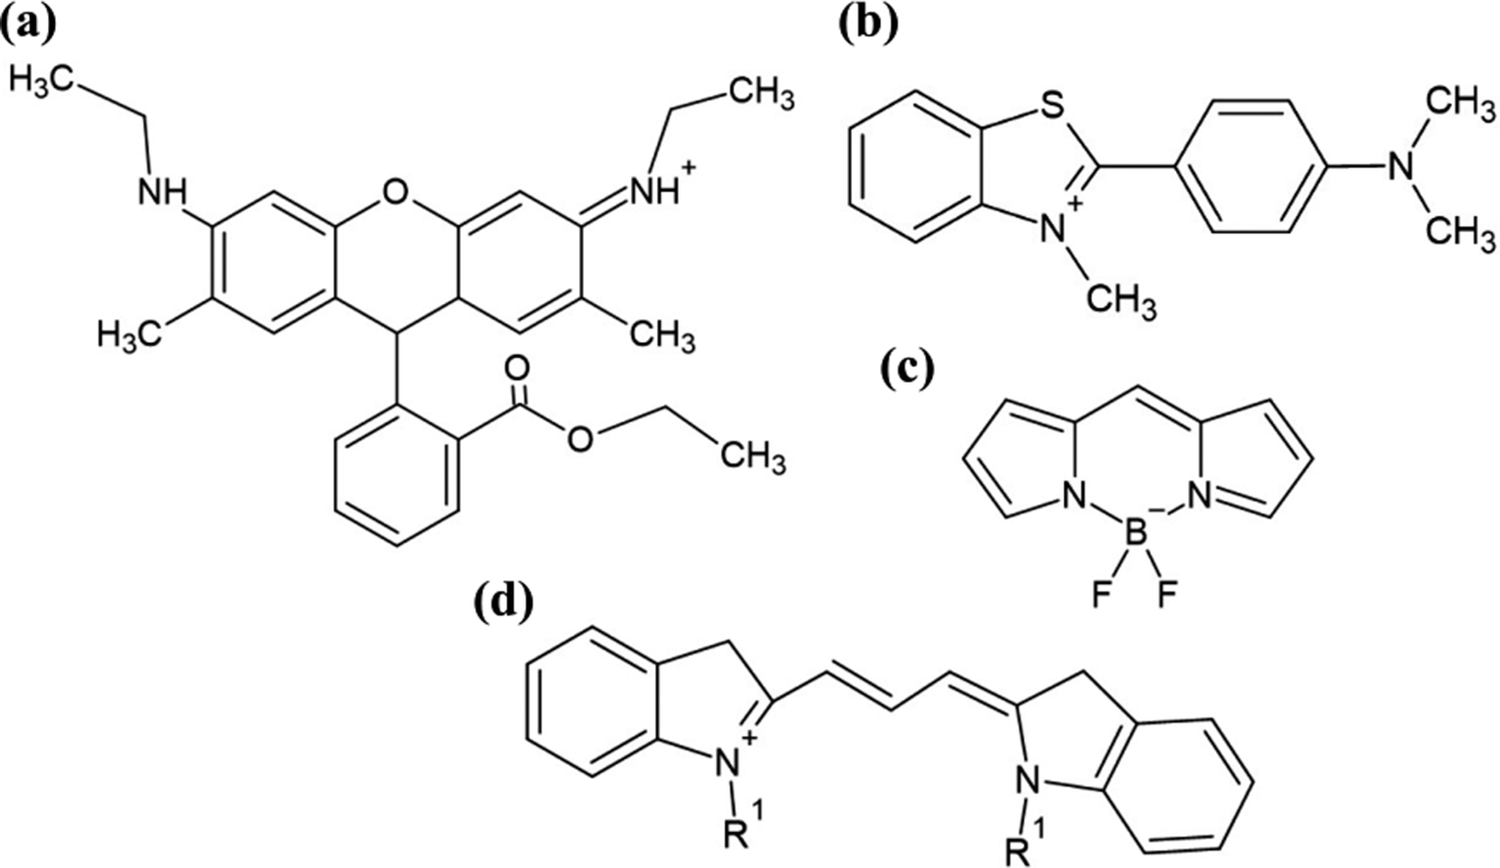
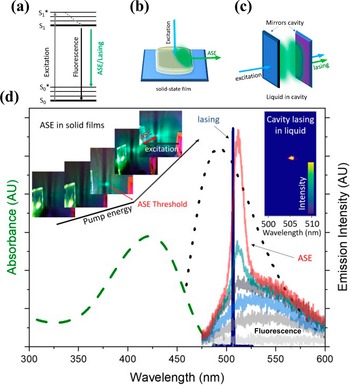
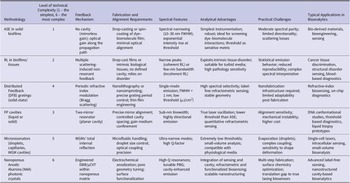
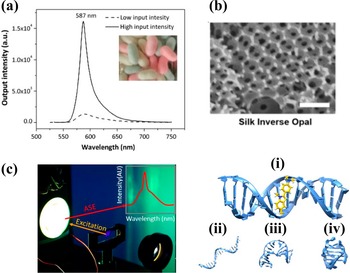
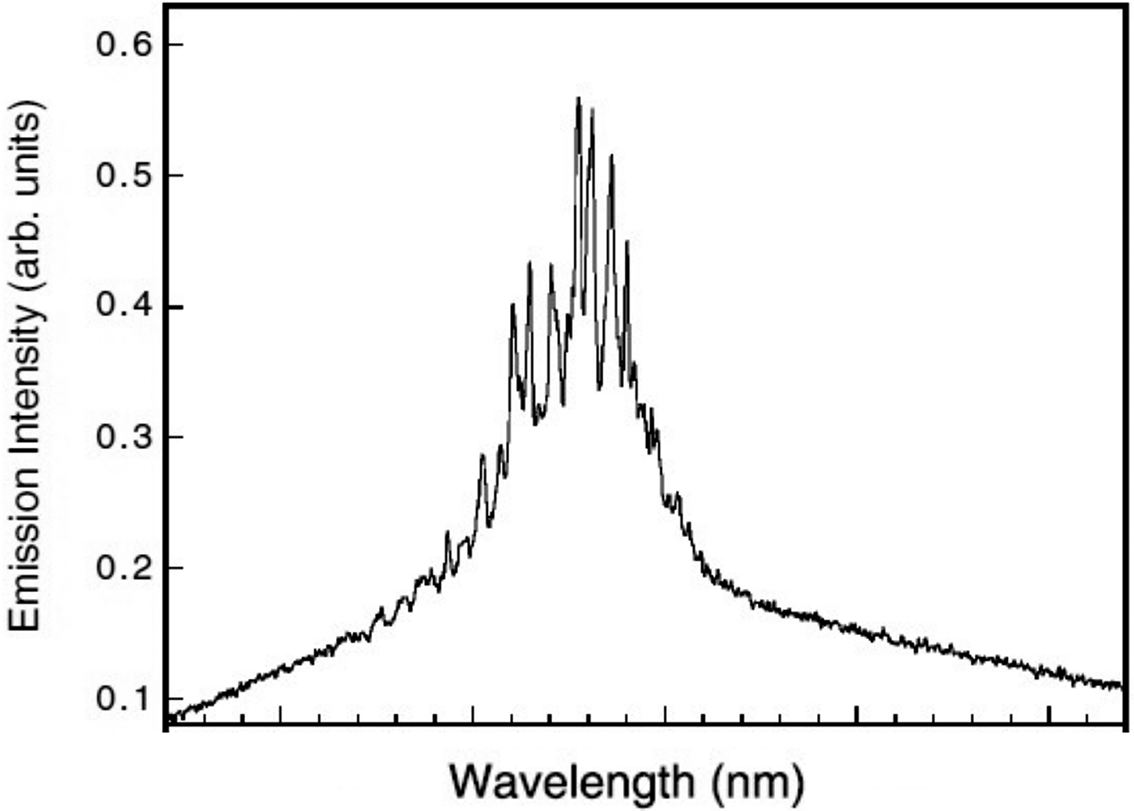

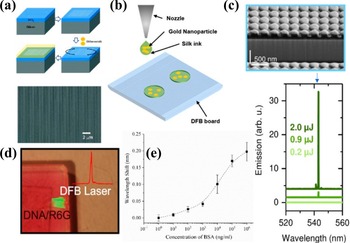
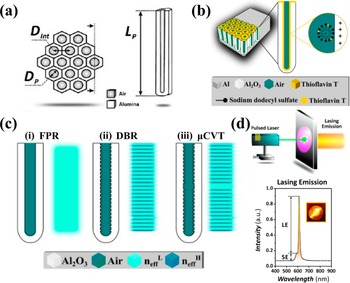
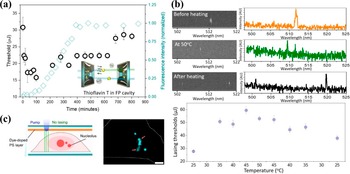
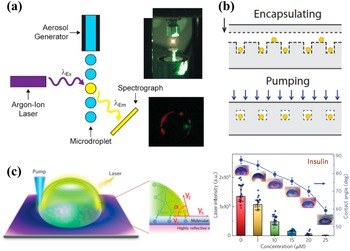
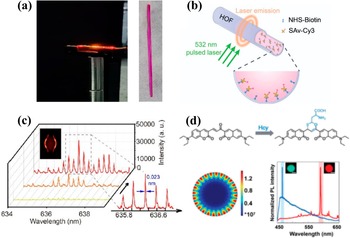
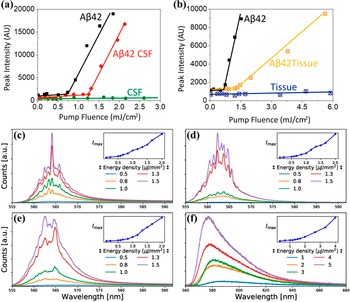
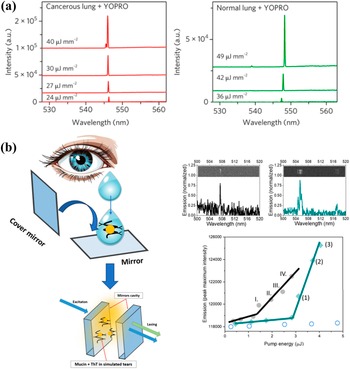
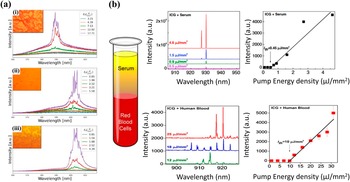

 Open access

