
Studies of democracy have dominated the field of comparative politics in recent years. Scholars working in this area of research have pursued wide-ranging projects aimed at assessing the causes and consequences of democratic political regimes. The foundation of any such project necessarily requires conceptualizing the political regime. Though defining democracy has proved particularly contentious, scholars have generally conceded that democratic regimes require “free and fair elections.” An important input in the legitimacy of democratic elections is the technology or instrument voters use to cast their ballots.
Yet in spite of its salience, some of the implications of voting technology remain understudied. For example, what are the effects of voting technology on candidates’ vote shares? Are the effects different for viable and nonviable candidates? Put differently, are the consequences of voting technology different for candidates with and without the resources to be electorally competitive? Why? This article leverages the gradual introduction of electronic voting in Brazil to address these questions.
Before the introduction of electronic voting in 1998, Brazilian voters cast their votes with paper ballots. Under the traditional paper ballot system, they selected their preferred presidential and gubernatorial candidates from a predetermined list; voters were not required to write out manually the names or electoral numbers of their preferred candidates. Under this system, voters cast their votes using what we call information-inclusive ballots. However, with the introduction of electronic voting technologies, Brazilians were no longer presented with presidential and gubernatorial candidate options from which to choose. Instead, they were required to input the electoral number associated with their preferred candidate in an electronic machine. Thus, voters using electronic voting technologies to cast their votes used ballots that did not list the competing candidates. We call ballots used under the electronic voting system information-exclusive ballots.
By definition, this transformation from information-inclusive to information-exclusive ballots imposed additional costs on voters. By removing cues from the ballot and requiring voters wishing to cast effective votes to enter the polling booth equipped with the electoral number of their preferred candidate, the cost of voting in executive elections increased (Nicolau Reference Nicolau2004).Footnote 1 However, in response to the introduction of electronic voting, candidates’ vote shares in executive elections became increasingly concentrated among viable candidates—candidates with the resources to be electorally competitive.
This study estimates the effects of voting technology on viable and nonviable candidates’ vote shares. To do so, it uses a rigorous empirical identification strategy afforded by the rule surrounding the introduction of electronic voting in the 1998 election. In 22 Brazilian states, municipalities with electorates greater than 40,500 used electronic voting and information-exclusive ballots, and municipalities with electorates less than 40,500 used traditional paper, information-inclusive ballots. The study uses a regression discontinuity design to compare the viable and nonviable candidates’ vote shares in municipalities with similar characteristics, differing only in the voting technologies used and ballot structures available to them. The empirical results demonstrate that the vote shares of viable candidates increased and, conversely, that the vote shares of nonviable candidates decreased. We interpret these changing patterns in candidates’ vote shares as a signal that viable candidates were better able to communicate the information that voters needed to cast valid electronic ballots than were their nonviable counterparts.
Previous work on electronic voting in Brazil suggests that increased concentration of votes among viable candidates cannot be attributed to a reduction in turnout or to an increase in the number of blank ballots cast (Nicolau Reference Nicolau2015; Fujiwara Reference Fujiwara2015). This article provides an alternative explanation. We argue that voters respond to information most easily accessible to them in campaigns. In a political environment such as Brazil’s, in which political campaign regulations make it easier for viable candidates to communicate relevant information to voters than for nonviable candidates, voters internalize the information provided to them by viable candidates and vote for these candidates.
In order to sustain this explanation, we make use of public opinion studies from the University of Campinas that asked survey respondents to report the electoral numbers of their preferred candidates. Our empirical work suggests that voters using electronic voting technologies and information-exclusive ballots (as compared to their counterparts using information-inclusive traditional paper ballots) better remembered their preferred candidates’ electoral numbers. Since voters using both traditional and electronic voting systems were similarly exposed to the media’s highlighting of candidates’ electoral numbers, we believe that our results confirm that voters casting their ballots electronically increasingly responded to viable candidates’ accessible campaign appeals.
This article proceeds as follows. A review of the literature on voting systems, and specifically electronic voting, situates this project among extant studies. The following section provides a brief overview of the introduction of electronic voting in Brazil and demonstrates the unique opportunity this case affords to study the electoral effects of introducing cost-imposing voting systems and ballots. The data and the regression discontinuity design methodology are described and the results presented. We then introduce a University of Campinas survey that affords the opportunity for a preliminary test of a plausible mechanism underlying our observed results. We describe the logistic regression analyses that we implement with the data from Campinas and present the results of these analyses. The final section discusses the findings and identifies areas for future research.
Voting Technology and Democracy
In situating this project among others aimed at assessing the effects of voting systems, this study privileges the literature that speaks directly to electronic voting. It highlights how the gradual introduction of this voting system in Brazil affords an opportunity to compare effects of different voting systems. It also thereby highlights voting technologies’ implications for proper democratic functioning.
Electronic voting involves the use of electronic technologies to cast or tabulate the results of electoral competitions. While many scholars concede that the use of electronic voting technologies dates back to the mid-twentieth century, the precise election that marks its debut is disputed.Footnote 2 Since the initial introduction of electronic voting, the United States has paved the path for advancements in this form of voting. Such advancements include the introduction of punch card counting machines in the 1960s, the adoption of direct-recording electronic (DRE) voting and ballot-scanning machines, and the invention of Internet voting in the later decades of the twentieth century.
In the 1990s and early 2000s, the use of these electronic technologies rapidly extended beyond the borders of the United States and took root in many countries around the world. Although most countries still use some form of paper ballot (Smith Reference Smith2009), approximately 30 countries have adopted some form of electronic voting for binding political elections and referenda (Barrat i Esteve et al. Reference Barrat i Esteve, Goldsmith and Turner2012). In general, less-developed countries look more favorably on electronic voting systems, whereas more-developed countries are more critical of these technologies (Barrat i Esteve et al. Reference Barrat i Esteve, Goldsmith and Turner2012; National Democratic Institute n.d.). This said, sentiment toward electronic voting technologies varies within as well as across global regions. In the context of the United States, Garner and Spolaore (Reference Garner and Spolaore2005) argue that while advanced voting technologies are more prevalent in developed counties, developed counties are less likely to adopt new technologies if their current systems are already sufficiently advanced.
Countries considering the use of electronic voting machines typically implement pilot studies before adopting these voting technologies universally (Smith Reference Smith2009). The learning that accompanies these trials, supplemented by other experiences, helps to inform countries’ decisionmaking on voting systems. The continual evolution of experiential and other forms of learning contributes to countries’ ephemeral commitment to voting technologies. For example, after more than 30 years of using electronic voting machines at polling stations, the Netherlands was persuaded by computer scientist hackers to discontinue their use (Smith Reference Smith2009).
As intimated by the Netherlands’ example, the adoption and functioning of electronic voting gave birth to a fierce debate regarding the positive and negative facets of the voting medium. Electronic voting technologies are generally championed for their “speed, accuracy, and cost” (Birch et al. Reference Birch, Cockshott and Renaud2014), reduced probability of generating vote-casting errors (Dee Reference Dee2007), ability to deal with complex elections, accessibility for voters with disabilities, limited required polling staff, accurate tabulation of results, and mechanisms to prevent fraud (Barrat i Esteve Reference Barrat i Esteve, Goldsmith and Turner2012; Fujiwara Reference Fujiwara2015). However, some scholars emphasize that a significant price accompanies these perceived benefits.
The costs of electronic voting include potential systemic glitches and lack of transparency in the “black box” and in the recording, counting, and tabulation of votes (Birch et al. Reference Birch, Cockshott and Renaud2014; Barrat i Esteve Reference Barrat i Esteve, Goldsmith and Turner2012). Kohno et al. argue that paperless electronic voting systems are susceptible to unauthorized privilege escalation, incorrect use of cryptography, vulnerabilities to network threats, and poor software development processes. They also claim that these voting systems are vulnerable to infiltration by both insiders and outsiders, and consequently they advocate voting systems with a “voter-verifiable audit trail” (Kohno et al. Reference Kohno, Stubblefield, Rubin and Wallach2004). Moreover, Herrnson et al. (Reference Herrnson, Niemi, Hanmer, Bederson, Conrad and Traugott2009) suggest that voters find some design features of electronic voting systems “annoying, perplexing, or disconcerting.”
Participants occupying both sides of this debate have supported their respective positions with case studies, anecdotes, and empirical work. In doing so, they have raised awareness of the important logistical consequences of voting systems used. However, the effects of voting technology choice extend beyond those identified above to actual election results. While some identified effects of voting systems, such as the reduction in invalid or “residual” votes, may be desirable, other plausible consequences, such as impacting candidates’ vote shares, may bias election results and hamper normative democratic functioning.
Political Effects of Voting System Choice
Scholars generally concede that the introduction of electronic voting has reduced the invalid vote share (Nicolau Reference Nicolau2015; Fujiwara Reference Fujiwara2015; Allers and Kooreman Reference Allers and Kooreman2008; Stewart Reference Stewart2006; Knack and Kropf Reference Knack and Kropf2003; Hanmer et al. Reference Hanmer, Park, Traugott, Niemi, Herrnson, Bederson and Conrad2010; Lott Reference Lott2009). However, some have uncovered important caveats to this relationship that account for election type and specific features of ballot design. For example, Ansolabehere and Stewart (Reference Ansolabehere and Stewart2005) argue that the rate of residual votes produced by voting systems varies across election types. Lott (Reference Lott2009) similarly clarifies the relationship between electronic voting and residual votes. In results that contrast with those of Ansolabehere and Stewart, he argues that electronic voting machines reduced residual voting for prominent races, such as presidential elections in the United States, but increased the number of invalid votes cast in down ticket races in elections in Ohio.
In the case of Brazil, Nicolau (Reference Nicolau2015) finds that while electronic voting reduced the number of blank and null votes for federal and state deputy contests, it increased the number of null votes cast for governor and president. Both Lott (Reference Lott2009) and Nicolau (Reference Nicolau2015) posit that disparate effects of electronic voting on residual votes can be attributed to the mandated order in which voters must cast their ballots on electronic voting machines. Though these caveats qualify the relationship between voting technology and the rate of invalid votes, this relationship proves unwavering for some elections.
For elections in which the relationship between voting technology and the invalid vote share is indisputably strong, we know little about the electoral reaction of voters wishing to cast invalid ballots when this option is removed. Desai and Lee (Reference Desai and Lee2017) moved this issue forward by studying the behavior of voters wishing to invalidate their votes when the option of casting a null vote is removed. Specifically, they studied the behavior of Indian voters who intentionally invalidated their votes in paper ballot systems under an electronic voting system that prevented casting a null vote (Desai and Lee Reference Desai and Lee2017). They found that the introduction of electronic voting led this subset of voters to cast their ballots for nonviable or nonestablishment parties. Thus, in the Indian case, the introduction of electronic voting is understood to have contributed to fragmentation among political parties. Our study considers the generalizability of this finding beyond the Indian context. Curiously, we find that Desai and Lee’s findings are unlikely to translate to the Brazilian experience.
In addition to influencing the number of residual votes, scholars have found that voting technologies affect candidates’ vote shares and, in extreme cases, election results. Much of the knowledge accumulated in this area stems from studies of the U.S. experience. The confusion stemming from the butterfly ballot used in Palm Beach County, Florida in the 2000 U.S. presidential election and the subsequent tight Republican victory provide persuasive evidence of the intimate relationship between ballot structure and electoral outcomes. Other studies suggest that this was not a one-off, unique case. Card and Moretti (Reference Card and Moretti2007) uncovered a positive correlation between touch screen voting and the level of electoral support for George W. Bush in the 2000 and 2004 presidential elections, and Dee (Reference Dee2007) found that the use of punch card systems in a California recall election increased the frequency of voters’ casting their ballots for minor candidates.
Scholars including Katz et al. (Reference Katz, Álvarez, Calvo, Escolar and Pomares2011) and Fujiwara (Reference Fujiwara2015) confirm that the electoral effects of voting systems extend beyond the United States. Using data from a field experiment conducted during the 2005 elections in Argentina, Katz et al. found that voting technologies and the way information is presented to voters via these disparate systems impacts political parties’ vote shares. For example, they found that the expected vote shares of three Argentine political parties (ARI, FPV, and PRO) increased by between 2.5 and 4.7 percent with electronic voting systems as opposed to traditional paper ballots. Fujiwara also found that voting technologies influence electoral outcomes in Brazil. He claims that the introduction of electronic voting politically empowered previously disenfranchised groups and consequently increased the vote shares of Brazilian political parties with leftist ideological persuasions (Fujiwara Reference Fujiwara2015).
The Brazilian Ballots
Brazil’s most recent democratic transition, in 1989, ushered in a recommitment to free and fair elections. Brazil is a federal republic, meaning that it holds elections at multiple levels of government. There are local elections for mayors and municipal representatives and federal elections for the president, governors, senators, and state and federal representatives. These elections are offset by two years.
With the reinstatement of competitive elections, traditional paper ballots were adopted as the medium through which voters cast their ballots. Under the traditional paper ballot system, voters were asked to indicate their preferred candidate from a predefined list in executive elections. The candidate who received the majority of votes assumed office. If no candidate obtained 50 percent of the vote in the first round, a runoff was held between the top two candidates. In mayoral elections, second-round runoffs were held only in municipalities with more than two hundred thousand voters. This system of voting with traditional paper ballots was used throughout the country from 1989 until 1996.
During this eight-year tenure, the traditional paper ballot voting system fomented political fraud. This fraud was manifest in a number of ways. According to Hidalgo and Nichter (Reference Hidalgo and Nichter2016, 452), “adding votes to tabulation sheets, claiming opposition votes were illegible, and filling out candidates’ names on blank ballots” were common political practices under the traditional system. Electronic voting was introduced in Brazil in an effort to curb these fraudulent activities and to facilitate and further entrench normative democratic practices in the country.
Electronic voting was initially adopted in Brazil in 1996 and was extended in subsequent elections. In the 1996 local elections, all municipalities with more than 200,000 voters and all state capitals used electronic voting. In the 1998 national elections, all municipalities in four Brazilian states used electronic voting, and municipalities with more than 40,500 voters in the remaining 22 states also did so. In all subsequent elections, electronic voting was used ubiquitously throughout Brazil.
The transformation from traditional paper ballots to electronic voting in Brazil has piqued the interest of several scholars. Specifically, scholars have studied its effects in the context of legislative elections (Hidalgo Reference Hidalgo2014; Fujiwara Reference Fujiwara2015; Zucco and Nicolau Reference Zucco and Nicolau2016). Under the traditional paper ballot system, voters in legislative elections were required to write out manually the name or electoral number associated with their preferred candidate. The immense number of candidates competing in Brazilian legislative elections made it impossible to list all competing candidates on the paper ballot.Footnote 3 This was, moreover, an especially arduous task for a country with an illiteracy rate of close to one-third. The introduction of electronic voting made voting easier for the illiterate segment of the population. Instead of being required to write their candidate’s name or number, voters simply input the electoral number of their preferred candidate on an electronic device. As a result, many scholars argue, the introduction of electronic voting facilitated voting in legislative elections, especially for illiterate citizens (Hidalgo Reference Hidalgo2014; Fujiwara Reference Fujiwara2015).
Scholars have provided convincing empirical evidence in support of this claim. Many demonstrate that the valid votes–to-turnout ratio increased and that the proportion of residual votes decreased with the transformation in voting technologies (Nicolau Reference Nicolau2002; Hidalgo Reference Hidalgo2014; Fujiwara Reference Fujiwara2015; Zucco and Nicolau Reference Zucco and Nicolau2016). Specifically, Fujiwara found that the valid votes–to-turnout ratio for state representatives increased by an impressive 12 percentage points with the introduction of electronic voting (Fujiwara Reference Fujiwara2015). Although much of the work in this area deduces that the effects were positive, Zucco and Nicolau (Reference Zucco and Nicolau2016) are less optimistic. They argue that the mandated order of ballots on electronic machines was counterintuitive, thereby confusing voters and causing an increase in the number of votes cast mistakenly (Zucco and Nicolau Reference Zucco and Nicolau2016).Footnote 4 Other than this recent work, however, there appears to be near-consensus that the introduction of electronic voting had positive effects in the realm of legislative elections.
Moving beyond legislative elections, this study argues that the introduction of electronic voting did not facilitate voting in executive elections as it did in legislative elections. The relatively small number of candidates competing in presidential and gubernatorial elections made it possible to list candidates on traditional paper ballots. Thus, under the traditional paper ballot system, voters were not required to write out the candidates’ names or electoral numbers. Brazilian voters merely needed to indicate their preferred candidate from a predetermined list.
As in legislative elections, electronic voting required voters to input the electoral number of their preferred presidential and gubernatorial candidates on an electronic machine. Thus, whereas previously voters could go to the polls without a predetermined presidential or gubernatorial choice, voters now were required to arrive at the polling station with the electoral number of their preferred candidate when casting their ballots electronically. The demands imposed on voters in executive elections thereby increased with the transformation of voting technologies (Nicolau Reference Nicolau2004).Footnote 5
In spite of those increased costs, we argue that voters increasingly voted for viable candidates. We posit that this took place because voters responded to easily accessible information conveyed in political campaigns. Given that political campaign regulations disproportionately benefit viable political candidates, it naturally follows that voters increasingly voted for viable as opposed to nonviable candidates.
In Brazil, the media provide the most effective campaign platform for politicians. Through this outlet, political candidates communicate their policies, their political programs, and their electoral numbers (Zucco and Nicolau Reference Zucco and Nicolau2016).Footnote 6 As Nicolau (Reference Nicolau1996) explains, media outlets are obligated to provide political candidates with free public access during election years. In the early years of Brazil’s present democratic period, one-third of the media time designated for political campaigns was equally distributed to political parties and coalitions, while the remaining two-thirds were allocated to political parties and coalitions proportionally on the basis of the number of seats held by the parties and coalitions in the Chamber of Deputies (Nicolau Reference Nicolau1996).Footnote 7 By design, viable candidates had more opportunities and time to communicate their electoral numbers—which voters needed to cast valid votes after the introduction of electronic voting—through media advertisements. The differences in media time allocated to viable and nonviable candidates are not negligible. For example, whereas Sergio Bueno and Ivan Frota, two nonviable candidates in the 1998 presidential election, were each allocated 30 seconds to share their campaign messages, Fernando Henrique Cardoso was allocated 12 minutes (see Horário eleitoral 1998).
In addition to receiving more “raw time” from the news media, viable candidates were more likely to have financial resources to use for alternative media of campaigning (e.g., flyers, stickers, T-shirts with politicians’ names and numbers on them). Given their greater exposure to viable candidates’ electoral numbers, it follows that voters would have had higher propensities to vote for these stronger candidates in executive elections.
Electronic voting was introduced gradually in Brazil, due to the limited availability of voting machines at the time. Through leveraging the gradual introduction of electronic voting with information-exclusive ballots and exploiting the fact that only some Brazilian municipalities and states used this type of ballot while others used traditional, information-inclusive paper ballots in the 1998 national elections, we can estimate the effect of voting technology on the vote shares of viable and nonviable candidates.
Electronic Voting Effects on Voter Choice
Electronic voting benefited viable candidates in Brazilian executive elections by design. The new voting system precluded the use of ballot cues to inform electoral decisions and required voters wishing to cast valid ballots to obtain information about their preferred candidates before going to the polls. Naturally, voters looked to campaign advertisements to acquire the electoral number of their preferred candidates. With greater access to media platforms and more financial resources for other types of campaigning, viable candidates were better able to distribute the political information required of voters casting their ballots electronically. Therefore, our expectation is that electronic voting disproportionally benefited viable candidates.
To operationalize candidate viability, we consider the performance and partisanship of candidates in all gubernatorial and presidential elections that occurred between 1989 and 1998 and ended in a runoff election. We consider all candidates who advanced to the runoff (i.e., first- and second-place candidates) to be viable. However, we also consider third-place candidates to be viable if they were affiliated with strong political parties. We distinguish strong parties from weak parties by the number of seats parties occupy in the national legislature; strong parties are among the top five parties most represented.
Of all third-place candidates considered viable by the partisan strength criterion, we identified the candidate with the lowest vote share and used this vote share as the threshold for viability.Footnote 8 The least successful third-place gubernatorial candidate affiliated with a strong party in the period considered—a Workers’ Party (PT) candidate in the 1998 gubernatorial elections in the state of Goiás—received 3.15 percent of the vote share.Footnote 9 Therefore we adopted 3.15 percent as the vote share threshold for viability. Although this cut point for viability may appear low, insofar as viability captures candidate access to resources to be electorally competitive, this operationalization bears out.
The logic behind this operationalization of candidate viability is twofold. First, viable candidates must have access to resources that help them to garner support among voters; given that these resources are largely distributed on the basis of partisanship, the party to which candidates belong distinguishes viable candidates from nonviable candidates. Second, viable candidates must be electorally competitive; they must be candidates for whom voters would cast sincere ballots. Logically, the first- and second-place candidates who advance to a runoff election are electorally competitive. However, Fujiwara’s logic (Reference Fujiwara2011) suggests that voters may also cast sincere ballots for third-place candidates. He argues that voters will vote sincerely and in favor of candidates polling in third place in the first of two electoral rounds, even if said candidates are not likely to win a subsequent runoff election. Therefore, both candidate placement and partisan affiliation play into our operationalization of candidate viability.
To study the relationship between voting technology and viable and nonviable candidates’ vote shares, we considered only the 22 states in which electronic voting was implemented in municipalities with more than 40,500 eligible voters and traditional paper ballot voting was implemented elsewhere. With this subset of Brazilian states, we estimate whether viable presidential and gubernatorial candidates were electorally advantaged in municipalities just below the 40,500 cut point (using traditional paper ballot systems and information-inclusive ballots), in comparison to municipalities just above the 40,500 cut point (using electronic voting and information-exclusive ballots).
Given the structure and features of our data, we rely on a regression discontinuity design (RDD).Footnote 10 For the proper application of RDD, the conditional expectation of the municipal share of votes to viable candidates in presidential and gubernatorial elections ought to be continuous when the number of eligible voters in the municipality approximates 40,500; in other words, electoral preferences ought not to systematically differ in accordance with municipality population size. Fujiwara (Reference Fujiwara2015) has already tested for the satisfaction of this assumption, and his contributions have validated that the discontinuity in presidential candidates’ vote shares at the 40,500 cutoff can be attributed solely to the use of different voting technologies around the cut point. The satisfaction of these critical conditions allows us to use an RDD.
If voters relied on ballot cues to vote in traditional paper ballot systems, we would expect that removing ballot cues would decrease nonviable candidates’ vote shares, given that information about nonviable candidates would become less accessible to voters than information about viable candidates. To test whether there is a relationship between voting technology and ballot structure and the vote shares of viable and nonviable candidates, we constructed an RDD based on the following least square estimation: $y_m=\mathrm\alpha+\lambda D+{\mathrm\beta}_1(r-c)+{\mathrm\beta}_2\lbrack D^\ast(r-c)\rbrack+\varepsilon_m$
Such that $(c-h)\leq r\leq(c+h),$
where ym is the share of the valid votes for viable presidential or gubernatorial candidates in each municipality m. Note that 1 – y is the vote share for nonviable candidates.
The estimated effect of electronic voting on the vote share for viable candidates is identical in magnitude but opposite in direction to the effect of electronic voting on the vote share for nonviable candidates. We constructed ym and 1 – ym with data from the Tribunal Superior Eleitoral (TSE). The variable c represents the cutoff (40,500 eligible voters).Footnote 11 The variable r captures the electorate size in municipality m. D is a dichotomous variable indicating whether or not a municipality uses electronic voting, and h represents the selected bandwidth. The variable εm contains the error term for each observation. Finally, λ shows the effect of electronic voting on the vote share for viable candidates and is the main variable of interest.
Results
The results provide strong evidence that electronic voting disproportionally benefited viable candidates and hurt nonviable candidates. Figure 1 presents graphical depictions of the effect of electorate size on viable candidates’ vote shares in the 1994 and 1998 presidential and gubernatorial elections. The plots associated with 1998 test our premise of a relationship between voting technology and viable and nonviable candidates’ vote shares, and the plots associated with the 1994 elections—in which all voters used traditional paper ballots—serve as placebo tests. The figure is constructed using a bandwidth of twenty thousand voters.Footnote 12
The Effect of Electronic Voting on Viable and Nonviable Candidates’ Vote Shares, 1994 and 1998
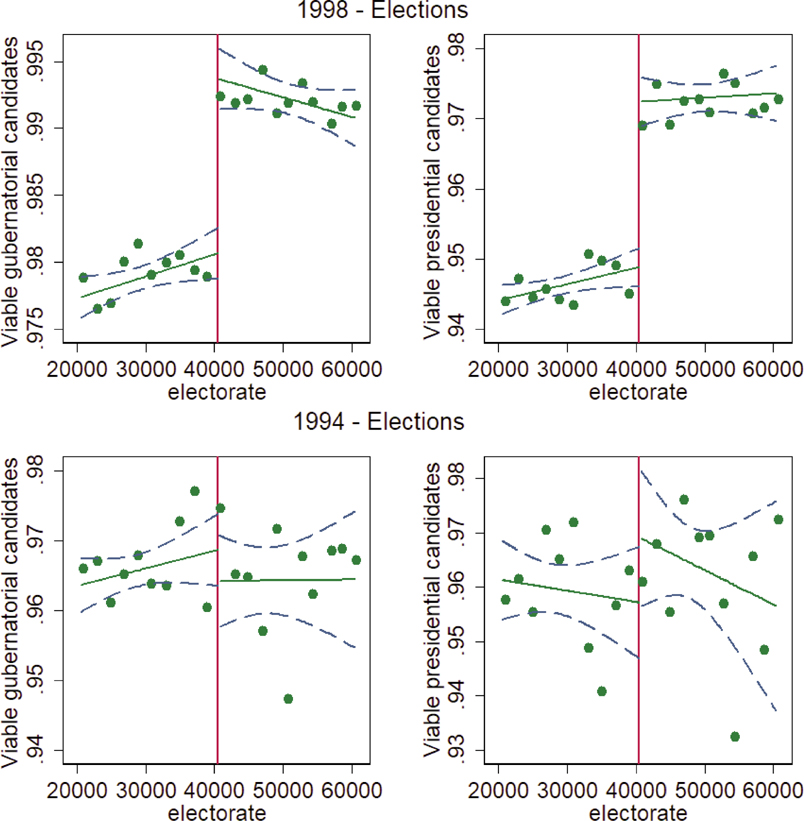
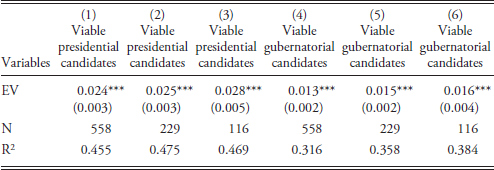
As hypothesized, viable candidates’ vote shares increased with the introduction of electronic voting. By definition, the vote shares of nonviable candidates decreased with the introduction of electronic voting. The 1994 placebo tests confirm that observed differences in viable candidates’ vote shares cannot be attributed to artifacts of electorate size but instead to the type of voting system used. Table 1 corroborates the findings from figure 1 and shows that the results are robust to different bandwidth specifications. We present only the results for viable candidates, given that the results for nonviable candidates are identical in magnitude, albeit with opposite directional signs. Our estimation shows that electronic voting increased (decreased) the vote share for viable (nonviable) presidential candidates by 2.5 p.p. and increased (decreased) the vote share for viable (nonviable) gubernatorial candidates by 1.4 p.p.
Estimated Electronic Voting (EV) Effect on the Vote Share of Viable Candidates for Executive Positions, 1998
*** p < 0.01
** p < 0.05
* p < 0.1
Standard errors in parentheses.
Notes: Columns 1 and 4 use a bandwidth of 20,000 voters. Columns 2 and 5 use a bandwidth of 10,000 voters. Columns 3 and 6 use a bandwidth of 5,000 voters.
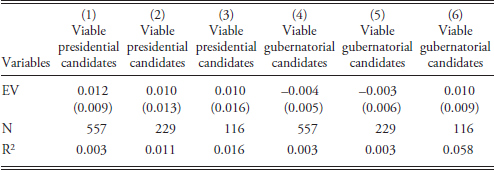
In an effort to increase the confidence placed in our results, we performed a placebo test and assessed whether viable and nonviable candidates’ vote shares are continuous around the 40,500 cut point in the 1994 elections. If electronic voting is driving our results, we should observe no differences in those vote shares, given that all municipalities used traditional paper ballots in the 1994 elections. Table 2 presents empirical evidence corroborating our hypothesis. The results of this placebo test strengthen our claim that the introduction of electronic voting resulted in the observed change in viable and nonviable candidates’ vote shares.
Estimated Electronic Voting (EV) Effect on the Vote Share of Viable Candidates for Executive Positions, 1994
*** p < 0.01
** p < 0.05
* p < 0.1
Standard errors in parentheses.
Notes: Columns 1 and 4 use a bandwidth of 20,000 voters. Columns 2 and 5 use a bandwidth of 10,000 voters. Columns 3 and 6 use a bandwidth of 5,000 voters.
The results provide evidence that the type of voting technology and ballot structure used impacted viable and nonviable candidates’ vote shares. Specifically, the transition from information-inclusive ballots cast in traditional paper ballot voting systems to information-exclusive ballots cast with electronic voting increased viable candidates’ vote shares and reduced nonviable candidates’ vote shares. Using placebo tests, we demonstrate that these observed effects cannot be attributed to peculiar facets of municipality size.
What explains the observed relationship between ballot structure and votes for viable and nonviable candidates? We argue that the electoral environment ushered in with electronic voting further privileged viable candidates. With more free media time and, probably, monetary resources to invest in other forms of political campaigning, viable candidates were better able to communicate to electronic voters the information that they needed to cast valid votes. Specifically, viable candidates had more opportunities to communicate their electoral numbers to voters than did their nonviable counterparts. The common electoral numbers of copartisan presidential and gubernatorial candidates are especially telling for this advantage. The exposure that electronic voters had to viable candidates’ campaigns led them increasingly to pay attention to and vote for viable, as opposed to nonviable, candidates.
Though voters voting under the traditional paper ballot system were similarly exposed to viable candidates’ campaigns, they did not similarly covet the political information provided in these campaigns. Because voters voting with traditional systems could cast valid votes without knowing their preferred candidates’ electoral numbers, these voters relied on viable candidates’ campaigns less heavily than did electronic voters. Consequently, traditional paper ballot voters were less susceptible to internalizing the electoral numbers of viable candidates than were electronic voters. Voters voting with traditional paper ballots were more likely to consider voting for nonviable candidates than were electronic voters, given that they were presented with these candidates as options on their ballots.
A critical element of the proposed explanation underlying our observed results is that voters using electronic voting were more likely to know viable candidates’ electoral numbers than voters using traditional paper ballots. This suggests that viable candidates were not only better positioned to communicate their electoral numbers to voters but that their efforts to do so resonated with electronic voters.
Do voters using electronic voting remember better their candidate’s number? To examine the viability of the explanation underlying our observed results, we assessed whether voters’ propensities to remember that number vary as a function of the technology they use to cast their ballot. We anticipate that the proportion of voters remembering the electoral number of their most preferred candidate ought to increase in municipalities using electronic voting and information-exclusive ballots, compared to municipalities using traditional information-inclusive paper ballots.
Electoral Campaigns and Connecting with Voters
Public opinion surveys compiled by the University of Campinas (CESOP) provide a unique opportunity to test whether the proportion of voters remembering the electoral number of their most preferred candidate was influenced by the voting system used. The CESOP surveys relevant to this project asked voters in three Brazilian states (Rio Grande do Sul, Minas Gerais, and São Paulo) to report the electoral number of their preferred candidate in the second round of voting. These data considered only viable candidates.Footnote 13
Moreover, since the presidential election in 1998 was decided in the first round, survey respondents were not asked to report the electoral number of their preferred presidential candidate in the second round. Therefore, we can only assess voters’ memorization of viable candidates’ electoral numbers across municipalities for gubernatorial races.Footnote 14 With CESOP’s data, we estimated logistic regression analyses assessing the effect of electronic voting and information-exclusive ballots on voters’ abilities to remember the electoral number associated with their preferred candidate.
We created a dichotomous dependent variable that captured whether voters correctly remembered their preferred gubernatorial candidate’s electoral number. The CESOP survey asked voters both to name their preferred gubernatorial candidate and to report the electoral number associated with that candidate. Respondents who provided the candidate’s correct electoral number received a value of 1; those who provided an electoral number that did not correspond with the candidate’s name (i.e., provided the number of a different candidate or of no candidate) received a value of 0. We dropped from the analysis voters who did not know for whom they were voting, as well as voters who indicated their intention to cast a null vote.Footnote 15 We believe that individuals receiving a value of 1 for this dichotomous dependent variable would be more likely to ingest candidates’ electoral numbers highlighted in political campaigns than their counterparts receiving a value of 0 for this variable.
Our main independent variable is also a dichotomous variable. This variable captures whether survey respondents resided in a municipality using electronic voting. This independent dichotomous variable takes on a value of 1 when respondents resided in a municipality using electronic voting and 0 otherwise. We used robust standard errors and controlled for monthly income and education.
If our prediction is correct, the elimination of ballot cues with the introduction of electronic voting should make it easier for electronic voters to access information about viable candidates. Given that electronic voters require information made available to them in campaigns (which traditional paper ballot voters do not), we expect that electronic voters will be more likely than nonelectronic voters to remember viable candidates’ electoral numbers.
In the context of the CESOP surveys, it follows that voters in municipalities using electronic voting will exhibit higher propensities to remember correctly their preferred candidates’ electoral numbers.
Empirical Evidence
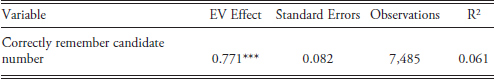
Table 3 displays the logistic regression analyses assessing the relationship between voting technology and voters’ correct memorizations of preferred candidates’ electoral numbers.
Estimated Electronic Voting (EV) Effect on Voters’ Propensities to Remember the Electoral Number of Their Preferred Gubernatorial Candidate
*** p < 0.01
** p < 0.05
* p < 0.1
Notes: The regression uses state-level fixed effects. Robust standard errors are clustered at the municipality level and rounded to three decimal digits. The regression controls for monthly income and education but does not list the coefficients associated with these variables.
These results provide confirmatory evidence that voters in municipalities using electronic voting and information-exclusive ballots were significantly more likely to correctly remember their preferred candidates’ electoral numbers—more specifically, 2.16 times more likely.Footnote 16 We interpret this as a signal that the information viable candidates communicated in their campaigns resonated with electronic voters to a greater extent than with traditional paper ballot voters.
We argue that the results of this analysis cannot be attributed to the diverging importance of candidates’ electoral numbers across voting systems. Candidates’ electoral numbers were relevant not only for voters casting their ballots electronically but also for voters voting with traditional information-inclusive paper ballots. We use descriptive statistics, included in table 4, to further support the notion that candidates’ electoral numbers were relevant for all voters, regardless of the voting system used in their municipalities. Table 4 presents the proportion of voters in São Paulo, Minas Gerais, and Rio Grande do Sul who remembered their preferred gubernatorial candidate’s electoral number one day before the second round of the election. These proportions are computed separately for voters using traditional paper ballots and electronic voting.
Electronic Voting (EV) Impact on Remembering Candidate’s Number
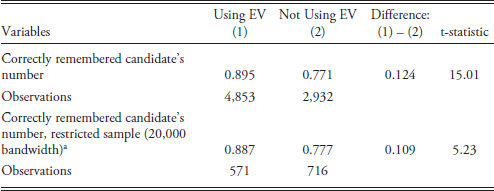
a Analysis contains only municipalities with 20,500–60,500 eligible voters.
As table 4 shows, approximately 77 percent of candidates using traditional paper ballots correctly reported their preferred candidate’s electoral number. This percentage persists regardless of whether the calculation deriving it accounts for the entire population voting with traditional paper ballots or for only a subset of the population voting with traditional paper ballots, lying close to a bandwidth of 20,000 (which is the same as the one used in the RDD analysis).Footnote 17 This high percentage dispels suspicions that electoral numbers were relevant purely for the subset of the population voting electronically. Instead, it confirms that candidates’ electoral numbers were relevant for all voters, regardless of the voting technology they used to cast their votes, but that they were better remembered by voters voting electronically.
In sum, our results confirm that voters casting their ballots with electronic technologies were more likely to remember the electoral numbers associated with their preferred gubernatorial candidates than their counterparts in municipalities using traditional paper ballots. We argue that this finding substantiates the notion that voters voting electronically were more likely to ingest their preferred viable candidate’s electoral number as highlighted in political campaigns. Ideally, we would also be able to compare the extent to which electronic voters remembered both viable and nonviable candidates’ electoral numbers. Although this information is not available, we strongly anticipate that voters would have had greater propensities to remember the electoral numbers of viable, as opposed to nonviable, candidates, due to their greater access to campaign resources and positions of electoral contention.
Conclusions
Many countries have adopted and experimented with different types of voting systems in recent years as more information has come to light about the functioning and effects of these systems. Electronic voting is one such system that has emerged as a consistent contender in debates over optimal voting systems (Katz et al. Reference Katz, Álvarez, Calvo, Escolar and Pomares2011). Proponents of electronic voting argue that it improves vote counting, decreases fraud, and facilitates the act of voting for voters. However, some studies suggest that achieving these objectives comes at the expense of electoral fairness and neutrality. This article profitably advances understanding of the effects of voting systems by studying the relationship between voting systems and viable and nonviable candidates’ vote shares.
We exploited the causal leverage afforded by the gradual introduction of electronic voting in Brazil. We found that the type of voting system used has implications for viable and nonviable candidates’ vote shares and that electronic voting produces electorally biased results. Specifically, the shift away from traditional paper ballots and the introduction of electronic voting increased viable candidates’ vote shares and decreased nonviable candidates’ vote shares. We posit that this result can be attributed to disparities in viable and nonviable candidates’ abilities to effectively campaign and entrench their electoral numbers in the minds of voters. Moreover, this study has demonstrated that electronic voters internalized candidates’ electoral numbers made available to them in viable candidates’ campaigns to a greater extent than did traditional paper ballot voters.
Although this article responds to some unanswered questions, it also stimulates others to be addressed in the future. Forthcoming scholarship would do well to consider whether the results stemming from the Brazilian case are upheld beyond the country’s borders, and if not, under what specific conditions voting systems influence candidates’ vote shares. However, before embarking on a broader crossnational project, there is more work to be done within Brazil’s borders. For example, future scholarship should test the endurance of the observed effects of electronic voting on candidates’ vote shares beyond the first elections in which electronic voting was used on a large scale. This would equip us with further confidence that the impetus of observed changes was, in fact, voting technology and ballot structure.
Although there are several unalterable characteristics that predispose some countries to be more democratic and others to be less democratic, voting systems and ballot structures are not among them. Voting systems and ballot structures are malleable. Given that disparate voting systems and ballot structures can have the propensity to influence candidates’ vote shares, it is imperative that scholars, politicians, and policymakers alike work together not only to uncover the effects of different voting systems but to act on the results of these studies to engineer voting systems that privilege electoral fairness and neutrality.


