Introduction
Background
Very little is known about the internal structure of the Earth’s ice masses despite there being a requirement for such information, for example to direct palaeoclimatic interpretations of ice cores and to direct and calibrate numerical models of ice-mass motion. Although ice cores are logistically demanding to acquire, and spatial coverage is correspondingly limited, the information gained from multi-parameter measurements of their physical properties is invaluable. Ice properties routinely analyzed include chemical composition (including isotopes, ions, acids and elements), electrical conductivity (a surrogate for total solute concentration) and permittivity, included gas concentration and composition, ice crystallography, and included insoluble dust and debris. The visual stratigraphy of ice cores, as revealed by automated core scanning, forms a central component of these multi-parameter investigations. For example, the chronology of the GISP2 Greenland core (Reference MeeseMeese and others, 1997) was largely based on its visual stratigraphy (Reference AlleyAlley and others, 1997). More recently, Reference SvenssonSvensson and others (2005) reported a very high-resolution (118 pixels per cm of core length) visual stratigraphy of the North Greenland Ice Core Project (NorthGRIP) core. These data have been important both in developing the initial chronology of the NorthGRIP core (e.g. NorthGRIP Members, 2004) and in its subsequent refinement (e.g. Reference RasmussenRasmussen and others, 2006).
In addition to imaging ice cores directly, video has been used to log and investigate the boreholes resulting from coring. For example, Reference Hawley, Waddington, Alley and TaylorHawley and others (2003) developed a processing scheme to allow a visual borehole log to be generated from directional video of a borehole drilled at Siple Dome, Antarctica. Annual layers identified on the basis of this log compared well with those measured directly on a nearby ice core (Reference Hawley, Waddington, Alley and TaylorHawley and others, 2003). More recently, annual layers revealed by borehole video were found to correspond closely with density-based logs in the near-surface zone of the Greenland ice sheet (Reference Hawley and MorrisHawley and Morris, 2006). Similarly, backscattered laser light was used by Reference Bramall, Bay, Woschnagg, Rohde and PriceBramall and others (2005) to identify volcanic dust layers and variations in bubble concentration in an Antarctic IceCube (an international neutrino observatory project for astrophysics installed at South Pole: http:www.icecube.wisc.edu/science/) borehole. Importantly, borehole video is not restricted to boreholes created by coring because the technique can be used in boreholes with irregular walls, allowing the far more widely available steam and hot-water drilled boreholes to be investigated. For example, Reference PohjolaPohjola (1994) used borehole video to investigate the englacial structure of the ablation area of polythermal Storglaciären, Sweden, revealing numerous bubble-rich and bubble-poor ice layers within the glacier. The total void space within the glacier was estimated from the video analysis to be ∼1.3% of the thickness of the glacier. Reference Fountain, Jacobel, Schlichting and JanssonFountain and others (2005) recently extended this research to the investigation of englacial drainage, concluding that most englacial meltwater at Storglaciären is routed through fractures rather than conduits. Elsewhere, Reference Harper and HumphreyHarper and Humphrey (1995) and Reference Copland, Harbor and SharpCopland and others (1997) both identified a general decrease in the bubble content of temperate englacial ice with depth on the basis of borehole video at Worthington Glacier, USA, and Haut Glacier d’Arolla, Switzerland, respectively.
Despite the evident value of ice-core visual stratigraphy and of directional borehole video, both techniques would be complemented by a borehole camera system with the capacity to provide a complete and continuous orientated image of the entire borehole wall. Importantly, optical televiewing (OPTV), recently developed for terrestrial mining-based applications, has the capacity to provide precisely this information. The aims of this paper are twofold: (i) to outline the principles of OPTV; and (ii) to summarize the potential contribution of the technique to future borehole-based cryospheric research. The latter will be illustrated with reference to the first use of OPTV in an ice borehole. Detailed comparison of this OPTV image with the physical properties of the ice core will be undertaken as part of a future study and is not reported here.
OPTV description
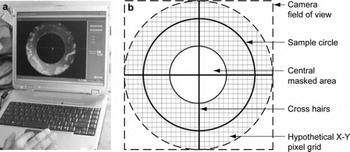
OPTV provides a continuous, orientated, 360°, true-colour optical image of the wall of the water- or air-filled borehole along which the instrument is raised or lowered. The instrument described here (manufactured and marketed by Robertson Geologging Ltd, Deganwy, UK), which is 2.03 m long and 50 mm in diameter, achieves this by recording continuously an annular image of the adjacent borehole wall projected by a hyperboidal mirror onto the 768 × 494 element charge-coupled device (CCD) sensor of the camera (Fig. 1). The borehole wall is illuminated by a circular array of white light-emitting diodes (LEDs) mounted in the head of the sensor. The voltage supplied to these LEDs can be controlled from the surface in order to optimize their luminosity and the exposure of the borehole wall. The instrument is raised or lowered along the borehole by winch, which, along with the OPTV probe, relays dip, dip-direction and image data back to a data logger (RG USB Micrologger 2) located at the ice surface (Fig. 2). The pressure rating of the probe is currently 1000 psi (∼700 m of water or ∼6.9 MPa), but this is nominal and could be increased with adaptation. Orientation and dip are provided by a triaxial magnetometer and three accelerometers mounted within the probe. The logger transfers probe and winch data to a surface computer which is also used to optimize probe settings in real time. As well as LED illumination (above), these settings include selecting which pixel row is recorded from a broad annulus reflected by the hyperboidal mirror (Fig. 3). Precise winch control allows the sensor to acquire image data at a maximum vertical resolution of 1 mm and a maximum horizontal resolution of 720 pixels per row, the latter pre-set by the user. Data acquisition and transfer at these high resolutions requires a maximum probe transit speed along the borehole of ∼1 m min−1. Faster transit speeds currently require the sacrifice of vertical and/or lateral resolution. The horizontal resolution of 720 pixels per row equates to a horizontal pixel dimension of ∼0.8 mm in a borehole of diameter 180 mm, typical of large-scale ice-coring programmes. Centralizers and additional lighting would effectively allow OPTV to be used in any glacier borehole of diameter greater than ∼70 mm.
The OPTV probe head illustrating the principles of image acquisition presented as (a) a photograph and (b) a line drawing.
OPTV system components (a) in operation on the surface of Glacier de Tsanfleuron, Switzerland, and (b) illustrated as a line drawing
Annular image of the borehole wall adjacent to the hyperboidal mirror during OPTV logging presented as (a) a photograph of control and acquisition computer screen and (b) a line drawing illustrating sample circle selection.
In yielding a complete image of the entire borehole wall, the OPTV provides valuable information that can complement both directional borehole video and visual core stratigraphy. Below, these potential applications are summarized and illustrated with reference to OPTV logging of a test borehole drilled at Glacier de Tsanfleuron, Switzerland.
OPTV test study: Glacier de Tsanfleuron, Switzerland
The potential of OPTV to investigate glaciers is illustrated here with reference to a test borehole that was logged at Glacier de Tsanfleuron in September 2007. The glacier, which covers ∼3 km2 between ∼2450 and ∼2900 m a.s.l. (Fig. 4), has been widely studied, particularly in terms of processes occurring at its ice–bedrock interface and the physical character and deformation of its constituent ice facies. The OPTV test borehole described here is ∼21.25 m long and was drilled in September 2007 by an adapted US Army Snow, Ice and Permafrost Research Establishment (SIPRE) corer (borehole diameter ∼100 mm; horizontal OPTV resolution ∼0.44 mm). Although the borehole is located in the long-term accumulation area of the glacier, climate change has resulted in long-term net mass loss at this location. Consequently, the ice cored as part of this study is recently firnified and falls into the Type 1 category as defined by Reference Hubbard, Tison, Janssens and SpiroHubbard and others (2000), i.e. the ice is stratified in terms of variations in the concentration of small regular bubbles. Reference Tison, Hubbard, Maltman, Hubbard and HambreyTison and Hubbard (2000) further reported that ice in this area is typically fine-grained (∼2 mm in diameter) and is composed of relatively uniform polygonal crystals. It also has a relatively uniform crystal fabric, but a weak single maximum may develop orthogonal to the glacier surface at depths of tens of metres.
Outline map of Glacier de Tsanfleuron, Switzerland, marking the location of the 21.25 m-long test borehole (marked BH1).
OPTV Applications and Results
Raw OPTV log
Raw (unrolled) OPTV logs are presented as rectangular images of borehole walls, orientated such that images progress north–east–south–west–north from left to right. Such logs provide the basis for investigating the general character of the borehole and of the ice types and structures that intersect the borehole. Here, any planar layer that intersects the borehole appears as a sinusoid, the amplitude of which scales with the dip of the layer (described in more detail below). In contrast, any feature that partially intercepts the borehole wall appears on the unrolled image as a zone rather than a layer.
The unrolled image of the Tsanfleuron borehole (Fig. 5) extends from a depth of ∼1.75 m at the top of the log (the depth below the ice surface of the hyperboidal mirror when logging commenced) to 21.15 m at its base (∼10 cm above the actual base of the borehole due to the rubber buffer located below the hyperboidal mirror on the OPTV probe). The borehole water level is at a depth of 3.04 m, indicated by over-exposure of the image above this level. A dark line orientated approximately vertically is also visible on the image, caused by the ice being scored by a ‘core dog’ protruding from the coring barrel. This first application of OPTV in an ice mass successfully reveals a high degree of variability in ice appearance: the borehole is intersected by a variety of contrasting ice inclusions and layers. The most prevalent of these is a quasi-horizontal layering, of variable thickness, defined by alternating light and dark bands. Given the location of this core in the long-term accumulation area of the glacier, it is most probable that these layers are primary stratification, with the light layers representing winter accumulation and the darker layers representing the influence of summer conditions. For example, it is likely that the darker layer located between ∼5.5 and ∼5.7 m depth represents a bubble-poor summer layer, possibly also containing wind-blown dust. This layer contrasts markedly with lighter, bubble-rich and dust-poor, winter layers located both above and below it.
Unrolled image of the test borehole logged by OPTV at Glacier de Tsanfleuron. The log illustrates numerous ice types, zones and layers. Planar layers appear on unrolled logs as sinusoids (explained in the text and Fig. 7).
Other contrasting ice types appear elsewhere in the log; for example, included gas appears to aggregate into clouds of larger bubbles between ∼19.7 and ∼19.9 m (Fig. 6). All of these ice features can be analyzed further in terms of their structural orientation and classification (see below).
Detail of relatively large bubbles forming a zone between ∼19.7 and ∼19.9 m in the unrolled borehole image presented in Figure 5. This zone contrasts with the strongly planar layers revealed elsewhere in the OPTV log.
Orientating and classifying ice structures
OPTV provides a powerful means of classifying and mapping planar ice structures because any visible plane that intersects a borehole wall appears as a unique sinusoidal trace on the unrolled OPTV image. The orientation and dip of each such plane can be recreated from the phase and amplitude of its associated sinusoid (Fig. 7). Accordingly, a horizontal plane (such as primary stratification at a spreading dome) appears on the OPTV image as a straight horizontal line. At the other extreme, a vertical planar layer orientated east–west (such as a crevasse trace) appears on the raw OPTV image as two vertical lines: the first located one-quarter of the way across the image (corresponding to the intersection at an azimuth of 90°) and the other located three-quarters of the way across the image (corresponding to the intersection at an azimuth of 270°). Structural analysis of an entire OPTV log allows all such planes to be located, characterized in terms of their thickness and appearance, and their orientations to be logged. Where such an analysis reveals the presence of families of ice layers, those structural generations can be subclassified for subsequent interpretation.
Illustration of the relationship between a planar layer intersecting an OPTV-logged borehole and its resulting sinusoid in the unrolled OPTV image: (a) plane intersecting the logged borehole at a steep angle of dip and a dip-direction of 270° (eastto-west); (b) representation of the plane as a sinusoid in the unrolled OPTV wall image (sinusoid amplitude = ρ and phase θ = 180°).
The unrolled OPTV image from Glacier de Tsanfleuron, presented in Figure 5, has been analyzed using dedicated image-analysis software (RGL Dip), and the resulting structural overlays are presented in Figure 8. Semi-automated feature-picking, based on the three-dimensional (3D) Hough transform method (e.g. Reference Glossop, Lisboa, Russell, Siddans and JonesGlossop and others, 1999; Reference SiddansSiddans, 2002), has resulted in the identification of three contrasting structural units, the orientations of which are plotted stereographically in Figure 9. Unit 1 is most common, comprising alternating sub-horizontal layers of relatively bubble-rich and bubble-poor ice, typically being 10−1 m thick and having a smooth inter-layer contact. We interpret this unit as being primary stratification (above). Unit 2 (of which only one occurrence was recorded) is bubble-free and of similar sub-horizontal orientation to unit 1. However, this unit contrasts with unit 1 in that it is only ∼1 mm thick and is un-conformable with adjacent ice layers. The location and structural interpretation of this layer at a depth of ∼16.55 m are shown in detail in Figure 10. On the basis of these characteristics we interpret unit 2 as a summer/autumn erosion surface. Unit 3, of which there are three occurrences, forms a 10−1 m-thick layer of bubble-rich ice located over bubble-poor ice. Although unit 3 is of similar thickness and physical character to unit 1, they differ in that unit 3 dips steeply across-glacier, by 47° to 57°, cutting across both other units. For example, a notable sinusoid formed from this unit is located between the depths of ∼15.5 and ∼16.0 m. A detailed image of this zone (Fig. 10) indicates a local dip of 55° (upper boundary 57°, lower boundary 53°) in a direction of 334° (i.e. approximately across-glacier, dipping towards the centre line).
Unrolled, low-resolution image of the test borehole presented in Figure 5 with structural unit boundaries (generated by semi-automatic feature picking) overlaid. Three structural units are identified and described in the text. Unit 1 is sub-horizontal (its sinusoids are of low amplitude) and most prevalent; unit 2 lies at a similarly low angle and occurs only once in the log, at ∼16.55 m; and unit 3 dips more steeply (its sinusoid has a larger amplitude than the other units) and occurs three times in the OPTV log.
Lower-hemisphere stereographic plot of the poles to each of the planes identified in the structural interpretation illustrated in Figure 8.
Detail of the unrolled OPTV log presented in Figure 8, illustrating overlaid structural boundaries (left) and orientation data and interpretations (right) between 15.0 and 16.6 m depth. This section contains all three of the structural units identified in the core.
The physical characteristics of unit 3 are broadly consistent with at least two possible modes of formation, as healed crevasses or as incipient foliation. Both the frequency and orientation of unit 3 are consistent with formation as ‘early-stage’ longitudinal foliation and, although little is known about the detailed relationship between primary stratification and longitudinal foliation, Reference HambreyHambrey (1977) argued that the two can coexist. Longitudinal foliation is also strongly evident on the surface of the glacier from ∼100 m down-slope of the test borehole (where it is revealed by differential erosion of the glacier surface). In contrast, the hypothesis that unit 3 forms as healed crevasses is weakened by the absence of bilateral symmetry in the layer and by the absence of a thin plane in the centre of each layer (the ice–air contact in the former crevasse). There is also a disparity between the high frequency of unit 3 occurrences in the logged borehole and the relative paucity of crevasses located up-flow of it. Moreover, where cracks or crevasses are present at the glacier surface they are orientated across-glacier, not along-glacier. The balance of available evidence therefore favours interpreting unit 3 as longitudinal foliation. This interpretation is tentative and could be tested by acquiring OPTV logs from a wider spatial area of the glacier, allowing investigation of systematic spatial variations in the character of the layer and its relationship with the primary stratification.
Core reconstruction and orientation
A potentially important by-product of OPTV is that any unrolled borehole log can be inverted to recreate an image of the ice core removed from that borehole. Indeed, such virtual cores can be recreated from boreholes drilled by hot water or steam, from which no actual core was recovered. In the same way, virtual core segments can be recreated for borehole sections from which the original core has been damaged or lost, or from which an englacial void resulted in the recovery of no core. Importantly, the OPTV-derived core image is orientated, providing for the first time a simple means of orientating retrieved ice cores. To achieve this, a common, directional feature needs to be identifiable in both the actual core and the virtual core. Such features could be provided by any spatially irregular inclusion or non-horizontal planar layer.
The detailed unrolled OPTV log of the borehole between the depths of ∼15 m and ∼16 m (Fig. 10) is wrapped and presented as its equivalent virtual-core section in Figure 11. Here, the most notable directional features are the two steeply dipping layers, classified as structural unit 3, forming the lower half of the section. The dip direction of these layers, clearly visible from the ice contrast in the re-created core, could be compared directly with images of the actual core to allow the latter to be orientated at this location. Once several such sections of the actual core have been orientated in this way, it may be possible to interpolate between them on the basis of either matching adjacent core ends, where they break unevenly, or aligning directional continuities present within the core (e.g. ice crystal elongation or fabric).
Four perspective views of the orientated virtual core (with the structural boundaries overlaid) reconstructed from the unrolled OPTV image illustrated in Figure 10.
Discussion and Summary
Digital OPTV, developed recently for geological exploration, allows the acquisition of a complete geometrically accurate image of a borehole wall. We have demonstrated, through applying OPTV for the first time in an ice borehole, that the technique has the potential to make several valuable contributions to glaciology. Such contributions could be made in the broad areas outlined below:
Ice-mass structure
In providing visual logs of borehole walls, OPTV allows annual layers to be counted, contrasting ice types to be identified and classified, and englacial voids to be recorded. The televiewer has a maximum pixel resolution of ∼1 mm in the horizontal (depending on the horizontal sampling frequency selected and the borehole diameter) and 1 mm in the vertical (depending on the rate of logging). Close inspection of the borehole images reported above indicates that variations in ice appearance can be detected down to an ‘effective resolution’ of a few pixels in the vertical (typically <5 mm), consistent with spatial sampling theory (Reference Jenkins and WattsJenkins and Watts, 1968). This is supported by the power spectral density of along-core image brightness (Fig. 12), which indicates no dramatic drop-off in response at any spatial frequency up to 1000 m−1 (i.e. all wavelengths >1 mm). However, since this response is specific to the physical features intercepted by this borehole, the ability of the technique to count annual layers in longer boreholes can be evaluated only by empirical comparison with independent data such as continuous-flow chemical analysis. That said, our preliminary findings from Glacier de Tsanfleuron provide no reason to believe that OPTV should not trace annual layers in larger ice sheets successfully to depths at which the annual layer thickness decreases to millimetres (subject to those layers still yielding an optical signal).
Spectral density of brightness recorded by OPTV plotted as a function of spatial frequency along the Glacier de Tsanfleuron borehole.
In providing structural orientation data for ice layers, OPTV allows the local 3-D structure of any ice mass to be reconstructed. Application of OPTV in multiple boreholes has the potential to allow that local 3-D structure to be extrapolated more widely, for example along a flowline, across a transverse transect, or, ultimately, to the scale of the complete ice mass. The last of these would allow all internal flow pathways and chronostratigraphic horizons to be recreated.
Englacial and subglacial debris transport
Where a borehole intersects englacial debris, OPTV has the capacity to yield information relating to the thickness and location of the debris-rich zone (which would be unknown, for example, in a borehole drilled by hot water). The mm-scale resolution of OPTV should also allow individual clasts to be investigated by image-analysis software, potentially allowing quantification of size, shape and, possibly, surface wear characteristics.
Englacial hydrology
OPTV borehole logs can provide spatially accurate information relating to englacial voids and channels, whether air- or water-filled. Where such channels are directional and only partially intersect the borehole, their size, dip and dip-direction can also be reconstructed.
Ice-core analysis
In providing a geometrically accurate image of a borehole wall, OPTV could be used to complement initial core logging (e.g. helping to identify any damaged or missing core sections) and subsequent detailed stratigraphic investigations (e.g. cross-correlating annual layers). The virtual ice core recreated from the OPTV log can also be used to orientate the actual core wherever an identifiable directional feature is common to both records.
Acknowledgements
We thank two anonymous reviewers for their helpful comments, Glacier 3000 for logistical assistance, and the UK Natural Environment Research Council (grant NER/A/S/2002/00607) and the Royal Society (RG081254) for financial assistance.