


The political psychology of emotions has attracted growing interest within recent scholarship. Political scientists have found emotions to be substantially linked to attitudes about issues ranging from public health, terrorism, immigration, and climate change to commitment to democratic norms and political participation (e.g., Bethany and Gadarian, Reference Albertson and Gadarian2015; Valentino et al., Reference Valentino, Wayne and Oceno2018; Phoenix, Reference Phoenix2019; Webster, Reference Webster2020; Webster and Albertson, Reference Webster and Albertson2022). This heightened attention to the implications of emotions raises the question of how to accurately measure emotions in surveys. While social desirability bias has been identified in self-reports related to several sensitive issues or inappropriate behaviors, it remains an open question whether and to what extent emotional expression is also subject to social desirability, and how those pressures can bias survey estimates.
By drawing on impression management theory and the disclosure decision model (DDM), I argue that participants tend to underreport their emotions, particularly negatively valenced ones. In other words, they can be expected to conceal either the type of emotional predisposition they experience or its intensity due to social pressures and concerns about social sanctions. These pressures are more likely to emerge in interviewer-administered than self-administered studies, as the presence of an interviewer makes social desirability demands particularly salient. I test these expectations by relying on the American National Election Studies (ANES), which interviewed their nationally representative sample in 2012 and 2016 according to both an interviewer-and a self-administered mode.
1. Survey mode effects and social desirability response bias
An extensive literature shows that survey mode can impact responses and, accordingly, the accuracy of estimates. In particular, the presence of an interviewer likely leads to differences in how questions are perceived and, consequently, the answers that are provided, even if questions are identically worded (e.g., Chang and Krosnick, Reference Chang and Krosnick2009, Reference Chang and Krosnick2010). Interview mode may influence response quality for various reasons (e.g., Holbrook et al., Reference Holbrook, Green and Krosnick2003). Among them, social desirability response bias has been found to be closely linked to interview modality (e.g., Atkeson, Adams, and Alvarez Reference Atkeson, Adams and Alvarez2014).
Social desirability bias refers to the tendency to admit to more socially acceptable behaviors and attitudes while denying or downplaying more unacceptable ones (e.g., Krumpal, Reference Krumpal2013). This bias ensues from the undesirability not of a survey question, but rather of a particular answer. Research demonstrates that response undesirability varies by interview mode. Specifically, self-administration (i.e., mail or Web) has been found to reduce social desirability bias as compared to interviewer-administration (i.e., telephone or face-to-face) across a broad set of contexts (e.g., Heerwegh, Reference Heerwegh2009). Indeed, respondents may feel pressure to avoid violations of social norms or deviations from expectations when social approval needs and self-presentation concerns are made salient by the presence of an interviewer (e.g., Turnley and Bolino, Reference Turnley and Bolino2001; Tourangeau and Yan, Reference Tourangeau and Yan2007). The likelihood of disclosing personal information honestly and completely tends to increase as the “social distance” between interviewee and interviewer increases (e.g., Holbrook et al., Reference Holbrook, Green and Krosnick2003).
The range of issues that have been found to be significantly affected by social desirability response bias is large and diverse. Respondents are more likely to underreport their negative academic performance over the phone than on the Web (Kreuter et al., Reference Kreuter, Presser and Tourangeau2008), overreport religious attendance when interviewed in person (Smith, Reference Smith1998), underreport same-gender sexual orientation and experiences (Villarroel et al., Reference Villarroel, Turner, Eggleston, Al-Tayyib, Rogers, Roman, Cooley and Gordek2006) as well as STD symptoms and diagnoses (Villarroel et al., Reference Villarroel, Turner, Rogers, Roman, Cooley, Steinberg, Eggleston and Chromy2008) when interviewed by a human telephone interviewer, underreport illegal drug usage with personal interviewing (Roger et al., Reference Tourangeau, Rips and Rasinsky2000), underreport depression and anxiety symptoms when interviewed in person (Epstein, Barker, and Kroutil Reference Epstein, Barker and Kroutil2001), display more extreme response styles in person than online (Mingnan et al., Reference Liu, Conrad and Lee2017), and provide warmer feeling thermometer ratings in face-to-face than web surveys (Liu and Wang, Reference Liu and Wang2015). Regarding political behavior, voters are more likely to overreport turnout over the phone than on the Internet (Holbrook and Krosnick, Reference Holbrook and Krosnick2010), and to display confidence in the electoral process, trust in government, and self-efficacy in interviewer-administered than self-administered surveys (Atkeson, Adams, and Alvarez Reference Atkeson, Adams and Alvarez2014). With respect to racial attitudes, white participants exhibit lower levels of old-fashioned racial prejudice, symbolic racism, and opposition to race-conscious policies in face-to-face than mail surveys (Krysan, Reference Krysan1998). Analogously, U.S.-born Latino, Black, and white respondents report lower racial animus in the face-to-face than Internet mode (Marisa and Michael Alvarez, Reference Abrajano and Alvarez2018).
2. Social desirability and emotional expression
While there is vast evidence of survey mode effects and social desirability bias in many issue areas, and the study of emotions has recently received considerable attention in political science (e.g., Bethany and Gadarian, Reference Albertson and Gadarian2015; Valentino et al., Reference Valentino, Wayne and Oceno2018; Phoenix, Reference Phoenix2019; Webster, Reference Webster2020; Webster and Albertson, Reference Webster and Albertson2022), it remains largely unclear whether and to what extent social desirability bias affects the measurement of emotional expression in surveys. Relying on impression management theory and the disclosure decision model, I argue that the expression of emotions tends to be subject to social desirability bias. Specifically, the theory of impression management (i.e., self-presentation) posits that individuals put effort into influencing the images others have of them and creating favorable impressions (e.g., Turnley and Bolino, Reference Turnley and Bolino2001; Cong et al., Reference Ye, Fulton and Tourangeau2011). Analogously, according to the DDM, risks of social rejection and/or discomfort likely influence the extent to which respondents are willing to share intense emotions (e.g., Omarzu, Reference Omarzu2000). As it pertains to emotion, social desirability thus refers to perceived appropriateness (Shields, Reference Shields2002). Emotions are considered inappropriate when the individual fails to follow or meet social norms and expectations either qualitatively—by showing the “incorrect” emotion for the situation—or quantitatively—by showing the “correct” emotion but with “incorrect” intensity for the circumstances (Shields, Reference Shields2005). In other words, we can expect individuals to strategically regulate their emotions based on situational or social needs, thus creating a gap between the emotions they feel internally and the ones they show to observers and interviewers (Kleef et al., Reference Van Kleef and Côté2022). This raises the question of what type and level of emotions are more likely to be viewed as inappropriate.
Overall, the expression of negative emotions and, particularly, high-intensity negative emotions is perceived as significantly less appropriate than that of positive or low-intensity negative ones (e.g., Hajo and Brett, Reference Adam and Brett2018; Waterloo et al., Reference Waterloo, Baumgartner, Peter and Valkenburg2018). Indeed, individuals who disclose more negative emotions are often viewed as maladjusted and unstable (Caltabiano and Smithson, Reference Caltabiano and Smithson1983). The reason may be that more negative and intense emotional disclosures are usually interpreted as implying higher intimacy and, accordingly, as too intimate for interactions with strangers (Howell and Conway, Reference Howell and Conway1990). We can thus expect individuals to feel social pressure to present themselves in a more socially desirable manner by withholding negative affect (Dejonckheere and Bastian, Reference Dejonckheere and Bastian2021). Importantly, the perceived inappropriateness and social undesirability of negative emotions, especially intense ones, is likely to bias survey responses when a stranger administers the questions, but such bias remains empirically unexplored with few exceptions (e.g., Cong et al., Reference Ye, Fulton and Tourangeau2011). I therefore propose to test the following hypotheses.
H1: The expression of negatively valenced emotions (i.e., anger and fear), particularly intensely negative ones, will be subject to significantly more social desirability bias in interviewer-administered than self-administered survey modes.
H2: The expression of positively valenced emotions (i.e., hope and pride) will not be subject to significantly more social desirability bias in interviewer-administered than self-administered survey modes.
3. Data and empirical strategy
To test these hypotheses, I rely on the 2012 and 2016 ANES. I focus on these surveys in the first instance because they carry several items measuring negative emotions—anger and fear—as well as positive ones—hope and pride—toward the major parties’ presidential candidates: Barack Obama and Mitt Romney in 2012, and Hillary Clinton and Donald Trump in 2016.Footnote 1 Furthermore, importantly, the ANES collected data in both years based on a two-mode design: interviewer-administered or face-to-face (i.e., FTF; n = 2,054 in 2012 and 1,180 in 2016) and self-administered or on the Internet (i.e., Web, n = 3,860 in 2012 and 3,090 in 2016).Footnote 2 Both studies use national address-based probability sampling but the Web samples stem from different panels and present highly different response rates: the 2012 Internet participants were drawn from the GfK KnowledgePanel with a response rate of 2%, while the 2016 Internet participants were drawn directly by ANES with a response rate of 44% based on AAPOR Response Rate 1.
It is also important to point out that there are significant differences in sample composition between the face-to-face and the online modes in both the 2012 and the 2016 ANES (e.g., Guggenheim et al., Reference Guggenheim, McClain, Nardis and Brader2019). Those differences are likely attributable to differential nonresponse rates and nonresponse bias (e.g., Hillygus et al., Reference Hillygus, Valentino, Vavreck, Barretto and Layman2017). To address and statistically account for such sample-related mode differences, I have added several control variables to the regression analyses that are likely to be associated with sample differences, including sociodemographics, interest in the campaigns, interest in government and political affairs, and political knowledge. Further, all the analyses employ weights and the regression models in Figures 3–6 rely on design-consistent variance (i.e., Taylor series) estimation to obtain correct standard errors.
4. Results
First, I examine the means of self-reported negative emotions—anger and fear—and positive emotions—hope and pride—by party ID and survey mode (FTF vs. Web). In particular, I analyze negative emotions against the out-party candidate and positive emotions toward the in-party candidate. Figures 1 and 2 display those results for 2012 and 2016, respectively. In 2012 (Figure 1), as expected according to H1, both Democrats and Republicans report feeling largely and significantly (p < .05 for Democrats, p < .01 for Republicans) angrier—by nearly 7 percentage points and over 8 points, respectively—and significantly (p < .05 for Democrats, p < .001 for Republicans) more afraid—by over 6 points and over 13 points, respectively—when interviewed online. The same pattern is evident in 2016 (Figure 2), when respondents display overall more intense emotions than four years prior. In the Web mode, Democrats express significantly (p < .001) higher levels of both anger—by over 9 percentage points—and fear—by over 10 points—toward Trump, whereas Republicans express significantly (p < .01) stronger anger—by about 8 points—and significantly (p < .05) stronger fear—by over 7 points—toward Clinton, thus providing further support for H1.
Mean levels of emotions by survey mode in 2012.

Mean levels of emotions by survey mode in 2016.
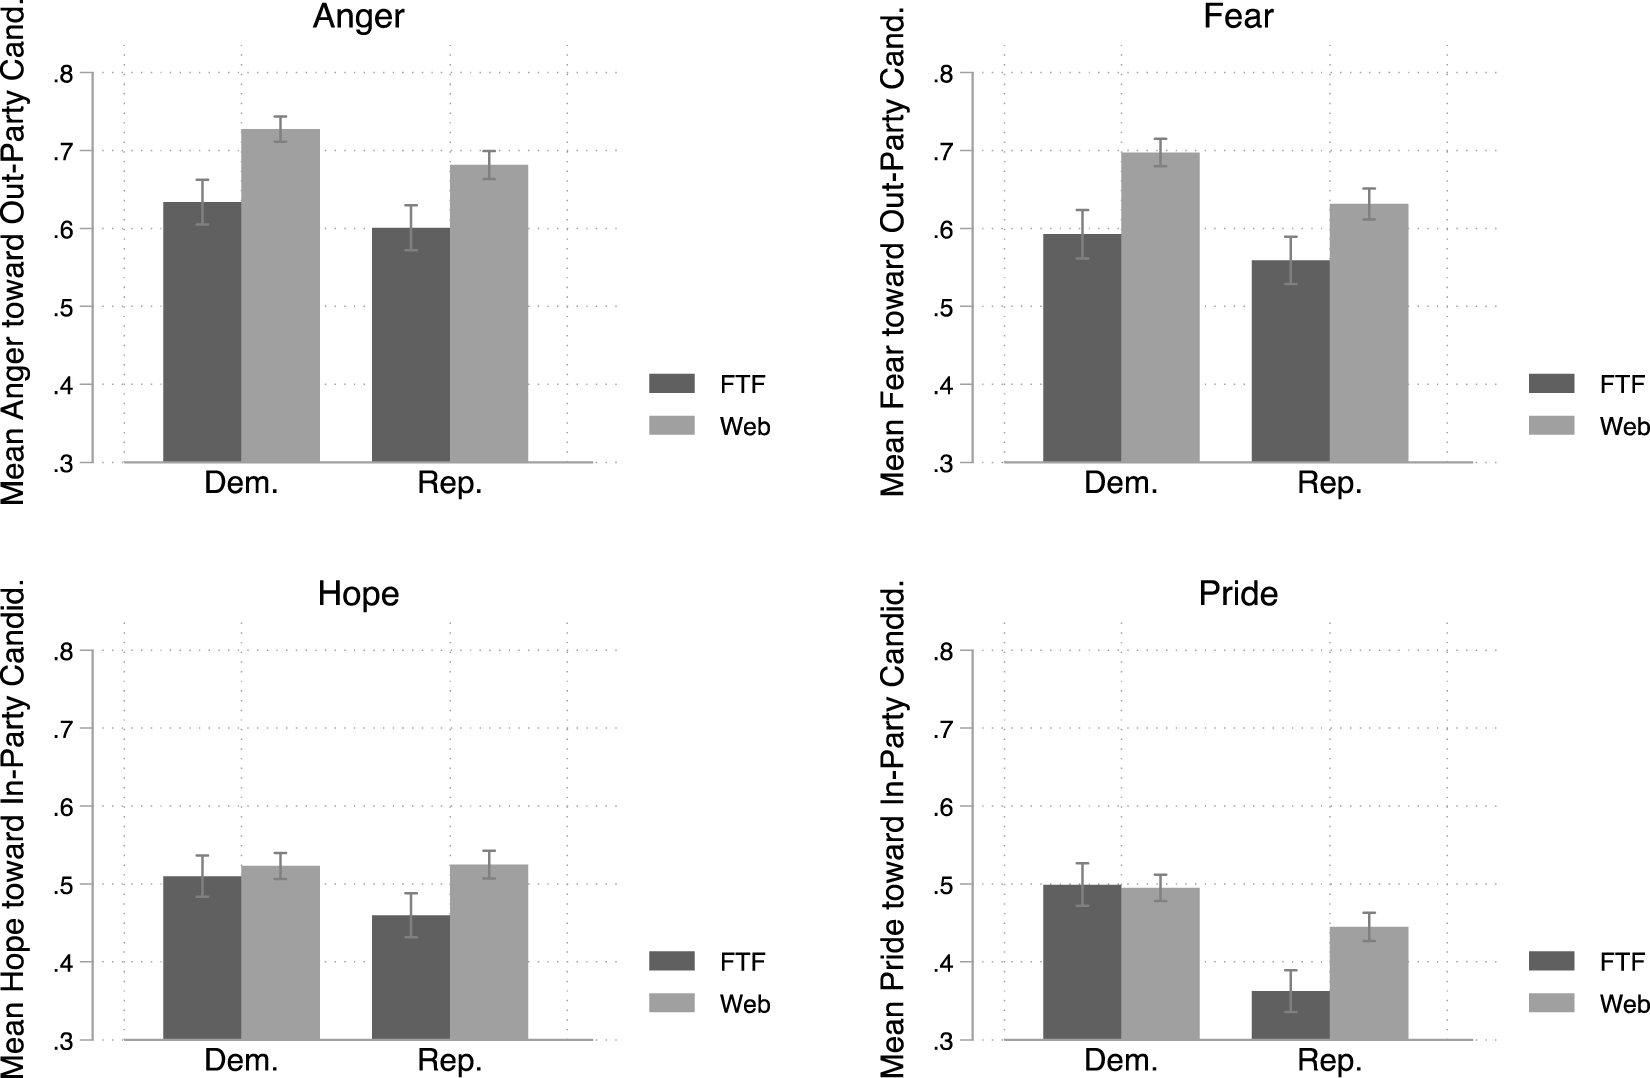
As for positive emotions, H2 receives only partial support. In 2012 (Figure 1), average levels of hope and pride toward Romney are statistically indistinguishable by mode among Republicans. However, Democrats report significantly (p < .05) higher hope—by nearly 5 percentage points—and higher pride—by about 5 points—toward Obama when interviewed in person. The reverse pattern emerges in 2016. While there is no significant difference by mode in Democrats’ hope and pride, Republicans express stronger positive emotions—by almost 7 percentage points (p < .05) for hope, and over 8 points (p < .01) for pride—toward Trump online. Perceptions of appropriateness can help us interpret these findings. It was likely desirable for Democrats to openly display enthusiasm toward the first African American president and Democratic incumbent in 2012. On the contrary, expressing enthusiasm toward a candidate whose statements and behaviors were often characterized as racist and sexist during the 2016 campaign may have exposed Republicans to discomfort in front of an interviewer.
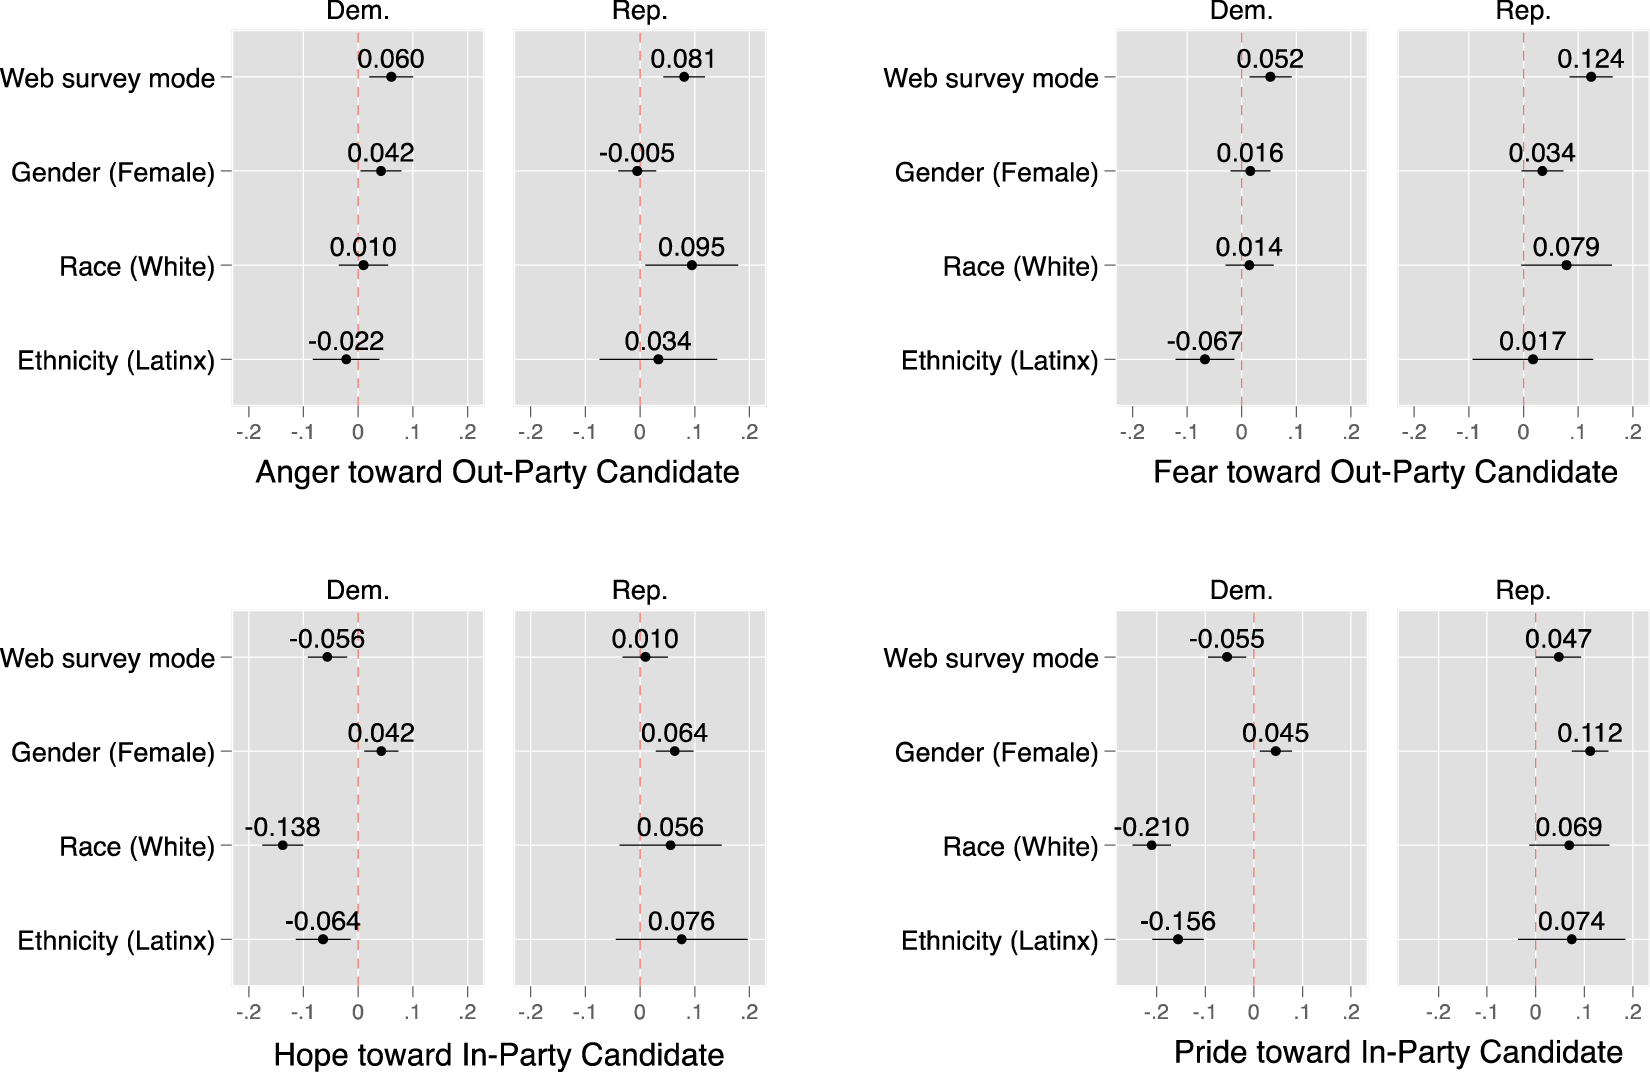
Next, I estimate the association between survey mode and intensity of self-reported emotions while controlling for gender, race, ethnicity, age, education, household income, campaign interest, political interest, and political knowledge.Footnote 3 Figures 3 and 4 display coefficients from OLS models in which the dependent variables are the four emotions—anger and fear toward the out-party candidate, and hope and pride toward the in-party one—experienced by partisans in 2012 and 2016, respectively.
Predicting emotions toward presidential candidates by survey mode in 2012.
Predicting emotions toward presidential candidates by survey mode in 2016.
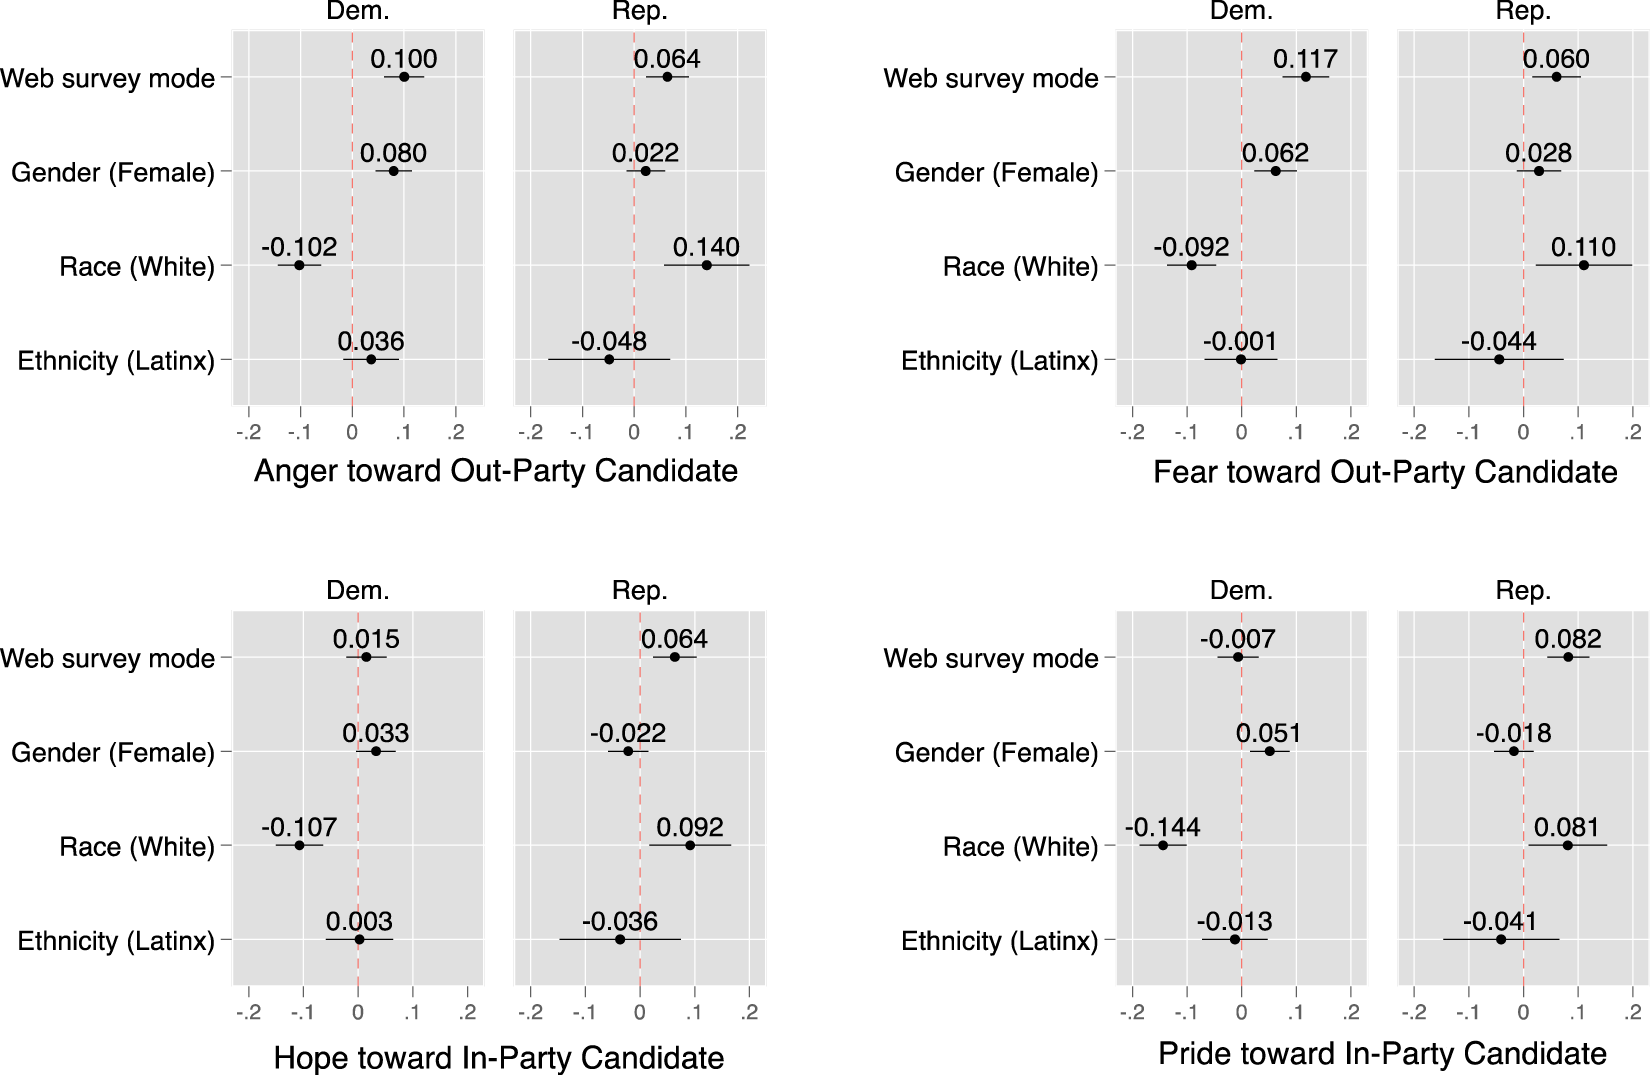
Across both years and parties, the Web mode is positively and significantly associated with acknowledging stronger negative emotions, as predicted by H1. Specifically, taking the survey on the Internet translates into Democrats reporting more anger by 6 percentage points (p < .01) and fear by 5 points (p < .01), and Republicans reporting more anger by 8 points (p < .001) and fear by 12 points (p < .001) in 2012. A similar pattern is present in 2016: when interviewed online, Democrats appear 10 percentage points (p < .001) angrier and 12 points (p < .001) more afraid, while Republicans admit to being 6 points (p < .01) angrier and 6 points (p < .01) more afraid.
The results related to positive emotions are overall consistent with Figures 1–2. In 2012 (Figure 3), survey mode is a significant predictor of hope and pride levels expressed by Democrats, and only pride by Republicans. Specifically, being interviewed in person is associated with reporting more intense hope by 6 percentage points (p < .01) and pride by 5 points (p < .01) toward Obama among Democrats. Although this runs counter to H2, it suggests that Democratic voters likely deemed it socially desirable to display enthusiasm toward Obama in front of an interviewer. On the other hand, in 2016 (Figure 4), survey mode significantly predicts stronger positive emotions among Republicans, but not among Democrats. Self-administration is associated with Republicans expressing more hope by 6 percentage points (p < .01) and pride by 8 points (p < .001) toward Trump. In other words, Republicans’ positive emotions in 2016 mirror, in reverse, those of Democrats in 2012: they likely expected to face disapproval by expressing intense enthusiasm toward Trump in an in-person setting.
As a robustness check, I have conducted the same analyses by measuring the dependent variables—self-reported anger, fear, hope, and pride—as the average of each emotion reported toward both presidential candidates (see Appendix C). The results remain largely consistent.
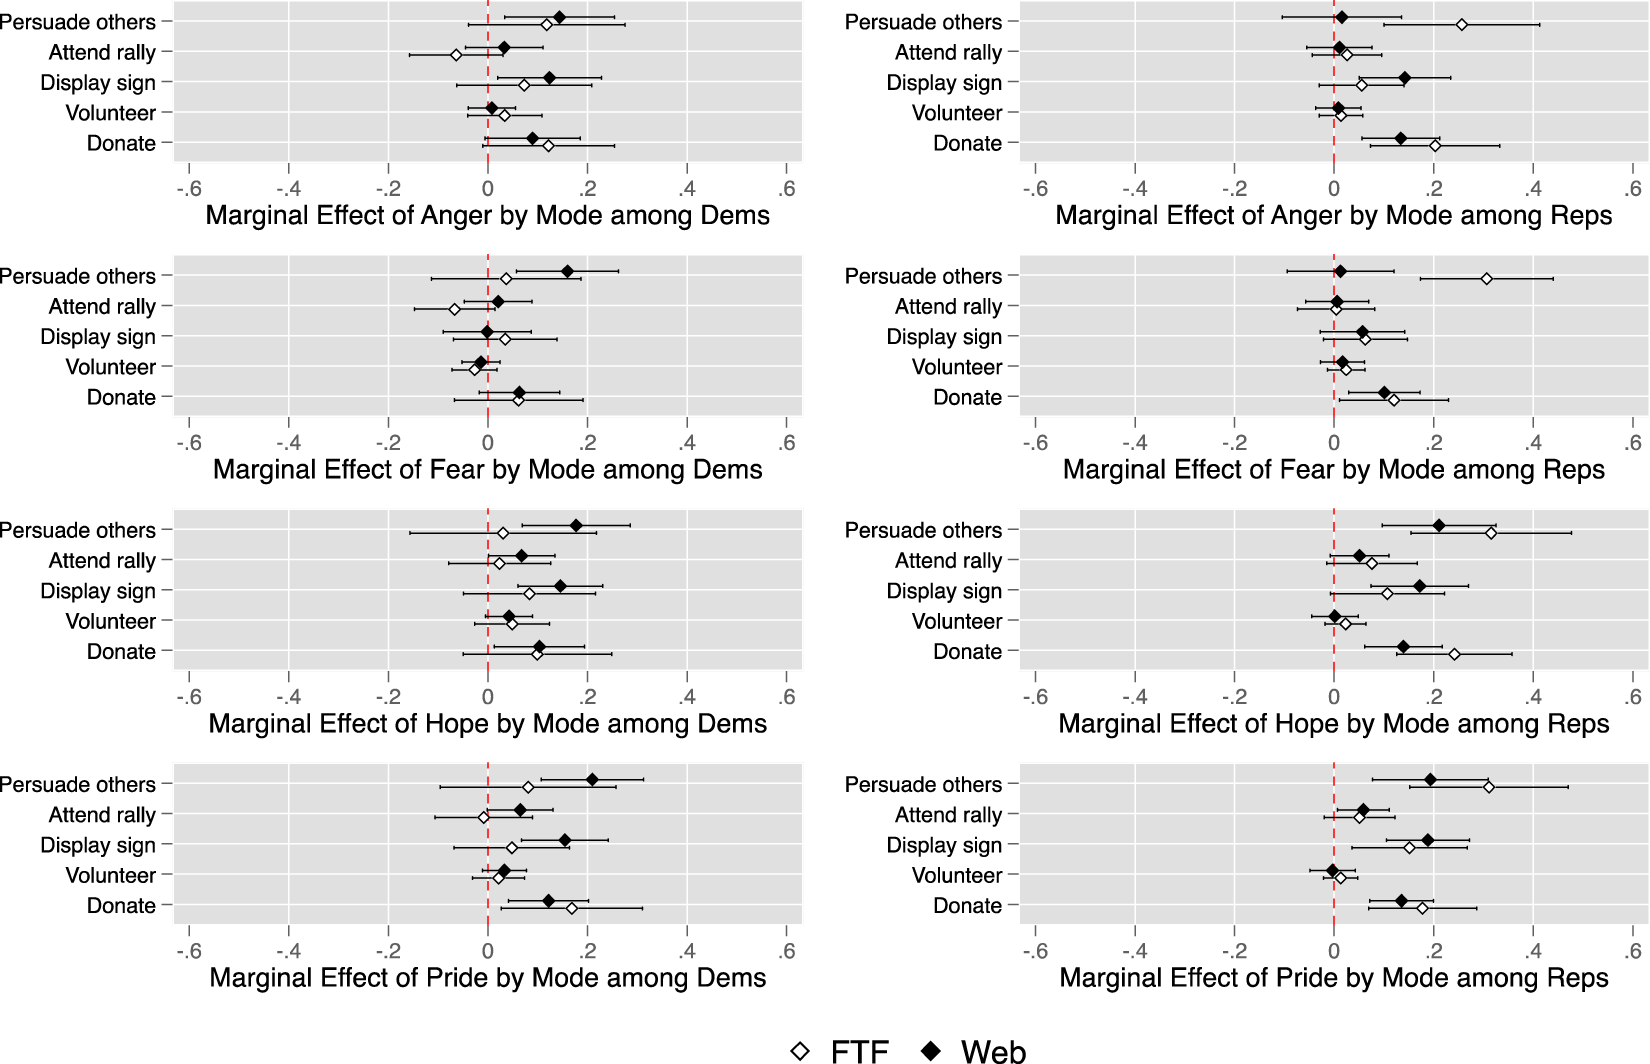
Furthermore, I examine whether the impact of emotions varies by survey mode. Figures 5 and 6 show the marginal effect of emotions by mode from logit regression models among Democrats (left panels) and Republicans (right panels) on five campaign engagement activities in both election years.Footnote 4 Similarly to how campaign participation is measured in Oceno and Morell (Reference Oceno and Morell2024), the dependent variables include five items asking respondents if they engaged in the following activities: (1) “talk to any people and try to show them why they should vote for or against one of the parties or candidates” (i.e., persuade others); (2) “go to any political meetings, rallies, speeches, dinners, or things like that in support of a particular candidate” (i.e., attend a rally); (3) “wear a campaign button, put a campaign sticker on your car, or place a sign in your window or in front of your house” (i.e., display a sign); (4) “do any (other) work for one of the parties or candidates” (i.e., volunteer); and (5) “give money to an individual candidate running for public office” (i.e., donate). In either 2012 (Figure 5) or 2016 (Figure 6), there are generally no significant mode differences in the marginal effect of emotions on campaign engagement except for Republicans’ hope on displaying a sign and pride on volunteering in 2012, and Republicans’ anger and fear on persuading others in 2016.
Marginal effects of emotions by mode on campaign engagement in 2012.
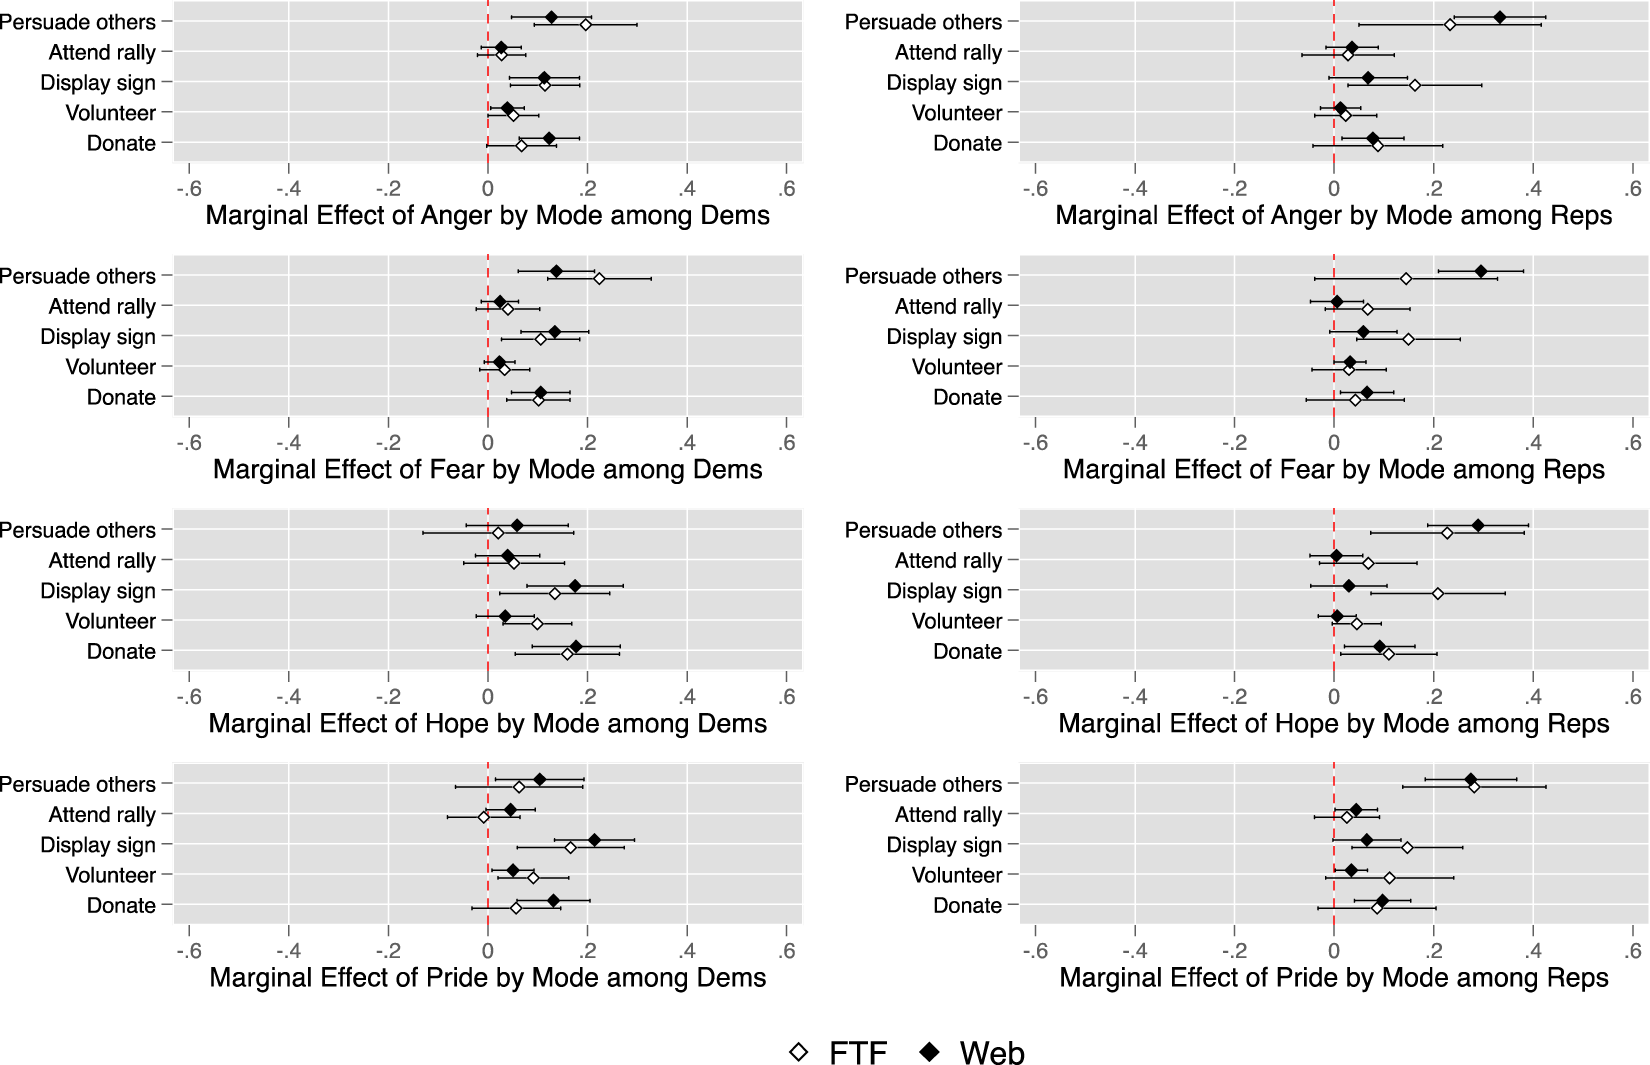
Marginal effects of emotions by mode on campaign engagement in 2016.
5. Discussion
The political implications of emotions have recently received widespread scholarly attention. As this line of research becomes increasingly popular, it is important to better understand how effectively self-reports can capture emotions. My analyses show that, in both 2012 and 2016, participants reported significantly less intense negatively valenced emotions—anger and fear—when interviewed face-to-face as compared to online, thus suggesting that they tend to conceal negative emotional states that may be judged as socially inappropriate, whether in kind or intensity (e.g., Shields, Reference Shields2005; Kleef et al., Reference Van Kleef and Côté2022). Moreover, Democrats reported significantly stronger positive emotions—hope and pride—in person in 2012, while Republicans reported significantly less hope and pride in the face-to-face mode in 2016. While underreporting due to social desirability bias has been studied in relation to a broad set of sensitive questions (e.g., Bryn et al., Reference Rosenfeld, Imai and Shapiro2016), these findings suggest that survey items that tap into emotions may be also perceived as ‘sensitive,’ particularly when emotions are elicited in an interpersonal setting (i.e., with an interviewer present). Furthermore, although reports of negative emotions tend to exhibit larger social desirability bias, the expression of positive emotions is not exempt from perceived risks of social sanctions and, consequently, biased reporting. Nonetheless, the analyses show that, overall, there are no significant differences by mode in the marginal effect of emotions on campaign engagement activities in 2012 or 2016.
This research contributes to enhancing our understanding of how interview mode can lead to significant underestimation of individuals’ actual emotional predispositions due to social desirability pressures. A key lesson is that self-administration significantly reduces social desirability bias and tends to yield more accurate estimates, as compared to interviewer-administration. Relatedly, these findings warrant caution about measuring emotions by combining data across face-to-face and Web modes. In fact, combining survey items with identical wordings but from different interview modes is likely to create unreliable estimates. The way in which social scientists collect their data is, therefore, a crucial aspect of their ability to test theories and hypotheses about the salience of emotions in society and politics.
An important question raised by this research is how the observed social desirability effects may be related to rising levels of affective polarization within the American electorate. My results suggest that expressing polarized negative feelings toward out-party candidates, particularly with a stranger, tends to still be perceived as non-normative. However, respondents may be more inclined to share polarized emotions with interviewers when it comes to positive affect toward some in-party candidates, such as Obama in 2012.
Another question that this study leaves open is how the cultural context may influence emotional expressivity (e.g., Salvador et al., Reference Salvador, Idrovo Carlier, Ishii, Torres Castillo, Nanakdewa, San Martin, Savani and Kitayama2023). More work is needed to investigate the role played by survey mode effects and social desirability bias within cultures outside the United States, which may be characterized by differing norms and styles of expressing socially engaging or interdependence-oriented vs. disengaging or independence-oriented emotions. Finally, future research should examine whether socially desirable reporting tends to be exhibited consistently by the same individuals, namely whether there is an individual-level association among socially desirable reports of political attitudes and behaviors and those of emotions.
Supplementary material
The supplementary material for this article can be found at https://doi.org/10.1017/psrm.2025.10016. To obtain replication material for this article, please visit https://doi.org/10.7910/DVN/0GCD1H.
Competing interests
The author(s) declare no competing interests.


 Open access