


Introduction
Whilst research on group representation has mostly focused on gender, economic or professional background (class), and, more recently, ethnic minorities, the representation of different age groups remains understudied. This might be partly because the underrepresentation of certain age groups is not as evidently a democratic problem as for other social groups: being part of an age group is not static. By the natural and inevitable process of ageing, those who are young now will one day automatically be part of the older share of society. Thus, lacking youth representation has not been problematized for a long time. This has recently changed, as the effects of societal ageing in industrialized countries are becoming more evident and potential conflicts between different age groups are gaining attention.
Research on the underrepresentation of youth in parliaments has so far focused on the intersection of age and gender (Stockemer and Sundström Reference Stockemer and Sundström2022b; Belschner and Garcia de Paredes Reference Belschner and Garcia de Paredes2021; Joshi and Och Reference Joshi and Och2021), the institutional effects of electoral systems, age requirements or quotas (Joshi Reference Joshi2013; Stockemer and Sundström Reference Stockemer and Sundström2018, Reference Stockemer and Sundström2019, Reference Stockemer and Sundström2022b; Krook and Nugent 2018; Belschner and Garcia de Paredes Reference Belschner and Garcia de Paredes2021) and voter preferences (Belschner 2022; Eshima and Smith Reference Eshima and Smith2022), but only rarely on political parties. This is quite astonishing as parties are central in the selection of candidates and therefore should play an important role in determining the demographic composition of elected politicians. The parties’ influence on the composition has been demonstrated for other characteristics such as gender (Caul Reference Caul1999) or the representation of ethnic minorities (Schönwälder Reference Schönwälder2013). Especially, comparative pieces on party-level factors are scarce, with the notable exception of a recent chapter on party parliamentary groups by Stockemer and Sundström (2023). Whilst this work, together with country-level studies, provides first insights into which party characteristics might matter, the chosen methodological approaches fail to account for the fact that we observe high levels of youth representation in very different contexts (causal complexity). We thus focus on parties as the main actors in candidate selection and ask: under which configurations of conditions do we observe a high share of young Members of Parliament (MPs)?
Following earlier conceptualizations, we define young MPs to be below the age of 35 at the day of election. We decided not to use a higher upper limit (e.g. 40 or 45 years), as using the age of MPs at the beginning of a legislative period is already a conservative measure (see Stockemer and Sundström 2023 for a more detailed discussion). Towards the end of the legislative period, MPs will be four to five years older and the share of people below the age limit will likely be much smaller. We created a data set of party parliamentary groups in directly elected chambers at the national level in advanced democracies after elections between 2017 and 2020 and conducted a fuzzy-set QCA (fsQCA). Our results show that it is not only institutional factors, especially a proportional electoral system, that promote youth representation, but that party characteristics are important as well. In combination with a PR system, a progressive ideology leads to higher shares of young MPs. Depending on the context, strong and institutionalized youth organizations help to promote or—counterintuitively—hinder the descriptive representation of youth. The effect of decentralized selectorates1 seems to be context dependent, just like the effect of party age.
The article proceeds as follows: we first describe prior literature on youth representation and discuss the scientific and societal relevance of the topic before presenting six conditions under which we expect to observe high shares of young MPs, based on existing literature and theoretical approaches. The third section describes the data and applied methods with a special focus on new advances in QCA methodology. Afterwards, we present and discuss the results.
Prior literature on youth representation and relevance of the topic
The underrepresentation of youth in parliament is a prevalent and global problem, well-documented on the national parliamentary level by different data sets (Stockemer and Sundström Reference Stockemer and Sundström2022a; Inter Parliamentary Union 2021). This can be exemplified by individual cases, such as France or Germany. The French population’s median age in 2022 was 41.2 years (INSEE 2023), but their parliament is much older, the median age being 49.5 years (Stockemer and Sundström Reference Stockemer and Sundström2022a). The situation in Germany is not very different. After the 2021 elections, 16.0 percent of German MPs were under the age of 35 (Stockemer and Sundström Reference Stockemer and Sundström2022a), compared to 35.5 percent of the population (Statistisches Bundesamt 2022). One could argue that not everyone below the age of 35 is part of the electorate, but even within the voting age population, the share of 18- to 34-year-olds—19.9 percent (Statistisches Bundesamt 2022)—is still higher than their share in parliament.
One common explanation for the underrepresentation of young people in political positions is the voters’ preference for older candidates, as they are assumed to be more experienced. However, recent research indicates the opposite: Belschner (2022) and Hofmane (2023) both found that being young could even provide an advantage in elections and Eshima and Smith (Reference Eshima and Smith2022) describe a voter penalty in Japan for older candidates above seventy. This is in line with recent experimental research presented in a working paper by McClean and Ono (2022). Their findings point towards the same conclusion: even in gerontocratic societies like Japan, there seems to be no general voter bias against young candidates.
Another possible explanation for the relative absence of youths in parliaments stems from discussions around the political participation of young people. During the last two decades, one could observe a crisis of conventional political participation (e.g. voting or becoming a party member) among the youth of many countries. This lack of conventional participation is well-researched and documented (Henn and Foard Reference Henn and Foard2012; Bhatti and Hansen Reference Bhatti and Hansen2012; Blais et al. Reference Blais, Gidengil and Nevitte2004; Tiberj Reference Tiberj2021). Nevertheless, it needs to be stated that this abstention from conventional methods of political participation does not equal an abstention from politics more generally. Young people often participate in different ways, such as protests, petitions, or boycotts (Pickard Reference Pickard2019; Tiberj 2017, Reference Tiberj2021; Dalton Reference Dalton2021). This described crisis of conventional political participation is often seen as the cause of underrepresentation. The linkage can be described as a vicious cycle: due to different societal developments, such as later maturation, new and different opportunities for participation, or changes in political socialization, young voters are less interested in conventional politics and participate less therein.
Additionally, the share of young people in society is diminishing in many countries and thus, their interests are less important in the political game. Parties gain relatively little from addressing the demands of the ever-shrinking group of young citizens, who also often refrain from voting. This, in turn, leads to more political apathy amongst youths as they do not feel cared for by politicians. The same applies to the nomination of candidates, where parties believe to profit from nominating middle-aged or elderly candidates due to low turnout rates in the younger shares of society. This lack of representative candidates causes young people to believe in the impossibility of descriptive representation, which leads to young people becoming even more indifferent towards the representative systems and political parties. Keeping in mind that young people are interested in politics but simultaneously strongly disillusioned by the political system (Henn and Foard Reference Henn and Foard2012; Pickard Reference Pickard2022; Dalton Reference Dalton2021), the need to break this vicious cycle becomes obvious. One way to do so would be to enhance the share of young people in positions of power. We thus side with Stockemer and Sundström when they argue that “the academic literature could also do its part by raising more awareness of the underrepresentation of young adults in the political process and by elucidating the factors that contribute to young people’s underrepresentation” (2018: 69).
Conditions under which we expect high shares of young MPs
The need to study the underrepresentation of youth on a party level becomes obvious when we go back to our illustrative example of the mere 16.0 percent of German MPs being below the age of 35 after the 2021 elections. In 2017, this share was even lower with 9.0 percent (Stockemer and Sundström Reference Stockemer and Sundström2022a). Our newly built data set shows that in 2017 there was quite a lot of variation between the different parties, ranging from only 5.8 percent of young MPs in the parliamentary group of The Left to 15.8 percent within the Free Democratic Party group. Party characteristics thus seem to play a role, even though they are rarely researched. Below, we present and discuss conditions under which we expect to observe an adequate representation of youth.
A relatively low/high GDP per capita
The impact of development and wealth on youth representation has been discussed several times whilst assuming different causal relationships. Research on the EP has shown that richer countries have older delegates (Stockemer and Sundström Reference Stockemer and Sundström2019) and the authors argue that richer countries tend to produce politically apathetic youths, such as France or Great Britain. Whereas in less affluent countries such as Greece, Spain or the Eastern European countries, young people are politically more active. This could lead to a bigger representation in parliaments under the condition of a relatively low GDP per capita. However, the authors have also referred to the postmaterialism thesis, which postulates that economic development is accompanied by a value change in the younger generation (Stockemer and Sundström Reference Stockemer and Sundström2022c: 57–58). The postmaterialist shift should lead to a higher demand for newcomers as politicians, which could be beneficial to the representation of outgroups (Stockemer Reference Stockemer2015). The authors believe that this could apply to the young, especially as youths often hold progressive values. However, in their analysis they do not find a significant and robust effect of GDP per capita on youth representation. Thus, the theoretical takes as well as the empirical findings are inconclusive and partly contradicting. We thus hypothesize that development has different causal effects in different contexts and might only be influential in specific configurations with other conditions (conjunctural causation).
A proportional representation electoral system
Quite in line with what one would expect, several studies have shown that proportional representation (PR) boosts the likelihood of the election of young politicians (for several Asian countries, Joshi Reference Joshi2013; for a global sample, Stockemer and Sundström Reference Stockemer and Sundström2018). The theoretical explanations have been described in depth by Stockemer and Sundström (Reference Stockemer and Sundström2018: 473–474) and thus shall only be listed briefly: firstly, single-member districts create zero-sum games for the competing parties and thus, parties want their candidate to appeal to the “average” voter, which will often lead to parties nominating a middle-aged white man with high education. In PR systems on the other hand, parties are incentivized to appeal to different voters, including young voters. They will thus list a more diverse set of candidates. Secondly, the authors argue that PR systems are party-centred, whereas majority systems are candidate-centred. This means that in PR systems, parties can push young candidates, whereas they are disfavoured in majoritarian systems, since young candidates generally possess less of a political record and name recognition as well as less financial and organizational resources to run a campaign. Thirdly, the incumbency advantage is likely to disfavour young candidates and is more pronounced in first-past-the-post systems. Fourthly, they point towards the different mechanical effects of the electoral system types. PR systems tend to generate multiparty systems, whereas majority voting leads to bipolar systems. Progressive and new parties are thus more likely to gain sizeable representation in PR systems. These parties often do not only appeal to younger voters, but also bring forward a new generation of representatives. Lastly, they speak of a contagion effect, which is more likely to arise in PR systems: “if one party starts to nominate greater numbers of young candidates other parties are likely to follow suit” (Stockemer and Sundström Reference Stockemer and Sundström2018: 474).
Strong/well-integrated youth organizations
The first party-level condition to be discussed is the presence of strong youth wings in political parties that are well-integrated into the party structure. Youth wings and their influence on party performance, positioning, or behaviour are notoriously understudied. Existing research consists overwhelmingly of single-case studies focusing on the socialization and experiences of individual youth wing members (Rainsford Reference Rainsford2018; Malafaia et al. Reference Malafaia, Menezes and Neves2018) and single-country studies focusing on the functions or organization of youth wings (Hooghe et al. Reference Hooghe, Stolle and Stouthuysen2004; Pickard Reference Pickard2019; Roon Reference de Roon2020). Thus, even though basic comparable data on youth wings has been made available through the Political Party Database (Poguntke et al. Reference Poguntke, Scarrow, Webb, Allern, Aylott, van Biezen, Calossi, Lobo, Cross, Deschouwer, Enyedi, Fabre, Farrell, Gauja, Pizzimenti, Kopecký, Koole, Müller, Kosiara-Pedersen, Rahat, Szczerbiak, van Haute and Verge2016), our literary research has not shown larger-scale comparative studies including them. We intend to fill this gap, claiming that the presence of strong/well-integrated youth wings is one of the conditions under which parties will nominate young candidates in winnable positions. This argument builds upon the following theoretical considerations: firstly, youth wings are said to fulfil a recruitment function (Hooghe et al. Reference Hooghe, Stolle and Stouthuysen2004) and having young candidates at hand is a first prerequisite to put them on a party list. Secondly, as Stockemer and Sundström (Reference Stockemer and Sundström2021) describe in their work on the absence of young politicians in cabinets, this absence if often due to youth’s lack of party and electoral capital. We extend this to the legislative sphere and argue that being active in a party’s youth wing, especially if it has guaranteed seats in the party’s congress and executive committee, is a way of gaining party capital already at a young age. By extension, they can also gain electoral capital, as youth wing leaders will receive more media coverage if they also have a say in the party. Illustrative examples are German former youth wing leaders Ricarda Lang (ALLIANCE’90/THE GREENS) and Kevin Kühnert (SOCIAL DEMOCRATIC PARTY), who had a strong media presence before being elected to the parliament.
A decentralized selectorate
The second party-level condition to be included are decentralized or inclusive selectorates. Deciding on the candidates constitutes the choice before the choice and is thus of outmost importance when looking at the composition of parliaments. From research on women and different minorities, we know that selectorates can matter for the descriptive representation of marginalized groups. The focus of this research has been on (de)centralization and the degree of inclusiveness especially. Decentralization refers to the territorial level on which decisions on nominations are made (local, regional, national), whereas inclusivity refers to the group that is making the decision (all members or only the party leaders).
For EP elections, Fortin-Rittberger and Rittberger (Reference Fortin-Rittberger and Rittberger2015) find that inclusive selectorates at the beginning of the selection process are key for women’s representation, whereas decentralized selectorates in general, and inclusive selectorates at later stages of the selection process, do not seem to have an influence. For the German case, Deiss-Helbig (Reference Deiss-Helbig, Sandri and Seddone2021) found that different candidate selection processes did not significantly influence the descriptive representation of women and people of immigrant origin. But Vandeleene (Reference Vandeleene, Sandri and Seddone2021) as well as Taflaga and Beauregard (Reference Taflaga and Beauregard2020) both present evidence that a decentralized and less institutionalized selection process positively influences the share of women on candidate lists. Thus, the empirical results are mixed, which seems to partly arise from differences in operationalization.
Empirical findings on the effects of selectorates on youth representation are scarce. The only paper touching upon it was published by Sundström and Stockemer (2018), who have shown for several party characteristics that these do not explain age variance in the EP, including the inclusiveness of the selectorate. The only party characteristic that had a minimal influence was the level of nomination. If candidate selection happens at the local level, MEPs tend to be two to three years younger than MEPs nominated at another territorial level (Sundström and Stockemer 2018: 73). We will thus include decentralized selectorates as one condition under which we expect to see higher shares of young MPs.
An inclusive ideology
The third party-level condition is the presence of an inclusive ideology. Following earlier arguments, we expect parties with a pluralistic and egalitarian culture to promote young candidates (Sundström and Stockemer 2018). This is in line with what has been theorized and empirically identified in research on the descriptive representation of women (Paxton and Kunovich Reference Paxton and Kunovich2003; Caul Reference Caul1999, Reference Caul2001). An inclusive ideology for us encompasses a left economic position, as this is associated with fighting for minorities and outgroups, as well as a progressive libertarian position, which is especially in line with young people’s values. Parties that appeal to young voters on the policy dimension might also try to present candidates that these voters descriptively identify with. On the contrary, parties promoting traditionalist and authoritarian values tend to not appeal to young voters as much and have older support bases, which should lead to older delegates. Empirical evidence on the effect of ideology on age representation is scarce, except for two works on the EP (Sundström and Stockemer 2018; Stockemer and Sundström Reference Stockemer and Sundström2019), where ideology was found not to play an important role. But there is ample evidence that it matters for the descriptive and substantive representation of other underrepresented groups, such as women and ethnic or sexual minorities (van der Zwan et al. Reference van der Zwan, Lubbers and Eisinga2019; Bönisch Reference Bönisch2022; Erzeel and Celis Reference Erzeel and Celis2016). Our analysis on national parliaments will help to better understand the influence of party ideology on youth representation.
Young party structures
Stockemer and Sundström (Reference Stockemer and Sundström2022c) recently found young parties to be more likely to have a high share of young MPs. They argue that this is due to old organizations having “long-established networks of commands, consisting mainly of middle-aged and senior men, so-called old boys networks” (Stockemer and Sundström Reference Stockemer and Sundström2022c: 80), which might be harder to penetrate for outgroups such as women and young party members. Earlier research has shown that these networks often play a crucial role in advancing individual political careers (Bjarnegård and Kenny Reference Bjarnegård and Kenny2015). As parties that have been founded only recently are less likely to already have formed closed-knit networks benefitting older candidates, we expect to see more youth representation in younger parties.
For many of the presented party-level conditions, there are no or contradicting findings on how they influence youth representation. We argue that this is due to the fact that adequate youth representation can be observed in very different contexts and political systems. Hence, we do not expect to find one causal factor or strong direct impacts from individual factors, but rather that different configurations of conditions will positively (or negatively) influence the representation of young adults in parliaments. Whilst existing literature has not focused on combinations of factors, our methodological approach can identify such configurations and will thus help to better understand the causal complexity.
Other possible conditions have been omitted due to research design restrictions. Age requirements for candidacy, youth quotas and voting age all probably influence youth representation but had to be excluded, as there is little to no variance in the data. Accessing data on the share of young people amongst members of a political party is feasible only for some cases and thus would be an interesting factor to analyse in future case studies.
Methods and data
After having presented the conditions under which we expect to see a high share of young MPs, we will now discuss our methods, describe the operationalization of the conditions as well as the outcome, and present our case selection.
Our article applies two methods. In a first step, we analyse our data using a linear regression model to identify first tendencies and in a second step, we use a fuzzy set Qualitative Comparative Analysis (fsQCA) to further narrow our results. As the two methods are based on different logics, one being statistical and one set-theoretic, they have different strengths and can be fruitfully combined (Vis Reference Vis2012; Fiss et al. Reference Fiss, Sharapov and Cronqvist2013). Regression analysis aims to identify the impact of individual factors on a dependent variable. But as discussed in the previous sections, high shares of young MPs can be observed under different conditions and seem to be context dependent. We thus argue that focusing also on configurations of conditions is essential. QCA can account for this causal complexity as it understands cases as configurations of conditions (conjunctural causation) and systematically compares the conditions of each case to identify the necessary and sufficient conditions for an outcome. Another strength of the method with regard to youth representation is that “[c]ausal complexity […] acknowledges that outcomes can be reached through multiple, different pathways” (Mello Reference Mello2021: 14), which is called equifinality.
These clear strengths notwithstanding, QCA has also been criticized with regards to representation research. One example is a previous debate on the use of fsQCA in this journal. It started with Stockemer (Reference Stockemer2013) arguing that fsQCA produced complex configurations of conditions with low empirical coverage and criticising the method’s high sensitivity to coding. In their answer, Buche et al. (Reference Buche, Buche and Siewert2016) tried to demonstrate that the previously presented arguments were based upon a misunderstanding of the underlying set-theory and weaknesses in the application regarding, e.g. the calibration process, and the analysis of necessary and sufficient conditions. In the following rebuttal piece, Stockemer (Reference Stockemer2016) reiterated his criticism, pointing towards the problem of non-robust findings and the researcher having to set benchmarks to distinguish meaningful from non-meaningful variation. We believe that by using standardized protocols (R packages by Dusa Reference Dusa2019; Oana and Schneider Reference Oana and Schneider2018), testing the sensitivity ranges of the calibration and having a strong theoretical foundation, fsQCA presents an enriching supplement to standard approaches such as regression analysis due to the afore described possibility to account for conjunctural causation and equifinality.
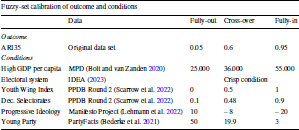
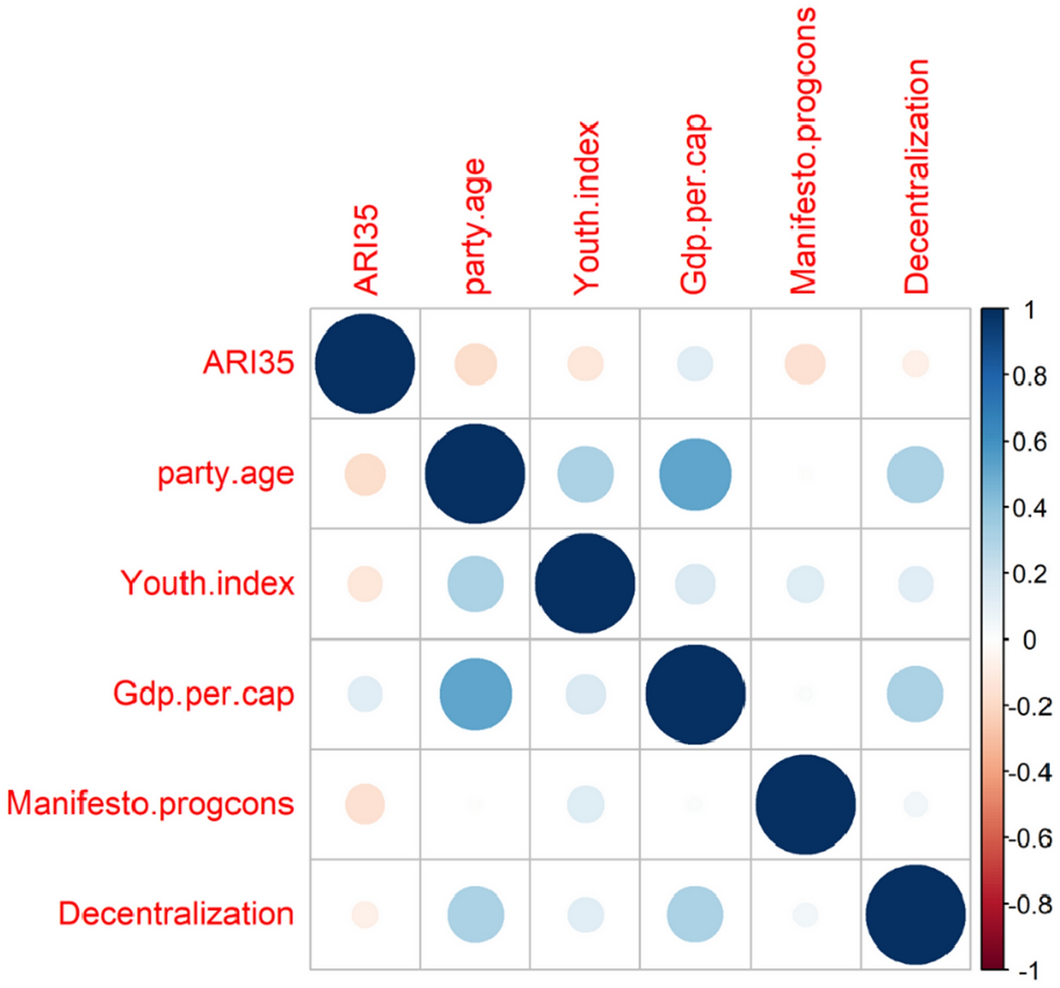
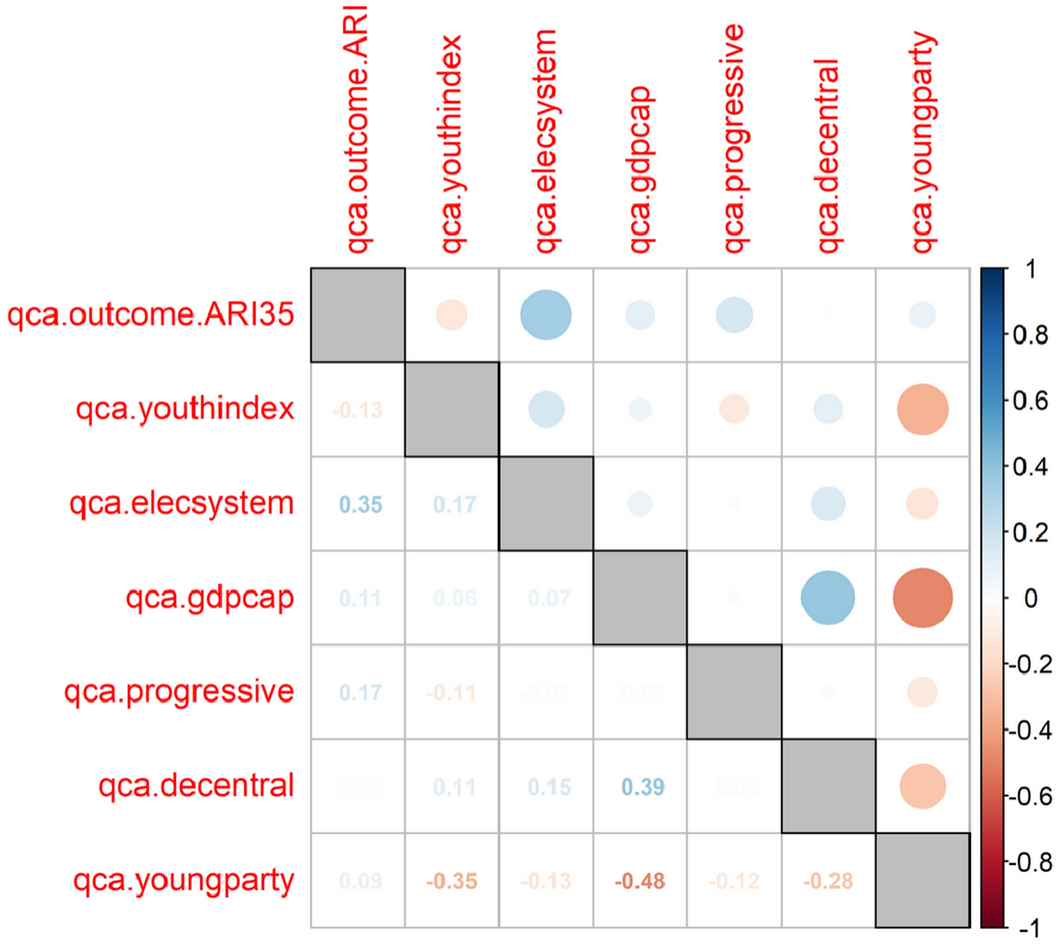
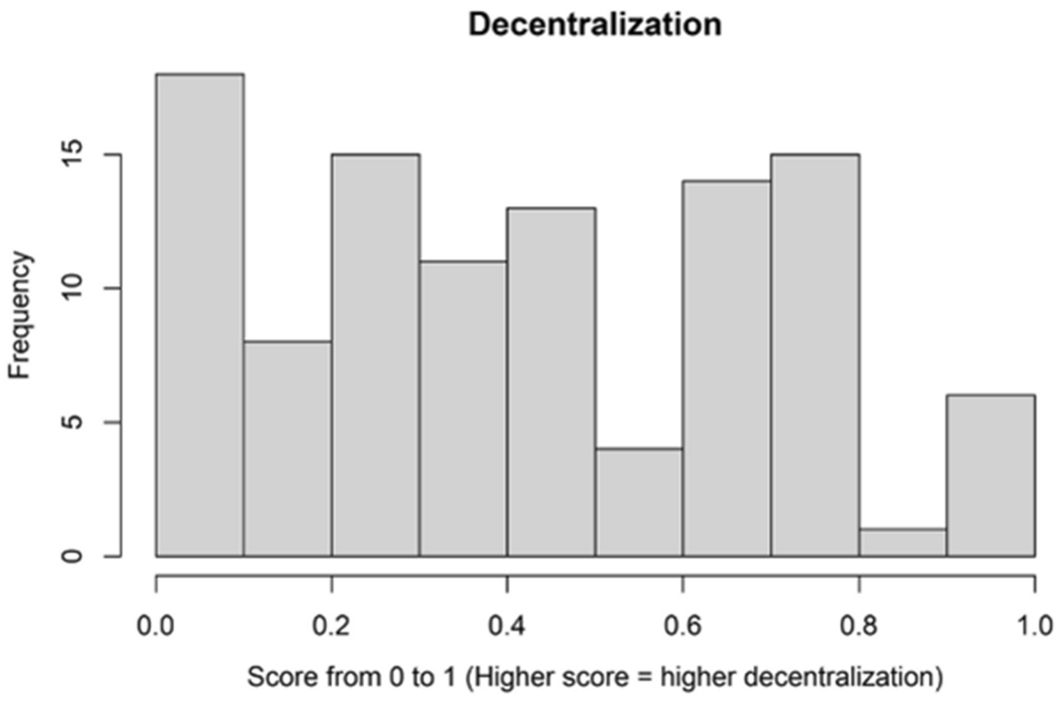
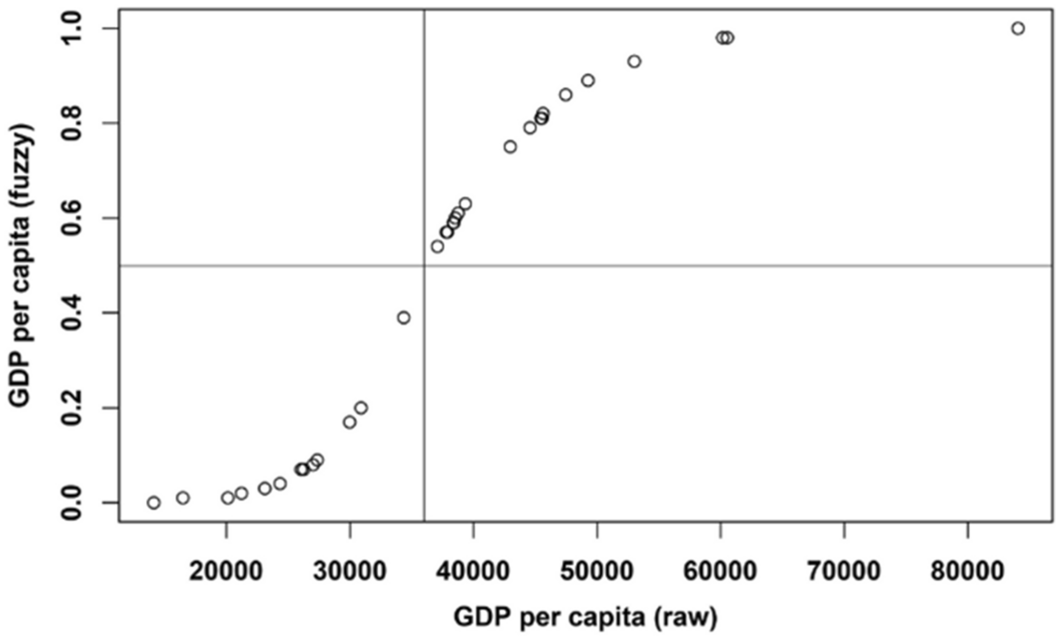
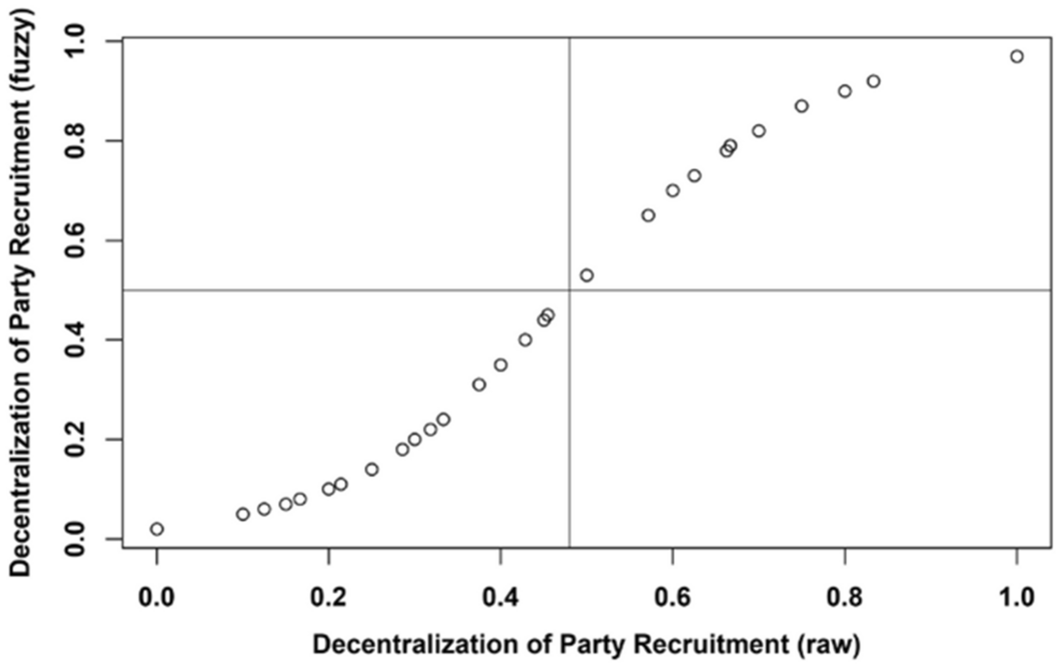
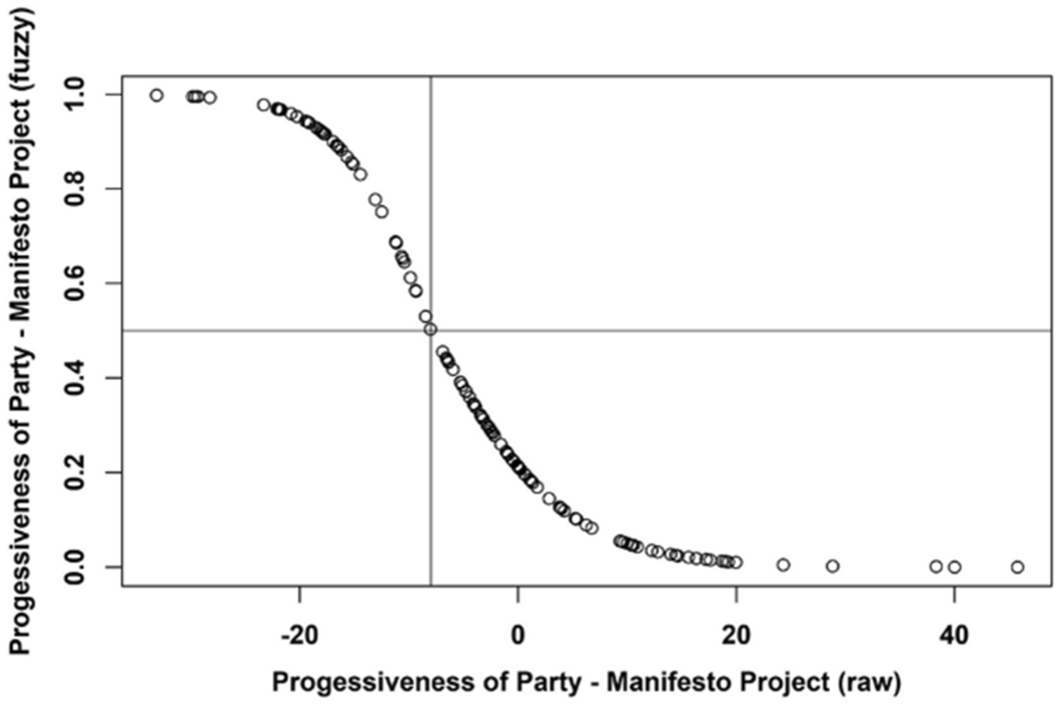
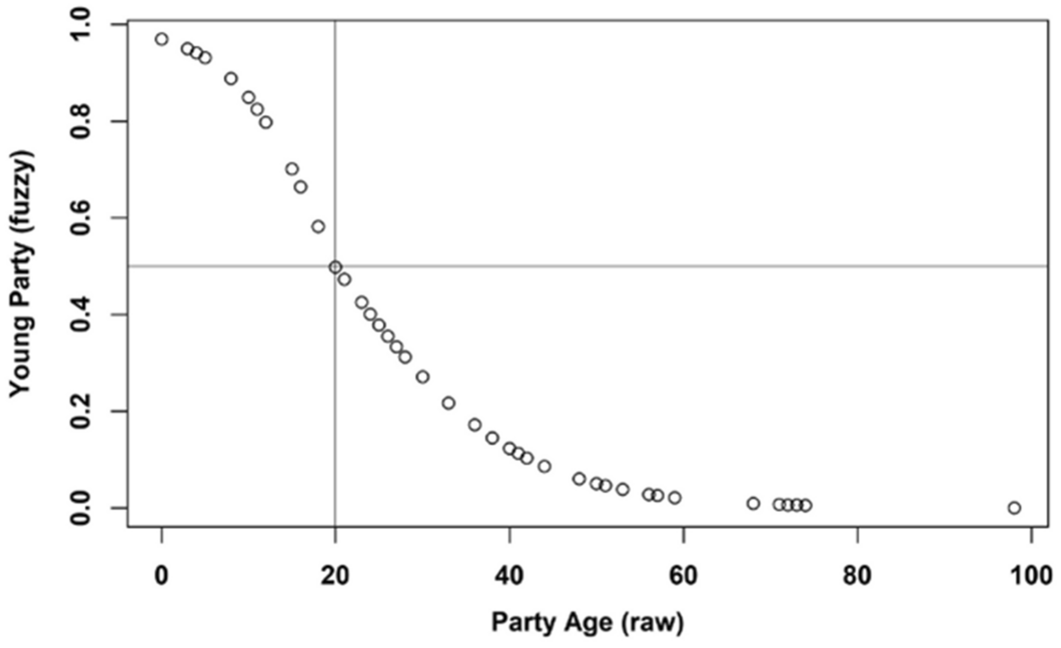
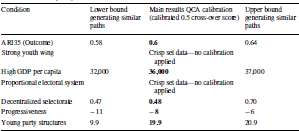
QCAs can be performed using crisp (“binary”) conditions or fuzzy ones. We decided on a fuzzy-set QCA to be able to “make distinctions in kind and degree” (Meissner and Mello Reference Meissner and Mello2022: 252). Fuzzy sets have a range of values from 0 to 1, and to convert raw data into fuzzy sets, researchers must define three empirical anchors. A fuzzy score of 1 indicates complete membership in the set, whilst a score of 0.5 represents the point where a case is equally at the border of being a set member and a non-member. A fuzzy score of 0 signifies complete non-membership in the corresponding set. Based on these anchors, a logistic regression transforms the raw data into fuzzy scores. Table 1 summarizes the calibration of conditions and outcome as well as the data sources. In the Appendix, we present descriptive statistics (correlation matrix for raw and calibrated data in Figs. 2 and 3, histograms for raw data in Figs. 4, 5, 6, 7, 8, and calibration plots in Figs. 9, 10, 11, 12, 13) as well as robustness tests related to the calibration (Table 10). As an additional robustness check we repeated our analyses with a higher age threshold of 40 years. These analyses, including a short discussion on the minor differences we observed, can be found in the additional material2, together with the replication files. Below, we will give further insights into the operationalization and calibration decisions.
Data sources and fuzzy-set calibration of outcome and conditions

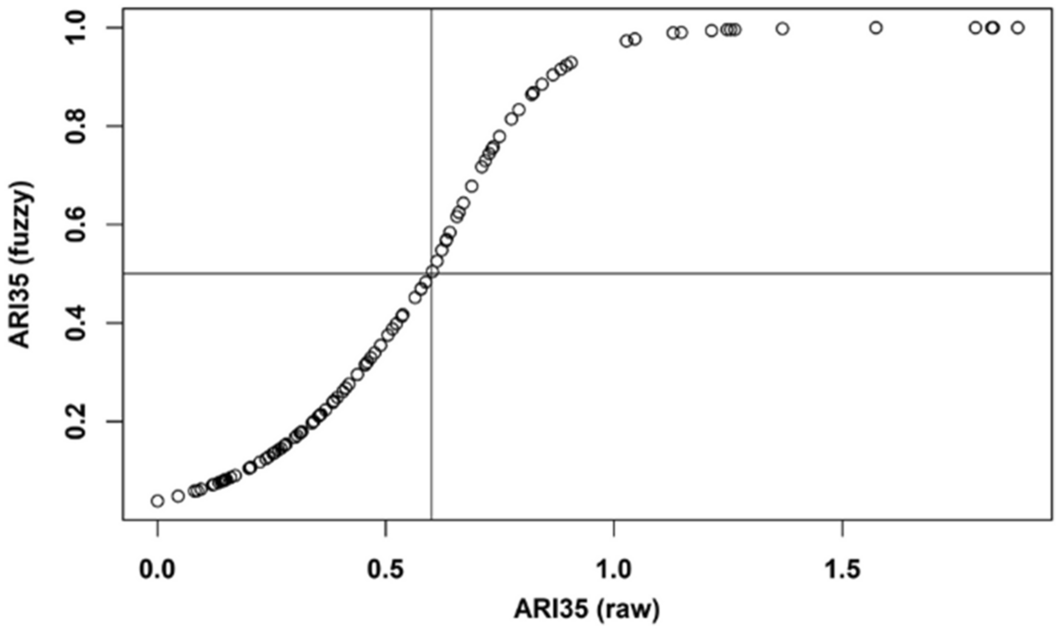
We constructed an original data set for the outcome (Kurz and Ettensper 2023). In bicameral systems, we included only the lower chamber. Lists containing the party affiliation as well as the birthdates of MPs have been made available by the parliaments themselves (either upon request or through providing ready-made files on their website/an R package) or have been collected by us from publicly accessible resources (e.g. MP’s profiles on parliament websites). From these MP lists we calculated the share of MPs under the age of 35 in each parliamentary group. We then calculated the Age Representation Index (ARI, conceptualization by Sundström and Stockemer Reference Sundström and Stockemer2021) by setting the share of MPs below 35 in relation to the share of people below 35 in the voting-age population of the respective country. Further specifications regarding the construction of the Age Representation on Party-Level Data set (ARPLD) are given in Appendix. The ARI scores in our data set range from 0.0 to 1.88, where a score of 1.0 indicates perfectly proportional representation. We opted to calibrate the ARI35 scores into fuzzy sets, even if this results in many party groups only holding partial membership. The ARI35 scores display significant variation and using crisp sets would lead to a substantial loss of information. We have defined the calibration thresholds to consider parties fully-in the set if they exhibit an ARI score of 0.95 or above and fully-out of set if the score is 0.05 or under. The cross-over point is 0.6, following our understanding that if a party’s share of young MPs is only half of this age group’s share within the voting-age population (ARI35 = 0.5), the party cannot be considered to even partially exhibit the outcome of adequate youth representation.
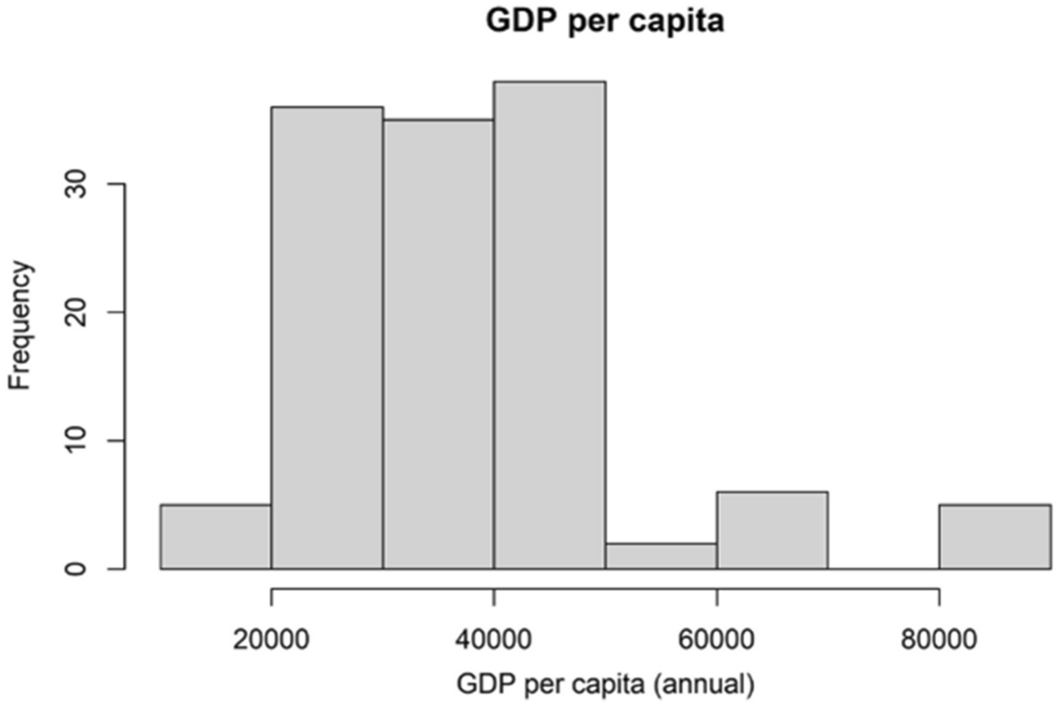
The data on GDP per capita stems from the Maddison Project Database. As there are contradicting theoretical takes on whether a high or a low GDP per capita positively influences youth representation, we have operationalized the condition in the way in which it is easier to interpret: parties operating in a country with a GDP below 25.000 USD are considered fully-out of the set, the cross-over point is set at 36.000 USD, and parties in countries with a GDP per capita of 55.000 USD and above are considered fully-in. The cross-over point and all other thresholds for this condition are based upon the overall data distribution in our sample, containing mostly affluent countries. They were set at points where a clear distinction between cases occurred.
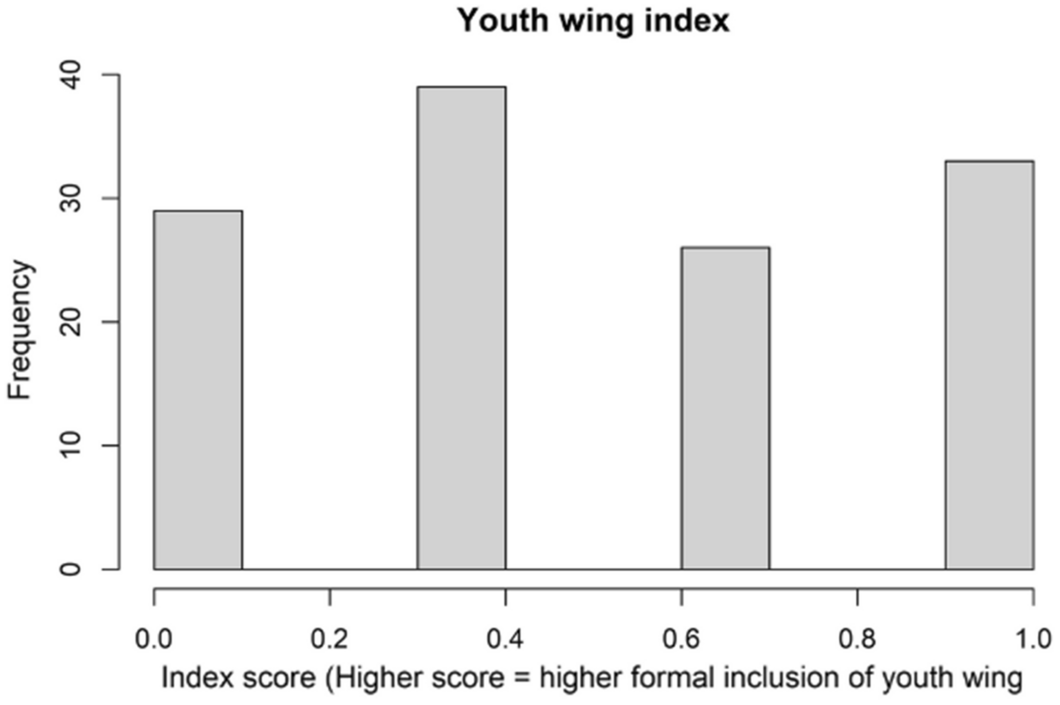
The Youth Wing Index (Political Party Database, PPDB) is an additive index ranging from 0 to 1 and has not undergone calibration. The mentioning of a youth organization in the party statute is worth 0.4 points, if the youth wing may send delegates to the party congress another 0.3 points are added, and if the youth organization is entitled to seats on the party’s highest executive body this is worth another 0.3 points (see Appendix for more information).
To measure the decentralization of selectorates we use the PPDB, which features several indicators covering different nomination levels. Following Tuttnauer and Rahat (Reference Tuttnauer and Rahat2023), they have been combined to create a decentralization index (ranging from 0 to 1). Parties are considered fully-in at 0.1, the cross-over is set at 0.48 and fully-out at 0.9.
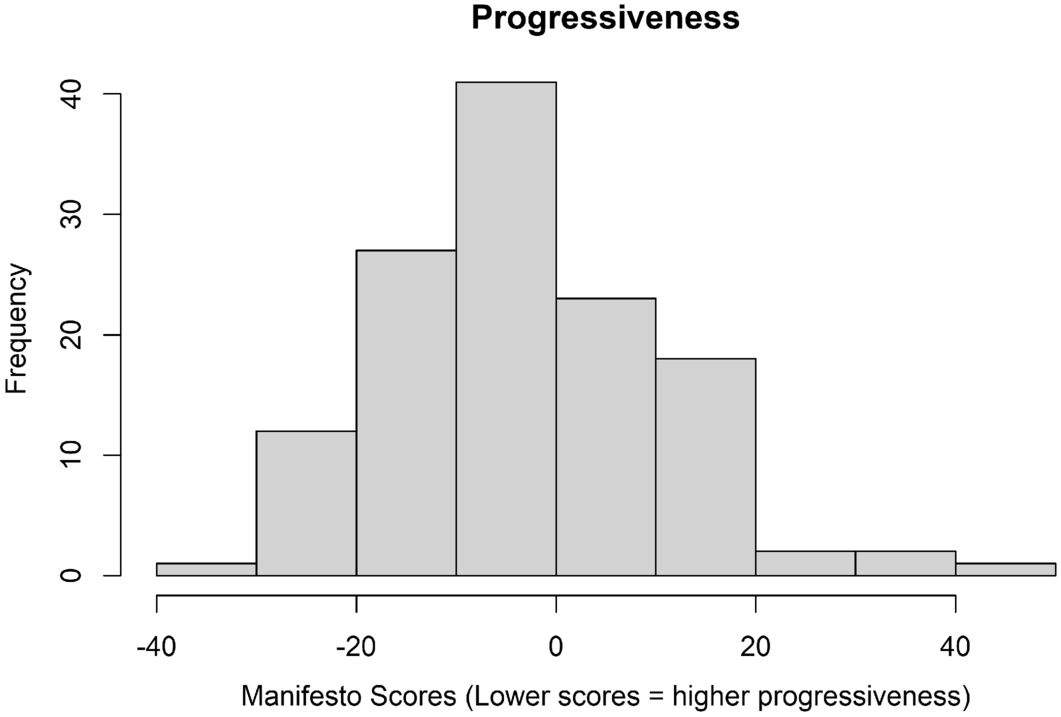
To measure the ideology of political parties, we use the society indicator provided by the Manifesto Project Database (Lehmann et al. 2022), mapping the parties’ ideology on a dimension ranging from conservative to progressive. Parties are considered fully-in at 10, the cross-over is set at − 8 and fully-out at − 20.
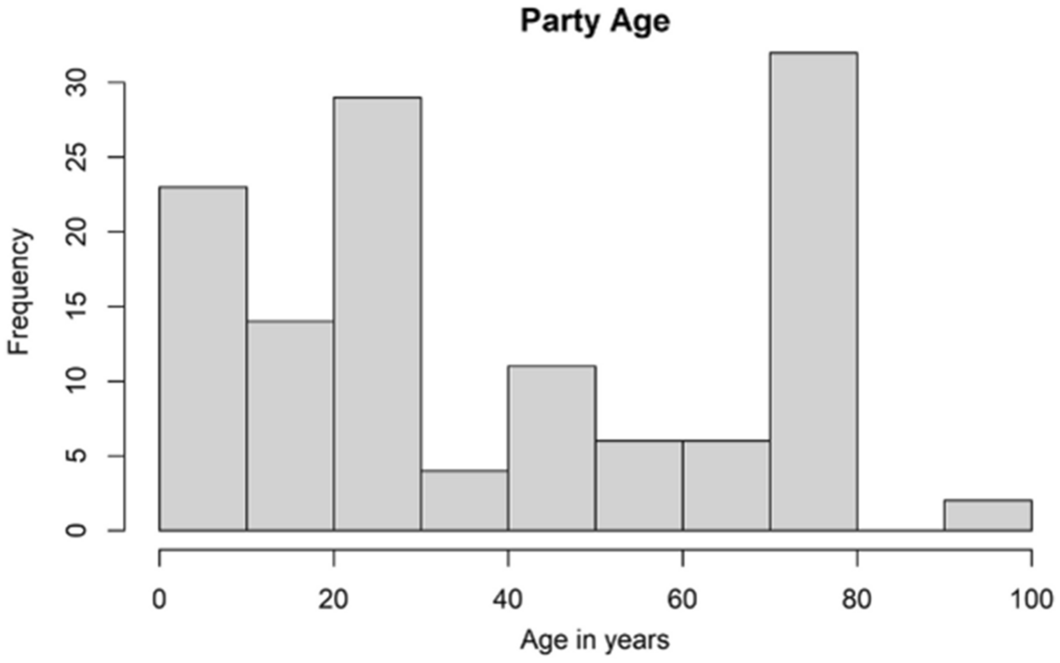
Data on party age stems from the Party Facts data set. Parties are considered fully-in the set if they are a maximum of three years old at the time of election. This benchmark relates to legislative periods mostly being between four and five years long. At three years of age, we can expect the party to not yet have incumbent candidates, which should benefit young candidates. The cross-over point is set at 19.9 (roughly four to five legislatures) and parties are considered fully-out if they were founded 50 years or more before the time of election.
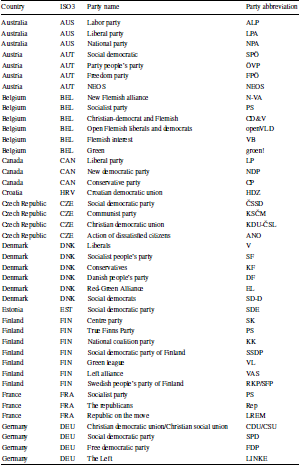
In our case selection, we have aimed to include as many cases from advanced democracies (V-Dem polyarchy-index > 0.7) as possible. Fundamentally, the case selection has been data-driven: we selected cases where data was available for all conditions and the outcome variable. Data availability also determined the timeframe, as two of our central conditions stem from the Political Party Database Round 2, where data was collected between 2017 and 2019. We thus set the timeframe to include party parliamentary groups from elections between 2017 and 2020.3 Finally, to run our QCA, we filtered for parties with at least ten MPs to make sure that the outcome variable is not biased by outliers. Our analysis is thus limited to larger (more successful) parties and to parties operating within parliaments where even smaller factions have more than ten members (large parliaments or majority systems). The final data set contains 105 parties from twenty-eight countries (a full list is included in Appendix).
Descriptive analysis
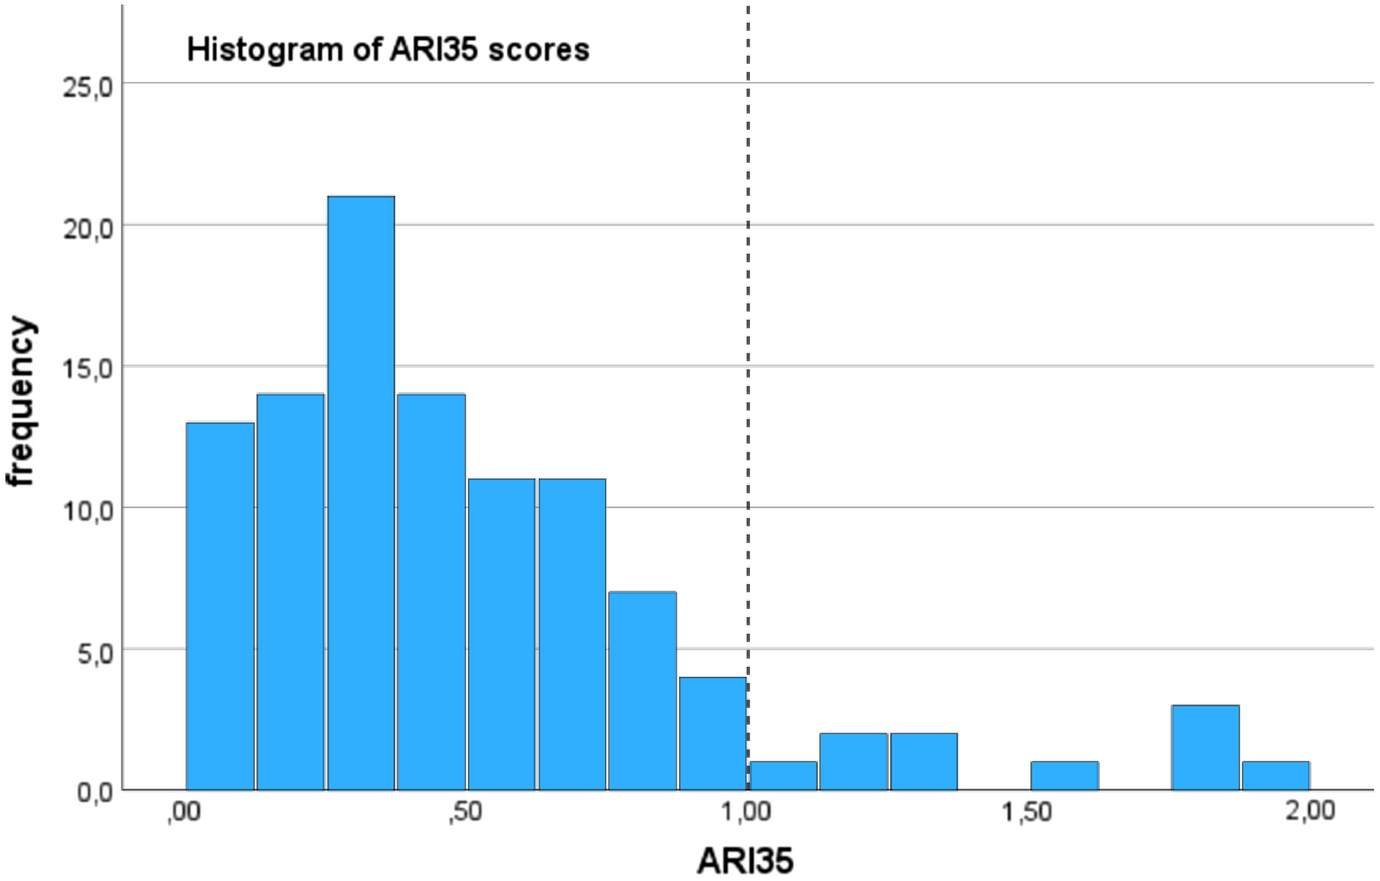
The average age of party parliamentary groups ranges from below 39 years (ROU-USR, ITA-M5S and NLD-SP, the list of party abbreviations is featured in Appendix) to up to 59.39 years (JPN-NKP). The share of MPs below the age of 35 varies between 0.0 (twelve parties from nine countries) and 50.0% (NLD-SP and SWE-MP). Whilst 41 of the 105 parties have a share of young MPs above 15.0%, only 20 of them exhibit a share of 20.0% or higher. Overall, high shares of young MPS thus remain exceptional. Contrary to what one might expect, these parties come from a wide range of countries—in 21 of the 28 included countries at least one party has a high share of young MPs (> = 20.0%). Turning to how representative these shares are of the voting population, we also observe a wide range (Fig. 1), whilst it becomes apparent that people below the age of 35 are underrepresented in the overwhelming majority of our cases.
Histogram of ARI35 scores (mean = 0.505, standard deviation = 0.419). The dashed line indicates proportional representation

Secondly, we observe variation not only between but also within countries. To name just a few examples, the share of young MPs in Italy ranges from 5.5 percent (FI) to 38.8 percent (M5S), in Mexico from 9.1 percent (PVEM) to 16.7 percent (PRD) and in Sweden from 9.5 percent (L) to 50.0 percent (MP). This variation on the party-level can be observed in almost every multi-party system.
Regression analysis
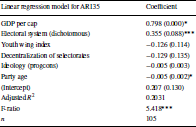
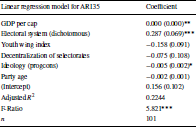
In Table 2, we present the results of a linear regression model. Whilst the overall model does not exhibit a good fit (adjusted R 2 = 0.2031), it allows us to observe first tendencies in the data. As expected, the electoral system has a sizeable and highly significant impact. Regarding GDP per capita, we observe a higher GDP per capita to positively influence youth representation (significant at 0.05 level with a high effect size), which lends evidence to the theoretical expectation based on the postmaterialism thesis. Interestingly, the effect direction for party age (significant at 0.05 level) is according to our expectations, but the effect size is very small. Youth Wings and Ideology do not show significant effects. We eliminated kurtosis and skewness of the model by excluding four outliers (ROU-USR, SWE-MP, NLD-SP, ITA-M5S) The corrected model is reported in Appendix (Table 8). The significance changed only slightly, and the main findings remained robust.
Linear Regression Model for ARI35 as dependent variable

Standard errors in parentheses. Significance codes: ***0.001, **0.01, *0.05, 0.1
Set-theoretic analysis
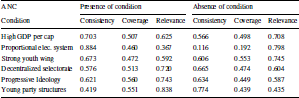
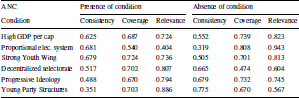
After having presented the regression results above, we will start the description of our QCA results by looking into the positive outcome: parties that adequately represent young adults in their parliamentary groups. In line with good practices of QCA research (Mello Reference Mello2021: 71), we will present the analysis for the non-outcome below. The first step of a set-theoretic analysis is the analysis of necessary conditions (for results see Table 3). None of the conditions pass the benchmark of 0.90 consistency, which in QCA research is understood as the benchmark to be considered a necessary condition for the occurrence of an outcome (Schneider and Wagemann Reference Schneider and Wagemann2012: 143). The condition of a proportional electoral system is quite close though. This finding is in line with our theory that a combination of more than one specific condition leads to a higher number of young MPs.
Analysis of necessary conditions (ANC) for the outcome of adequate youth representation/high ARI35 scores

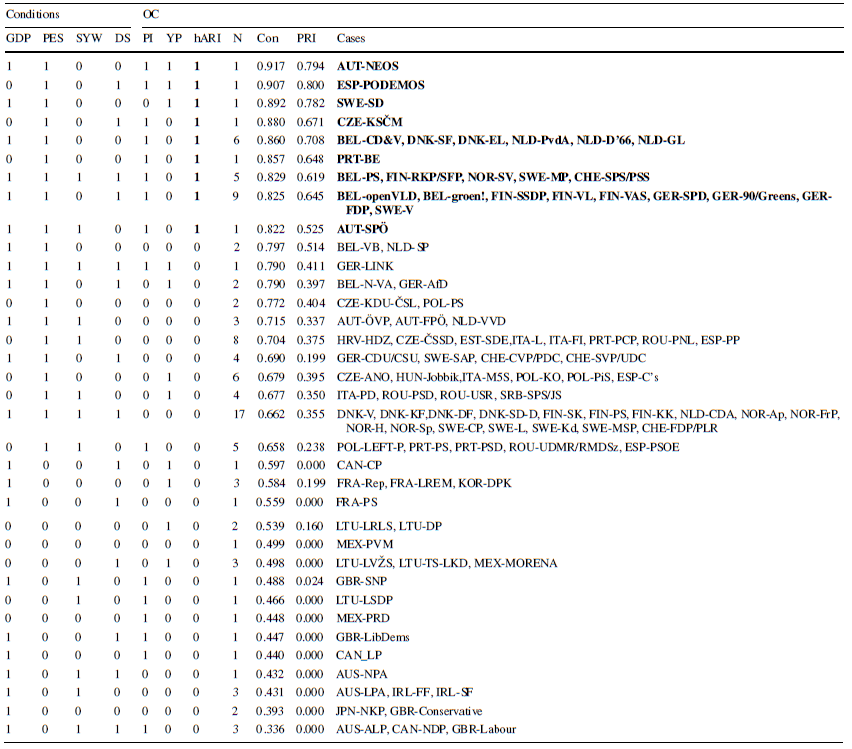
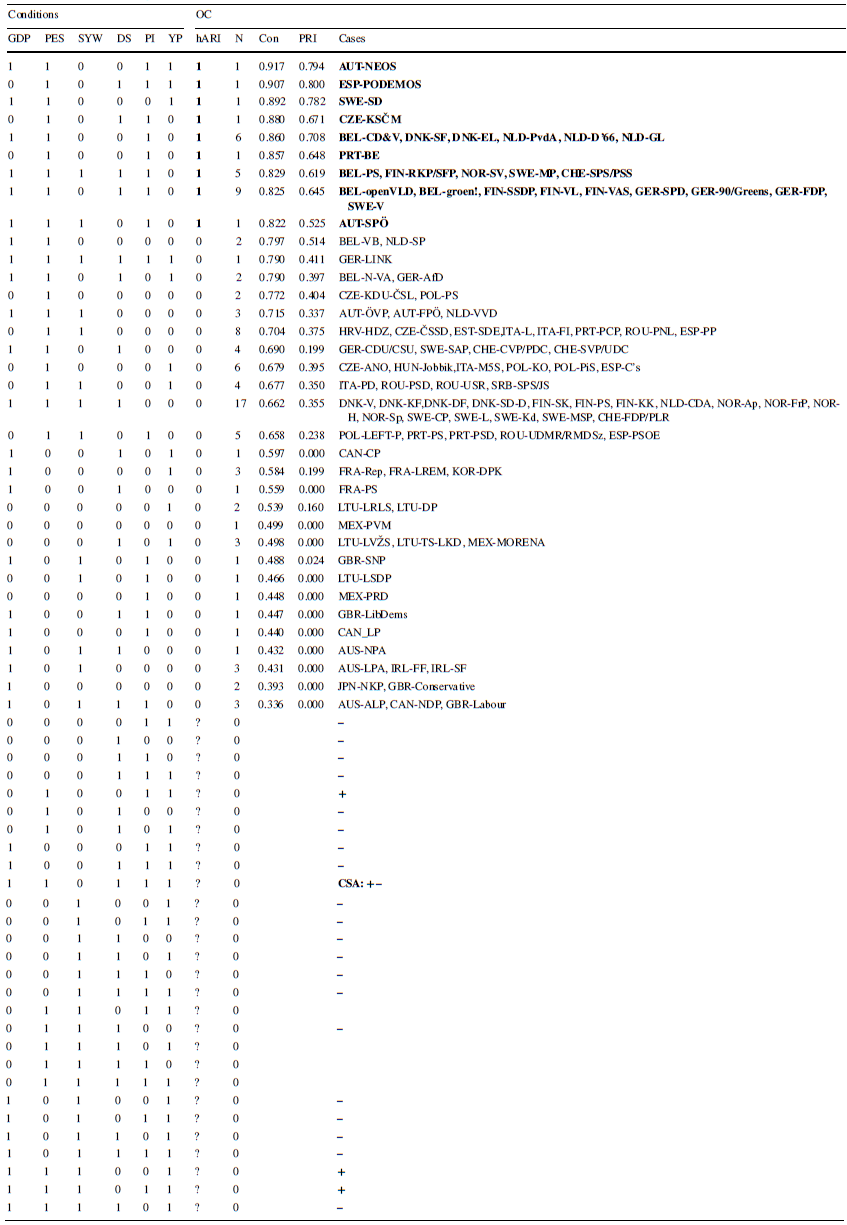
In the next step of a set-theoretic analysis, a truth table is constructed and minimized through Boolean algebra. The whole truth table, including logical remainders (rows without cases) is presented in Appendix (Table 9). The consistency column shows to which degree “a row is formally sufficient for the outcome” (Meissner and Mello Reference Meissner and Mello2022: 258), where a score of 1 indicates perfect consistency. The PRI can indicate ambiguous subset relations if it is substantially smaller than the consistency score. The cases are listed on the right, where bold print indicates parties that are rather inside the outcome (set-membership > 0.5). All these “positive” cases are listed at the top, and we do not see “deviant” cases (cases with the same configuration as the positive ones but without showing the outcome). The truth table also shows that there is no sufficient condition, neither for the outcome nor for the non-outcome (Table 4).
Truth table without logical remainders

OC = Outcome, GDP = high GDP per capita, PES = proportional electoral system, SYW = strong youth wing, DS = decentralized selectorate, PI = progressive ideology, YP = young party structures, hARI = high ARI35 score, Con. = Consistency, PRI = proportional reduction in inconsistency. Logical remainder rows are omitted to enhance clarity
The last step of the analysis consists in minimizing the truth table, for which we have used the R package by Dusa (Reference Dusa2019). We decided on the parsimonious solution due to better interpretability and because no intermediate solution was feasible. The logical remainders that have been used for minimization are indicated in Table 9 in Appendix. The conservative solutions were tested and are fully reported in the appendix. We compared the parsimonious solution with the conservative solution and evaluated carefully if the minimalization of the parsimonious outcome is justified in all paths and for all cases. For the outcome and the non-outcome, we observed the same condition patterns and tendencies but higher complexity in the presentation of the paths, as minimization was restricted to observable combinations. We could not find theoretical arguments that would speak against using specific logical remainders for minimizing. Thus, we disregarded the construction of an intermediate solution.
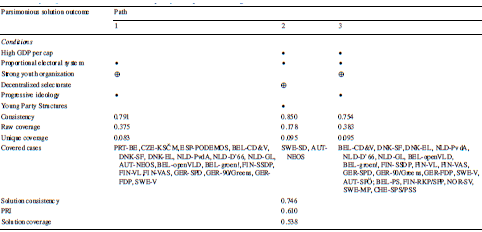
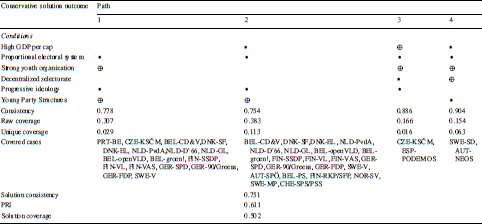
The parsimonious solution for the positive outcome, an adequate representation of young people in party groups (high ARI35 scores), presents three alternative paths to the outcome (Table 5). The depiction follows standard practice: black circles indicate the presence of a condition, crossed-out ones the absence of a condition. The empirical configurations leading to the outcome have some overlap between paths one and three. The parsimonious solution displays an overall consistency of 0.746 and a coverage of 0.538, meaning that 53.8% of the outcomes are covered by the solution model. These rather low measures of fit result from many of the “positive” cases holding only partial membership. Nevertheless, we think that the advantages of using fuzzy sets outweigh the fact that crisp sets would lead to higher overall measures of fit.
Fuzzy set QCA results for the outcome of adequate youth representation/a high ARI35 score

The black circles indicate the presence of a condition, the crossed-out circles indicate its absence. Inclusion-cut: 0.80
In line with the regression analysis, we observe the condition of a proportional electoral system to be present in all three paths. Especially the combination with a progressive ideology and the absence of a formally strong youth organization seems to be meaningful (paths one and three). This is surprising, as we expected youth wings with formalized rights to be beneficial to youth representation. Path one, containing the three above-described conditions, covers cases from Portugal, the Czech Republic, Spain, Belgium, Denmark, the Netherlands, Austria, Finland, Germany and Sweden. The third path covers cases that additionally operate under the condition of a high GDP per capita. As it is a subset of the first path, many of the cases covered in path three also appear in path one. The second path contains a high GDP per capita combined with proportional representation, the absence of a decentralized selectorate and young party structures. It covers two cases.
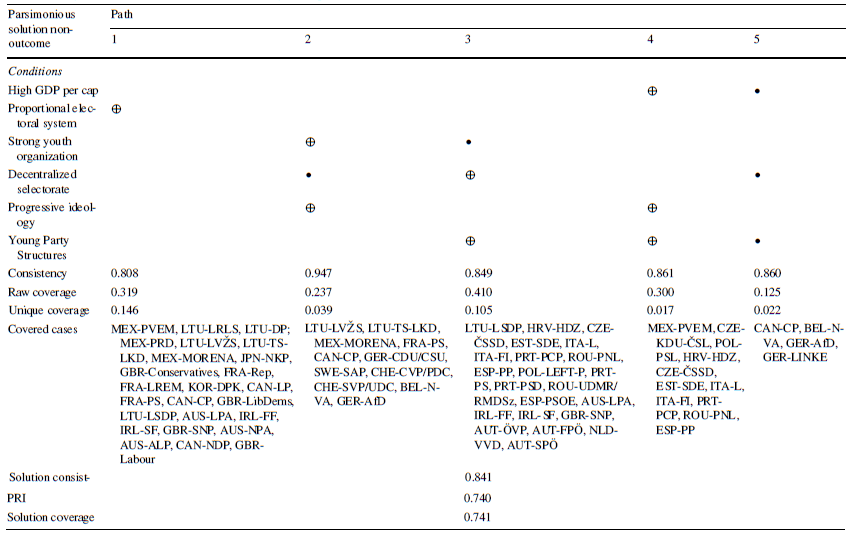
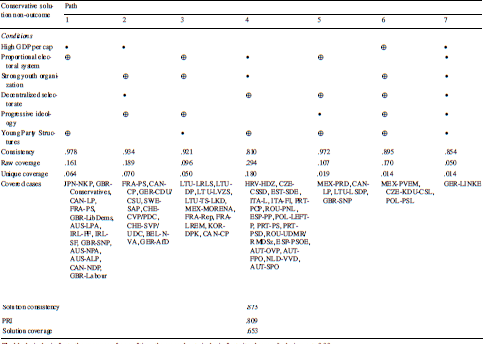
We will now analyse the negative outcome, i.e. a strong underrepresentation of young adults in the party parliamentary groups. The analysis of necessary conditions is reported in Appendix (Table 12). Again, none of the conditions passed the benchmark to be considered a necessary condition. Analogous to the analysis of the positive outcome, we have again opted for the parsimonious solution (Table 6, the conservative solution is presented in Appendix). As we identified a single Contradictory Simplifying Assumption (see Table 9 in Appendix) which we assume would rather produce a positive outcome, we present the parsimonious solution without this logical remainder and a short discussion in Appendix (Table 14).
Fuzzy set QCA results for the outcome of low youth representation/a low ARI35 scores

The black circles indicate the presence of a condition, the crossed-out circles indicate its absence. Inclusion-cut: 0.80
For the non-outcome—a low AR35 score—the QCA parsimonious solution presents five paths. The model consistency is 0.841 with a coverage of 0.741. The higher complexity of the solution for the non-outcome arises partly from the greater number of cases. The first path only contains one absent condition. Parties from countries without proportional representation tend to have a lower share of young MPs. Included cases are from Great Britain, France, South Korea, Mexico, Ireland, Australia, Lithuania, Canada and Japan (where 289 out of 465 MPs are elected in single-member districts). Again, this is line with previous findings and the results from the regression model. The second path covers non-progressive parties with decentralized selectorates that do not have (strong) youth organizations, such as the French PS or the German CDU/CSU. The third path entails the opposite for two of the previous combinations. It features strong youth wings and centralized selectorates in old parties. Examples are the FPÖ, SPÖ, and ÖVP from Austria. The fourth path covers old, non-progressive parties from countries with a relatively low GDP per capita, such as the Mexican PVEM, the Polish PSL, or the Czech CSSD. The final path is the only one which has a combination of three present conditions: a high GDP per capita, decentralized selectorates and young party structures. This path covers four cases: Canadian CP, Belgian N-VA as well as German AfD and LINKE.
Discussion
We will begin the discussion of our results by looking at the positive outcome. We will focus on the configuration of the following conditions, which are present in paths one and three: a proportional electoral system, a progressive party ideology and a weak or non-existent youth organization. The last condition either presents itself as the complete absence of a youth organization or that such an organization does not have institutionalized rights under the party’s statute. Whilst the finding that weak or non-existent youth organizations are a condition for high youth representation in parliament is quite counter-intuitive at first sight, the first two conditions are in line with our earlier theoretical reasoning.
Let us analyse the covered cases from path one more closely: the three German Parties (FDP, 90/GREENS, SPD) all have a youth organization that is quite present in the national media, particularly their spokespersons and leaders. They also encompass a rather high share of the total number of party members, especially within 90/GREENS, where young people up to the age of 35 constitute 27.7 percent of the total members (Bundesvorstand BÜNDNIS 90/DIE GRÜNEN 2022). We thus see a group of parties where we can speculate that these youth organization do fulfil the functions we mentioned earlier, even if they do not have institutionalized rights in the party statute: they recruit new potential candidates and give these individuals the opportunity to gain political and electoral capital. This might also apply to the Dutch GREEN LEFT, D’66 and LABOUR PARTY, Austria’s NEOS, Belgium’s GREEN, OPEN FLEMISH LIBERALS AND DEMOCRATS as well as the CHRISTIAN DEMOCRAT & FLEMISH4, Finland’s LEFT ALLIANCE and its SOCIAL DEMOCRATIC PARTY, Sweden’s LEFT PARTY and Denmark’s SOCIALIST PEOPLES PARTY (alternatively: Green Left), who all have youth organizations. In this case, our operationalization of the strength/integration of youth wings seems to not entirely capture whether youth wings are able to fulfil their functions.
A second group of parties do not have youth organizations at all: the COMMUNIST PARTY from the Czech Republic, the RED-GREEN ALLIANCE from Denmark, PODEMOS from Spain and Portugal’s LEFT BLOC. Whilst they come from a wide range of countries, they belong to only two party-families: the extreme left and green. These are said to either be close to youth movements or—in the case of green parties—to have derived from them. One could thus argue that these parties featuring a progressive ideology and operating within proportional electoral systems simply do not need youth organizations to have a genuine interest in young politicians. Having rather young electoral bases already, these parties have systemic incentives to put forward young candidates, as voters generally prefer political candidates of roughly their own age.
We thus hypothesize that the parties grouped together within the first path, due to their non-existent or weak youth organizations, do not necessarily fall into the same category. A “weak” youth organization might still perform the above-described functions of more institutionalized ones, or they might not be necessary for parties to have a genuine interest in youth representation if other conditions apply (progressiveness, proportional electoral representation, and electoral incentives). Of course, it could also be a combination of the two.
Let us now focus on the analysis of the non-outcome, of parliamentary groups with a very low ARI35 score and thus a low share of young MPs. The first path is in line with what we expected and confirms the finding from earlier works that majority voting leads to the underrepresentation of young people in national parliaments.
The second path covers conservative parties with no or weak youth wings and decentralized nomination structures such as the German, Swiss and Lithuanian CHRISTIAN DEMOCRATS. Whereas the first two conditions are in line with our expectations, the last one requires an explanation: following theoretical arguments from research on minorities’ and women’s representation (Fortin-Rittberger and Rittberger Reference Fortin-Rittberger and Rittberger2015; Matland and Studlar Reference Matland and Studlar1996; Rahat and Hazan Reference Rahat and Hazan2001), we can hypothesize that decentralized nomination structures lead to less young MPs in conservative parties as the local or regional party entities generally face less heterogeneity compared to the national party bodies, which are trying to win votes on a national level with a naturally more diverse electorate. This effect might be reinforced by the absence of strong youth wings. Weak or non-existent youth organizations are not able to fulfil a recruitment function or to push for young candidates. Thus, the local or regional party branches face not only a lack of young candidates but also incentives to put them on electoral lists. Alternatively, one could argue that if a party is conservative and has no or only a weak youth organization, the nomination level is simply irrelevant as there are no voter-based incentives to put forward young candidates and no intra-party organ providing or pushing for them.
The third path covers a wide range of cases and features the condition of a strong youth organization, old party structures and centralized nomination structures. Whilst the latter two are in line with what we expected, the first one is counterintuitive. One possibility is that these youth organizations only exist as tokens or due to regulatory requirements stemming from party law. The covered cases encompass three Portuguese parties (PSD, PS, PCP), three Austrian ones (ÖVP, SPÖ, FPÖ), two Italian parties (L, FI), two Irish parties (FF, SF), two Romanian ones (PNL, UDMR/RMDSz), two Spanish ones (PP, PSOE) and single cases from nine additional countries. This country-based grouping might also point towards country-level factors that are not included in our analysis. Additionally, we can observe that many cases belong to the “old left”—they are either socialist or social democratic parties with a long history, which are often in competition with newer left parties (e.g. the Spanish SOCIALIST PARTY is in competition with PODEMOS), which might be more attractive for young people. We can thus hypothesize that their low share of young MPs is connected to party family and their respective position within the party system as well as possibly to path dependencies arising from the parties’ history (see Stockemer and Sundström Reference Stockemer and Sundström2022c: 85–86, who found especially communist parties to have old MPs). However, further research is needed to explain this configuration.
The fourth path is in line with our theoretical expectations and shall thus not be discussed further. The fifth path covers parties that are relatively young, have decentralized nomination structures and operate in countries with a relatively high GDP per capita: The Canadian CONSERVATIVE PARTY, the Belgian NEW FLEMISH ALLIANCE and the two German parties, THE LEFT and ALTERNATIVE FOR GERMANY. Except for THE LEFT, all parties are either centre-right or right-wing. The decentralized selectorates might be due to the federalist systems these parties operate in. Based on our theoretical perception of the configuration, we do not want to infer causal relationships.
The discussion of our results has shown that except for the electoral system, it is seldom the case that one factor alone significantly influences youth representation. Mostly, it is a combination of conditions under which we observe that parties have high or low shares of young MPs. We can also summarize that particularly the role of youth organizations is quite ambivalent and that further research on their influence regarding the descriptive representation of young people is needed. In some parties they seem to fulfil an important role even without having much power on paper, whereas in other cases one could speculate that they are used as a token to present a party as “youth friendly”, rather than the young wing having a substantial influence on whether the party promotes young candidates. A similar argument could be made for decentralized nomination structures, which under some conditions seemingly support descriptive youth representation, whilst they are irrelevant or even counterproductive under others.
Conclusion
In this article, we have analysed the conditions under which we observe adequate youth representation in party parliamentary groups and the conditions under which youth is strongly underrepresented. The most robust finding is in line with previous research: that the electoral system matters. Focusing on party-level factors, we have shown the importance of applying different methodological approaches when studying a phenomenon. Using a combination of regression analysis and QCA, we could explain some of the previous contradictions in the literature, namely regarding the influence of ideology on descriptive youth representation. Ideology did not seem to play a role in explaining age variance in the EP (Sundström and Stockemer 2018), but it turned out to be significant with regards to the share of young MPs in national parliaments (Stockemer and Sundström Reference Stockemer and Sundström2022c: 85). Our results indicate that whilst ideology might not be a significant factor on its own, it becomes influential especially in combination with PR systems. This explains why in regression analyses—depending on the share of PR systems in the sample—it sometimes appears as a significant factor, whilst in other cases it is insignificant (as in our sample, where it is barely significant at the 0.1 level).
Additionally, we have theoretically discussed and empirically tested the influence of youth wings and the selectorate structure, factors that until now have not been analysed in the comparative research on youth representation. We have shown that the influence of these party-level factors is ambivalent and context-specific. Depending on the configuration, youth wings with strong formalized rights seem to either foster or hinder the election of young candidates. More research is thus needed, as the used operationalization might not capture all the functions youth organizations are said to perform. We also tested party age and, contrary to earlier research which found party age to be a significant factor (Stockemer and Sundström Reference Stockemer and Sundström2022c), we found it mattered only for a minority of the cases.
Overall, our paper contributes to filling the research gap concerning the influence of meso- and party-level variables on youth representation (Stockemer and Sundström Reference Stockemer and Sundström2019: 139). We found this gap to still be present today. Hence, more research focusing not only on the variance in youth representation between countries but also within them is necessary. Information on our open-access data set, which enables such research, can be found in Appendix.
Notes
-
The selectorate is defined as the decision-making body/bodies regarding candidate selection.
-
Replication Material can be found at Harvard Dataverse: https://doi.org/10.7910/DVN/CDZMPM
-
The timeframe led to the exclusion of parties from Bulgaria, as the last elections were held in 2016 and 2021. We also decided to exclude Israel, as MPs change too frequently between the parties for our theoretical framework to be applicable to the case.
-
All the other listed parties are either left(-leaning) or green parties. The case BEL-CD&V is therefore special, as it is Christian democratic. The CD&V’s party manifesto for the 2019 elections scored high on the Party Manifesto Project’s welfare indicator, which is why it is identified as a progressive party by the progcons indicator.
Acknowledgements
We would like to thank the panel participants and discussants at GraPa 2023, EPSA 2023, ECPR 2023 and especially the two anonymous reviewers for their valuable and very constructive feedback on earlier versions of the article. Additionally, we would like to thank Megan Stewart, Malte Jennerjahn and João Marques Sampaio for their indispensable help building the data set. Kira Renée Kurz is receiving a scholarship from Heinrich-Böll-Foundation.
Funding
Open Access funding enabled and organized by Projekt DEAL.
Appendix

Notes on the Age Representation on Party-Level Data set
To calculate our outcome variables, we used the age at the day of election and not the age at the beginning of the tenure, as the duration of the time between election and the beginning of a legislative period varies quite strongly over different countries and thus, using the time of election enhances comparability.
As information on whether MPs were directly elected or entered parliament at a later point in time (as replacements) was not always available, both are included in our calculations. Hence in some cases, the number of MPs included in the calculation might not align with the number of seats the party held during the legislative period. For those MPs that entered parliament over the course of the legislative period, their age is still calculated for the time of election and thus will not correspond exactly with their age at the time of entering parliament. Since it is possible to differentiate between directly elected candidates and replacement candidates for some countries, we will include this information in a later version of the data set. This will enable robustness tests controlling for the status of the deputy.
The whole data set covering 163 cases from 30 countries includes different age indicators for party parliamentary groups. It has been published open access together with a research note offering descriptive insights (https://doi.org/10.7910/DVN/EPHSUS).
Construction of the youth wing index
The youth index is an additive index where the party’s score is derived from how they answered the following questions contained in the Political Party Database.
PPD Var_Label A50YOUTHORG: Youth org mentioned in party statute? (As organization with individual membership).
Yes: 0,4 points
No: 0 points
PPD Var_Label A59CONYOUTH: May the youth organization send delegates to the party congress?
Yes: 0,3 points
No: 0 points
PPD Var_Label A69EXCYOUTH: According to the statutes, is the youth organization entitled to seats on the party’s highest executive body?
Yes: 0,3 points
No: 0 point
Correlation plots
See Figs.
Correlation matrix for the raw data

2 and
Correlation matrix for calibrated data

3.
Histograms for raw data
See Figs.
Histogram for GDP per capita

4,
Histogram for the youth wing index

5,
Histogram for the index scores capturing the decentralization of party selectorates

6,
Histogram for progressiveness scores (progcons indicator)

7,
Histogram for party age

8.
Calibration plots
See Figs.
Calibration plot for the outcome ARI35

9,
Calibration plot for GDP per capita

10,
Calibration plot for decentralized selectorates

11,
Calibration plot for the progressiveness of party ideology

12,
Calibration plot for party age

13.
Regression without outliers
See Table
Linear regression model for ARI35 as dependent variable after correcting for kurtosis and skewness

Standard errors in parentheses. Significance codes: ***0.001, **0.01, *0.05, 0.1
8.
Complete truth table
See Table
Truth Table with logical remainders

OC = Outcome, GDP = high GDP per capita, PES = proportional electoral system, SYW = strong youth wing, DS = decentralized selectorate, PI = progressive ideology, YP = young party structures, hARI = high ARI35 score, Con. = Consistency, PRI = proportional reduction in inconsistency. + indicates logical remainder rows used in the parsimonious solution for the positive outcome, – those used for the non-outcome. CSA = Contradictory Simplifying Assumption
9.

Conservative solution for the outcome
See Table
Fuzzy set QCA results for the outcome of adequate youth representation/a high ARI35 score

The black circles indicate the presence of a condition, the crossed-out circles indicate its absence. Inclusion-cut: 0.80
11.
ANC for the non-outcome
See Table
Analysis of necessary conditions (ANC) for the outcome of low youth representation/low ARI35 scores

12.
Conservative Solution for the non-outcome
See Table
Fuzzy set QCA results for the outcome of low youth representation/a low ARI35 score

The black circles indicate the presence of a condition, the crossed-out circles indicate its absence. Inclusion-cut: 0.80
13.
Parsimonious solution for the non-outcome without the contradictory simplifying assumption (CSA)
After identifying the CSA (high GDP per capita, proportional electoral system, weak/non-existent youth wing, decentralized selectorate, progressive ideology and young party structures) we checked the plausibility (as recommended by Yamasaki and Rihoux Reference Yamasaki, Rihoux, Rihoux and Ragin2009). Based on our theoretical approach, it is most plausible that this path would lead to a positive outcome, especially with regards to the electoral system condition. We thus minimized the truth table without this logical remainder for the non-outcome. The resulting parsimonious solution is presented below (Table
Fuzzy set QCA results for the outcome of a low share of young MPs (< 35 years) without using the CSA

The black circles indicate the presence of a condition, the crossed-out circles indicate its absence. Inclusion-cut: 0.80
14).
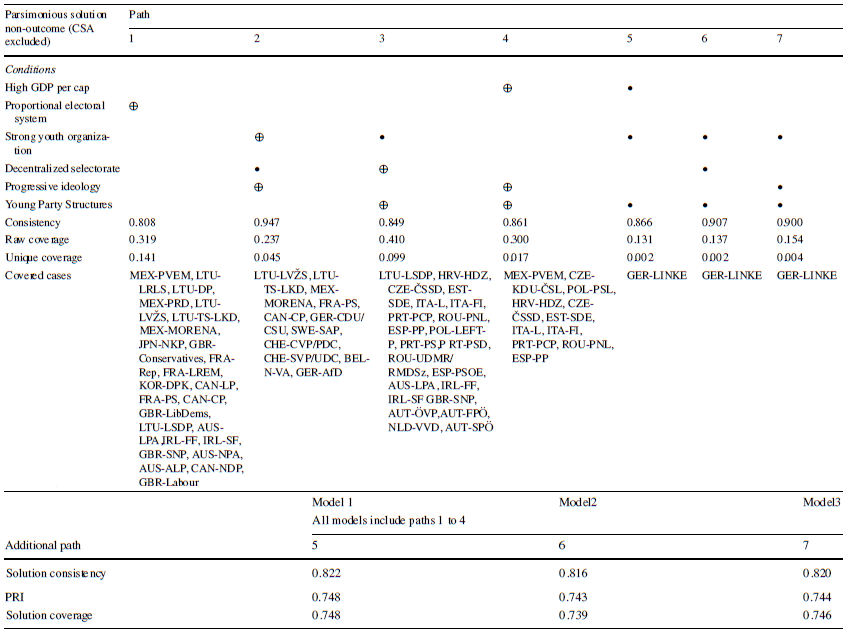
The configurations of conditions have not changed for paths one to four. For these paths consistency, raw and unique coverage remained stable as well. But we do observe a change with regards to the rest of the model. Whereas the parsimonious solution including the CSA featured only one model with an additional fifth path (high GDP per capita, decentralized selectorates and young party structures,
CAN-CP, BEL-N-VA, GER-AfD, GER-LINKE), the new parsimonious solu-tion excluding the CSA features three different models. All of these include the first four paths and then one additional path with varying configurations of conditions but always covering the same single party: Germany’s DIE LINKE. We can thus argue that Ger-many’s left party is a special case with regards to youth represen-tation: It operates in a well-developed country with a proportional electoral system, has a formally strong youth organization, decen-tralized candidate selection, a progressive ideology and is a ra-ther young party. From a theoretical perspective we would thus ex-pect a high share of young MPs, but the opposite is the case. As puzzling as this seems at first glance, it fits into the wider pic-ture: In their book chapter on parties, Stockemer and Sundström found especially communist parties to have old MPs (2022c: 85–86). Whilst it is debatable whether DIE LINKE can still be considered communist, it is definitely part of the old left and might thus be influenced by comparable path dependencies. But further research, especially focusing on individual cases, is needed to understand what it is exactly, that make communist parties “old” parties.
See Table 14.


 Open access