


Introduction
In this paper, we study the differential infant and child mortality in Madrid between 1916 and 1926, according to the birthplace of the mothers. Historical demographers have studied the integration of newcomers into growing urban populations through the lenses of intermarriage (Dribe et al. Reference Dribe, Hacker and Scalone2018; Weiss and Stecklov Reference Weiss and Stecklov2020; Pagnini and Morgan Reference Pagnini and Morgan1990) and fertility (Kulu et al. Reference Kulu, Milewski, Hannemann and Mikolai2019; Moreels and Vandezande Reference Moreels and Vandezande2012; Schumacher et al. Reference Schumacher, Matthijs and Moreels2013). The immigrant mortality paradox is also well known, describing the undermortality of international immigrants but also of rural-urban migrants because of their selection among healthier people (Kesztenbaum and Rosental Reference Kesztenbaum and Rosenthal2011; Oris and Alter Reference Oris and Alter2001; Puschmann et al. Reference Puschmann, Donrovich, Grönberg, Dekeyser and Matthijs2016). However, the mortality of the children of migrants has rarely been considered, and then mainly in the North American context (Dribe et al. Reference Dribe, Hacker and Scalone2020; Bakhtiari Reference Bakhtiari2018; Olson and Thornton Reference Olson and Thornton2011; Preston et al. Reference Preston, Ewbank, Hereward and Watkins1994).
To contribute to a cumulative science and question differentials in infant and child mortality by origin of the mother, early 20th-century Madrid is a relevant case. Migration was the main motor of the transformation of a modest town that counted 279,370 inhabitants in 1860 into a dominant metropolis that approached one million in 1930 (Ramiro-Fariñas et al. Reference Ramiro-Fariñas, Oris, Mazzoni, Bavel, Coninck, Puschmann and Putte2021). The capital of Spain attracted 21 to 23 percent of all permanent Spanish internal migrants (Silvestre Reference Silvestre2005). Most of the newcomers were unskilled workers coming from the large surrounding Castilian Plateau, but a population of civil servants recruited all across the country also came to work in the national capital (Ramiro-Fariñas et al. Reference Ramiro-Fariñas, Oris, Mazzoni, Bavel, Coninck, Puschmann and Putte2021).
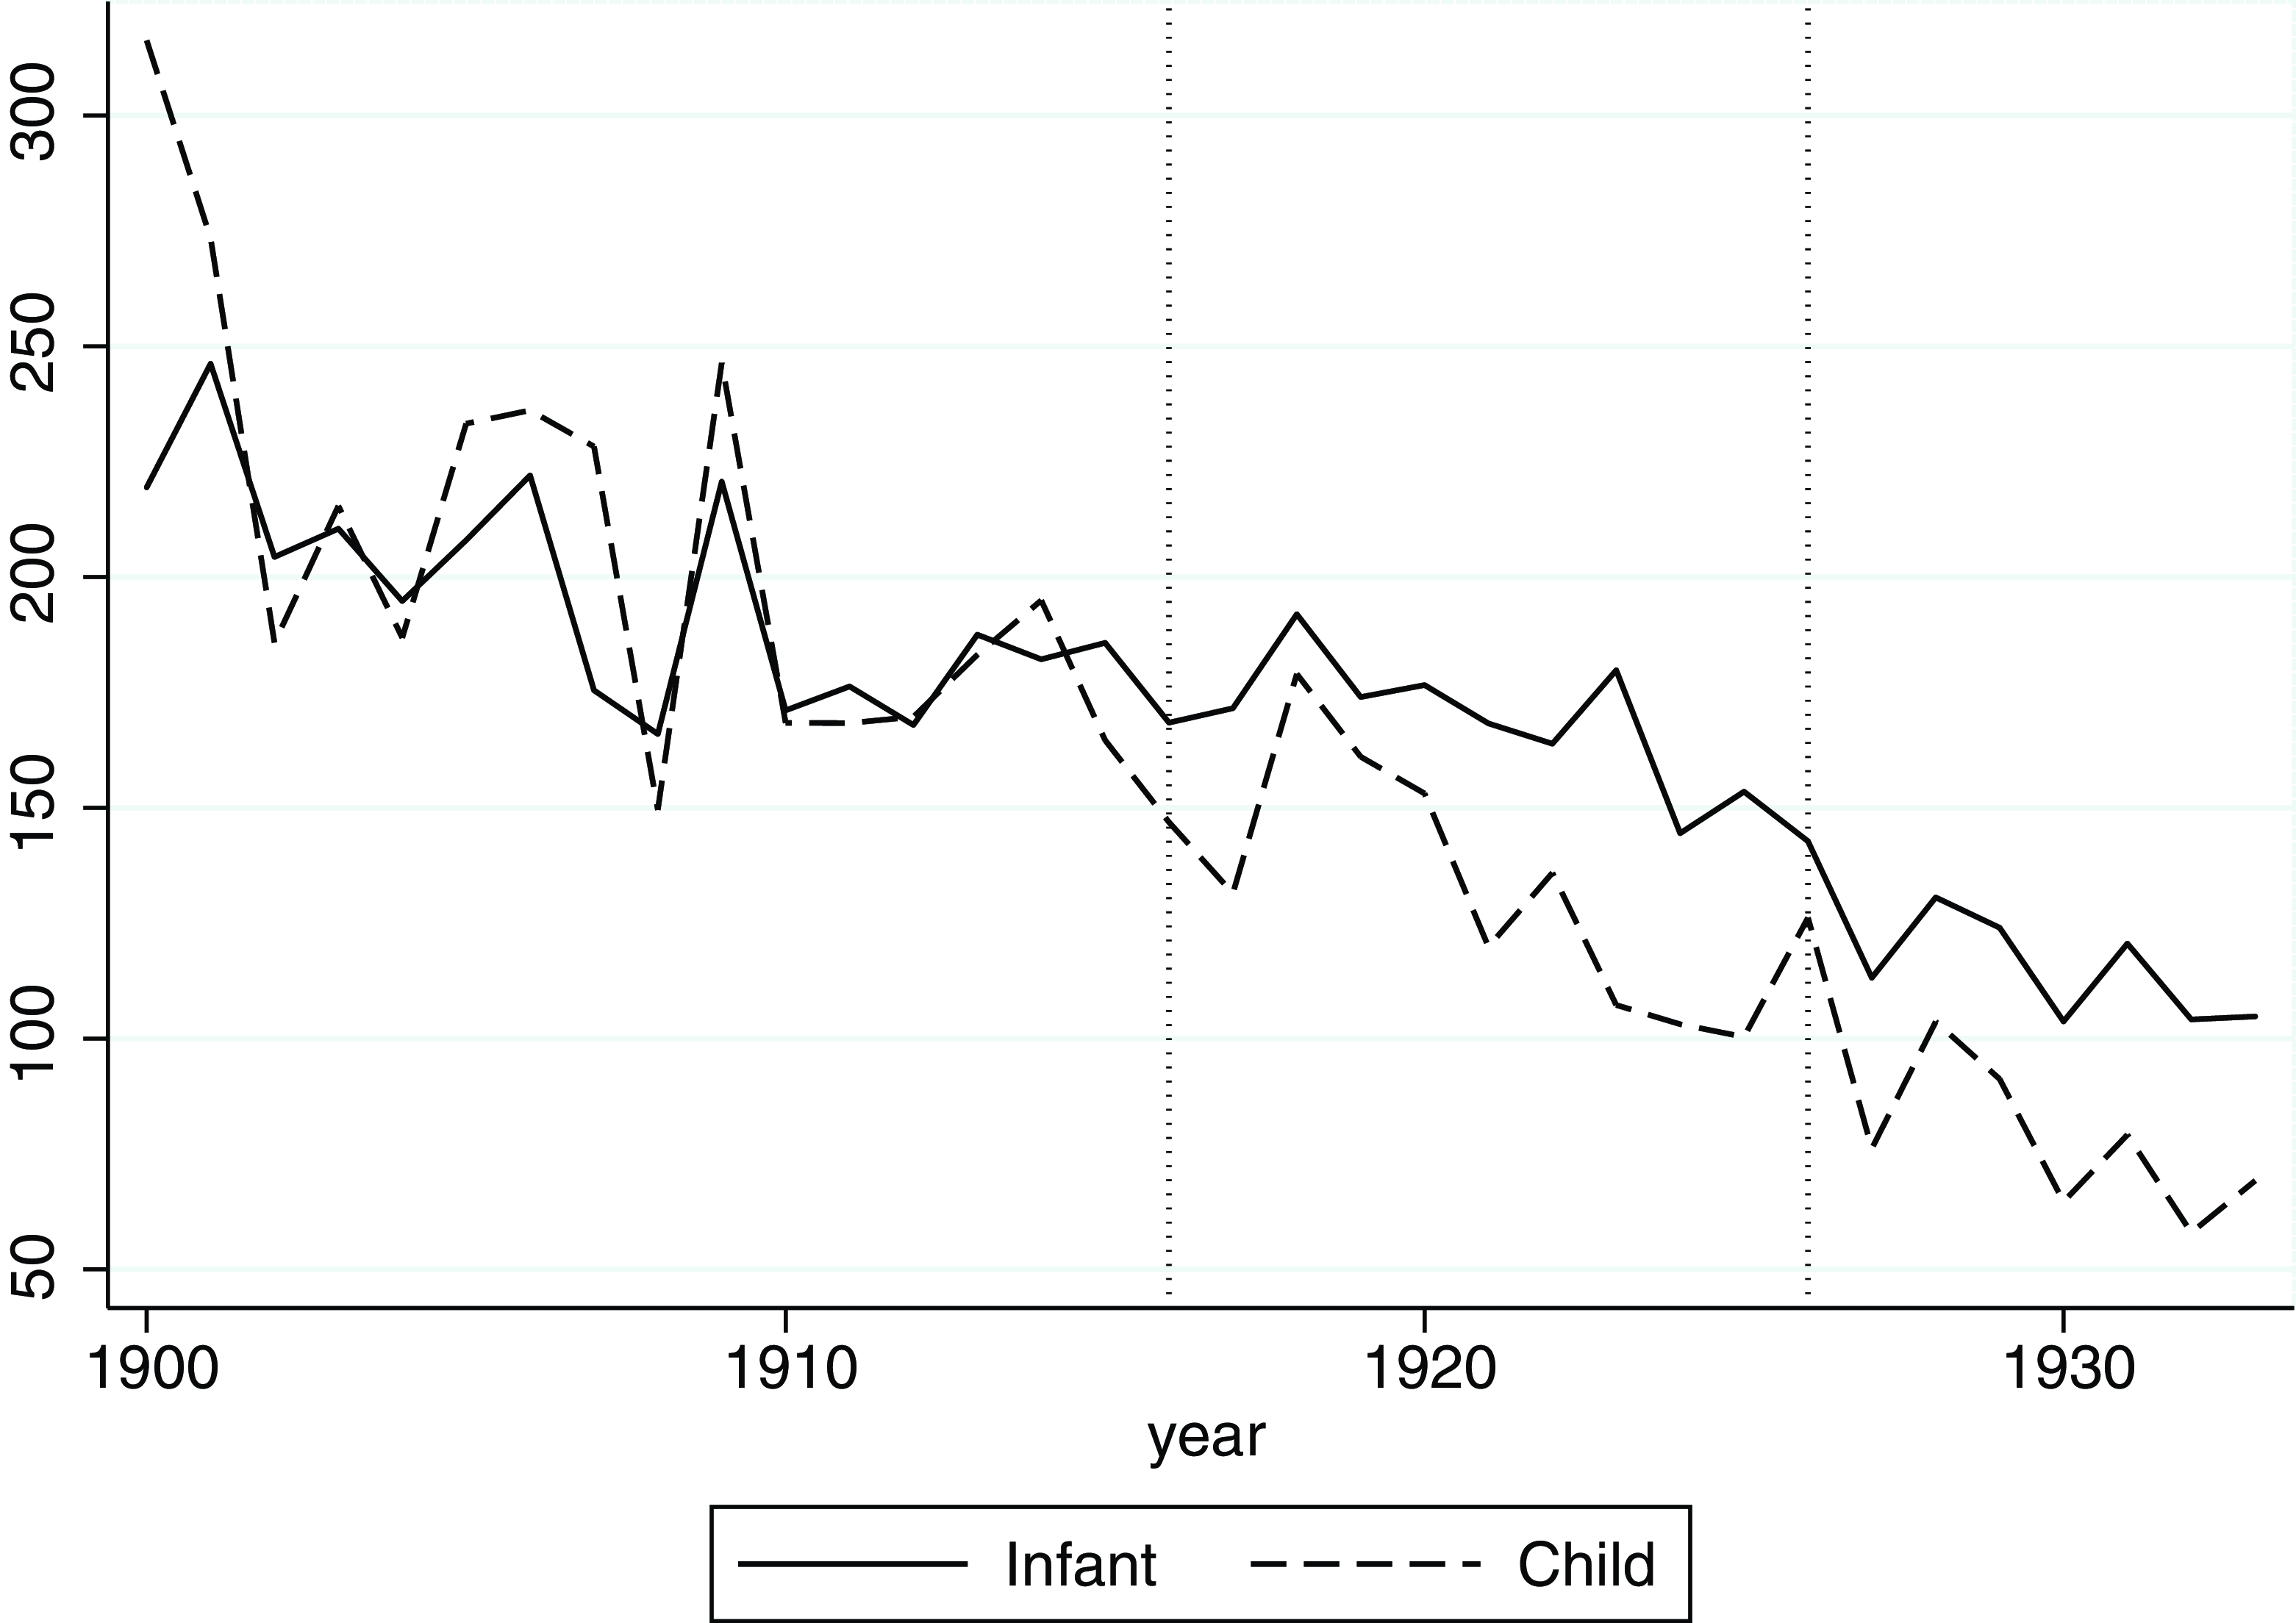
Moreover, at the dawn of the 20th century, Madrid was named “the city of death” (Revenga Reference Revenga1901) and reputed to be a dangerous place. Its demographic expansion exceeded its infrastructure, causing a deterioration in its hygiene and housing conditions (Porras-Gallo Reference Porras-Gallo2002). Between 1916 and 1926, Madrid was characterized by high infant and child mortality, with levels higher than those in Glasgow, Edinburgh, and towns in Prussia, Belgium, Sweden and the United States during the same period (Cage and Foster Reference Cage and Foster2003; Vögele and Woelk Reference Vögele and Woelk2002; Debuisson Reference Debuisson2001; Helgertz and Önnerfors Reference Helgertz and Önnerfors2019; Eriksson et al. Reference Eriksson, Niemesh and Thomasson2018). Madrid’s vulnerability was quite evident in the early 20th century, when the brutal waves of Spanish influenza from April 1918 to April 1919 and November 1919 to February 1920 (Cilek et al. Reference Cilek, Chowell and Ramiro-Fariñas2018) did not interrupt but rather slowed down the mortality transition (Figure 1). In this transition, Spain was a late-comer at the European level, but within the country, the decrease was faster in cities such as Madrid (Reher Reference Reher2001). This has been attributed to more effective progress in water sanitation and health policies in urban environments than in rural areas (Casado-Ruiz and Ramiro-Fariñas Reference Casado-Ruiz, Ramiro-Fariñas, Otero-Carvajal and Miguel-Salanova2018; Haines Reference Haines2001; Oris and Ramiro-Fariñas Reference Oris, Ramiro-Fariñas, Ramiro-Fariñas and Oris2016).
Infant and child mortality in Madrid, 1900–1960.
Source: Adapted from Diego (2008).
Indeed, between 1880 and 1930, the Madrid city center gained the attributes and appearance of a modern capital after important investments were made in public hygiene, the construction of new buildings, the development of national administrative entities, educational facilities, and business and shopping districts (Cardesín-Díaz and Mirás-Araujo Reference Cardesín-Díaz and Mirás-Araujo2017). Conversely, living conditions were extremely poor in peripheral areas. Progress was associated with growing differences between neighborhoods where inhabitants accumulated advantages and the areas the contemporaries called “barrios negros” or “barrios bajos” (meaning low neighborhoods), which accumulated disadvantages (Díaz-Símon Reference Díaz-Símon2016; Vicente-Albarrán Reference Vicente-Albarrán2015). Social stratification and spatial segregation characterized Madrid’s urban environment and heavily affected the inhabitants’ relationships with life and death (Ramiro-Fariñas et al. Reference Ramiro-Fariñas, Oris, Mazzoni, Bavel, Coninck, Puschmann and Putte2021).
In this paper, building on the literature and considering the Madrid-specific context, we test two hypotheses. The first builds on the “fundamental cause” theory, which considers that differences in access to both preventive and curative resources are related to socioeconomic status (Link and Phelan 1995; Reference Link, Phelan, Bird, Conrad, Fremont and Timmermans2010). Migrant families tended to be concentrated in disfavored neighborhoods, to face the worst lodging conditions, to have less access to healthy food for both mothers and babies (Moch Reference Moch2003; Walter and Pinol Reference Walter and Pinol2003; Parella et al. Reference Parella, Piqueras and Solé2023), and consequently to be more responsive to environmental conditions (Ramiro Fariñas et al. Reference Ramiro-Fariñas, Oris, Mazzoni, Bavel, Coninck, Puschmann and Putte2021; Thiede and Brooks Reference Thiede and Brooks2018; Preston and Haines, Reference Preston and Haines1991). In brief, they were more at risk of poverty than natives, and their limited access to critical resources was the ultimate cause of the overmortality of their children (Dribe et al. Reference Dribe, Hacker and Scalone2020: 59; Bakhtiari Reference Bakhtiari2018).
The second hypothesis stresses economic, social and cultural capital. We assume that children born in Madrid of mothers also born in Madrid benefited more from the ongoing progress and were less vulnerable to environmental factors. Indeed, people rooted in a city had extended knowledge of their urban space acquired throughout their life course. They were aware of both avoidable risks and available resources, for example, clean water or the existence of a dispensary. They also had a better understanding of the housing market (Dribe et al. Reference Dribe, Hacker and Scalone2020; Bakhtiari Reference Bakhtiari2018; Oris and Perroux Reference Oris, Perroux, Poussou and Robin-Romero2007; Preston et al. Reference Preston, Ewbank, Hereward and Watkins1994). All this knowledge could make a difference at any time but must have been particularly important during the early stages of the epidemiological transition, when Pasteurian principles were spreading (Dribe et al. Reference Dribe, Hacker and Scalone2020: 60), as was the case in early 20th century Madrid. Additionally, natives tended to have a more powerful social network than most migrants, although the concentration of newcomers in religious and/or ethnic neighborhoods could create sociocultural enclaves where among others, child care practices from the region of origin could be maintained (Olson and Thornton Reference Olson and Thornton2011; Preston et al. Reference Preston, Ewbank, Hereward and Watkins1994). In short, compared to those who grew up in the city, immigrants had to acquire human and social capital specific to their place of destination. This challenge was even bigger when they had to find their way in a large city (Alter and Oris Reference Alter and Oris2005).
Those two hypotheses seem compatible. The first one insists on the migrants’ penalties, the second one on locals’ advantages, and both assume an excess mortality among migrants’ children. However, the promoters of the “fundamental cause” as the ultimate explanation of health and mortality differences recognized that the healthy migrant paradox (poor socioeconomic conditions but better health) contradicts their theory (Link and Phelan Reference Link, Phelan, Bird, Conrad, Fremont and Timmermans2010: 15; Bakhtiari Reference Bakhtiari2018: 140). What about their children?
To answer this question, the heterogeneity of the under-five mortality must be considered because the main risk factors evolved between birth and the fifth anniversary. During the first 28 days of life, neonatal mortality was mainly due to endogenous causes such as congenital malformation (Mosley and Chen Reference Mosley and Chen1984; Oris et al. Reference Oris, Breschi, Derosas, Bengtsson, Campbell and Lee2004). Those causes were explained by biological factors, which could, however, be associated with poverty and malnutrition, which are keys for maternal depletion syndrome (Manfredini et al. Reference Manfredini, Breschi, Fornasin, Mazzoni, De lasio and Coppa2020; Scalone, Reference Scalone2014).
For babies who survived the first trials of life, breastfeeding offered direct protection through the maternal antibodies present in the mother’s milk and indirect protection as well, since the newborns have low immunity against pathogens that may be present in artificial food. Weaning was consequently a dangerous transition that opened a new period of life that saw young children facing new threats (Preston et al. Reference Preston, Ewbank, Hereward and Watkins1994; Reid Reference Reid2002; Thornton and Olson Reference Thornton and Olson2011). Particularly, in an urban context under strong demographic pressure, water of poor quality and spoilt animal milk could result in deadly digestive diseases (Olson and Thornton Reference Olson and Thornton2011; Preston and Haines, Reference Preston and Haines1991; Vögele and Woelk Reference Vögele and Woelk2002). This was especially the case when hot temperatures increased viral proliferation (Reher and Sanz-Gimeno Reference Reher and Sanz-Gimeno2006; Van Poppel et al. Reference Van Poppel, Ekamper, Mandemakers, Puschmann and Riswick2018). Moreover, weaned children were also susceptible to other infectious illnesses. In large and growing cities such as Madrid, population density, mobility and contacts, and crowding favored the spread of infectious diseases, especially airborne diffused diseases (Dribe et al. Reference Dribe, Hacker and Scalone2020; Preston and Haines, Reference Preston and Haines1991), during the winter season (Breschi and Livi-Bacci Reference Breschi and Livi-Bacci1986). Weaned children were also responsive to fluctuations in food prices, parental poverty and, ultimately, malnutrition (Oris et al. Reference Oris, Breschi, Derosas, Bengtsson, Campbell and Lee2004; Dribe et al. Reference Dribe, Hacker and Scalone2020).
In the following sections of this paper, exploiting a new database, we test origin and sociospatial segregation as competing or complementary explanations of the differentials in infant and child mortality. Origin is a proxy of knowledge about Madrid’s dangers and opportunities, while localization in a segregated urban environment is a proxy of living conditions.
Individual nominal data in Madrid
Data
To test our two hypotheses, we used the Madrid birth and death certificates for the period 1916–1926. Specifically, birth information was acquired from the Civil Register of the city for the period 1916–1925, as well as the death information from 1916 to 1926 for a total amount of 184,739 birth events and 182,133 death events, including 55,745 deaths of children under five years of age. In the hospital “la Inclusa” (foundling hospital), many unmarried mothers went to give birth, abandoning most of their children shortly after birth, resulting in very high levels of infant mortality (Revuelta-Eugercios Reference Revuelta-Eugercios2013). We excluded from our analyses children born in the Inclusa institution to avoid confusion between de facto and de jure populations (Revuelta-Eugercios and Ramiro-Fariñas Reference Revuelta-Eugercios, Ramiro-Fariñas, Ramiro-Fariñas and Oris2016).
Madrid’s birth certificates are very informative. For each individual, the following information is recorded: date of birth, name (or names), two surnames for each parent, sex, place of birth within the city (district, street and number), province of birth of parents and a note that includes information on the nature of birth, such as the case of twins. A major limitation, however, is the absence of an indication of the occupation of the parents. The death certificate, on the one hand, is limited to information about the deceased individual, including date of death, name (or names), names of the parents, age at death (expressed in years, months and days) and the place of death in Madrid, the latter with a structure compatible with that of the birth certificate (district, street and number). On the other hand, a very special feature of death certificates is the systematic mention of the cause of death for each deceased individual in the city.
Several checks were carried out on the raw data, such as the calculation of the sex ratio, which remained consistent across the years of observation, as well as in the different districts of Madrid. Sex ratios were also calculated for the births from native mothers and for the births from mothers of various origins and were similarly consistent.Footnote 1 We also adjusted the Bourgeois-Pichat (Reference Bourgeois-Pichat1951a, Reference Bourgeois-Pichat1951b) model for each group of origin. The linearity hypothesis was verified, and no significant difference was observed between the studied subpopulations. Furthermore, a crosscheck with the official statistics produced by the Madrid City Council (Ayuntamiento de Madrid Estadística Demográfica) confirmed, albeit with some very slight differences, the consistency of the collected data.
Linking birth and death certificates in the context of a large capital city in historical times can be a challenging task. Such a large number of events, combined with the great heterogeneity of the local population, required the use of advanced techniques and a long, meticulous data preparation to match both birth and death information in a single record. This work consisted of the removal of typing errors, upper- and lower-case letters, accents, unnecessary spaces and the standardization of the information.Footnote 2 During data preparation, phonetic algorithms for names and surnames were implemented to code the information and facilitate linkage.Footnote 3
After the data preparation phase, the two sources (births and deaths) were linked through a probabilistic technique based on the well-known Fellegi-Sunter model (Reference Fellegi and Sunter1969). Stata 17 and a Datalink module were used for the actual implementation of the linkage (Kranker Reference Kranker2018). Subsequently, a deduplication process, similarly based on a probabilistic approach, was used to identify the births from the same mother and father. The final product consists of a file containing, for each born in Madrid in the studied period, the date of birth, the date of death and the cause of death – if present – and all the information mentioned above. The final link rate was satisfactory, reaching 94 percent for the first five years of life and rising to 95 percent when considering only the first year of life. This suggests very low levels of family mobility when children were young and is moreover consistent with the results of an analysis of the 1905 population census where duration of residence in Madrid was mentioned. This analysis showed that while single people were highly mobile, married couples durably settled. When they moved, it was mainly inside the capital (Ramiro-Fariñas et al. Reference Ramiro-Fariñas, Oris, Mazzoni, Bavel, Coninck, Puschmann and Putte2021).
As Bailey et al. (Reference Bailey, Cole, Henderson and Massey2020) note, such automated methods can introduce false matches (Type I errors) and missed matches (Type II errors). However, in Spain, each person has two surnames, the first inherited from the father and the second from the mother, and this characteristic, as well as the use of the “middle name,” increases both the efficiency and the reliability of the linkage process (Bailey et al. Reference Bailey, Cole, Henderson and Massey2020). Additionally, we tested the quality of the procedure through direct source control and internal coherence checks, for example, by testing the consistency of birth intervals.
The causes of death were coded using the method proposed by Bernabeu-Mestre et al. (Reference Bernabeu-Mestre, Ramiro-Fariñas, Sanz-Gimeno and Robles-González2003), which aims to classify historical diagnostic expressions. It is an adaptation of the procedure proposed by McKeown (Reference McKeown1976) that is specific to Spanish expressions and medical knowledge in Spain during the studied period. Causes of death are first divided into two large clusters: infectious diseases and noninfectious diseases. Within the first cluster, water- and food-borne infectious diseases were distinguished from airborne infectious diseases for the purposes of this paper.
Methods
Individual life histories from the first day of life until the fifth birthday were analyzed through the event history technique.Footnote 4 Starting from a simple structure, where a person corresponds to one record, we progressively created spells following the subject’s individual history. This is particularly useful for accommodating time-dependent variables such as temperature and current season. Subsequently, individual life histories were analyzed using parametric (piecewise constant hazard) models. We preferred this approach to the Cox model (Cox Reference Cox1972) because in the Piecewise constant hazard model, the baseline hazard function is specified and is exponential. In particular, within each segment, the hazard is constant, but between segments, the hazard may be different with discrete changes between intervals. One of the advantages of using a parametric regression is that the calculation of a shared frailty model is much more convenient than in a semi-parametric model, as in the case of Cox regression, which must simultaneously estimate the baseline and the parameters of the regression (Bouaziz and Nuel Reference Bouaziz and Nuel2017). Therefore, we used piecewise constant hazard models with shared frailty (Gutierrez Reference Gutierrez2002) at the mother level, that is, episodes of individuals born to the same mother are identified by the same ID number. The results were reported in the form of hazard ratios (HR).
For the analysis of causes of death as competing risks, we used a semi-parametric approach based on the Fine-Gray model (Fine and Gray Reference Fine and Gray1999). This model provides a better estimation for the risk of the main outcome of interest when one or more competing risks exist and, unlike Cox regression, does not treat the competing event as a simple right censor. The results of the competing models were reported in the form of subdistribution hazard ratios (SHRs). All the methods of analysis mentioned are based on the proportional hazard assumption.
For the various multivariate models, to test our two hypotheses, we considered several variables that can be summarized in three clusters: environmental (hypothesis 1), mothers’ origin (hypothesis 2) and control variables. The first group includes the variable “District,” which refers to the place of residence in one of the ten districts into which the capital was divided at the time of this study (see Map 1). This variable is indicative of the spatial and social segregation and the diversity of housing and hygienic conditions across the city. In the same cluster, we also included two time-varying covariates: “Current season,” which identifies the season of the year, and another categorical covariate, called “Temperature,” which identifies the particularly warm (>95 percentile) and cold (<5 percentile) months (Institute of Statistics of the Community of Madrid 2022). The environmental group is completed by a dummy variable called “Influenza” that identifies months corresponding to the pandemic waves in Madrid (Cilek et al. Reference Cilek, Chowell and Ramiro-Fariñas2018). The second cluster consists of a single variable divided into four categories (regions) derived directly from the province of birth of the mother. The actual regional breakdown of Spain was used as the subdivision: Native mother (mothers born in the province of Madrid, dominated by the capital city), Castilla-La Mancha, Castilla y León and other regions. Finally, we used a set of fixed control variables, which are presented and discussed below. Appendix 1 provides the table of frequency of the variables.
Regional subdivision of Spain and division into districts of Madrid.

We ran separate models according to the age of the children, first for those aged 1 to 28 days, to isolate neonatal mortality. Starting at day one could seem strange, but under Spanish law, until 1975, those who died at birth or during the first 24 hours of life were considered “abortive creatures” (art. 745). The Spanish Civil Code literally said: “for civil purposes, a fetus shall only be considered as born if it has a human figure and lives for twenty-four hours completely detached from its mother’s womb” (Gómez-Redondo Reference Gómez-Redondo1985: 100). Therefore, stillbirths and babies who died during the first day of life are absent from our sources. The next age groups cover post-neonatal mortality, and to identify as much as possible the weaning timing, we separated the 29–90 days of life, 91–179, and 180–365. Finally, infant mortality (below 1 year) was dissociated from childhood mortality (between the first and the fifth birthdays).
The impact of mothers’ origins: death and survival of children from native and immigrant mothers
In the multivariate models, we controlled for several important determinants of infant and child mortality (Tables 1a–d). The excess mortality of twins, orphans or illegitimates, boys compared to girls, and children of young mothers is consistent with the results of other studies (Oris et al. Reference Oris, Breschi, Derosas, Bengtsson, Campbell and Lee2004; Reid Reference Reid2002) and attests to the quality of the data.
Piecewise constant hazards models with shared frailty (mother level) on time to death. Mothers born in the Madrid province

Note: * p < .1. ** p < .05. *** p < .01.
Piecewise constant hazards models with shared frailty (mother level) on time to death. Mothers born in Castilla-la Mancha

Note: * p < .1. ** p < .05. *** p < .01.
Piecewise constant hazards models with shared frailty (mother level) on time to death. Mothers born in Castilla y Léon)

Note: * p < .1. ** p < .05. *** p < .01.
Piecewise constant hazards models with shared frailty (mother level) on time to death. Mothers born in other regions of Spain

Note: * p < .1. ** p < .05. *** p < .01.
The impact of the mother’s origin (birthplace) is illustrated by Kaplan-Meier survival curves (Figure 2). Children born to Madrid natives, as well as those whose mothers came from the surrounding Castilian Plateau, had similar chances of survival during the first five years of life: between 76.0 and 77.6 percent. However, when the mother was born in another part of Spain, an advantage already appeared during the first year of life, increasing during childhood, resulting in 80.4 percent of the babies still being alive at the age of five. The multivariate model shows no difference in the first days of life. However, this model shows that compared to the children of native mothers, those from Castilla-La Mancha had a limited but significant survival advantage from 29 days until 5 years of life (11–19 percent better chances). From 90 days, those from other regions of Spain were slightly favored (6–14 percent), while those from Castilla y León were slightly more at risk (4–7 percent).
Kaplan–Meier survival estimates according to mother birth place. Madrid, 1916–1926.

This situation in early 20th century Madrid can be compared with what was observed at the same time in the regions of origin (Figure 3). Data on infant mortality indicate that for the period 1916–1926, the levels in the Madrid province and Castilla y León were the same (approximately 170‰). Risks of dying before the first birthday were lower in the rest of Spain, and we found an indication of this advantage among the children of migrants from this origin. The infant mortality rate was, however, somewhat higher in Castilla-La Mancha (181‰), which makes the survival chances of children to mothers from this region even more intriguing.
Infant mortality by region. Spain, 1900–1933.
Source: Adapted from Diego (2008).

After this descriptive analysis, we turn to the piecewise constant hazard models with shared frailty (at the mother level). To approach the impact of urban environmental conditions on the various groups of children, the district of residence of the parents emerged as one of the most discriminating factors of death below age five. It was expected, as Madrid’s expansion was associated with growing social inequalities and segregation. Several districts, especially those covering the city’s expansion to the south, showed worse living conditions than the rich and modern northern part of the capital.
The models stratified by maternal origin confirm that children from all groups saw their risks of death influenced by their place of residence in Madrid (Tables 1a–d). As suggested by the literature, this environmental condition affected post-neonatal mortality more than neonatal mortality and child mortality more than infant mortality. In addition, suggestive differences in the sensitivity to this factor appear. While they faced the lowest risks of dying, children of mothers born in the rest of Spain were the most responsive to the spatial location within the large city. In this group, childhood mortality in the worst districts (Hospital, Inclusa, Latina) was twice as high as in Buenavista. Children of Madrid natives were also affected by place of residence, although to a lesser extent. They were followed by Castilla y León and then by Castilla-La Mancha.
Another important environmental factor of vulnerability in early 20th-century Madrid was seasonality. During the first five years of life, spring and even autumn were protective, while winter was the most dangerous period. Summer was positive for children younger than six months and between ages one and four. However, when they were aged 180–365 days, summer was more dangerous than winter. This was especially the case for the infants of Madrid natives (H.R. 1.38) and Castilian mothers (H.R. 1.20 for Castilla-La Mancha, H.R. 1.25 for Castilla y León). The perils of summer happened earlier in the life course of children of mothers born in the rest of Spain.
Our results suggest that most of the mothers living in Madrid weaned their children for approximately 6 months, while those from the most distant regions had an even shorter duration of breastfeeding. We ran a separate model for each month of life from birth to the first birthday (Tables not shown) with three patterns emerging. For children of mothers coming from the rest of Spain, summer was dangerous only during the fifth month of life, while for those of mothers born in Castilla-La Mancha, summer was dangerous only during month seven. This suggests a clear transition from breastfeeding to artificial food. Additionally, it was also in the seventh month of life that summer became more harmful for children born to Castilla y León and Madrid native mothers. However, in these two subpopulations, the penalty continued to affect the infants until their first birthday, suggesting a more staggered transition and less secure infant feeding practices in the second half of the first year of life.
Causes of death are noted in Madrid civil certificates. Table 2 unsurprisingly shows that noninfectious diseases were dominant in the first days of life. Endogenous causes of death, for example, congenital malformation, were by far the most frequently cited causes of death during the first month of life. The second one is athrepsia, which indicates acute malnutrition, followed by “falta de desarrollo,” which means lack of development. When the surviving children grew, these diseases continued to be major threats to their survival, with stunting, a feature of chronic undernutrition, completing the list of the main killers. This group of noninfectious pathologies, clearly associated with poverty, became decreasingly dominant throughout the transition from infancy to childhood: they accounted for more than two-thirds of the deaths between 1 and 28 days of life but only 10 percent approximately between the first and fifth birthdays. Conversely, the frequency of infectious diseases rose as the children grew older. These diseases caused 90 percent of childhood mortality; the largest contributors were airborne diseases (bronchitis, pneumonia, tuberculosis, etc.). An interesting exception concerned food- and waterborne diseases (mostly gastroenteritis and enteritis), which reached their maximum between 3 months and 1 year of life, around weaning and the following period of adaptation to artificial food.
Mains causes of death by age groups under five in Madrid (in percent), 1916–1925

We estimated a Fine-Gray competing risk model on the risk of dying from three types of causes: food- and waterborne infectious diseases, airborne infectious diseases, and noninfectious diseases. The results are presented in Tables 3a–c and show a striking impact of the summer season on the first group of causes. This association resulted in a multiplication of the risk by 7 when the children were aged 91 to 179 days and by 10 when they were aged between 6 months and 1 year. The hazard ratios were lower but still very high (between 3 and 4) for the younger and older children. This pattern confirms that weaning was especially dangerous in summer and that the impact of hot temperatures on water and food quality was a real threat throughout the first five years of life. Logically, the seasonal pattern was exactly the opposite for airborne diseases, with summer and autumn being the most protective periods while winter was the most aggressive, as well as very low temperatures, especially during the first six months of life. Approximately the same pattern applied to noninfectious pathologies with, however, a more limited impact by seasonality and temperatures.
Fine-Gray model on time to death (fail= death caused by infection from food; compete=death from other causes)

Note: We also controlled for age of the mother, gender, twin births and father presence at the time of birth; * p < .1. ** p < .05. *** p < .01.
Fine-Gray model on time to death (fail = death caused by airborne infectious diseases; compete= death from other causes)

Notes: we also controlled for age of the mother, gender, twin births and father presence at the time of birth; * p < .1. ** p < .05. *** p < .01.
Fine-Gray model on time to death (fail = death caused by noninfectious diseases; compete= death from other causes)

Notes: we also controlled for age of the mother, gender, twin births and father presence at the time of birth; * p < .1. ** p < .05. *** p < .01.
Tables 3a–c also demonstrate that the deprived areas of the districts Hospital, Inclusa, and Latina in the south of Madrid and Universidad in the north accumulated disadvantages. They suffered from penalties that caused higher infant and childhood mortality risks in these areas, with a particularly high tribute to food- and waterborne diseases and to noninfectious diseases.
Instead, after we controlled for environmental factors, as well as for a few other factors that are not central to this paper, the differences according to the birth region of the mother were relatively limited. Compared to the children of Madrid native mothers, children of immigrants from Castilla-La Mancha were less affected by food- and waterborne diseases during their first year of life and by airborne diseases and noninfectious diseases between 3 and 6 months. Children of mothers born in the regions of Spain more distant from Madrid were most favored, not when newborn but after one or three months of life, whatever the cause of death. Conversely, having a mother born in Castilla y León was a risk factor for childhood mortality (deaths due to infected water and food) and during the second half of their first year of life (airborne infectious diseases). Otherwise, they did not differ from the offspring of Madrid natives.
Discussion
In this research, we empirically tested two hypotheses. The results clearly validated the first hypothesis, based on the “fundamental cause” theory, using location in a segregated city as a proxy of inequality in living conditions. In Madrid, although urban development was planned in the 1860s, demographic growth increasingly overwhelmed the infrastructure and real estate market. The shantytowns of the suburbs were located in the “least favored districts (corresponding to the districts of Inclusa, Hospital, Latina and Universidad), characterized by the concentration of most of the unhealthy housing and neighborhoods, with most of their streets lacking sewage systems and water, electricity and clean air in the houses” (Casado-Ruiz and Ramiro-Fariñas Reference Casado-Ruiz, Ramiro-Fariñas, Otero-Carvajal and Miguel-Salanova2018). Lodgings also suffered from poor aeration and darkness. Coherently, our individual-level data identified a strong excess mortality in these districts, which not only experienced an accumulation of penalties but were also stigmatized for their dirtiness and seen by the local elites as a manifestation of urban degeneration (Manzano-Gómez Reference Manzano-Gómez2022). Our results illustrate a pattern according to which “the poor lived in the environmentally more dangerous areas and this ‘boosted’ their observed mortality” (Reid Reference Reid2002: 151), a pattern where the neighborhood is at the right level to reveal poverty (Thornton and Olson Reference Thornton and Olson2011).
From this perspective, it is important to consider how the urban landscape changed. All across Europe, after the cholera pandemics and later the Pasteurian discoveries, massive investments in public hygiene transformed cities and targeted a reduction in infectious diseases (Baldwin Reference Baldwin1999; Harris and Helgertz Reference Harris and Helgertz2019). Madrid was, however, a late-comer. Casado-Ruiz and Ramiro-Fariñas (Reference Casado-Ruiz, Ramiro-Fariñas, Otero-Carvajal and Miguel-Salanova2018) noted that “it was not until after the Spanish flu epidemic [1918] that a real sanitation plan for the city was implemented: septic tanks were banned, cleaning services were reorganized, the municipal laboratory was modernized, bathrooms and public toilets were built, and water distribution was extended, among other measures.” More than 200 km of underground water pipes were constructed in a decade, completing an old network of 176 km that was renewed (Casado-Ruiz and Ramiro-Fariñas Reference Casado-Ruiz, Ramiro-Fariñas, Otero-Carvajal and Miguel-Salanova2018). However, these same authors showed that those improvements were concentrated in the wealthy districts, thus increasing the gap between the favored and disfavored areas. Early twentieth Madrid illustrates a process that has also been observed elsewhere (Harris and Helgertz Reference Harris and Helgertz2019; Jaadla and Puur Reference Jaadla and Puur2016), where progress in public health was associated with growing spatial and social inequalities.
Indeed, what the 1916–1926 Madrid data reveal is the importance of the accumulation of disadvantages among the urban poor and of social inequalities inscribed in the urban space. They appear clearly at the very beginning of life. Among the causes of neonatal death, the most important diseases demonstrated a clear association with poverty. Undernutrition affected poor mothers and drastically increased the mortality risks of their children in their first month of life, as well as later on to a lower extent. This pattern was observed in several historical populations in the eighteenth and nineteenth centuries (Oris et al. Reference Oris, Breschi, Derosas, Bengtsson, Campbell and Lee2004; Alter et al. Reference Alter, Manfredini, Nysted, Bengtsson, Campbell and Lee2004; Van de Walle Reference Van de Walle, Coale and Watkins1986). However, seeing it in the capital of a European country in the early 20th century, and more so with such intensity, is striking. This is support for the “fundamental cause” theory (Link and Phelan Reference Link and Phelan1995, Reference Link, Phelan, Bird, Conrad, Fremont and Timmermans2010).
According to our second hypothesis, we expected Madrid native mothers to be more aware of the city’s resources and consequently more able to protect their children than immigrant mothers.Footnote 5 Our results show that the reality was far from being so simple. Madrid native mothers’ offspring were surprisingly not advantaged when facing death but were also quite responsive to seasonality, as well as to the place of residence across the urban space, an urban space where their mothers spent all their lives. In comparison, children from mothers coming from Castilla-la-Mancha were slightly favored, and those from mothers born in Castilla y León tended to be disfavored. Differences between Castilians and Madrilenians were small, however, only a few percentage points, and for most of them statistically significant mainly because of the large size of the database.
Migrants coming from the rest of Spain were the only real exception. Children of mothers born in regions distant from Madrid had a lower probability of dying as soon as they survived the first three months of life. This result is not a surprise since this nativity group included a medium- to high-bourgeoisie recruited from all across the country to work in the capital ministries, institutions of high education, or the headquarters of major enterprises (de Miguel-Salanova and Diaz-Simon 2015; Pallol-Trigueros Reference Pallol-Trigueros, Dubert and Gourdon2017).
This group of migrants was, however, a minority. For the large majority of the mothers (77 percent), hypothesis 2 is not validated: their origin was not an important risk factor, and children born in Madrid from mothers born in Madrid were not advantaged. To explain this unexpected result, we build on the research of Bakhtiari. This author considers that for the children of immigrants in the United States in 1910, the ultimate cause of the differentials in health and death was the context of reception, instead of wealth. This was this context that defined “assimilation pathways available to immigrants” and access to resources (Bakhtiari Reference Bakhtiari2018: 140). In Madrid, migrants’ insertion also went through the labor and housing markets.
As far as the first one is concerned, we face the most important limitation of our data source, the absence of indication about occupation for both father and mother. For the second one, once again, location in the city provides important information. If mothers born in the distant regions of Spain were 22.9 percent of the mothers between 1916 and 1926, they accounted for 30 percent in Buenavista and 28 percent in Centro, so in the most favored and healthier districts, while they formed the group that showed the greatest sensitivity to the location within a city they discovered. This spatial distribution contributed to the better survival of their children. However, surprisingly, this concentration was exceptional. Madrid native mothers were 42 percent, a proportion varying between 38 percent in Congreso and 46 percent in La Latina, with a fluctuation only from 40 to 44 percent in the eight other districts. Castilians were also equally distributed. Their insertion pathways in Madrid’s urban space – at least at the district level – did not result in spatial discrimination. Contrary to North American towns in the same period (Preston et al. Reference Preston, Ewbank, Hereward and Watkins1994; Olson and Thornton Reference Olson and Thornton2011; Bakhtiari Reference Bakhtiari2018; Dribe et al. Reference Dribe, Hacker and Scalone2020), a spatial concentration of immigrants from the same origin was not observed in early 20th century Madrid.
In fact, the outskirts (called extraradios) were a poor refuge for the poorest and newly arrived immigrants in a habitat of slums and barracks (Vicente-Albarrán Reference Vicente-Albarrán2015; Vorms Reference Vorms, Harris and Vorms2017). However, these suburban neighborhoods acted not only as a barrage for new migrants but also as a refuge for those who had escaped the center and its excessive rent prices (Carballo-Barral et al. Reference Carballo-Barral, Pallol-Trigueros and Vicente-Albarrán2008). This explains why, contrary to our expectations, the process of spatial segregation did not affect the Castilian immigrants more than the natives. This is an explanation for the unexpected small differences in infant and child mortality according to mothers’ place of birth. Much more than origin, location in the city was the dominant factor of death among children under five years of age.
Another explanation of the absence of large differentials between the nativity groups is more speculative. We know that although the turnover of young single adults was impressive, those who married before moving to Madrid or found a spouse in the city matrimonial market tended to settle durably in the Spanish capital (Ramiro-Fariñas et al. Reference Ramiro-Fariñas, Oris, Mazzoni, Bavel, Coninck, Puschmann and Putte2021). The accumulation of newcomers of fertile age sustained the birth rate. In 1905, 65.8 percent of births were from immigrant mothers. This proportion fell to 58.3 percent in the period 1916–1926 studied here. This decrease can be explained because a fair proportion of the 41.7 percent of mothers born in Madrid were daughters of immigrants from the surrounding regions. As we have just seen, approximately 77 percent of the mothers shared the Castilian culture and lived together in the same districts. This facilitated what the Spanish social historians called the “transition to the mass society” (Otero-Carvajal and Pallol-Trigueros Reference Otero-Carvajal and Trigueros2010: 564–566). This mass society was essentially defined by Madrid’s environmental and living conditions. Socialization in the region of origin faded, overwhelmed by the urban living style. Moreover, we have an element that strengthens this interpretation. In Central Spain, 12–18 months was the normal age for weaning (Ramiro-Fariñas and Sanz-Gimeno Reference Ramiro-Fariñas and Sanz-Gimeno2000). However, in the Spanish capital, weaning occurred around months 6–7. Interestingly, this was the case for Madrid native mothers as well as for those born in Castilla y León and Castilla-La Mancha. They all acted the same way, adapting their behaviors to the context of a large city.
Appendix
Table of frequency. Variables at birth


 Open access