


Introduction
Volcanic activity in New Zealand over the late Cenozoic has given rise to a wide variety of minerals, including zeolites, which form primarily through diagenesis or hydrothermal alteration of volcanic rocks such as basalts and tuffs (Passaglia et al., Reference Passaglia, Artioli and Gualtieri1998; Passaglia and Sheppard, Reference Passaglia and Sheppard2001). While there are over 40 naturally occurring zeolites worldwide, erionite is of particular interest due to its association with malignant mesothelioma (‘MM’), a disease generally linked with exposure to asbestos (Attanoos et al., Reference Attanoos, Churg, Galateau-Salle, Gibbs and Roggli2018). During the 1970s, an MM epidemic emerged in the Cappadocia region of Turkey, linked to the inhalation and respiration of erionite fibres (Bariş et al., Reference Bariş, Artvinli and Sahin1979; Carbone et al., Reference Carbone, Baris, Bertino, Brass, Comertpay, Dogan, Gaudino, Jube, Kanodia, Partridge, Pass, Rivera, Steele, Tuncer, Way, Yang and Miller2011). Currently, cases of MM related to erionite fibre exposure are restricted to Turkey (Bariş et al., Reference Bariş, Artvinli and Sahin1979) and Mexico (Ortega-Guerrero et al., Reference Ortega-Guerrero, Carrasco-Núñez, Barragán-Campos and Ortega2015). However, there are concerns regarding occupational and environmental exposure to erionite fibres in other countries, such as New Zealand (Patel and Brook, Reference Patel and Brook2021). A key factor controlling mineral fibre toxicity is the size of fibres (and fibrils) that originate from source crystals (Gualtieri, Reference Gualtieri2021). Regulatory definitions of ‘fibres’ include particles with a minimum length of 5 μm, a diameter <3 μm, and an aspect ratio (i.e., ratio of length to diameter) of >3:1 (WHO, 1986; NIOSH, 1994).
New Zealand has one of the highest incidences of MM among high-income countries (2.6 per 100,000), described by physicians as an ‘epidemic’ (Kjellstrom, Reference Kjellstrom2004; Glass and Clayson, Reference Glass and Clayson2017). The general assumption is that New Zealand’s MM incidence is asbestos-related, but given the geology, there remains the possibility that MM in New Zealand may be in part-influenced by erionite exposure (Patel and Brook, Reference Patel and Brook2021). Indeed, erionite occurs in various areas, including Kaipara (Sameshima, Reference Sameshima, Sand and Mumpton1978), Auckland (Tschernich, Reference Tschernich1992, p. 163; Davidson and Black, Reference Davidson and Black1994), Taupo Volcanic Zone (Rodgers et al., Reference Rodgers, Browne, Buddle, Cook, Greatrex, Hampton, Herdianita, Holland, Lynne, Martin, Newton, Pastars, Sannazarro and Teece2004) and Otago (Tschernich, Reference Tschernich1992, p. 163). Nevertheless, erionite is difficult to identify, and globally, mis-identification of erionite has posed problems in linking erionite exposure to epidemiology and health (Dogan and Dogan, Reference Dogan and Dogan2008). Thus, understanding the distribution, morphology and chemistry of erionite in New Zealand is essential in assessing any hazard posed by the mineral. This study aims to systematically classify erionite occurrence in New Zealand by focusing on the palaeoenvironmental setting, crystal chemistry and the morphological variability. A suite of analytical approaches was combined, including Powder X-ray Diffraction (PXRD), Scanning Electron Microscopy–Energy Dispersive Spectroscopy (SEM-EDS), Transmission Electron Microscopy (TEM) with 3D Electron Diffraction (3DED), micro-Raman, and Electron Microprobe Analysis (EMPA), with the aim of improving knowledge of this toxic zeolite within a New Zealand context.
The ideal chemical formula of erionite is K2(Na,Ca0.5)7[Al9Si27O72]·30H2O (Passaglia and Sheppard, Reference Passaglia and Sheppard2001). Erionite belongs to the ABC-6 family of zeolites where the periodic building unit (PerBU) is a hexagonal array of non-connected planar T6-rings (6–6-membered rings of (Si,Al)O4 tetrahedra), related by pure translations along the a and b axes (Gottardi and Galli, Reference Gottardi, Galli, Gottardi and Galli1985; Gualtieri et al., Reference Gualtieri, Artioli, Passaglia, Bigi, Viani and Hanson1998). The symmetry is hexagonal with the space group P63/mmc, and the unit-cell parameters are a ≈ 13.3 Å, b ≈ 13.3 Å and c ≈ 15.1 Å (Gualtieri et al., Reference Gualtieri, Artioli, Passaglia, Bigi, Viani and Hanson1998; Armbruster and Gunter, Reference Armbruster and Gunter2001). The erionite framework is further distinguished by its stacking sequence, where neighbouring T6-rings are interconnected via tilted 4-rings along the [001] axis in an AABAAC… pattern (Staples and Gard, Reference Staples and Gard1959; McCusker et al., Reference McCusker, Liebau and Engelhardt2001). Three types of cavities characterise the framework of erionite: the cancrinite (ε) cage ([4665] polyhedra) connected with double 6-ring (D6R) cages (hexagonal prism, [4662] polyhedron, formed by two ‘A’ 6-rings), and columns of erionite cavities ([4126586] polyhedral) between the ‘B’ or ‘C’ 6-rings (Gottardi and Galli, Reference Gottardi, Galli, Gottardi and Galli1985; Armbruster and Gunter, Reference Armbruster and Gunter2001). Erionite chemistry also varies significantly, with three members within the erionite series based on the most abundant extra-framework cation: erionite-Na, erionite-Ca, and erionite-K (Gualtieri et al., Reference Gualtieri, Artioli, Passaglia, Bigi, Viani and Hanson1998; Dogan and Dogan, Reference Dogan and Dogan2008). Regarding crystal structure, K+ cations are located at the centre of cancrinite cages, while Na+, Ca2+, Mg2+ and H2O occupy the erionite cages and are distributed on sites located on the symmetry axis (see Fig. 1; Gualtieri et al., Reference Gualtieri, Artioli, Passaglia, Bigi, Viani and Hanson1998). Alberti et al. (Reference Alberti, Martucci, Galli and Vezzalini1997) reported that in the erionite cages, there are three partially-occupied positions, Ca1, Ca2, Ca3, each coordinated with H2O molecules. Ballirano et al. (Reference Ballirano, Andreozzi, Dogan and Dogan2009) observed an additional cationic site at a special position (½, 0, 0) in erionite-K, labelled as K2, corresponding to the Ca4 site reported by Gualtieri et al. (Reference Gualtieri, Artioli, Passaglia, Bigi, Viani and Hanson1998) in certain natural erionite-Ca samples (Ballirano et al., Reference Ballirano, Bloise, Gualtieri, Lezzerini, Pacella, Perchiazzi, Dogan, Dogan and Gualtieri2017).
Crystal structure of erionite viewed along the c-axis, showing the arrangement of cancrinite and erionite cages interconnected by double six-membered rings. Extra-framework cations (Ca, K, Mg) occupy distinct sites within the cages: K1 and K2 positions (white circles), and Ca and Mg positions (grey circles).

Closely related to erionite is offretite, a zeolite with a similar framework structure and chemical composition, with an ideal chemical formula of K2(Ca0.5,Na)4Mg2[Al10Si26O72]·32H2O (Passaglia and Sheppard, Reference Passaglia and Sheppard2001). Offretite also has a hexagonal symmetry similar to erionite. However, the space group symmetry is P6m2 and the unit cell parameters are a ≈ 13.3 Å, b ≈ 13.3 Å and c ≈ 7.6 Å (Gualtieri et al., Reference Gualtieri, Artioli, Passaglia, Bigi, Viani and Hanson1998). While erionite and offretite are similar, the Mg content is a significant factor that can differentiate the two zeolites using the Mg/(Ca+Na) cation ratio. Indeed, offretite will show values close to 1.0, while erionite will generally show values <0.3 (Passaglia et al., Reference Passaglia, Artioli and Gualtieri1998). In rare instances where erionite may contain elevated Mg, erionite and offretite can be found intergrowing (Gualtieri et al., Reference Gualtieri, Artioli, Passaglia, Bigi, Viani and Hanson1998; Passaglia et al., Reference Passaglia, Artioli and Gualtieri1998).
Erionite forms within six distinct palaeoenvironments, influenced by geological and geochemical conditions (Van Gosen et al., Reference Van Gosen, Blitz, Plumlee, Meeker and Pierson2013; Patel et al., Reference Patel, Brook, Kah and Hamilton2022): (1) hydrothermal alteration of silica-rich volcanic deposits; (2) diagenesis within lacustrine sediments; (3) diagenesis within mafic rocks; (4) hydrothermal alteration of intermediate to mafic rocks; (5) diagenesis in a marine environment; and (6) hydrothermal alteration via meteorite impact metamorphism. Erionite formation can be simplified further, forming via either diagenesis or hydrothermal alteration within (a) vitroclastic rocks (e.g. rhyolites and altered tuffs or volcanic conglomerates) or (b) within vesicles and vugs of altered volcanic rocks, e.g. basalts and andesites (Passaglia and Sheppard, Reference Passaglia and Sheppard2001; Patel et al., Reference Patel, Brook, Kah, Hamilton, Gamberini, Zoboli, Mugnaioli, Malferrari, Fantini, Arletti and Gualtieri2024). The formational environment may be open or closed hydrologically, and the host-rock and fluid chemistry may impact the type of erionite formed (Davidson and Black, Reference Davidson and Black1994). Erionite crystal habit can vary significantly, ranging from prismatic and acicular forms to fibrous and woolly asbestiform fibres (Dogan et al., Reference Dogan, Dogan and Hoskins2008; Giordani et al., Reference Giordani, Mattioli, Ballirano, Pacella, Cenni, Boscardin and Valentini2017). A simplified classification scheme of different erionite crystal habits is displayed in Fig. 2. These are: stocky hexagonal prisms (Fig. 2a), usually terminated with basal pinacoids; acicular hexagonal prisms (Fig. 2b); fibrous hexagonal prisms or fibre bundles (Fig. 2c); aggregates (Fig. 2d) of stocky/fibrous hexagonal prisms (amygdaloid); and woolly asbestiform fibre bundles (Fig. 2e) with extremely variable lengths and ‘brush-like’ terminations.
Crystal habits of erionite fibres: (a) Stocky hexagonal prisms (e.g. Gottardi and Galli, Reference Gottardi, Galli, Gottardi and Galli1985); (b) acicular hexagonal prisms (e.g. Harada et al., Reference Harada, Iwamoto and Kihara1967); (c) fibrous hexagonal prisms or fibre bundles (e.g. Van Gosen et al., Reference Van Gosen, Blitz, Plumlee, Meeker and Pierson2013); (d) stocky fibrous hexagonal prisms (e.g. Gottardi and Galli, Reference Gottardi, Galli, Gottardi and Galli1985); (e) woolly asbestiform fibre bundles/mass (e.g. Giordani et al., Reference Giordani, Mattioli, Ballirano, Pacella, Cenni, Boscardin and Valentini2017).

Geology and sampling criteria
New Zealand’s tectonic setting, characterised by intraplate volcanic activity and subduction-derived volcanism, is favourable for zeolite formation, including erionite (Brathwaite, Reference Brathwaite2017). In the North Island, the Pacific Plate subducts beneath the Australian Plate, triggering volcanism and geothermal activity, particularly in the Taupo Volcanic Zone (TVZ; Johnson et al., Reference Johnson, Wallace, Maurer, Hamling, Williams, Rollins, Gerstenberger and Van Dissen2024). The subduction-driven volcanism is a major contributor to the rock types found across the North Island, and intraplate volcanism has also led to igneous rocks distributed in regions including Auckland, Northland and Christchurch (Hoernle et al., Reference Hoernle, White, van den Bogaard, Hauff, Coombs, Werner, Timm, Garbe-Schönberg, Reay and Cooper2006). In New Zealand, erionite is typically formed via hydrothermal alteration or diagenesis in rocks such as basalts and tuffs, crystallising within vesicles and vugs (Sameshima, Reference Sameshima, Sand and Mumpton1978; Davidson and Black, Reference Davidson and Black1994; Patel et al., Reference Patel, Brook, Kah, Hamilton, Gamberini, Zoboli, Mugnaioli, Malferrari, Fantini, Arletti and Gualtieri2024).
A staged approach was taken to the sampling and analysis. Initially, 138 samples from various locations across the North and South Islands were chosen, based on (1) previous studies where putative erionite has been identified (e.g. Sameshima, Reference Sameshima, Sand and Mumpton1978); (2) zeolite layers identified within drill cores during ground investigations for infrastructure projects (e.g. Roberts et al., Reference Roberts, McEwan, Kayser, Taulis and Walker2017); and (3) the mindat.org portal (Ralph et al., Reference Ralph, Von Bargen, Martynov, Zhang, Que, Prabhu, Morrison, Li, Chen and Ma2025), where mineral collectors have reported putative erionite at specific localities. At this stage, ‘suspected erionite’ referred to zeolitic rocks collected from locations which are consistent with the geological settings for erionite formation. In some cases, erionite was too small to be confirmed without a microscope, whereas in some samples it occurred in larger vesicles containing fibrous or woolly crystals. Samples from the University of Auckland rock collection were analysed, alongside samples collected from the field. The details of all 138 samples are provided in Supplementary Table S1.
All 138 samples were first screened using SEM-EDS and PXRD. Twenty seven samples exhibited characteristics resembling erionite – including fibrous morphologies, diagnostic PXRD phase reflections, and semi-quantitative chemical compositions within the expected range. These samples were selected for further analysis using TEM, Micro-Raman spectroscopy and EMPA, with each technique used in succession to eliminate non-erionite samples. This multi-method approach allowed for a comprehensive examination of the samples’ morphology, chemical composition and crystalline structure. Nine of the 27 samples met or partially met the accepted criteria for erionite e.g. Dogan and Dogan (Reference Dogan and Dogan2008). The criteria included: (1) morphology, erionite generally exhibits fibrous forms; (2) chemistry, including Si/Al ratio, K and Mg content, and the charge balance error; and (3) crystalline structure, determined from PXRD patterns, micro-Raman spectra and the unit cell structure derived from TEM. The nine samples originate from three distinct regions (Fig. 3) and were analysed in detail, representing diverse geological contexts. Two samples, AUM2504 and AUM2802, were sourced from the Puketotara Peninsula of Kaipara (∼120 km north of Auckland; Fig. 3c). Three samples ARL1, BH254a, and WS01, were collected from Auckland. Finally, four samples (GD4a, GD1a, RGD1, and AUM3143) were collected from the Mount Somers area (∼120 km southwest of Christchurch; Fig. 3c) in the South Island.
Simplified geological map highlighting the regions where erionite was identified in this study. (a) Geological map of Auckland and Kaipara, showing the locations of samples AUM2802, AUM2504, WS01, BH254a and ARL1. (b) Geological map of the Mount Somers area, indicating the locations of samples AUM3143, RGD1, GD4a, and GD1a identified at Gawler Downs. (c) Contextual map of New Zealand, providing an overview of the regions studied.

North Island sample sites
Auckland lies on the Australian tectonic plate, ∼400 km northwest of the Australian and Pacific plate boundary (Edbrooke et al., Reference Edbrooke, Mazengarb and Stephenson2003). The major erionite-bearing formations are all from the Maui Supergroup, which includes the Waitemata and Waitakere Groups (Fig. 3a; Fig. 4a,b). The Waitemata Group contains marine sediments accumulated within the lower Miocene Waitemata basin (∼23 Ma), formed by the propagation of the convergent plate margin through New Zealand (Strachan, Reference Strachan2008). The sediments within the Waitemata basin mainly originate from pelagic fallout, volcaniclastic and siliciclastic slumping, turbidity currents and submarine debris flows (Strachan, Reference Strachan2008; Shane et al., Reference Shane, Strachan and Smith2010). The Waitemata Group consists of multiple subgroups and formations, including the Timber Bay Formation, the East Coast Bays Formation (ECBF) and the Parnell Volcaniclastic Conglomerate (PVC; Ballance, Reference Ballance1976; Strachan, Reference Strachan2008; Shane et al., Reference Shane, Strachan and Smith2010). Throughout the Auckland region, Waitemata Group sediments are commonly exposed along cliffs and roadcuts.
Example exposures of sampled rock units. (a) Basaltic pillow lava from the Waiatarua Formation of the Miocene Waitakere Group (e.g. WS01); (b) tuff from the Miocene Timber Bay Formation of the Waitemata Group (e.g. AUM2802, AUM2504); (c) Parnell Volcaniclastic Conglomerate within the East Coast Bays Formation of the Waitemata Group (e.g. ARL1, Bh254a); (d) Hinds River Dacite of the Late Cretaceous Mount Somers Volcanics Group (e.g. AUM3143, RGD1, GD1a, GD4a).

To the west of Auckland, the Waitemata Group is overlain by the Manukau Subgroup, a member of the Waitakere Group, indicating a shift from primarily turbidite sedimentary deposits to formations more influenced by volcanic activity (Bear and Cas, Reference Bear and Cas2007). The volcanic activity originates from the Northland Volcanic Arc (∼25 Ma–15 Ma), which formed volcanic belts on either side of the Waitemata basin (Hayward, Reference Hayward1979). The western belt of the arc comprises multiple volcanic complexes, including the Manukau stratovolcano (Hayward et al., Reference Hayward, Black, Smith, Ballance, Itaya, Doi, Takagi, Bergman, Adams, Herzer and Robertson2001; Bear and Cas, Reference Bear and Cas2007). Within the Manukau subgroup, several units overlie the Waitemata Group, including the Piha Formation, Nihotupu Formation and Waiatarua Formation (Hayward, Reference Hayward1976; Bear and Cas, Reference Bear and Cas2007). These units are composed of basaltic and pillow lavas, volcanic conglomerate and volcaniclastic sandstone and mudstones (Hayward, Reference Hayward1976; Bear and Cas, Reference Bear and Cas2007).
AUM2504 and AUM2802 are tuff samples from the Miocene Timber Bay Formation in the rural Puketotara Peninsula of Kaipara (Fig. 3a). The Timber Bay Formation is part of the Waitemata Group (Carter, Reference Carter1971; Sameshima, Reference Sameshima, Sand and Mumpton1978), and comprises interbedded sandy mudstone and silty sandstone layers, with rare tuff beds, inferred to be from Waitakere Group volcanics (Ballance, Reference Ballance1976; Hayward et al., Reference Hayward, Black, Smith, Ballance, Itaya, Doi, Takagi, Bergman, Adams, Herzer and Robertson2001). Samples AUM2504 and AUM2802 were collected from a surface exposure of a 90 cm thick, massive tuff bed within a sandstone–mudstone turbidite sequence, consisting of multiple 3–5 cm thick zeolitised layers (Carter, Reference Carter1971; Sameshima, Reference Sameshima, Sand and Mumpton1978). Samples ARL1 and BH254a (Fig. 3a) were collected from Miocene Parnell Volcaniclastic Conglomerate beds in drill cores at depths of 45 m and 55 m, respectively, in Auckland. The Parnell Volcaniclastic Conglomerate (Fig. 4c) comprises volcaniclastic gravity flow deposits (1–20 m thick), within the Waitemata Group (Hayward, Reference Hayward1979). For both samples ARL1 and BH254a, the conglomerate was matrix-supported with clasts ranging from fine to coarse (i.e. 2–63 mm). WS01 is from basaltic pillow lavas of the Miocene Waiatarua Formation, of the Waitakere Group (Bear and Cas, Reference Bear and Cas2007). This unit is prevalent across west Auckland (Figs 3a, 4a) and consists of submarine basaltic andesite lava flows and pillow lavas. The sample consisted of porphyritic basalt with 2–10 mm wide vugs, infilled with erionite crystals and was collected from a surface exposure.
South Island sample sites
Samples GD4a, GD1a, RGD1, AUM3143 are all surface level samples collected from Gawler Downs and Inverary station within the Mount Somers area, on the edge of the Canterbury Plains (Figs 3b; 4d). The sampling sites are made up of the Hinds River Dacite, from within the Upper Cretaceous Mt. Somers Volcanics Group (MSVG; Oliver and Keene, Reference Oliver and Keene1989). The rock has undergone hydrothermal alteration, and been infilled with silica (agate, chalcedony, opal and quartz), clays and zeolites. The outcrop where GD4a, RGD1 and AUM3143 (Fig. 3b) were found had a phaneritic texture, and is a moderately-weathered ash deposit, with 30–50 mm vesicles infilled with green, fibrous erionite. In contrast, GD1a was extracted and collected from a 10 mm vug, infilled with white fibres (Fig. 3b). Further detailed geological information on these locations can be found in Patel et al. (Reference Patel, Brook, Kah, Hamilton, Gamberini, Zoboli, Mugnaioli, Malferrari, Fantini, Arletti and Gualtieri2024).
Methods
Of the 27 samples selected from PXRD and SEM-EDS screening, sequential analyses using TEM, Micro-Raman spectroscopy, and EMPA were carried out to select the final nine samples for detailed characterisation.
Powder X-ray diffraction
The PANalytical Empyrean powder X-ray diffractometer, using copper X-rays with a wavelength of 1.5418 Å was utilised for Powder X-Ray Diffraction (PXRD). Sample preparation involved grinding dried samples to a very fine powder within an agate mortar and pestle and using the side loading technique to prevent a preferred orientation occurring in the crystals (Kleeberg et al., Reference Kleeberg, Monecke and Hillier2008). The specifications used for the experiment were 1/2° fixed divergence and anti-scatter slits, and 0.04 rad soller slit. The continuous step scan was programmed on the detector using a step size of 0.017°2θ and counting statistics of 350 s/step from 3 to 65°2θ. The initial analysis was performed using the X’Pert Highscore Version 2 software coupled to the International Centre for Diffraction Data (ICDD) PDF2+ database (https://www.icdd.com/). Unfortunately, erionite was not detected in the majority of the samples because of the low sensitivity of PXRD (Gualtieri, Reference Gualtieri2000; Gualtieri et al., Reference Gualtieri, Gatta, Arletti, Artioli, Ballirano, Cruciani, Guagliardi, Malferrari, Masciocchi and Scardi2019). As such, bulk rock PXRD was not useful on samples with a very low concentration of erionite. After the initial analysis, quantitative phase analysis (QPA) was conducted on samples where erionite could be detected. This was achieved by mixing the crushed bulk rock with 10 wt.% alumina (internal standard) and collecting the PXRD patterns again under the same specifications outlined above. Rietveld refinement was carried out with the GSAS package and its graphical interface EXPGUI, to determine the concentrations of each phase within the various samples (Toby, Reference Toby2001; Larson and Von Dreele, Reference Larson and Von Dreele2004).
Scanning electron microscopy–energy dispersive spectroscopy
The morphological investigation of the samples was conducted using three SEM instruments: (1) the JEOL JSM-6020PLUS/LA, equipped with an EDS (Oxford INCA-350) and Field Emission Gun (FEG) FEI Nova NanoSEM 450. (2) The Hitachi SU-70 Schottky field emission FE-SEM with an integrated EDS. (3) The TESCAN CLARA Ultra-High-Resolution (UHR) FEG-SEM equipped with an Oxford Instruments 65 mm2 active-area EDS and a high-speed Electron Backscatter Diffraction Detector. Sample preparation involved two processes, for the JEOL FEG-SEM, an aliquot of raw sample was fixed on an aluminium stub with double-stick carbon tape and coated with a thin film of carbon (10 nm of thickness) using a Carbon Coater-Balzers CED-010. For the Hitachi SU-70 FE-SEM and TESCAN CLARA UHR-FEG-SEM, an aliquot of the sample was glued onto SEM pin mounts using epoxy resin. The resin was cured overnight, and then the top of the sample was broken off to create a fresh fracture surface for analysis. The samples were coated with Platinum (Pt) for 100 s sputter time with the Hitachi E-1045 before imaging occurred. The EDS detectors on the SEMs were utilised to determine semi-quantitative chemistry of the fibres and imaging took place to determine morphology. The images acquired from the JEOL and Hitachi SEM instruments were processed using ImageJ software to measure fibre length and width (Schneider et al., Reference Schneider, Rasband and Eliceiri2012). Fibre dimensions imaged with the TESCAN CLARA UHR-FEG-SEM were measured in real time using the built-in measurement tool during imaging.
Transmission electron microscopy
A JEOL JEM-F200 multipurpose high-resolution transmission electron microscope (HRTEM), equipped with a Schottky FEG and a silicon drift detector (SDD), was utilised for imaging, acquiring EDS spectra, and three-dimensional electron diffraction signals (3DED). The TEM data was acquired using a Gatan RIO 16 CMOS camera (4k × 4k pixels) and analysed with Gatan Digital Micrograph software. Diffraction data was recorded using an ASI Cheetah hybrid-pixel detector in sequential mode at 24-bit resolution. For sample preparation a few grams of powdered bulk rock were placed into a microcentrifuge tube and mixed with 100% ethanol. Then, 1 μl of the suspension was pipetted onto a carbon grid and placed in the sample holder. The 3DED data was collected in 1° steps over a range of approximately –30° to 30° with a nanobeam size of ∼30 nm, obtained by inserting a 10 μm condenser aperture (Mugnaioli and Gemmi, Reference Mugnaioli and Gemmi2018; Gemmi et al., Reference Gemmi, Mugnaioli, Gorelik, Kolb, Palatinus, Boullay, Hovmöller and Abrahams2019). A short tilt range of 60° was utilised to speed the acquisition, and sample a statistically significant number of fibrous crystals, with the only aim to get cell parameters and extinction symbol. The exposure time for each diffraction pattern was 0.2 seconds. A camera length of 250 mm was used, corresponding to a maximum resolution of ∼0.7 Å in real space. The 3DED data was analysed using PETS2 software to determine unit cell parameters for selected fibres (Palatinus et al., Reference Palatinus, Brázda, Jelínek, Hrdá, Steciuk and Klementová2019).
Micro-Raman spectroscopy
The micro-Raman analyses were conducted with a Horiba confocal micro-Raman LabRAM HR evolution. It was equipped with a red He-Ne laser at 532 nm (1 μm-size spot), notch filters to eliminate the exciter, detector CCD front illuminated open electrode multi-pin phased, with 1024×256×16 pixels, cooled by a Peltier system. Spectra were recorded in back-scattering after focalisation in several positions within a small area of the sample (ca. 100×100 μm). The maximum laser power employed was 20 mW, and the recording time for a good signal-to-noise ratio was 10 s for 50 accumulations. The Raman spectra were compared with erionite (R061126, R061110 and R061104) and offretite (R060767) data obtained from the online RRUFF database (Lafuente et al., Reference Lafuente, Downs, Yang, Stone, Armbruster and Danisi2015). Unfortunately, due to the low concentration of erionite within BH254a and WS01, the fibres could not be separated from the matrix and analysed. Moreover, micro-Raman analysis was deemed unnecessary, as the comprehensive and accurate data obtained through SEM-EDS, EMPA and TEM provided reliable confirmation of erionite identification.
Electron microprobe analysis
The quantitative chemical composition was determined using two EMPA instruments: (1) a JEOL 8200 SuperProbe EMPA equipped with a Wavelength-Dispersive X-Ray (WDS) spectrometer system and W hairpin type filament. Several spot analyses were conducted along the elongated fibres to verify chemical homogeneity and ensure accuracy, as erionite fibres could be contaminated by other mineral phases. Analyses were performed with atomic number resolution on BSE (Z): less/equal than 0.1 (CuZ), accelerating voltage of 15 kV, detectable wavelength of 0.087 to 9.3 nm, specimen current of 5 nA, peak-count time of 30 s and background-count time of 10 s. For each spot analysis, the following elements were determined: Si, Al, Mg, Na, Sr, Ba, and Ca. (2) a JEOL JXA-8500F Hyperprobe EMPA. Due to the beam sensitivity of the minerals analysed, a defocused beam (1µm) and relatively low beam current (5 nA) were used, and accelerating voltage was set to 15 kV. The system was calibrated using a range of natural and synthetic mineral standards; quality of the calibration was assessed using secondary standards of known composition. Kα X-ray lines were analysed for Na, Mg, Al, Si, K, Ca and Fe; Lα X-ray lines were analysed for Sr and Ba. Alkali elements were analysed first to mitigate beam migration issues.
The samples for both instruments were prepared by embedding rock fragments in epoxy resin to form 25 mm diameter disks, then polished to 1 μm grit size using alumina slurry for samples GD4a, GD1a, AUM2504, BH254a and WS01. The disks were polished to 0.25 μm grit size using diamond paste for samples AUM3143, ARL1 and AUM2802 to obtain a mirror polished flat surface. The samples were coated in 25 nm carbon coating. Quantification to determine the chemical formula of erionite was achieved by using the ZAF matrix correction, with cations normalised to 72 oxygen atoms per formula unit (apfu) by stoichiometry. An assumed water content of 19.47 wt.% was used based on literature values for erionite in previous studies (e.g. Passaglia et al., Reference Passaglia, Artioli and Gualtieri1998). The reliability of the chemical analysis for determining if the samples are erionite was evaluated using several criteria, including (1) the charge balance error value (E%); (2) the Mg content test; (3) the Tsi ratio; and (4) the K content test, as outlined below (Coombs et al., Reference Coombs, Alberti, Armbruster, Artioli, Colella, Galli, Grice, Liebau, Mandarino, Minato, Nickel, Passaglia, Peacor, Quartieri, Rinaldi, Ross, Sheppard, Tillmanns and Vezzalini1997; Passaglia et al., Reference Passaglia, Artioli and Gualtieri1998; Dogan and Dogan, Reference Dogan and Dogan2008; Ballirano and Cametti, Reference Ballirano and Cametti2015).
 \begin{align*}
& \text{Charge balance error value:}\qquad \nonumber \\
&{\text{E\% }} = \frac{{\left[ {\left( {{\text{Al}} + {\text{F}}{{\text{e}}^{3 + }}} \right) - \left( {{\text{Na}} + {\text{K}}} \right) - 2\left( {{\text{Ca}} + {\text{Mg}}} \right)} \right]}}{{\left[ {\left( {{\text{Na}} + {\text{K}}} \right) + 2\left( {{\text{Ca}} + {\text{Mg}}} \right)} \right]}} \times 100
\end{align*}
\begin{align*}
& \text{Charge balance error value:}\qquad \nonumber \\
&{\text{E\% }} = \frac{{\left[ {\left( {{\text{Al}} + {\text{F}}{{\text{e}}^{3 + }}} \right) - \left( {{\text{Na}} + {\text{K}}} \right) - 2\left( {{\text{Ca}} + {\text{Mg}}} \right)} \right]}}{{\left[ {\left( {{\text{Na}} + {\text{K}}} \right) + 2\left( {{\text{Ca}} + {\text{Mg}}} \right)} \right]}} \times 100
\end{align*} \begin{equation*}
\text{Mg content ratio:}\,\,\frac{{{\text{Mg}}}}{{{\text{Ca}} + {\text{Na}}}}
\end{equation*}
\begin{equation*}
\text{Mg content ratio:}\,\,\frac{{{\text{Mg}}}}{{{\text{Ca}} + {\text{Na}}}}
\end{equation*} \begin{equation*}
\text{Si ratio:}\,\,{{\text{T}}_{{\text{Si}}}} = \frac{{{\text{Si}}}}{{{\text{Si}} + {\text{A1}}}}
\end{equation*}
\begin{equation*}
\text{Si ratio:}\,\,{{\text{T}}_{{\text{Si}}}} = \frac{{{\text{Si}}}}{{{\text{Si}} + {\text{A1}}}}
\end{equation*} \begin{equation*}\text{K content test:}\,\,\text{K}\geq1.9\text{ apfu}\end{equation*}
Results
Powder X-ray diffraction
Diffraction patterns for three representative samples (BH254a, AUM2802 and GD4a) are displayed in Fig. 5, and indicate varying concentrations of erionite (PXRD patterns for the remaining samples analysed are provided in the Supplementary material). For example, BH254a (conglomerate) did not contain any erionite peaks, particularly at the 7.7°2θ position, indicating a low concentration of erionite within the bulk sample. Additionally, the PXRD pattern can also be used as an indicator of sample morphology, because GD4a (andesite/dacite ash) exhibits broader peaks than AUM2802 (tuff), consistent with GD4a’s woolly morphology. Indeed, the broadening of the peak aligns with the PXRD patterns observed for similar woolly erionite species (erionite-K) from Latium, Italy (Mattioli et al., Reference Mattioli, Giordani, Ballirano, Salvioli-Mariani, Bernardini and Ventura2023), and woolly erionite-Na from Oregon, United States (Cametti et al., Reference Cametti, Pacella, Mura, Rossi and Ballirano2013).
Example diffraction patterns of three samples investigated (GD4a, BH254a and AUM2802). The characteristic erionite peak at 7.7°2θ is visible in AUM2802 and GD4a, however the concentration was too low in BH254a. The vertical bars refer to the Bragg reflections of erionite (01-088-1223) and alumina (00-043-1484) from the ICDD database (https://www.icdd.com/).

Sample AUM2802 contains 46.4 ± 1.6 wt.% erionite, in addition to other zeolites, and an amorphous phase (Table 1). In contrast, GD4a is almost pure erionite, containing minor impurities associated with a smectite phase (Table 1). Concentrations of erionite in the other samples vary (Table 1), with RDG1 (andesite/dacite ash) containing 14.5 ± 0.4 wt.% erionite and AUM2504 (tuff) containing 19.1 ± 0.5 wt.%. Detailed quantification of the different mineral phases for samples where composition could be determined is in Table 1. Though BH254a did not show an erionite phase, it is included for comparative purposes, as it displays the other mineral phases present within the rock. Additionally the table does not display results from ARL1 and WS01, as they contained erionite below the detection limit (Gualtieri et al., Reference Gualtieri, Gatta, Arletti, Artioli, Ballirano, Cruciani, Guagliardi, Malferrari, Masciocchi and Scardi2019). PXRD analysis was not conducted on GD1a and AUM3143, because these samples were already identified as putative erionite based on their morphology and SEM-EDS data. Additionally, their fibrous nature made crushing difficult due to their ‘wool-like’ texture and flexibility, unlike more rigid samples. Consequently, a cryo-miller was used for sample GD4a to facilitate crushing and ensure proper sample preparation as described in Patel et al. (Reference Patel, Brook, Kah, Hamilton, Gamberini, Zoboli, Mugnaioli, Malferrari, Fantini, Arletti and Gualtieri2024).
Bulk PXRD rock composition of samples AUM2802, RGD1, AUM2504, BH254a and GD4a, indicating wt.% of different mineral phases and standard deviation, calculated using the Rietveld refinement. Amorphous phases present within each sample are also included

Scanning electron microscopy – energy dispersive spectroscopy
Representative SEM images of selected samples are displayed in Fig. 6, and corresponding fibre dimension data measured from the images is presented in Table 2. Alongside images, EDS spectra were also acquired to provide semi-quantitative elementary composition (Supplementary Material). A variety of crystal habits and sizes were identified. AUM2802 and AUM2504 (both tuff) display aggregates of fibres disseminated throughout the rock mass. Length ranges from 2 to 30 μm, and fibre widths range from 0.02 to 1 μm (Fig. 6a,c). Some shorter fibres may be due to fracturing during analysis. Bundles are irregular in shape and randomly orientated, the fibres terminating in both sharp and flat points, and the fibres exhibiting rigid behaviour. BH254a exhibits erionite growing as individual needle-like crystals within vesicles (Fig. 6b). The fibres display rigid behaviour, with larger fibres in a hexagonal shape, and thinner fibres long and rectangular. Lengths range from 6 to 40 μm, and diameter ranges between 0.5 to 2.5 μm. Thinner, long fibre bundles are present in the crystal habits of ARL1 and WS01 (Fig. 6e, 6g), where the fibres also grow within vesicles. While the morphology may be similar between ARL1 and WS01, the size of erionite crystals varies significantly. WS01 (Fig. 6g) is stockier, the fibres are much larger, with erionite bundles up to ∼40 μm in diameter (though individual fibres are 0.1 to 2 μm diameter). The length of the fibres ranges from 50 to 133 μm.
SEM image of erionite samples, displaying sizes and morphological variations: (a) AUM2504; (b) BH254a; (c) AUM2802; (d) GD1a; (e) ARL1; (f) GD4a; (g) WS01; (h) AUM3143.

Fibre dimension measurements of erionite samples in New Zealand, showing the minimum, maximum, mean and median values for fibre width (w), length (L), and aspect ratio (L/w). The measurements highlight the variability in fibre morphology across samples, with notable differences in dimensions and aspect ratios between regions. These data underscore the diversity of erionite morphologies observed

1 AUM2504; 2AUM2802; 3AUM3143; measurements are in µm.
In contrast, ARL1 erionite is shorter, ranging from 10 to 78 μm, and fibres are thinner (diameter: 0.05–0.9 μm). ARL1 bundles are also thinner than WS01, ranging from 3 to 9 μm in thickness (Fig. 6e,g). Finally, woolly asbestiform erionite is displayed in Fig. 6d,f,h, where long bundles of fibres break into smaller fibrils, becoming nanometric in width. Unlike the smaller erionites from the other samples, all erionites from the Mount Somers area (AUM3143, GD1a, GD4a and RGD1 [not pictured]) could be seen without a microscope in hand specimen and displayed similar fibrous morphologies. The fibres were ≤500 μm in length, with fibre bundle diameter varying from 1 to 100 μm.
Transmission electron microscopy
Representative TEM images displayed in Fig. 7 revealed that erionite rods commonly appear bent and are typically arranged in coherent or disjointed bundles with frayed edges (Fig 7a–d). In some of the samples, e.g. GD1a (Fig 7a) and RGD1(Fig 7c), the diameter of the single rods appears thinner than the fibres observed by SEM, with values typically below 100 nm. This is probably due to the higher spatial resolution of TEM, which can resolve fibrils within fibre bundles that may appear as single fibres in SEM images.
TEM images of erionite fibres from selected samples, highlighting differences in fibre morphology: (a) GD1a; (b) ARL1; (c) RGD1; (d) AUM2802.

Unit cell dimensions of several single fibres were obtained using 3DED. These align closely with the ideal unit cell parameters of erionite defined as: a ≈ 13.3 Å, b ≈ 13.3 Å and c ≈ 15.1 Å, and angles α = 90°, β = 90° and γ = 120° (Gualtieri et al., Reference Gualtieri, Artioli, Passaglia, Bigi, Viani and Hanson1998; Fan et al., Reference Fan, Gualtieri, Dirks, Young and Salmond2024). The c-axis spacing of ∼15 Å is distinctive of erionite, important for differentiation from other fibrous zeolites, such as offretite and mordenite, which exhibit a shorter c-axis spacing of ∼7.5 Å (Ray, Reference Ray2020). Table 3 displays the 3DED unit cell parameters of various fibre samples obtained from TEM, which align with reference cell dimensions. All samples exhibited parameters comparable to a ≈ 13 Å and c ≈ 15 Å. Consistency in spacing, particularly for the c-axis, indicates these fibres are probably erionite. The unit cell volume (V) was also calculated.
Crystal unit cell parameters for erionite fibres measured via TEM 3DED analysis

In addition reconstructed diffraction patterns were generated using PETS2 software, and representative images for samples GD1a, AUM2802 and ARL1 are displayed in Fig. 8. Each sample represents a different erionite morphology. The 0kl plane is represented in Fig. 8a,d,g, and for sample ARL1, a complete reconstruction is visible, while for samples AUM2802 and GD1a, due to fibre orientation, diffraction patterns cannot be observed. The 0kl plane reveals a series of evenly-extincted spots along the c-axis, originating by the 63 screw axis of erionite structure. The h0l plane for each sample is represented in Fig. 8b,e,h, displaying the ∼13 Å spacing along the a- and c-axes. Nearly full reconstructions were visible for samples AUM2802 and GD1a, while it is only partly created for ARL1. Unfortunately, the orientation of the fibres for each sample meant that the hk0 plane could not be fully reconstructed (Fig. 8c,f,i).
Reconstructed TEM 3DED data illustrating the 0kl, h0l, and hk0 planes for selected erionite samples ARL1, AUM2802 and GD1a. (a) The 0kl reconstructed plane of the 3DED data set for ARL1 erionite; (b) the h0l diffraction plane of ARL1 erionite; (c) the hk0 diffraction plane for ARL1 erionite; (d) the 0kl diffraction plane for AUM2802 erionite; (e) the h0l diffraction plane of AUM2802 erionite; (f) the hk0 diffraction plane of AUM2802 erionite; (g) the 0kl diffraction plane for GD1a erionite; (h) the h0l diffraction plane of GD1a erionite; (i) the hk0 diffraction plane of GD1a erionite.

Micro-Raman
The micro-Raman spectra for samples ARL1, AUM2802 and AUM2504 were compared with three erionite spectra (R061126, R061110 and R061104) and an offretite spectra (R060767) obtained from the RRUFF database (Lafuente et al., Reference Lafuente, Downs, Yang, Stone, Armbruster and Danisi2015), as depicted in Fig. 9. ARL1 and AUM2802 exhibited prominent peaks at ∼280 cm–1, attributed to the M–O vibrational mode, where M represents cations. These samples also displayed a double peak between 480–504 cm–1, corresponding to the T–O–T vibration (T = Si or Al), and a less intense peak at ∼560 cm–1, due to the T–O bending mode (Rinaudo and Croce, Reference Rinaudo and Croce2019; Tsai et al., Reference Tsai, Huang, Li, Hung, Jiang, Liu, Fang and Chen2021).
Micro-Raman spectrum for samples ARL1, AUM3143 and AUM2802, compared to the three erionite species (R061126, R061110 and R061104) and offretite (R060767) data downloaded from the RRUFF database [https://www.rruff.net, Lafuente et al., Reference Lafuente, Downs, Yang, Stone, Armbruster and Danisi2015].

Similarly, GD4a, characterised as erionite by Patel et al. (Reference Patel, Brook, Kah, Hamilton, Gamberini, Zoboli, Mugnaioli, Malferrari, Fantini, Arletti and Gualtieri2024), showed a peak at 270 cm–1 (M–O) and a doublet at 468–481 cm–1 (T–O–T), consistent with the micro-Raman erionite standards. While there is a slight shift of ∼15 cm–1 within the intensities of some samples, the variations still align with the micro-Raman reference spectra for erionite (Fig. 9). Indeed, the vibrational modes in the erionite standards were characterised by peaks at ∼330 cm–1 (M–O), ∼469–486 cm–1 (T–O–T) and 557–565 cm–1 (T–O bending). In contrast, while AUM3143 displayed some similar intensities at 272 cm–1, 480 cm–1 and 578 cm–1, other intensities were also present (e.g. 700 cm–1; Fig. 9). The presence of additional peaks with higher intensities compared to the erionite spectra suggests that AUM3143 may be an impure sample, containing other mineral phases.
Electron microprobe analysis
Sample elemental compositions determined from EMPA are displayed in Table 4, including the key criteria used to designate a mineral as erionite. Criteria includes an E% value of <10%, TSi [Si/(Si+Al)] ratio of 0.68–0.79, a Mg(Ca+Na) ratio of <0.3, Mg content as <0.8 wt.% and K ≥ 1.9 apfu (Coombs et al., Reference Coombs, Alberti, Armbruster, Artioli, Colella, Galli, Grice, Liebau, Mandarino, Minato, Nickel, Passaglia, Peacor, Quartieri, Rinaldi, Ross, Sheppard, Tillmanns and Vezzalini1997; Passaglia et al., Reference Passaglia, Artioli and Gualtieri1998; Dogan and Dogan, Reference Dogan and Dogan2008; Ballirano and Cametti, Reference Ballirano and Cametti2015). Samples AUM2504 and AUM2802, representing aggregates of acicular fibres, are both erionite-Na. The TSi value is between 0.74–0.77, within the acceptable range for erionite (e.g. Coombs et al., Reference Coombs, Alberti, Armbruster, Artioli, Colella, Galli, Grice, Liebau, Mandarino, Minato, Nickel, Passaglia, Peacor, Quartieri, Rinaldi, Ross, Sheppard, Tillmanns and Vezzalini1997), and the E% value is <10%, while the Mg ratio is <0.3, the K content is < 1.9 in AUM2504 and > 1.9 in AUM2802 (Passaglia et al., Reference Passaglia, Artioli and Gualtieri1998; Dogan and Dogan, Reference Dogan and Dogan2008). Sample BH254a, consisting of long, single acicular needles, is an example of erionite-Ca, alongside ARL1 and WS01, which comprise fibre bundles. These three samples also meet the criteria to be erionite-Ca (Table 4). However ARL1 and BH254a contained lower levels of K, while WS01 met the K content test to be considered erionite. Samples GD4a and GD1a represent woolly bundles of erionite-K. The E% values range from 3 to 4%, K content is ≥ 1.9 apfu and the Tsi values are 0.77–0.79, but the Mg content exceeds the acceptable threshold of >0.8 wt%. TEM images indicated the fibres contain a clay coating on their surfaces, possibly explaining elevated Mg content (Patel et al., Reference Patel, Brook, Kah, Hamilton, Gamberini, Zoboli, Mugnaioli, Malferrari, Fantini, Arletti and Gualtieri2024).
Elemental composition of the samples based on 72 oxygen apfu from EMPA data

Notes: Water content labelled with * is normalised based on 19.47 wt.% H2O – a theoretical estimate based on the average of multiple erionite samples (Passaglia et al., Reference Passaglia, Artioli and Gualtieri1998). Where E% = 100  $ \times $ [(Al+Fe3+)]–Alth]/Alth; Alth = Na + K + 2(Ca+Mg+Sr+Ba); and Tsi = (Si/Si+Al) (Coombs et al., Reference Coombs, Alberti, Armbruster, Artioli, Colella, Galli, Grice, Liebau, Mandarino, Minato, Nickel, Passaglia, Peacor, Quartieri, Rinaldi, Ross, Sheppard, Tillmanns and Vezzalini1997; Passaglia et al., Reference Passaglia, Artioli and Gualtieri1998; Dogan and Dogan, Reference Dogan and Dogan2008)
For sample AUM3143, the chemical formula is (K2.71Mg1.94Ca1.18Na0.30)[Al6.81Si28.58O72] 31.48H2O, with an E% of 26.352, exceeding the threshold typically associated with erionite. Additionally, the Mg content was also too high at 1.9 wt% (Table 4). Although the other analytical techniques suggested this sample could be erionite, the EMPA data is inconclusive, and does not strictly align with the established compositional criteria for erionite (Passaglia et al., Reference Passaglia, Artioli and Gualtieri1998). Sample RGD1 also had a higher than accepted value of Mg, but the E% error is <10%. The elevated Mg content in both RGD1 and AUM3143, could be attributed to the presence of impurities from surface coatings affecting the data such as the clay observed coating GD4a. These coatings can influence the EMPA results and contribute to the compositional discrepancies observed in these samples.
Discussion
The results of this study are summarised in Table 5, which outlines the geological and morphological characteristics of the samples analysed. Variations in crystal habits (categories c, d, and e according to Fig. 2) and morphologies, along with differences in chemical composition and concentration, provide insights into the formation processes and potential implications of these erionite-bearing rocks. These findings serve as the foundation for the following discussion.
Summary of the samples investigated in this study, including their names, locations, geological formations, rock types, morphological descriptions, corresponding crystal habits (according to Fig. 2), chemical composition (Chem), and approximate concentration in the bulk rock (Conc). PVC is Parnell Volcaniclastic Conglomerate

* Samples that had a high Mg or Fe content. #samples that were not measured with PXRD.
Erionite formation and occurrence
Erionite in New Zealand was found to occur within the two main palaeoenvironmental settings as described by Patel et al. (Reference Patel, Brook, Kah and Hamilton2022): (1) diagenesis within a marine palaeoenvironment; and (2) hydrothermal alteration of intermediate to mafic rocks. The composition of erionite reflects the geological conditions and environments under which it forms, with factors such as the type of host rock, fluid composition and palaeoenvironmental setting playing significant roles in shaping the zeolites chemistry (Patel et al., Reference Patel, Brook, Kah and Hamilton2022).
This study described erionite from three distinct regions, with varying cation concentrations, influenced by the differing geological processes at each site. All three minerals within the erionite series were identified, each localised to one region: (1) erionite-Na: Kaipara; (2) erionite-Ca: Auckland; and (3) erionite-K, Gawler Downs.
Samples AUM2504 and AUM2802, occurred within a 10 cm tuff bed where the mineral was disseminated throughout the whole layer, with the concentration ranging from 20 to 46 wt.%. This is very similar to the erionite from Cappadocia, Turkey (Temel and Gündoğdu, Reference Temel and Gündoğdu1996) and Rome, Oregon, United States (Wolf and Ellison, Reference Wolf and Ellison1971). The formation of this erionite was through diagenesis in a closed marine sedimentary environment, from tuff beds becoming sealed in between mudstone layers (Davidson and Black, Reference Davidson and Black1994; Passaglia and Sheppard, Reference Passaglia and Sheppard2001). The closed hydrologic system led to pore fluids interacting with rhyolitic volcanics and dissolving silica and liberating alkali ions, particularly sodium into the fluid (Davidson and Black, Reference Davidson and Black1994). Similar to the processes described by Gottardi (Reference Gottardi1989) for hydrologically closed systems, the slow movement of alkali-enriched pore waters over impermeable layers probably enhanced alkalinity, promoting zeolite crystallisation and resulting in sodium-rich erionite.
The Auckland samples of erionite-Ca (BH254a, ARL1) are found to only occur within pore spaces of the volcaniclastic pebbles, where erionite formed diagenetically as individual needles or bundles of crystals, embedded within clay linings in vugs. The occurrence is typical of erionite within volcaniclastic rocks (Sheppard, Reference Sheppard1996; Harper et al., Reference Harper, Dozier, Chouinard and Ray2017). Though WS01 is also a sample of erionite-Ca, it originates from the hydrothermal alteration of basalt, but with a similar morphology to ARL1. Despite the different host rocks and formation processes, the calcium end-member for these samples may be attributed to the host rock chemistry and associated mineral assemblages. WS01 formed within calc-alkaline volcanics of the Waitakere Group, while the Parnell Volcaniclastic Conglomerate also contained elevated levels of calcium due to the presence of feldspars and shell fragments from its marine origin (Wright and Black, Reference Wright and Black1981; Gordon, Reference Gordon2000).
In contrast, zeolites within the Mount Somers area of the South Island (AUM3143, GD4a, GD1a, RGD1) feature erionite-K formed due to hydrothermal alteration within andesite/dacite ash deposits. Hydrothermal processes altered vesicles within dacite flows and tuff layers, enabling crystallisation of zeolites and silica minerals such as agate, opal and quartz, infilling vugs (Marantos et al., Reference Marantos, Christidis and Ulmanu2012; Patel et al., Reference Patel, Brook, Kah, Hamilton, Gamberini, Zoboli, Mugnaioli, Malferrari, Fantini, Arletti and Gualtieri2024). These hydrothermal conditions facilitated growth of larger, well-crystallised minerals, with erionite appearing as woolly mineral aggregates, infilling vesicles and vugs, and observable in situ without magnification (Gottardi, Reference Gottardi1989). The distinct chemical characteristics of the Mt Somers erionite reflect the influence of host rock and hydrothermal fluid chemistry during formation (Patel et al., Reference Patel, Brook, Kah and Hamilton2022).
Chemistry
The correlation between host rock composition and the fluid chemistry is evident in the cation distribution and other chemical attributes of the erionite samples. EMPA data from this study is shown on a compositional ternary plot (Fig. 10) to illustrate variations in cation concentrations and compare them with published erionite and offretite data. Distinct variations in the relative concentrations of Ca+Na, Mg and K are observed in New Zealand samples (Fig. 10). The global data (Fig. 10) shows that erionite and offretite form distinct clusters, with offretite samples containing higher Mg concentrations. Generally, the Kaipara and Auckland samples are clustered and overlap with the erionites from the literature. These samples exhibit little variation in K, and Mg contents, but higher variation in Ca+Na cations. The samples are positioned in the Ca+Na and K regions of the plot, consistent with known erionite compositions, characterised by low Mg content (Passaglia et al., Reference Passaglia, Artioli and Gualtieri1998; Mattioli et al., Reference Mattioli, Giordani, Ballirano, Salvioli-Mariani, Bernardini and Ventura2023).
Ternary plot illustrating relative concentrations of Ca+Na, Mg, and K in erionite and offretite samples from this study and the literature. Positions indicate proportional differences in Ca+Na, Mg, and K. In the New Zealand samples, coloured squares and diamonds represent erionite, with diamonds indicating a higher Mg content, while stars represent samples that may have undergone additional alteration. Black triangles (erionite) and black circles (offretite) are data from the literature (Alberti et al., Reference Alberti, Martucci, Galli and Vezzalini1997; Passaglia et al., Reference Passaglia, Artioli and Gualtieri1998; Ballirano et al., Reference Ballirano, Andreozzi, Dogan and Dogan2009; Cametti et al., Reference Cametti, Pacella, Mura, Rossi and Ballirano2013; Gualtieri et al., Reference Gualtieri, Gandolfi, Pollastri, Pollok and Langenhorst2016; Quiroz-Estrada et al., Reference Quiroz-Estrada, Pacella, Ballirano, Hernández-Espinosa, Felipe and Esparza-Schulz2020; Battiston et al., Reference Battiston, Comboni, Pagliaro, Lotti, Hanfland and Gatta2022; Giacobbe et al., Reference Giacobbe, Moliterni, Di Giuseppe, Malferrari, Wright, Mattioli, Raneri, Giannini, Fornasini, Mugnaioli, Ballirano and Gualtieri2023; Mattioli et al., Reference Mattioli, Giordani, Ballirano, Salvioli-Mariani, Bernardini and Ventura2023).

In addition to the compositional data in Fig. 10, the samples also mostly met the requirements to be considered erionite according to the Tsi ratio and the Mg(Ca+Na) cation ratio. According to Passaglia et al. (Reference Passaglia, Artioli and Gualtieri1998), the observed Tsi ratio for erionite samples is 0.68 < Tsi < 0.79 as displayed in Table 4, this criterion was met by all samples, except AUM3143, which had a value of Tsi = 0.81. Futhermore, the Mg(Ca+Na) cation ratio is < 0.3, while offretite exhibits values closer to 1.0 (Gualtieri et al., Reference Gualtieri, Artioli, Passaglia, Bigi, Viani and Hanson1998; Passaglia et al., Reference Passaglia, Artioli and Gualtieri1998). Samples AUM2504, AUM2802, BH254a, ARL1 and WS01 adhered to the threshold reinforcing the classification of these samples as erionite.
The Gawler Downs samples (GD4a, GD1a, AUM3143 and RGD1), however exhibited distinct compositional features that warrant further discussion. All these samples showed elevated Mg concentrations, as displayed on Fig. 10 with GD4a and GD1a, presented by diamonds, and AU3143 and RGD1 represented by stars. For samples GD4a, and GD1a and Tsi value was within the acceptable range, however the Mg cation ratio was > 0.3. Nonetheless, GD4a and GD1a have been classified as erionite due to HRTEM results and micro-Raman indicating a smectite coating on the surface of GD4a (discussed in Patel et al. (Reference Patel, Brook, Kah, Hamilton, Gamberini, Zoboli, Mugnaioli, Malferrari, Fantini, Arletti and Gualtieri2024), which is also likely to be the case for GD1a and can account for the elevated Mg content (Patel et al., Reference Patel, Brook, Kah, Hamilton, Gamberini, Zoboli, Mugnaioli, Malferrari, Fantini, Arletti and Gualtieri2024).
AUM3143 and RGD1, however, presented greater challenges in classifying them as erionite. Both samples had high Mg concentration, exceeding the typical 0.8 value common for erionite, and the Mg/(Ca+Na) ratio which should be below 0.3. In addition, AUM3143, and RGD1 had a higher Tsi ratio than is commonly accepted for erionites. Coloured stars represent these samples, clearly displaying the elevated Mg concentrations, compared to both erionite and the offretite samples (Fig. 10). The likelihood for a mixed erionite–offretite phase was explored due to the position of the samples on Fig. 11, but aside from elevated Mg content and the Tsi value, there is no other indication that these samples are offretite. Indeed, the crystal lattice parameters measured by TEM 3DED and micro-Raman analyses are consistent with erionite. Similar to GD4a and GD1a, the elevated Mg content may be due to impurities on the surface of the fibres. Additionally, unlike GD1a and GD4a which were freshly collected, these samples were collected years ago. Hence, post-collection oxidation on the surface could have also contributed to the elevated Mg levels, by altering the surface chemistry of the clays coating the fibres (Rochelle et al., Reference Rochelle, Leroueil and Tavenas1986; Stucki et al., Reference Stucki, Lee, Zhang and Larson2002; Pacella et al., Reference Pacella, Fantauzzi, Atzei, Cremisini, Nardi, Montereali, Rossi and Ballirano2017). The post-collection alteration may also account for the presence of 10 wt.% smectite alongside only 14.5 wt.% erionite in RGD1 (Table 1). Smectite, an Fe- and Mg rich clay mineral is commonly found in association with erionite and can form as a secondary phase through the alteration of iron bearing host rocks (Gualtieri et al., Reference Gualtieri, Gandolfi, Pollastri, Pollok and Langenhorst2016). It may also act as a precursor to erionite as both minerals share structural elements including six-membered rings of (Si,Al)O4 tetrahedra (Matassa et al., Reference Matassa, Familiari, Relucenti, Battaglione, Downing, Pacella, Cametti and Ballirano2015). The presence of the smectite phase could indicate surface alteration processes which may affect the surface chemistry of the fibres.
Correlation between the unit-cell volume (V) and the Tsi ratio for the erionites from this investigation, compared to results from literature (Passaglia et al., Reference Passaglia, Artioli and Gualtieri1998; Ballirano et al., Reference Ballirano, Andreozzi, Dogan and Dogan2009; Quiroz-Estrada et al., Reference Quiroz-Estrada, Pacella, Ballirano, Hernández-Espinosa, Felipe and Esparza-Schulz2020; Mattioli et al., Reference Mattioli, Giordani, Ballirano, Salvioli-Mariani, Bernardini and Ventura2023). The outliers RGD1, and AUM3143 were removed to calculate the regression correlation factor (rcf) within this study; rcf = 0.50 (New Zealand erionite); rcf = 0.97 (calculated from literature).

The relationship between the unit cell volume (V) and the Si/(Si+Al) ratio (Tsi) for erionite samples, reported initially by Passaglia et al. (Reference Passaglia, Artioli and Gualtieri1998), was applied in this study to the nine New Zealand samples and data from other published studies (Ballirano et al., Reference Ballirano, Andreozzi, Dogan and Dogan2009; Quiroz-Estrada et al., Reference Quiroz-Estrada, Pacella, Ballirano, Hernández-Espinosa, Felipe and Esparza-Schulz2020; Mattioli et al., Reference Mattioli, Giordani, Ballirano, Salvioli-Mariani, Bernardini and Ventura2023). A comparison of the 27 globally sourced erionites are displayed in Fig. 11, together with samples from this study. As evident on the graph, previous studies have demonstrated a strong correlation between V and TSi with a regression correlation factor (rcf) of 0.97, closely matching the 0.96 reported by Passaglia et al. (Reference Passaglia, Artioli and Gualtieri1998). However, the samples from this study show a moderate correlation, with rcf = of 0.50 after removing the outliers (AUM3143, RGD1) from the calculations. Notably, only three samples (GD4a, ARL1 and WS01) closely aligned with the trendline established in literature, shown in orange in Fig. 11 as per the regression model from Passaglia et al. (Reference Passaglia, Artioli and Gualtieri1998). The Tsi value can be estimated using the equation:
 \begin{equation*}{{\text{T}}_{{\text{si}}}} = \frac{{{\text{Si}}}}{{{\text{Si}} + {\text{Al}}}} = { } - 0.00213 \times V \times 5.65149\end{equation*}
The calculated TSi values for WS01, ARL1, and GD4a are consistent with the measured Si/(Si+Al) ratios. However, for the remaining New Zealand samples, the regression equation does not accurately estimate the TSi values. This discrepancy highlights the variability in these samples compared to the global dataset, underscoring potential differences in their composition due to formational processes.
Erionite in a global context
To place the compositional observations of erionite in a wider framework, New Zealand erionite can also be compared with global occurrences. The distribution of erionite in New Zealand generally aligns with global occurrences of erionite, but also displays distinctive features. For example in Cappadocia, Turkey erionite is found within the Zelve ignimbrite, but while erionite occurs in an outcrop near Karain in layers within the unit, other areas of the same unit are unaltered (Mumpton, Reference Mumpton1979; Temel and Gündoğdu, Reference Temel and Gündoğdu1996). Similarly, in Rome, Oregon (United States), erionite has been studied widely and is found within the Miocene Rome tuff beds (Ballirano et al., Reference Ballirano, Andreozzi, Dogan and Dogan2009; Van Gosen et al., Reference Van Gosen, Blitz, Plumlee, Meeker and Pierson2013). The Rome beds are ∼100 m thick, but erionite is concentrated in just two horizons: a lower 3–6 m thick bed composed almost entirely of erionite, and an upper 6–7 m bed where erionite occurs only within a 1 m layer near the middle (Sheppard, Reference Sheppard1996; Van Gosen et al., Reference Van Gosen, Blitz, Plumlee, Meeker and Pierson2013). This example is similar to what was observed in Kaipara, where erionite was only found in a single tuff bed, with adjacent layers devoid of erionite.
New Zealand is also unusual because while all three erionite series are present, each is restricted to a specific region: erionite-Na in Kaipara; erionite-Ca in Auckland; and erionite-K in Mt Somers. This differs somewhat from findings in other countries and regions, where multiple erionite species coexist in the same region and host rocks. For example, in Latium, Italy, both erionite-Na and erionite-K have been identified within pyroclastic rocks (Mattioli et al., Reference Mattioli, Giordani, Ballirano, Salvioli-Mariani, Bernardini and Ventura2023). Similarly in the Cappadocia region of Turkey, ignimbrite samples revealed the presence of both erionite-K and erionite-Na (Dogan et al., Reference Dogan, Baris, Dogan, Emri, Steele, Elmishad and Carbone2006; Dogan and Dogan, Reference Dogan and Dogan2008). Together, these comparisons emphasise that erionite formation is highly dependent on geological and geochemical conditions, explaining its highly localised distribution worldwide and, in New Zealand, the restriction of each cation series to a distinct region.
Crystal habit vs. chemistry
The relationship between the crystal habit of erionite and its chemical composition may also provide information on how chemistry influences morphology. This study has identified distinct morphologies across erionite samples from different regions in New Zealand, each associated with a specific erionite series (Fig. 6).
Woolly aggregates of erionite-K were identified in the Mt Somers samples, forming long asbestiform bundles, splitting into nanometric fibrils. This is a rarer crystal habit for erionite, as many samples are described as being ‘acicular’ or ‘prismatic’ (Gude and Sheppard, Reference Gude and Sheppard1981) However the erionite-K from Mt Somers is similar to erionites from Latium, Italy (Mattioli et al., Reference Mattioli, Giordani, Ballirano, Salvioli-Mariani, Bernardini and Ventura2023), and Lander County, United States (Gude and Sheppard, Reference Gude and Sheppard1981; Pacella et al., Reference Pacella, Cremisini, Nardi, Montereali, Pettiti, Giordani, Mattioli and Ballirano2018). In contrast, woolly erionite from Oregon, United States has been characterised as erionite-Na (Cametti et al., Reference Cametti, Pacella, Mura, Rossi and Ballirano2013). Other erionite-K samples display prismatic bundles of fibrils (Ballirano et al., Reference Ballirano, Andreozzi, Dogan and Dogan2009) or individual long acicular needles (Ortega-Guerrero and Carrasco-Núñez, Reference Ortega-Guerrero and Carrasco-Núñez2014).
In Kaipara erionite-Na was found occurring as prismatic aggregates of fibres, similar to the erionite-Na from Agua Prieta, Mexico (Quiroz-Estrada et al., Reference Quiroz-Estrada, Pacella, Ballirano, Hernández-Espinosa, Felipe and Esparza-Schulz2020), however the fibres in AUM2504 and AUM2802 are thicker than those reported from Mexico. Erionite-K from Rome, Oregon (Ballirano et al., Reference Ballirano, Andreozzi, Dogan and Dogan2009) also shared a similar crystal habit with the Kaipara erionite. In other studies erionite-Na has been identified as woolly e.g. Cametti et al. (Reference Cametti, Pacella, Mura, Rossi and Ballirano2013), or acicular with a highly fibrous habit e.g. Mattioli et al. (Reference Mattioli, Giordani, Ballirano, Salvioli-Mariani, Bernardini and Ventura2023).
In Auckland, two distinct morphologies were found: bundles of fibres and acicular needles, both representing erionite-Ca. The needle-like fibres identified in BH254a are similar to the erionite-K identified in San Miguel de Allende, Mexico (Ortega-Guerrero and Carrasco-Núñez, Reference Ortega-Guerrero and Carrasco-Núñez2014), and erionite fibres from North Dakota, United States and Cappadocia, Turkey (Carbone et al., Reference Carbone, Baris, Bertino, Brass, Comertpay, Dogan, Gaudino, Jube, Kanodia, Partridge, Pass, Rivera, Steele, Tuncer, Way, Yang and Miller2011), although the particular erionite type was not stated. In contrast, ARL1 and WS01 resembled erionite-Ca from Cape Lookout, Oregon, United States (Wise and Tschernich, Reference Wise and Tschernich1976), Lessini Mountains, Italy (Giordani et al., Reference Giordani, Mattioli, Ballirano, Pacella, Cenni, Boscardin and Valentini2017), and from Tuzköy, Turkey (Giacobbe et al., Reference Giacobbe, Moliterni, Di Giuseppe, Malferrari, Wright, Mattioli, Raneri, Giannini, Fornasini, Mugnaioli, Ballirano and Gualtieri2023). Additionally, erionite-Na from Latium, Italy aligns closely with these samples (Mattioli et al., Reference Mattioli, Giordani, Ballirano, Salvioli-Mariani, Bernardini and Ventura2023). Other crystal habits that erionite-Ca may form include acicular crystals grouped in radial aggregates (Mattioli et al., Reference Mattioli, Giordani, Ballirano, Salvioli-Mariani, Bernardini and Ventura2023), and growing on levyne and forming flexible wool-like fibres (Sheppard et al., Reference Sheppard, Gude, Desborough and White1974; Mattioli et al., Reference Mattioli, Giordani, Ballirano, Salvioli-Mariani, Bernardini and Ventura2023).
Despite these observations, no clear correlation between the erionite series and its crystal habit were recognised, i.e. woolly morphologies were observed in both erionite-K (Mt Somers) and erionite-Na (Oregon, United States), while acicular needles and prismatic bundles were present across multiple erionite series, including erionite-Na, -K and -Ca. However, when the Tsi ratio is taken into consideration, it appears to correlate with the crystal habit in New Zealand, as observed in Fig. 12. For example, the lowest average Tsi ratio was found in the bundles of WS01 and ARL1 erionite-Ca (Tsi = 0.73), while the aggregates of fibres in AUM2504 and AUM2802 exhibited slightly higher ratios (0.76). The needle-like erionite-Ca crystals of BH254a had a Tsi value of 0.77, and the woolly asbestiform erionite-K from Gawler Downs had the highest average Tsi ratio of 0.79. These findings align with studies demonstrating the influence of the Si/Al ratio on zeolite crystal habit. For example, Kostov (Reference Kostov1967) observed that increased substitution of Al for Si (resulting in a lower Tsi ratio) leads to shorter crystal habits in zeolites and reduces the asymmetry of the crystal lattice, influencing their tendency to adopt particular shapes. Higher Tsi ratios correspond to more elongate and acicular morphologies, favouring fibrous growth, while lower Tsi ratios result in prismatic, shorter crystals. Similarly, Shirazi et al. (Reference Shirazi, Jamshidi and Ghasemi2008) reported that higher Al content (lower Tsi values) decreases crystal size. This relationship between the Tsi ratio and crystal habit is evident in this study, where lower Tsi values indicative of higher Al content, correspond to shorter prismatic fibres (e.g. WS01, ARL1, AUM2504 and AUM2802). In contrast, higher Tsi values, such as those observed in the Mount Somers erionites, correlate with longer, more fibrous crystals. This corresponds to data from literature, i.e. Mattioli (Reference Mattioli, Giordani, Ballirano, Salvioli-Mariani, Bernardini and Ventura2023) found that a sample of extremely fibrous, hair-like erionite (VV67a) has a TSi value of 0.773. This value is comparable to GD1a alongside the morphology, suggesting a potential link between TSi ratio and crystal habit. From these observations, it suggests that the Tsi ratio, along with geological and environmental conditions, plays a more prominent role in shaping the crystal habit and morphology of erionite, than the influence of extra-framework cations (e.g. K, Ca or Na).
SEM images of erionite samples from this study, illustrating the diversity in crystal habit with varying Tsi ratios. (a) Prismatic bundles of erionite-Ca (WS01 and ARL1; Tsi = 0.734). (b) Aggregates of fibres in erionite-Na (AUM2504 and AUM2802; Tsi = 0.76). (c) Needle-like fibres of erionite-Ca (BH254a; Tsi = 0.77). (d) Woolly, asbestiform morphology of erionite-K from Gawler Downs (Tsi = 0.791) with highly elongate fibres splitting into nanometric fibrils. These morphologies demonstrate the correlation between increasing Tsi ratio (Si/(Si+Al)) and crystal habit, from shorter, prismatic habits at lower Tsi ratios to more fibrous, elongate habits at higher Tsi ratios.

It is important to note that this study focuses specifically on the correlation between the Si/Al ratio and the crystal morphology of erionite. While the shape of zeolite crystals is known to change significantly with variations in the Si/Al ratio; for example, in the synthetic erionite–offretite intergrowth system described by Lillerud and Raeder (Reference Lillerud and Raeder1986), other factors also influence reaction kinetics, crystal growth and morphology. Among these factors, previous studies have identified the pH of the fluids, temperature and water content as key parameters governing the crystallisation and morphology of erionite and other zeolites. Natural erionite typically forms under low-pressure and low-temperature conditions in alkaline environments (Hay and Sheppard, Reference Hay and Sheppard2001), where crystal growth is largely controlled by the availability of suitable ions and the fluid chemistry. Unfortunately, for these specific erionite samples, quantitative data describing the exact formation conditions are not available. Consequently, the potential roles of pH, temperature and water content during crystal formation can only be inferred from existing literature.
Regarding pH, higher values (particularly above pH 9) increase the solubility of SiO₂, as shown by Taylor and Surdam (Reference Taylor and Surdam1981). This increase in silica availability can raise the Si/Al ratio, which in turn influences crystal morphology. Temperature may also play a significant role in shaping crystals. For example, Houlleberghs et al. (Reference Houlleberghs, Breynaert, Asselman, Vaneeckhaute, Radhakrishnan, Anderson, Taulelle, Haouas, Martens and Kirschhock2019) observed that higher temperatures lead to the formation of more elongated, needle-like merlinoite crystals. Finally, water content appears to favour the growth of fibrous zeolite morphologies. Zhang et al. (Reference Zhang, Xie, Xin, Li, Liu and Xu2011) demonstrated that, in addition to the SiO₂/Al₂O₃ ratio, the H2O/SiO2 ratio influences the crystal habit of synthetic mordenite. A more diluted gel, i.e. one with a higher water content promotes preferential growth along the c-axis, resulting in more needle-like crystals.
Morphology and toxicity
The varying morphologies of the erionite fibres is critical in understanding their potential toxicity. The fibre dimensions (i.e. length, width and aspect ratio) play a fundamental role in erionite toxicity (Donaldson et al., Reference Donaldson, Murphy, Duffin and Poland2010; Gualtieri, Reference Gualtieri2023). This is because the fibre size and shape directly influence how deeply fibres may penetrate the respiratory tract and how the cells in the body will react to the fibres (Belluso et al., Reference Belluso, Cavallo, Halterman and Gualtieri2017; Mirata et al., Reference Mirata, Almonti, Di Giuseppe, Fornasini, Raneri, Vernazza, Bersani, Gualtieri, Bassi and Scarfì2022). In general, studies indicate that the longer and thinner a fibre is, the more carcinogenic it may be, while shorter fibres (<5 μm) are assumed to be less toxic/carcinogenic (Donaldson et al., Reference Donaldson, Murphy, Duffin and Poland2010; Mossman et al., Reference Mossman, Lippmann, Hesterberg, Kelsey, Barchowsky and Bonner2011). According to WHO (1997) guidelines, fibres need an L ≥5 μm, w ≤3 μm, and an L/w ratio ≥ 3:1 to be respirable. The NIOSH (2019) guideline accords with the same length and width thresholds as WHO (1997), but specifies that the length/width ratio must be 5:1 for fibres to be respirable. Despite the 5 μm WHO (1997) threshold, concern has emerged recently (e.g. Dozier and Ashley, Reference Dozier and Ashley2022 p. 13) that high doses of shorter fibres could mean that lung macrophages (a type of white blood cell that degrades pathogens), cannot efficiently remove fibres through natural clearance mechanisms, causing fibrosis.
Notwithstanding this conjecture regarding fibre size and toxicity, New Zealand erionite fibre dimensions are displayed in Fig. 13 and vary with location and chemistry. All fibres measured for samples AUM2802, BH254a, WS01, GD1a, RGD1, ARL1 and AUM3143 can be considered respirable according to the WHO (1997) morphology thresholds (Table 2) because the fibres meet the L, w and L/w criteria. Fibre length and width varied across the three series (-Na, -C, -K; Fig. 13). Erionite-K samples (GD4a, GD1a, AUM3143, RGD1) were the longest fibres, c. 250–800 µm (maximum 1.4 mm). AUM2504 and AUM2802 (both erionite-Na) were the shortest of all samples (9–14 µm). The erionite-Ca from Auckland exhibited slightly longer fibres and a wider range in length (23–94 µm), although BH254a contrasted with WS01 and ARL1, as it formed needles (Fig. 13a).
Box plots of fibre length (a) and width (b). Each box represents the range of observed measurements (in µm) for fibres from individual samples by erionite series: Na (AUM2504, AUM2802), Ca (BH254a, ARL1, WS01), and K (GD4a, GD1a, AUM3143, RGD1). Boxes represent the interquartile range with the median line within each. Outliers are represented as points beyond the whiskers.

Regarding fibre width (Fig. 13b), erionite-Ca samples display most variability, but with notable differences amongst different samples. Indeed, ARL1 exhibited thinner fibres, while BH254a was wider, up to 2.5 µm thick. However, these measurements refer to the individual fibres or fibrils, as opposed to the thicker bundles, and the differences in fibre thickness may be due to the vesicular nature of the host rock in which erionite formed (e.g. Rakovan, Reference Rakovan2004). Larger pore spaces provide enough accommodation space for larger fibre sizes to develop (Rakovan, Reference Rakovan2004; Marantos et al., Reference Marantos, Christidis and Ulmanu2012). In contrast, erionite-Na exhibited thinner fibres with values generally <1 µm (Fig. 13b). Erionite-K (Mt Somers) exhibited the most variability in width, as fibre bundles continuously split into smaller nanometric fibres, reaching widths as low as 12 nm.
Health implications
New Zealand erionite morphologies reported here include fibrous and woolly forms, pointing to potential health hazards, dependent on the environmental context (e.g. Beaucham et al., Reference Beaucham, King, Feldmann, Harper and Dozier2018). A significant proportion of the erionite fibres in this study correspond with the WHO (1997) and NIOSH (2019) criteria for regulated fibres. Regulated fibres, especially those with longer, thin and flexible morphologies, are concerning due to their capability to reach the deep respiratory system (Donaldson et al., Reference Donaldson, Murphy, Duffin and Poland2010; Mossman et al., Reference Mossman, Lippmann, Hesterberg, Kelsey, Barchowsky and Bonner2011). However, the overall concentration of erionite fibres in the samples is relatively low, manifesting either in discrete 3–5 cm thick sedimentary rock layers or small vesicles, which will mitigate the potential immediate exposure of undisturbed erionite (Patel et al., Reference Patel, Brook, Kah, Hamilton, Gamberini, Zoboli, Mugnaioli, Malferrari, Fantini, Arletti and Gualtieri2024).
In New Zealand, the presence of erionite in both urban (Auckland) and rural areas (Kaipara, and Mount Somers), raises the potential of exposure in very different environmental settings and contexts. The Auckland region, containing approximately one-third of New Zealand’s 5.3 million population, is rapidly growing, with construction of transit infrastructure, including tunnels and roads, and earthworks on ‘greenfield’ sites for residential housing (Brook et al., Reference Brook, Black, Salmond, Dirks, Berry and Steinhorn2020). These developments could lead to erionite exposure issues during earthworks or from the disposal of overburden. The New Zealand construction industry is regulated, with dust control measures and the use of personal protective equipment commonplace (Guo et al., Reference Guo, Weston, Jianphinitnan, Liu, Scheepbouwer, van der Walt and Goh2021), but non-occupational exposure remains a concern (e.g. Glass and Clayson, Reference Glass and Clayson2017), as erionite fibres may become airborne and inadvertently inhaled. At Gawler Downs, the hydrothermal occurrence of erionite may not represent a significant health risk as the concentration of the zeolite within the host rock is relatively low (Gualtieri et al., Reference Gualtieri, Gandolfi, Passaglia, Pollastri, Mattioli, Giordani, Ottaviani, Cangiotti, Bloise, Barca, Vigliaturo, Viani, Pasquali and Gualtieri2018). However, weathering could disperse fibres into the surrounding soils, creating a potential pathway for exposure but, the rural nature of the area, with its low population density, limits the probability of exposure. In contrast, the diagenetic occurrence of erionite at Kaipara poses a greater hazard due to the higher concentration of microcrystalline erionite in the bulk rock. However, the rural location of Kaipara also implies that exposure risks remain minimal (Gualtieri et al., Reference Gualtieri, Gandolfi, Passaglia, Pollastri, Mattioli, Giordani, Ottaviani, Cangiotti, Bloise, Barca, Vigliaturo, Viani, Pasquali and Gualtieri2018).
The fibrous morphology also implies a high surface-area-to-volume ratio, which enhances interaction with cellular structures upon inhalation (Schmid and Stoeger, Reference Schmid and Stoeger2016; Gualtieri, Reference Gualtieri2023). Indeed, studies on similar fibrous minerals suggest that surface reactivity increases with finer fibril sizes (Turci et al., Reference Turci, Colonna, Tomatis, Mantegna, Cravotto, Gulino, Aldieri, Ghigo and Fubini2012). This can lead to more significant inflammation and cytotoxicity, due to an increase in the mineral’s physical and chemical interactions with cells (Dogan et al., Reference Dogan, Dogan and Hoskins2008; Gualtieri, Reference Gualtieri2023). This may be exacerbated by the tendency of some of erionites reported here (e.g. GD4a, AUM3143, RGD1, GD1a), to break into smaller fibrils. Whether these smaller fibrils are more respirable than larger fibres is open to conjecture (Dozier and Ashley, Reference Dozier and Ashley2022). However, their smaller diameter and persistent length enhances potential to penetrate deeper into the respiratory system, including the alveolar regions, where clearance by cells may become difficult (Donaldson et al., Reference Donaldson, Murphy, Duffin and Poland2010; Gualtieri, Reference Gualtieri2023). The effect of these fibrils may generate ‘frustrated phagocytosis,’ a process where immune cells are unable to fully engulf long fibres and remove them, leading to inflammation that amplifies the cytotoxicity of the mineral (Donaldson et al., Reference Donaldson, Murphy, Duffin and Poland2010; Mirata et al., Reference Mirata, Almonti, Di Giuseppe, Fornasini, Raneri, Vernazza, Bersani, Gualtieri, Bassi and Scarfì2022).
With MM cases described as an ‘epidemic’ in New Zealand (Kjellstrom, Reference Kjellstrom2004), this data supports the hypothesis formulated by Brook et al. (Reference Brook, Black, Salmond, Dirks, Berry and Steinhorn2020), which suggests that some MM incidences may be linked to erionite exposure. This underscores the importance of developing specific health and safety guidelines that limit exposure to erionite-bearing dust, especially in high-risk areas, such as land development and construction activities (e.g. Keer et al., Reference Keer, Brooks, Glass, McLean, Harding and Douwes2022), that may disturb erionite-bearing rock and residual soils.
Conclusion
A multi-analytical approach (using SEM, EMPA, TEM 3DED, and micro-Raman) was initially applied to 138 samples from potential erionite localities around New Zealand. From this screening, nine samples were selected for detailed analysis based on their likelihood of being erionite.
The erionite samples represent three distinct series, from three regions: (1) Kaipara. Erionite-Na (AUM2802 and AUM2504) occurred as aggregates of fibres disseminated through a diagenetically-altered tuff layer. (2) Auckland. Erionite-Ca (BH254a, ARL1, and WS01) formed within the vesicles of volcaniclastic conglomerate and WS01 formed in basalt. ARL1 and WS01 crystallised as fibre bundles, while BH254a occurred as acicular needles. (3) Mount Somers. Erionite-K; (GD4a, RGD1, GD1a, and AUM3143) mineralised as an asbestiform woolly mass, formed via hydrothermal alteration of andesite dacite ash deposits.
The chemical analysis revealed a strong relationship between erionite’s formational environment and its composition, with distinct series localised to specific regions. While most samples adhered to established classification thresholds, outliers such as AUM3143 and RGD1 demonstrated elevated Mg concentrations, attributed to post-collection oxidation and surface impurities. Morphological analysis identified considerable variability, with fibre dimensions influenced more by environmental factors than the chemical composition. Additionally, the observed correlation between the Tsi ratio and crystal habit highlights the influence of Si/Al composition on erionite morphology, with higher Tsi ratios favouring elongated fibrous forms and lower ratios linked to shorter prismatic morphologies. These results indicate that the crystal chemistry and morphology of erionite are strongly dependent on local geological and geochemical conditions. The restriction of each series to a particular region and the TSi – crystal habit correlation underscores the importance of host-rock composition and pore fluid chemistry in determining erionite type. Consequently, accurate classification and understanding of natural erionite requires a multi-analytical approach that integrates chemistry, morphology and formational environment rather than relying on a single parameter. This aids in improving the overall understanding of the crystal chemistry and occurrence of natural erionite.
Morphological analysis revealed that many fibres in these samples meet the global health guidelines to be considered respirable and may penetrate into the deepest part of the lungs. However, the erionite samples were found in low concentrations, which may mitigate some of their health impacts.
The results highlight that erionite or erionite-like minerals occur in several regions of New Zealand, including Kaipara, Auckland and Mount Somers, spanning both the North and South Islands. The potential health risks associated with erionite exposure, depend on both the geological setting and proximity of populated areas. Sedimentary deposits with widespread occurrence particularly in urban areas may warrant higher priority for investigation due to the increased likelihood of exposure. In contrast hydrothermal erionite or erionite found in rural areas probably poses minimal risk, although each case should be evaluated individually.
Future studies should focus on conducting detailed risk assessments of erionite in New Zealand, including using data presented herein for: (1) guiding surveys of the presence of erionite in surface rocks and soils; (2) exposure pathway monitoring to establish any activities (e.g. groundworks) that cause erionite to become airborne and respirable; (3) developing mitigation methods to prevent occupational exposure.
Supplementary material
The supplementary material for this article can be found at https://doi.org/10.1180/mgm.2025.10171.
Acknowledgements
This work was funded by the New Zealand Ministry of Business Innovation and Employment (MBIE) project 3721404 titled ‘Assessing and Managing the Risk of Carcinogenic Erionite in New Zealand.’ The work was also supported through a Royal Society of New Zealand Catalyst Seed grant 20-UOA-016-CSG (to M.B.) and through the University of Auckland Doctoral scholarship scheme (to J.P.). The authors express their gratitude to Dr. Yuan Tao (Auckland University of Technology) for technical assistance during the SEM-EDS analysis. We acknowledge the technical staff at University of Auckland, including Dr. Adrian Turner and Dr. Paul Young, for their support with TEM analysis, and Dr. Timothy Christopher for his assistance with PXRD analysis. We also thank Dr. Maria Cristina Gamberini (University of Modena and Reggio Emilia, Modena, Italy) for her technical assistance with the micro-Raman analyses. Additionally, we extend our appreciation to the Centre for Instrument Sharing of the University of Pisa (CISUP) for providing TEM analysis. Finally, we acknowledge the facilities and the scientific and technical assistance of Dr. Karen Privat from Microscopy Australia at the Electron Microscopy Unit (EMU) within the Mark Wainwright Analytical Centre (MWAC) at UNSW Sydney. Finally, the authors warmly thank the editor and the three reviewers for their suggestions and support during the revision of the manuscript.
Competing interests
The authors declare none.


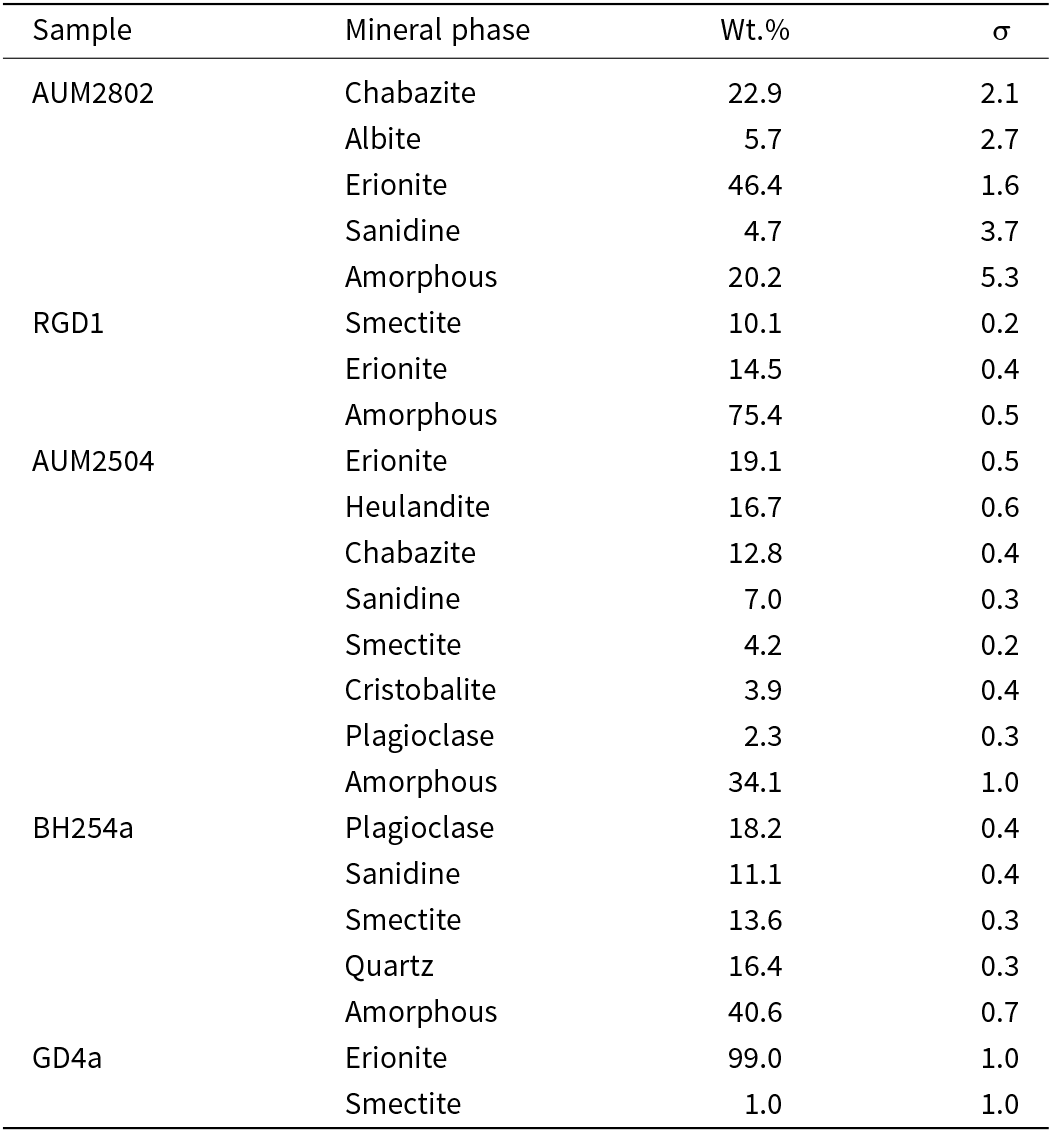

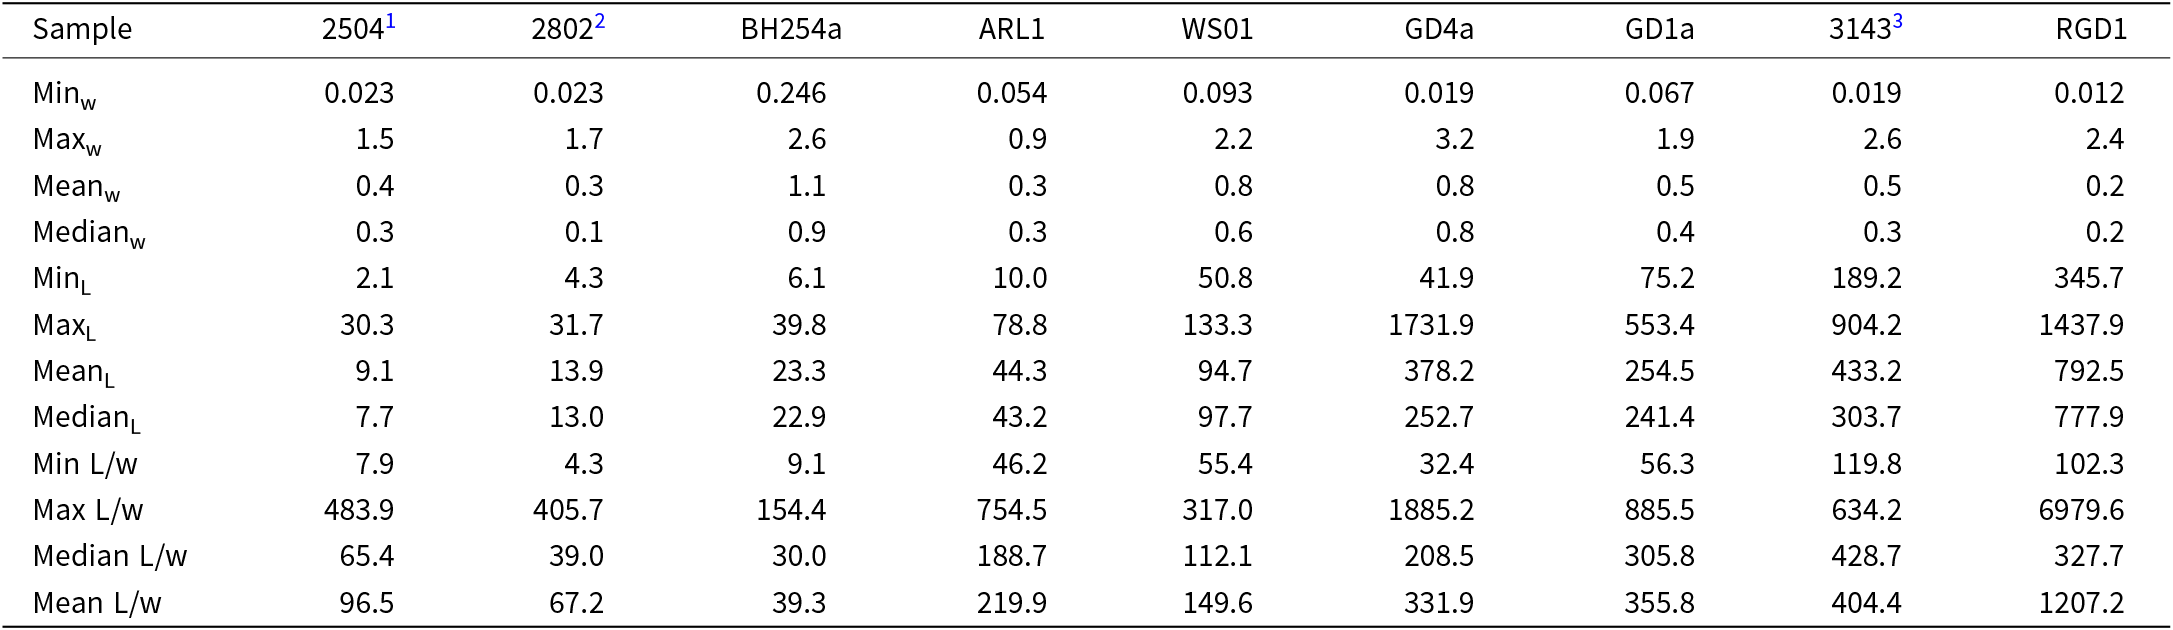

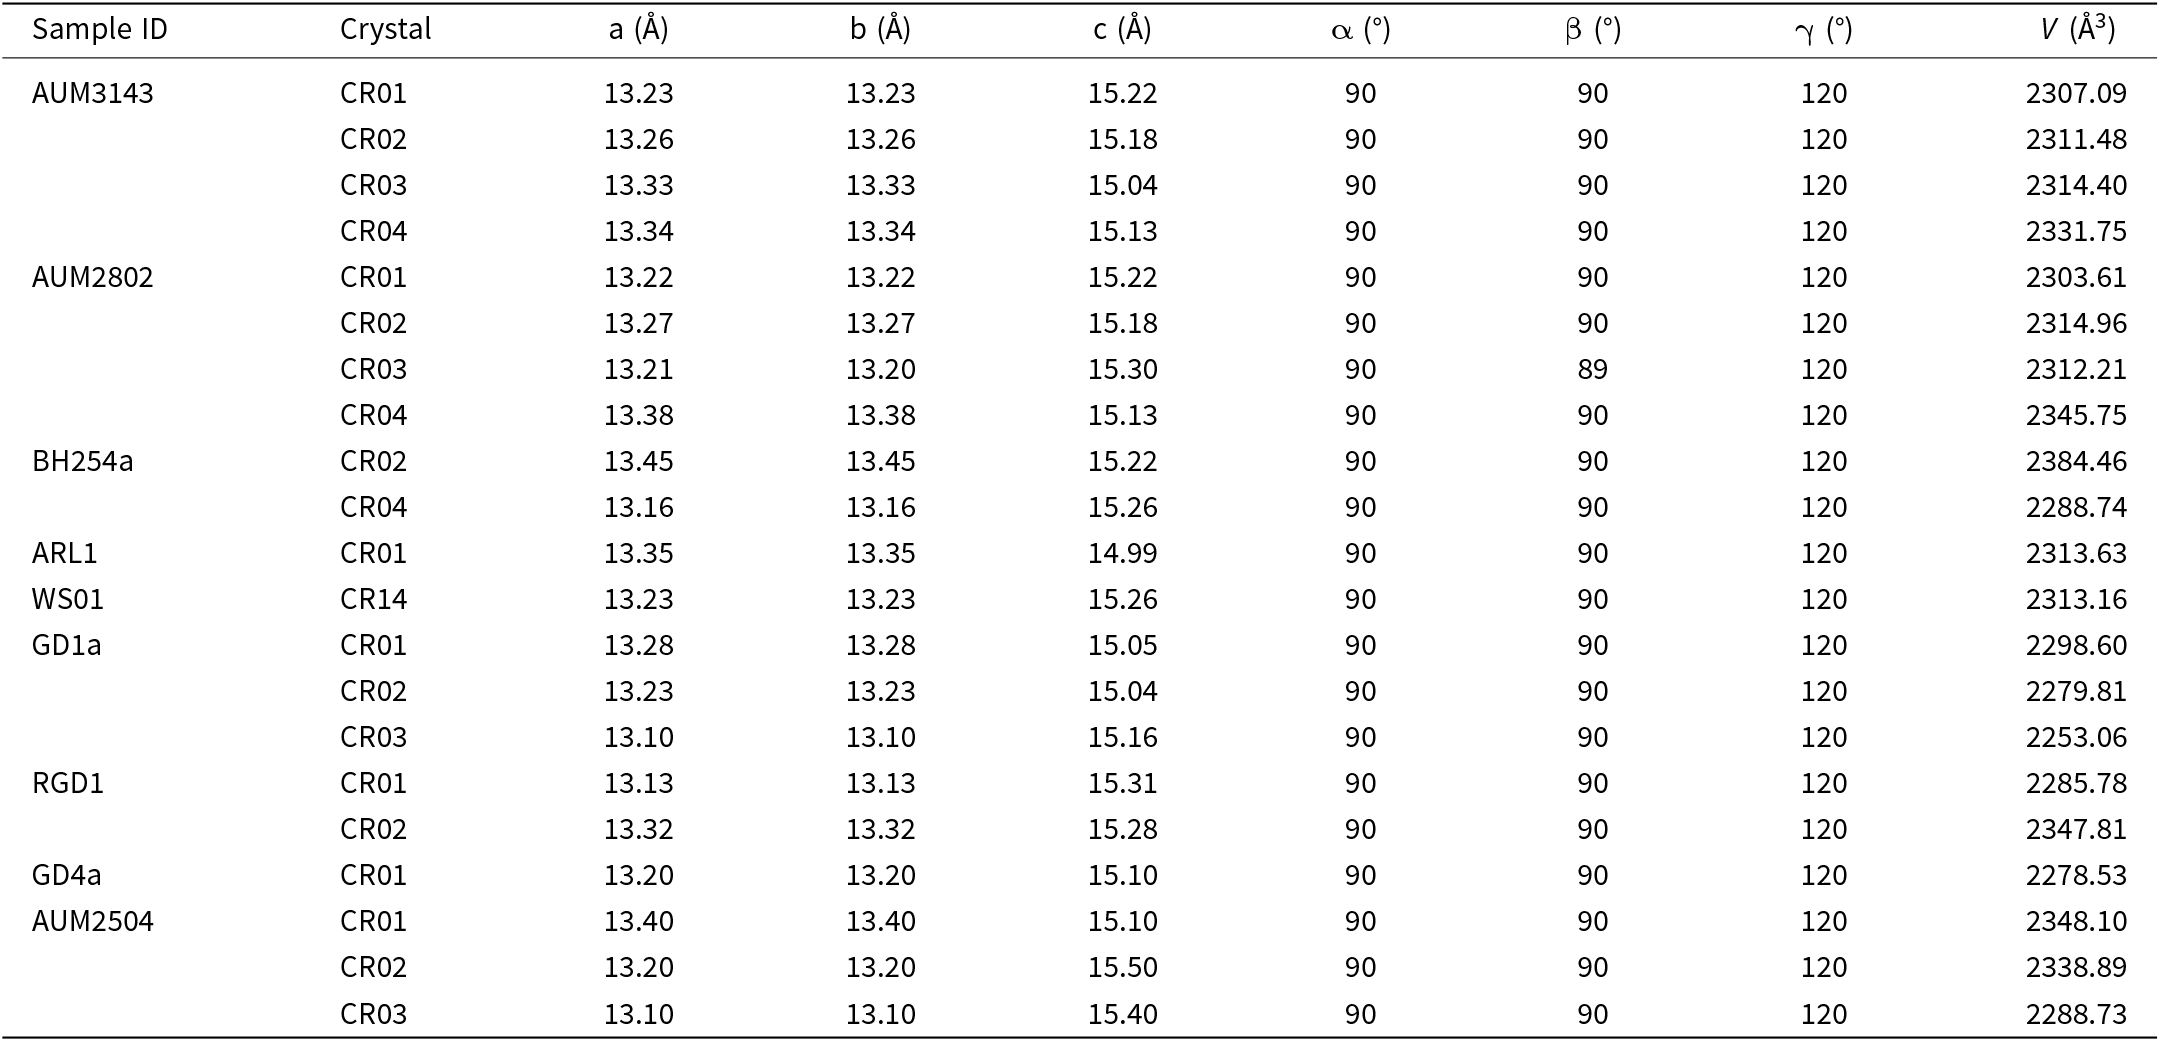


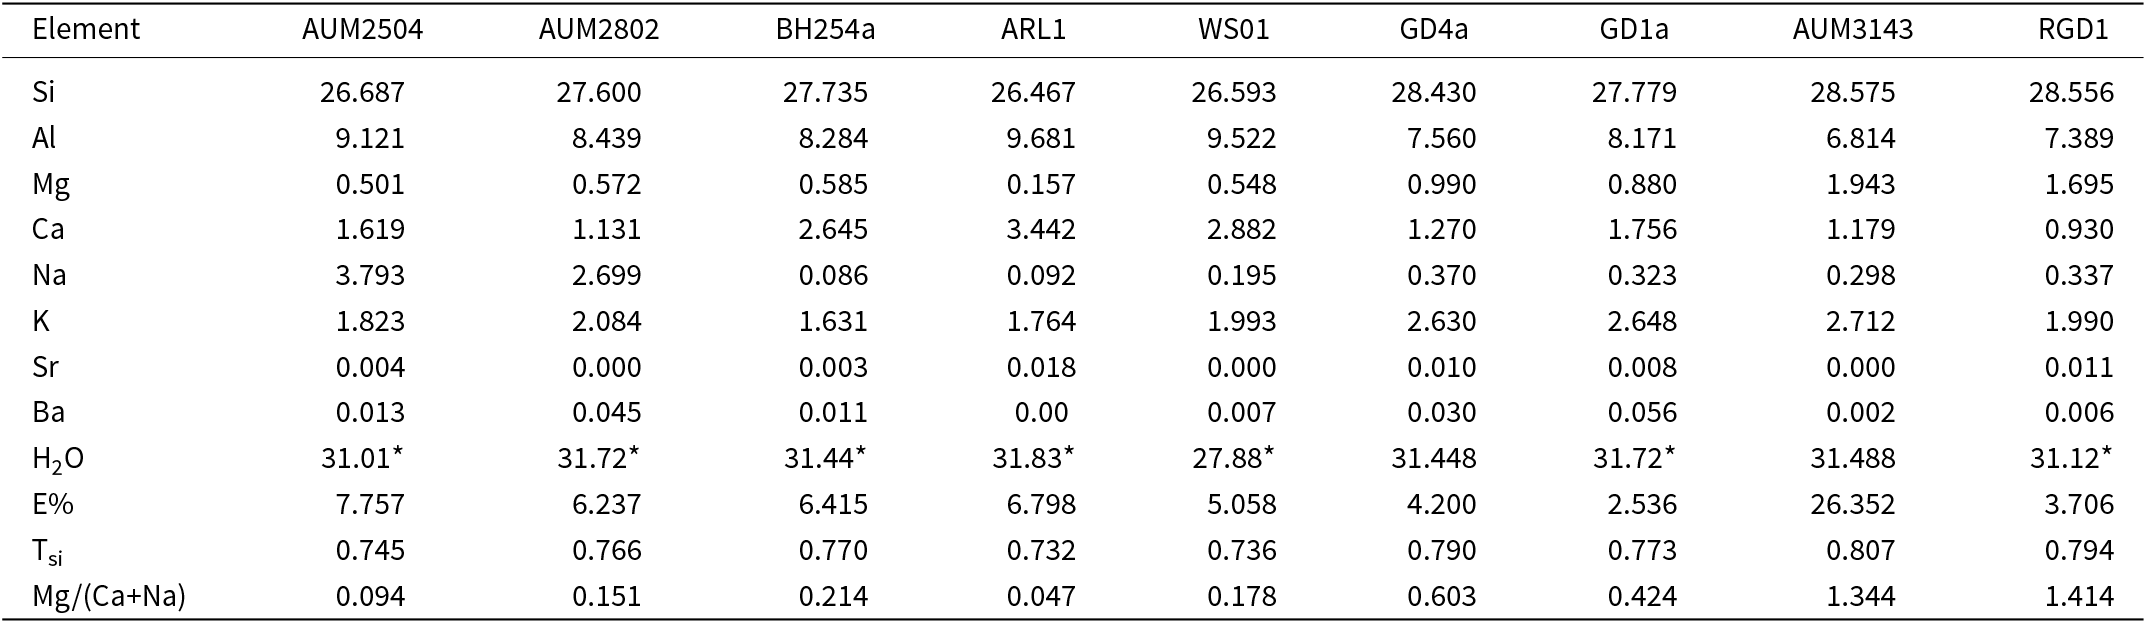
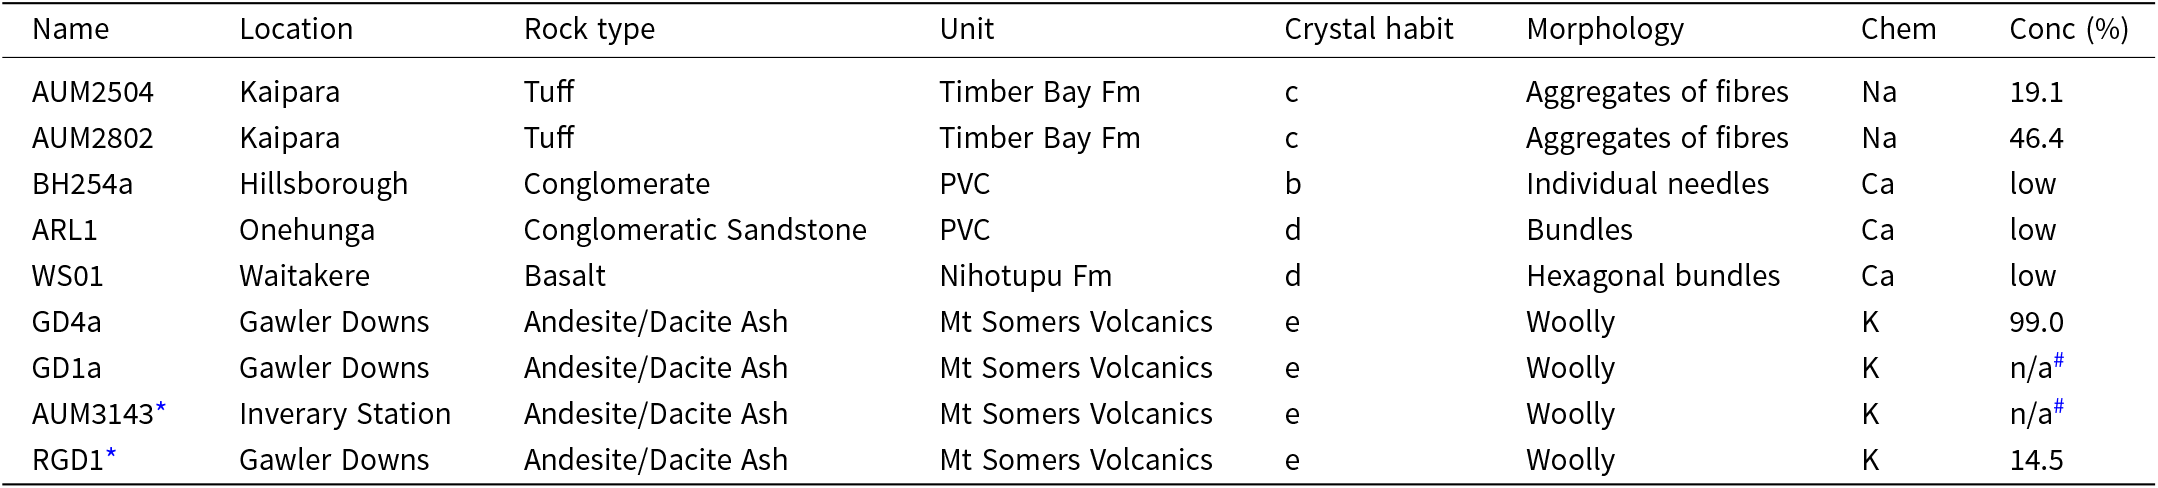


 Open access