

1. Introduction
The literature shows that standard heterogeneous agents models struggle to replicate the magnitude of the wealth inequality observed in the data. For example, the Gini coefficient of the wealth distribution generated in a baseline Aiyagari (Reference Aiyagari1994) model is only around 0.4, while the U.S. wealth Gini coefficient is close to 0.82 (see Díaz-Giménez et al. (Reference Díaz-Giménez, Glover and Ríos-Rull2011)). An important part of the puzzle is that the rich save more and spend less than predicted by standard models, and consequently accumulate a large amount of wealth. According to Alvaredo et al. (Reference Alvaredo, Atkinson, Piketty and Saez2013), the top 1% of households in the U.S. hold nearly one third of the total wealth and the top 5% holds over half, an order of magnitude larger than their counterparts generated in standard models.
Why is the wealth distribution so unequal? Why do rich people hold such a high amount of wealth? An important existing explanation offered in the literature is from De Nardi (Reference De Nardi2004), who emphasizes the role of bequests and intergenerational links. She finds that the rich are much more likely to leave bequests to their children compared to their poorer counterparts, even after accounting for the relative wealth between the two groups. Based on this finding, she created a model incorporating bequests into the utility function as a luxury good, and finds that this model is capable of accounting for the high concentration of wealth in the data, and that bequeathing behaviors are important in shaping the distribution of wealth. However, the De Nardi (Reference De Nardi2004) model assumes an identical fertility rate among the population, and thus abstracts from the fact that the poor tend to have more children than the rich, a dimension of heterogeneity we argue is relevant for understanding the wealth distribution. In this paper, we contribute to the literature by extending the De Nardi (Reference De Nardi2004) model to incorporate differential fertility choice among the population, and analyze the implication of differential fertility for the wealth distribution through its interaction with the bequest mechanism.
Economists have long argued that there exists an inverse relationship between income and fertility. For instance, Jones and Tertilt (Reference Jones and Tertilt2008) document a strong negative relationship between income and fertility choice for all cohorts of women born between 1826 and 1960 in the U.S. census data. They estimate an overall income elasticity of fertility of about −0.38. A recent literature in quantitative macroeconomics has argued that this negative relationship between income and fertility has important implications for some key macroeconomic phenomena such income inequality and growth.Footnote 1 In this paper, we explore its implication for the wealth distribution, and argue that this significant fertility difference between the poor and the rich can amplify the impact of bequests on wealth inequality, because not only do rich parents leave a greater amount of bequests than their poorer counterparts, but the children of rich parents have fewer siblings to share their bequests with relative to the children of poor parents.
To capture the interaction between differential fertility and bequests, and to assess its quantitative importance for understanding the wealth distribution, we develop a general equilibrium overlapping-generations (OLG) model with the “warm-glow” bequest motive (similar to that used in De Nardi (Reference De Nardi2004)) and differential fertility. Using a version of our model calibrated to the U.S. economy, we find that assuming away the fertility difference between the rich and the poor reduces the Gini coefficient of wealth from 0.78 to 0.74 in the model, with the result largely driven by the changes in the top wealth shares (i.e., $10\%$
,
$10\%$
, $5\%$
,
$5\%$
, $1\%$
). We also find that shutting down the fertility difference together with the bequest motive can reduce the wealth Gini further to 0.69. In addition, we find in our model that anticipated bequests crowd out life-cycle savings, which implies that intergenerational transfers can lead to less capital formation. In sum, this paper finds that pairing bequest motive with differential fertility is quantitatively important for explaining the saving behaviors of the rich and the consequent high level of wealth inequality.
$1\%$
). We also find that shutting down the fertility difference together with the bequest motive can reduce the wealth Gini further to 0.69. In addition, we find in our model that anticipated bequests crowd out life-cycle savings, which implies that intergenerational transfers can lead to less capital formation. In sum, this paper finds that pairing bequest motive with differential fertility is quantitatively important for explaining the saving behaviors of the rich and the consequent high level of wealth inequality.
1.1 Literature review
Ever since heterogeneous agent macroeconomic models have been introduced to the macroeconomics literature, numerous papers have used this class of models to explain the causes and mechanisms behind wealth inequality.Footnote 2 As surveyed by De Nardi (Reference De Nardi2015), there have been many variations of the heterogeneous agent model which introduce various mechanisms to better match the magnitude of wealth inequality observed in the data, such as preference heterogeneity, entrepreneurship, high earnings risk for the top earners, transmission of bequests across generations, and others.Footnote 3 Among these, our paper relates to the literature espousing bequest transmission across generations as a main mechanism behind wealth inequality.
The two papers in this literature closest to ours in spirit are De Nardi (Reference De Nardi2004) and Knowles (Reference Knowles1999). De Nardi (Reference De Nardi2004) uses a quantitative, general equilibrium, OLG model in which bequests and ability link parents and children. The element in which our papers differ is in our treatment of fertility. In De Nardi (Reference De Nardi2004), each agent has the same number of children. In our model agents have a different number of children depending on the income, impacting the results in interesting ways. Our model is also close in spirit to Knowles (Reference Knowles1999), who uses a two period model to show the importance of fertility to inequality. In his model, there is no retirement period, which means savings that occur in his model are solely for the purpose of bequests. In contrast, the agents in our model must save for their own retirement on top of bequests. Therefore, our model captures the dynamic interaction between life-cycle savings and anticipated bequests. We show this interaction is quantitatively important for understanding the wealth distribution. In addition, our model differs from Knowles (Reference Knowles1999) in terms of the choice of the bequest motive. While bequests are assumed to be motivated by altruism in the Knowles (Reference Knowles1999) model, we adopt the “warm-glow” bequest motive based on the empirical literature we will discuss below.
It is well-known in the literature that intergenerational transfers account for a large fraction of wealth accumulation.Footnote 4 However, the literature has been at odds as to how to model bequest motives, specifically whether bequests are motivated by altruism. Altonji et al. (Reference Altonji, Hayashi and Kotlikoff1992) found that the division of consumption and income within a family are codependent, indicating that perfect altruism does not apply to operative transfers. Other studies show that an increase in parental resources coupled with a decrease in child consumption does not lead to a corresponding increase in transfers (Altonji et al. (Reference Altonji, Hayashi and Kotlikoff1997) and Cox (Reference Cox1987)). Altonji et al. (Reference Altonji, Hayashi and Kotlikoff1997) find a one dollar transfer from child to parent results in only a 13 cent donation from parent to child, which should be the full dollar under perfect altruism. Wilhelm, Reference Wilhelm1996) finds that siblings generally receive equally divided inheritances, rather than the size of the inheritance being dependent on relative income as perfect altruism would predict.Footnote 5 Based on these empirical findings, multiple recent papers have assumed an alternative bequest motive: the warm-glow motive.Footnote 6 That is, parents derive utility from giving while not caring directly about the well-being of the recipient. In addition, motivated by the highly skewed distribution of bequests, these papers incorporate leaving bequests into the utility function as a luxury good, allowing for rich parents to value bequests relatively more. Following the tradition in these papers, we also adopt the “warm-glow” motive and assume bequests are a luxury good.
Our paper also relates to a growing number of papers that have shown that allowing for transfer of ability and human capital across generations is also an important element for understanding inequality. These studies include Kotlikoff and Summers (Reference Kotlikoff and Summers1981), Knowles (Reference Knowles1999), De Nardi (Reference De Nardi2004), De la Croix and Doepke (Reference De la Croix and Doepke2004), De Nardi and Yang (Reference De Nardi and Yang2016), Daruich and Kozlowski (Reference Daruich and Kozlowski2020) and others. Of special note, Lee, Roys, and Seshadri (Lee et al. 2024) find that parental education is positively related to their children’s earnings, thereby creating a virtuous cycle for the wealthiest and a vicious cycle for the poorest.
The rest of paper is organized as follows. In Section 2, we describe the model and its stationary equilibrium. In Section 3, we calibrate a benchmark model. In Section 4, we discuss the main quantitative results and conclude in Section 5.
2. The model environment
Consider an economy inhabited by OLG of agents who can live up to 14 periods, with one period corresponding to 5 years. Agents are endowed with 1 unit of time per period that can be divided between work and time spent raising a child. Population grows at an annual rate of $n$
%. There is a government that runs a pay-as-you-go social security system, the details of which are explained in the following section.
$n$
%. There is a government that runs a pay-as-you-go social security system, the details of which are explained in the following section.
2.1 Consumer’s problem
Agents begin their economic life at the age of 20, which corresponds to period $t=1$
in the model.Footnote
7
In the first 3 periods (
$t=1$
in the model.Footnote
7
In the first 3 periods ( $t={1,2,3}$
), agents are young adults in the labor market. At age 35 (
$t={1,2,3}$
), agents are young adults in the labor market. At age 35 ( $t=4$
), agents’ children are born in which the number of children
$t=4$
), agents’ children are born in which the number of children $N(\psi )$
is exogenously determined by agent’s permanent ability
$N(\psi )$
is exogenously determined by agent’s permanent ability $\psi$
such that we can account for the differential fertility across income groups.Footnote
8
By age 55 (
$\psi$
such that we can account for the differential fertility across income groups.Footnote
8
By age 55 ( $t=8$
), agents’ children have left home and agents’ parents have died. Working agents pay a payroll tax
$t=8$
), agents’ children have left home and agents’ parents have died. Working agents pay a payroll tax $\tau _s$
on their wage. These tax proceeds are used to finance social security payment
$\tau _s$
on their wage. These tax proceeds are used to finance social security payment $SS(\psi )$
to the retirees, which is an increasing function of their permanent ability. Retirement takes place at age 65 (
$SS(\psi )$
to the retirees, which is an increasing function of their permanent ability. Retirement takes place at age 65 ( $t=10$
) and each agent faces positive probability
$t=10$
) and each agent faces positive probability $p_t$
of surviving until they hit the maximum possible age of 90, after which they die for sure. This implies that from age 35 (
$p_t$
of surviving until they hit the maximum possible age of 90, after which they die for sure. This implies that from age 35 ( $t=4$
) until age 55 (
$t=4$
) until age 55 ( $t=8$
), agents face the possibility of receiving bequest from their parents, conditional on their parents having positive amount of wealth at the time of death. In the event that an agent is to receive bequest, the bequest amount will be evenly distributed among all the agent’s siblings. Figure 1 shows how different generations overlap with each other during the economically meaningful ages of 20 to 90.
$t=8$
), agents face the possibility of receiving bequest from their parents, conditional on their parents having positive amount of wealth at the time of death. In the event that an agent is to receive bequest, the bequest amount will be evenly distributed among all the agent’s siblings. Figure 1 shows how different generations overlap with each other during the economically meaningful ages of 20 to 90.
Period utility function takes the CRRA form, $u(c)=\frac{c^{1-\sigma }}{1-\sigma }$
, and
$u(c)=\frac{c^{1-\sigma }}{1-\sigma }$
, and $\beta$
is the discount factor for one period (equivalent to five years in real time). Labor productivity of agent at age
$\beta$
is the discount factor for one period (equivalent to five years in real time). Labor productivity of agent at age $t$
is given by
$t$
is given by $\psi \theta _t \lambda _t$
, in which
$\psi \theta _t \lambda _t$
, in which $\psi$
is the inherited permanent ability,
$\psi$
is the inherited permanent ability, $\theta _t$
is the deterministic life-cycle earnings profile, and
$\theta _t$
is the deterministic life-cycle earnings profile, and $\lambda _t$
is the stochastic shock. The shock
$\lambda _t$
is the stochastic shock. The shock $\lambda _t$
evolves according to the following simple AR(1) process:
$\lambda _t$
evolves according to the following simple AR(1) process:
 \begin{equation*} \log \left (\lambda _{t}\right ) = \upsilon \log \left (\lambda _{t-1}\right ) + \epsilon _{\lambda } \end{equation*}
where
 \begin{equation*}\epsilon _\lambda \sim N\left (0, \sigma ^2_{\lambda }\right ),\quad \text {i.i.d.}\end{equation*}
Sequence of events for current generation.

We assume that children inherit the permanent ability level $\psi$
from their parents according to an AR(1) process:
$\psi$
from their parents according to an AR(1) process:
 \begin{equation*} \log \left (\psi \right ) = \rho \log \left (\psi _p\right ) + \epsilon _{\psi } \end{equation*}
where
 \begin{equation*}\epsilon _\psi \sim N\left (0, \sigma ^2_{\psi }\right ),\quad \text {i.i.d.}\end{equation*}
in which $\psi _p$
is the parental ability and
$\psi _p$
is the parental ability and $\rho$
is the intergenerational persistence of productivity. We discretize the AR(1) process into an 11-state Markov chain using the Tauchen and Hussey (Reference Tauchen and Hussey1991) algorithm, and the corresponding transition matrix we obtain is denoted by
$\rho$
is the intergenerational persistence of productivity. We discretize the AR(1) process into an 11-state Markov chain using the Tauchen and Hussey (Reference Tauchen and Hussey1991) algorithm, and the corresponding transition matrix we obtain is denoted by $M\left [\psi, \psi ^{\prime}\right ]$
.
$M\left [\psi, \psi ^{\prime}\right ]$
.
Hence, the agent’s state variables are given by age ( $t$
), asset or wealth (
$t$
), asset or wealth ( $a$
), ability (
$a$
), ability ( $\psi$
), the productivity shock (
$\psi$
), the productivity shock ( $\lambda$
), and their parent’s state variables
$\lambda$
), and their parent’s state variables $S_p$
.Footnote
9
The reason why number of children is not one of the state variables for neither the current generation nor the parent generation is because the number of children would exogenously equal
$S_p$
.Footnote
9
The reason why number of children is not one of the state variables for neither the current generation nor the parent generation is because the number of children would exogenously equal $N\left (\psi \right )$
and the number of siblings (which is equivalent to the number of children the parent generation had) would exogenously be set to
$N\left (\psi \right )$
and the number of siblings (which is equivalent to the number of children the parent generation had) would exogenously be set to $N\left (\psi _p\right )$
.
$N\left (\psi _p\right )$
.
2.1.1 Age 20 to 30
These young workers do not have children yet and do not expect to receive any bequest from their parents. Hence, their value function is
 \begin{equation*} V\left (t, a, \psi, \lambda, S_p \right ) = \max _{c, a^{\prime}} \left \{u(c) + \beta \mathbb {E} \left [V\left (t+1, a^{\prime}, \psi, \lambda ^{\prime}, S^{\prime}_p\right )\right ] \right \} \end{equation*}
subject to
 \begin{align*} c+ a^{\prime} & \leq \psi \theta _t \lambda w (1-\tau _s)+ \left (1+r\right )a \\ a^{\prime} & \geq 0 \\ S^{\prime}_p & = g\left (S_p\right ) \end{align*}
We do not allow for any inter-vivos transfers and impose a strict non-negative borrowing constraint, which implies that the agents start the model at age 20 ( $t=1$
) with initial wealth of 0.
$t=1$
) with initial wealth of 0. $w$
is the equilibrium wage per unit of effective labor. Expectation for the continuation value of the Bellman equation is taken with respect to the productivity shocks
$w$
is the equilibrium wage per unit of effective labor. Expectation for the continuation value of the Bellman equation is taken with respect to the productivity shocks $\lambda ^{\prime}$
and
$\lambda ^{\prime}$
and $\lambda ^{\prime}_p$
, conditional on
$\lambda ^{\prime}_p$
, conditional on $\lambda$
and
$\lambda$
and $\lambda _p$
. The last equation is the law of motion for parent’s state variables, where
$\lambda _p$
. The last equation is the law of motion for parent’s state variables, where $g\left (\cdot \right )$
is the updating rule for parent’s state variables.
$g\left (\cdot \right )$
is the updating rule for parent’s state variables.
2.1.2 Age 35 to 50
Starting in age 35 ( $t=4$
), agents not only have children according to the exogenous fertility function
$t=4$
), agents not only have children according to the exogenous fertility function $N\left (\psi \right )$
, but they also face the possibility of receiving a bequest in the event that their parents die. Let
$N\left (\psi \right )$
, but they also face the possibility of receiving a bequest in the event that their parents die. Let $p_{t+7}$
denote the probability that the parent of an agent in period
$p_{t+7}$
denote the probability that the parent of an agent in period $t$
would survive to next period, since the parent’s age
$t$
would survive to next period, since the parent’s age $t_p$
will always equal
$t_p$
will always equal $t_p=t+7$
. In addition, let
$t_p=t+7$
. In addition, let $V^b\left (t, a, \psi, \lambda \right )$
be the value function of agents who received bequest and their parents are no longer around. Hence, the value function for agents in this age range whose parents were still alive at the beginning of the period would be
$V^b\left (t, a, \psi, \lambda \right )$
be the value function of agents who received bequest and their parents are no longer around. Hence, the value function for agents in this age range whose parents were still alive at the beginning of the period would be
 \begin{align*} V\left (t, a, \psi, \lambda, S_p \right ) = \max _{c, a^{\prime}} \Bigg \{ u(c) + & \beta p_{t+7}\mathbb{E} \left [V\left (t+1, a^{\prime}, \psi, \lambda ^{\prime}, S^{\prime}_p \right ) \right ] \\ + & \beta \left (1-p_{t+7}\right )\mathbb{E} \left [V^b\left (t+1, a^{\prime}+\frac{a^{\prime}_p}{N\left (\psi _p\right )}, \psi, \lambda ^{\prime}\right )\right ] \Bigg \} \end{align*}
subject to
 \begin{align*} c+ a^{\prime} & \leq \psi \theta _t \lambda w(1-\tau _s) \left (1-\gamma _c N\left (\psi \right )\right ) + \left (1+r\right )a \\ a^{\prime} & \geq 0 \\ S^{\prime}_p & = g\left (S_p\right ) \end{align*}
in which the continuation value of the Bellman equation accounts for the fact that there is $\left (1-p_{t+7}\right )$
probability that the parents die, in which case the agent receives whatever asset that the parent still had at the time of death divided by the number of siblings as the bequest.
$\left (1-p_{t+7}\right )$
probability that the parents die, in which case the agent receives whatever asset that the parent still had at the time of death divided by the number of siblings as the bequest.
In the budget constraint, $\gamma _c$
is the total cost per child per parent. Note that
$\gamma _c$
is the total cost per child per parent. Note that $\gamma _c=\gamma _t+\gamma _g$
. That is, the total childcare cost includes time cost,
$\gamma _c=\gamma _t+\gamma _g$
. That is, the total childcare cost includes time cost, $\gamma _t$
and goods cost,
$\gamma _t$
and goods cost, $\gamma _g$
. Thus,
$\gamma _g$
. Thus, $\left (1-\gamma _t N\left (\psi \right )\right )$
simply represents the total amount of time available to be allocated to labor. This implies that
$\left (1-\gamma _t N\left (\psi \right )\right )$
simply represents the total amount of time available to be allocated to labor. This implies that $\psi \theta _t \lambda \left (1-\gamma _t N\left (\psi \right )\right )$
is the total amount of effective labor supplied, with
$\psi \theta _t \lambda \left (1-\gamma _t N\left (\psi \right )\right )$
is the total amount of effective labor supplied, with $w$
measuring the equilibrium real wage per effective unit of labor. Note that because some child costs are in terms of time, the opportunity cost of raising a child is higher for parents with higher ability
$w$
measuring the equilibrium real wage per effective unit of labor. Note that because some child costs are in terms of time, the opportunity cost of raising a child is higher for parents with higher ability $\psi$
that tend to have higher labor earnings, as is expected and reflected in the data.
$\psi$
that tend to have higher labor earnings, as is expected and reflected in the data.
The value function for agents who already received bequest from their parents because they passed away would be
 \begin{align*} V^b\left (t, a, \psi, \lambda \right ) = \max _{c, a^{\prime}} \Bigg \{ u(c) + \beta \mathbb{E} \left [V^b\left (t+1, a^{\prime}, \psi, \lambda ^{\prime}\right )\right ] \Bigg \} \end{align*}
subject to
 \begin{align*} c+ a^{\prime} & \leq \psi \theta _t \lambda w(1-\tau _s) \left (1-\gamma _c N\left (\psi \right )\right ) + \left (1+r\right )a \\ a^{\prime} & \geq 0 \\ \end{align*}
2.1.3 Age 55 and 60
Age 55 ( $t=8$
) and 60 (
$t=8$
) and 60 ( $t=9$
) are when parents have passed away and children have left the nest, yet agents are still in labor force. Hence, their value function is the following:
$t=9$
) are when parents have passed away and children have left the nest, yet agents are still in labor force. Hence, their value function is the following:
 \begin{align*} V^b\left (t, a, \psi, \lambda \right ) = \max _{c, a^{\prime}} \Bigg \{ u(c) + \beta \mathbb{E} \left [V^b\left (t+1, a^{\prime}, \psi, \lambda ^{\prime}\right )\right ] \Bigg \} \end{align*}
subject to
 \begin{align*} c+ a^{\prime} & \leq \psi \theta _t \lambda w(1-\tau _s) + \left (1+r\right )a \\ a^{\prime} & \geq 0 \\ \end{align*}
2.1.4 Age 65 and above
Agents are now retired, so they no longer work and simply consume out of their savings and social security payments, $SS(\psi )$
, which is an increasing function of the agent’s permanent ability. The value function for agents in this age range would be
$SS(\psi )$
, which is an increasing function of the agent’s permanent ability. The value function for agents in this age range would be
 \begin{align*} V^b\left (t, a\right ) = \max _{c, a^{\prime}} \Bigg \{ u(c) + \beta p_t V^b\left (t+1, a^{\prime}\right ) + \beta \left (1-p_t\right )\phi _1 \left (1 + \frac{a^{\prime}}{\phi _2} \right )^{1-\sigma } \Bigg \} \end{align*}
subject to
 \begin{align*} c+ a^{\prime} & \leq \left (1+r\right )a+SS(\psi ) \\ a^{\prime} & \geq 0 \end{align*}
where $p_t$
is the probability of surviving to next period, which decreases with age and
$p_t$
is the probability of surviving to next period, which decreases with age and $p_{14}=0$
so that at age 85 (
$p_{14}=0$
so that at age 85 ( $t=14$
), the agent knows for sure that death awaits at age 90.
$t=14$
), the agent knows for sure that death awaits at age 90.
With $\left (1-p_t\right )$
probability, the agent does not make it alive to the next period, and leaves bequest to her children, from which the parents do receive utility. Here we follow De Nardi (Reference De Nardi2004) and assume that parents have “warm glow” motive, where they enjoy giving to their children but do not directly care about the children’s well-being; in addition, bequest is assumed to be a luxury good. As we reviewed in the introduction, this assumption is consistent with a sizable empirical evidence. The term
$\left (1-p_t\right )$
probability, the agent does not make it alive to the next period, and leaves bequest to her children, from which the parents do receive utility. Here we follow De Nardi (Reference De Nardi2004) and assume that parents have “warm glow” motive, where they enjoy giving to their children but do not directly care about the children’s well-being; in addition, bequest is assumed to be a luxury good. As we reviewed in the introduction, this assumption is consistent with a sizable empirical evidence. The term $\phi _1$
measures the relative weight placed on the bequest motive, while
$\phi _1$
measures the relative weight placed on the bequest motive, while $\phi _2$
measures the extent to which bequests are a luxury good.
$\phi _2$
measures the extent to which bequests are a luxury good.
2.2 Firm’s problem
Firms are identical and act competitively. Their production technology is Cobb–Douglas, which combines aggregate capital $K$
and aggregate labor
$K$
and aggregate labor $L$
to produce output
$L$
to produce output $Y$
as follows
$Y$
as follows
 \begin{equation*} Y = zK^\alpha L^{1-\alpha }, \end{equation*}
where $\alpha$
is the capital share and
$\alpha$
is the capital share and $z$
is the total factor productivity (TFP).
$z$
is the total factor productivity (TFP).
The profit-maximizing behaviors of firms imply that
 \begin{equation*} r = z\alpha K^{\alpha -1} L^{1-\alpha }-\delta \end{equation*}
and
 \begin{equation*} w = z({1-\alpha }) K^{\alpha } L^{-\alpha },\end{equation*}
where $\delta$
represents the capital depreciation rate.
$\delta$
represents the capital depreciation rate.
2.3 Stationary equilibrium
We look for a stationary equilibrium in which the factor prices $w$
and
$w$
and $r$
, and the age-wealth distribution are constant over time. Let
$r$
, and the age-wealth distribution are constant over time. Let $\Phi \left (t, a, \psi, \lambda, S_p\right )$
represent the population distributions of agents across the state variables. A stationary equilibrium (steady state) of this economy consists of the following:
$\Phi \left (t, a, \psi, \lambda, S_p\right )$
represent the population distributions of agents across the state variables. A stationary equilibrium (steady state) of this economy consists of the following:
-
1. Given prices $w$
and
$r$
, the value functions
$V\left (t, a, \psi, \lambda, S_p\right )$
and
$V^b\left (t, a, \psi, \lambda \right )$
are solutions to the utility maximization problem, and
$c\left (\cdot \right )$
and
$a^{\prime}\left (\cdot \right )$
are the associated optimal policy rules with respect to consumption this period and asset next period.
$w$
and
$r$
, the value functions
$V\left (t, a, \psi, \lambda, S_p\right )$
and
$V^b\left (t, a, \psi, \lambda \right )$
are solutions to the utility maximization problem, and
$c\left (\cdot \right )$
and
$a^{\prime}\left (\cdot \right )$
are the associated optimal policy rules with respect to consumption this period and asset next period. -
2. The prices
$w$
and
$r$
are equal to its marginal product such that
\begin{align*} r &= z\alpha K^{\alpha -1} L^{1-\alpha }-\delta \\ w &= z({1-\alpha }) K^{\alpha } L^{-\alpha } \end{align*}
-
3. All markets clear such that
\begin{align*} K^{\prime} =& \sum _{t=1}^{14} \int _{a} \int _{\psi }\int _{\lambda }\int _{S_p} a^{\prime}\left (t, a, \psi, \lambda, S_p\right )d\Phi \left (t, a, \psi, \lambda, S_p\right ) \\ L^{\prime} =& \sum _{t=1}^{3} \int _{a} \int _{\psi }\int _{\lambda }\int _{S_p} \psi \theta _t \lambda d\Phi \left (t, a, \psi, \lambda, S_p\right ) \\ &+\sum _{t=4}^{7} \int _{a} \int _{\psi }\int _{\lambda }\int _{S_p} \psi \theta _t \lambda \left (1-\gamma _t N\left (\psi \right )\right )d \Phi \left (t, a, \psi, \lambda, S_p\right ) \\ &+\sum _{t=8}^{9} \int _{a} \int _{\psi }\int _{\lambda }\int _{S_p} \psi \theta _t \lambda d\Phi \left (t, a, \psi, \lambda, S_p\right ) \end{align*}
-
4. Social security system is self-financing. That is, the following budget constraint holds:
\begin{align*} SS(\psi )\sum _{t=10}^{14}\int _{a}\int _{\psi } d \Phi (t,a,\psi ) =& \tau _s\sum _{t=1}^{3}\int _{a}\int _{\psi }\int _{\lambda }\int _{S_p}\psi \theta _t\lambda w d\Phi (t,a,\psi, \lambda, S_p) \\ &+ \tau _s\sum _{t=4}^{7}\int _{a}\int _{\psi }\int _{\lambda }\int _{S_p}\psi \theta _t\lambda w (1-\gamma _t N(\psi )) d \Phi (t,a,\psi, \lambda, S_p) \\ &+ \tau _s\sum _{t=8}^{9}\int _{a}\int _{\psi }\int _{\lambda }\int _{S_p}\psi \theta _t\lambda w d \Phi (t,a,\psi, \lambda, S_p) \end{align*}
-
5. The distribution
$\Phi$
is stationary over the state variables.


The rest of the paper focuses on stationary equilibrium analysis. Since analytical results are not obtainable, numerical methods are used to solve the model.
3. Calibration
We calibrate the model to match some of the key moments of the U.S. economy. The main parameter values and their sources are summarized in Table 1. As described in detail below, our calibration strategy consists of two stages: some of the standard parameter values are predetermined based on previous studies or independent estimates, while the rest are simultaneously chosen to match some recent key empirical moments in the U.S. economy. In the rest of the section, we first describe the details of our calibration, and then evaluate the model fit by reviewing the main properties of the calibrated model.
The benchmark calibration

3.1 Demographics
One period in our model is equivalent to 5 years in real time. Individuals begin making economic decisions when they are 20 years old, which is equivalent to $t=1$
in model age. They retire at 65 years old and die at age 90 for sure. The conditional survival probabilities
$t=1$
in model age. They retire at 65 years old and die at age 90 for sure. The conditional survival probabilities $p_t$
for retired agents are calibrated to the survival probabilities estimated from Bell et al. (Reference Bell, Wade and Goss1992). Annual population growth rate is assumed to be
$p_t$
for retired agents are calibrated to the survival probabilities estimated from Bell et al. (Reference Bell, Wade and Goss1992). Annual population growth rate is assumed to be $1.2$
%, consistent with the U.S. data (De Nardi (Reference De Nardi2004)).
$1.2$
%, consistent with the U.S. data (De Nardi (Reference De Nardi2004)).
3.2 Income process, permanent ability and fertility
We use the estimates from Hansen (Reference Hansen1993) for the calibration of $\theta _t$
, the deterministic age profile of labor productivity. As for the stochastic income shock
$\theta _t$
, the deterministic age profile of labor productivity. As for the stochastic income shock $\lambda$
, we approximate the distribution by a 3-state Markov chain using the Rouwenhorst, Reference Rouwenhorst1995) algorithm, with the values of persistence
$\lambda$
, we approximate the distribution by a 3-state Markov chain using the Rouwenhorst, Reference Rouwenhorst1995) algorithm, with the values of persistence $\upsilon$
set to 0.985 and variance
$\upsilon$
set to 0.985 and variance $\sigma ^2_\lambda$
set to 0.022 following the estimates in Storesletten et al. (Reference Storesletten, Telmer and Yaron2004).Footnote
10
$\sigma ^2_\lambda$
set to 0.022 following the estimates in Storesletten et al. (Reference Storesletten, Telmer and Yaron2004).Footnote
10
Since the value of the intergenerational persistence parameter of the the AR(1) process for parental ability, $\rho$
, is less than 0.9, we use the the Tauchen and Hussey (Reference Tauchen and Hussey1991) method to discretize it into 11 states .Footnote
11
We set its value to
$\rho$
, is less than 0.9, we use the the Tauchen and Hussey (Reference Tauchen and Hussey1991) method to discretize it into 11 states .Footnote
11
We set its value to $0.677$
based on Zimmerman, Reference Zimmerman1992). The variance of shock to permanent ability,
$0.677$
based on Zimmerman, Reference Zimmerman1992). The variance of shock to permanent ability, $\sigma ^2_\psi$
, is chosen to match the earnings distribution. This leads to
$\sigma ^2_\psi$
, is chosen to match the earnings distribution. This leads to $\sigma ^2_\psi$
value of
$\sigma ^2_\psi$
value of $0.36$
. In addition, to match the wealth shares at the very top of the distribution, we scale up the top three grid points of ability distribution. The resulting values for each state of permanent ability and the corresponding transition matrix are reported in Table 2.Footnote
12
$0.36$
. In addition, to match the wealth shares at the very top of the distribution, we scale up the top three grid points of ability distribution. The resulting values for each state of permanent ability and the corresponding transition matrix are reported in Table 2.Footnote
12
Permanent ability and its transition matrix

Data source: Krueger et al. (Reference Krueger, Mitman and Perri2016)
In the benchmark calibration, we follow the approach in Jones and Tertilt (Reference Jones and Tertilt2008) and use the “Children Ever Born” to a woman as the fertility measure. To properly capture the negative income-fertility relationship, we assume that $N\left (\psi _p\right )$
takes the form,
$N\left (\psi _p\right )$
takes the form, $N\left (\psi _p\right )=\gamma _1\psi _p^{\gamma _2}$
, with
$N\left (\psi _p\right )=\gamma _1\psi _p^{\gamma _2}$
, with $\gamma _1\gt 0$
and
$\gamma _1\gt 0$
and $\gamma _2\lt 0$
. Note that the value of
$\gamma _2\lt 0$
. Note that the value of $\gamma _2$
is exactly equivalent to the income elasticity of fertility, and thus we set it to −0.20 based on the estimate of Jones and Tertilt (Reference Jones and Tertilt2008). The value of
$\gamma _2$
is exactly equivalent to the income elasticity of fertility, and thus we set it to −0.20 based on the estimate of Jones and Tertilt (Reference Jones and Tertilt2008). The value of $\gamma _1$
is then chosen so that the model implied average fertility is equal to the replacement rate, that is, 1 child per parent. The time cost of children,
$\gamma _1$
is then chosen so that the model implied average fertility is equal to the replacement rate, that is, 1 child per parent. The time cost of children, $\gamma _t$
, is assumed to be 15% of parental time per child based on the empirical estimates of Haveman and Wolfe (Reference Haveman and Wolfe1995). The goods cost of children,
$\gamma _t$
, is assumed to be 15% of parental time per child based on the empirical estimates of Haveman and Wolfe (Reference Haveman and Wolfe1995). The goods cost of children, $\gamma _g$
, is taken from Sommer (Reference Sommer2016), which estimates it to be 20% of the earnings per parent. Therefore, the overall cost of children,
$\gamma _g$
, is taken from Sommer (Reference Sommer2016), which estimates it to be 20% of the earnings per parent. Therefore, the overall cost of children, $\gamma _c$
, in our model is 35% of the earnings of each parent.
$\gamma _c$
, in our model is 35% of the earnings of each parent.
3.3 Preference and technology
The subjective discount factor $\beta$
is calibrated to a value of 0.9489 to generate an annual interest rate of 6%, as in De Nardi (Reference De Nardi2004). The risk aversion parameter,
$\beta$
is calibrated to a value of 0.9489 to generate an annual interest rate of 6%, as in De Nardi (Reference De Nardi2004). The risk aversion parameter, $\sigma$
, is set to 2, a standard value used in the existing macro literature. The bequest motive parameters
$\sigma$
, is set to 2, a standard value used in the existing macro literature. The bequest motive parameters $\phi _1$
and
$\phi _1$
and $\phi _2$
are jointly calibrated to match two moments: (1) the bequest to GDP ratio, and (2) the ratio of average bequest at the bottom 30% of the distribution to average bequest of the population. The value of
$\phi _2$
are jointly calibrated to match two moments: (1) the bequest to GDP ratio, and (2) the ratio of average bequest at the bottom 30% of the distribution to average bequest of the population. The value of $\phi _1$
controls the intensity of bequest motive, with a higher value showing higher intensity. A positive value of
$\phi _1$
controls the intensity of bequest motive, with a higher value showing higher intensity. A positive value of $\phi _2$
implies that bequests are luxury goods. Wang (Reference Wang2016) estimates that between 1996 and 2012, the bequest to GDP ratio in the United States ranged between 2.4% and 4.7%. We calibrate the value of
$\phi _2$
implies that bequests are luxury goods. Wang (Reference Wang2016) estimates that between 1996 and 2012, the bequest to GDP ratio in the United States ranged between 2.4% and 4.7%. We calibrate the value of $\phi _1$
to generate a bequest to GDP ratio of 4.04%, within the range of empirical estimates provided in Wang (Reference Wang2016).Footnote
13
The resulting value for
$\phi _1$
to generate a bequest to GDP ratio of 4.04%, within the range of empirical estimates provided in Wang (Reference Wang2016).Footnote
13
The resulting value for $\phi _1$
is
$\phi _1$
is $-18.1$
. According to Hurd and Smith (Reference Hurd and Smith1999), the ratio of average bequest at the bottom 30% of the distribution to the average bequests is approximately 0.11, which is used as the target moment to calibrate
$-18.1$
. According to Hurd and Smith (Reference Hurd and Smith1999), the ratio of average bequest at the bottom 30% of the distribution to the average bequests is approximately 0.11, which is used as the target moment to calibrate $\phi _2$
. With
$\phi _2$
. With $\phi _2$
value of
$\phi _2$
value of $12.1$
the model generated counterpart to this moment is 0.12.
$12.1$
the model generated counterpart to this moment is 0.12.
The capital share $\alpha$
is set to 0.36, a value widely used in the macro literature. The annual capital depreciation rate
$\alpha$
is set to 0.36, a value widely used in the macro literature. The annual capital depreciation rate $\delta$
is set to 6% to generate capital-output ratio of 2.98, which is close to its data counterpart, 3. The value of TFP parameter,
$\delta$
is set to 6% to generate capital-output ratio of 2.98, which is close to its data counterpart, 3. The value of TFP parameter, $z$
, is normalized to one.
$z$
, is normalized to one.
3.4 Government
The U.S. social security program is financed by a payroll tax rate of 12.4%, and thus we set $\tau _s=0.124$
. Social security payment
$\tau _s=0.124$
. Social security payment $SS(\psi )$
is a non-linear function of individuals’ permanent ability, and it is set to mimic the actual rules of the U.S. social security program. Specifically, we use the social security benefit formula
$SS(\psi )$
is a non-linear function of individuals’ permanent ability, and it is set to mimic the actual rules of the U.S. social security program. Specifically, we use the social security benefit formula
 \begin{equation*} \widetilde {SS}\left (\psi \right )=\begin {cases} 0.9 \overline {e}(\psi ), & \bar {e}(\psi )\le 0.2\bar {e}_{a},\\ 0.18\bar {e}_{a}+0.33\left (\bar {e}(\psi )-0.2\bar {e}_{a}\right ), & 0.2\bar {e}_{a}\lt \bar {e}(\psi )\le 1.25\bar {e}_{a}\\ 0.5265\bar {e}_{a}+0.12\left (\bar {e}(\psi )-1.25\bar {e}_{a}\right ), & 1.25\bar {e}_{a}\lt \bar {e}(\psi ), \end {cases}, \end{equation*}
where $\bar{e}_{a}$
is the average earnings in the economy, and
$\bar{e}_{a}$
is the average earnings in the economy, and $\bar{e}(\psi )$
is the average earnings of individuals with permanent ability
$\bar{e}(\psi )$
is the average earnings of individuals with permanent ability $\psi$
.Footnote
14
We rescale the social security payments so that the social security program is self-financing at the steady state.
$\psi$
.Footnote
14
We rescale the social security payments so that the social security program is self-financing at the steady state.
3.5 Properties of the benchmark model
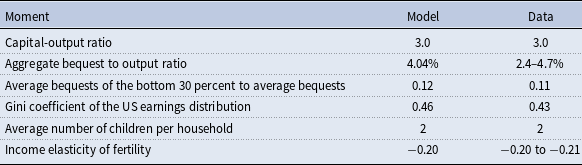
Table 3 contains some key statistics of the benchmark economy together with their data counterparts. As can be seen, our calibrated benchmark model matches the key empirical moments from the US economy fairly well. The model also matches the earnings distribution well (Table 4), although it generates slightly higher gini coefficient of earnings.
Benchmark model statistics vs data moments
Earnings distribution: benchmark economy vs data

Data source: Díaz-Giménez et al. (Reference Díaz-Giménez, Glover and Ríos-Rull2011)
The wealth distribution generated by our benchmark model is reported in Table 5. Overall, our model does a fairly accurate job of matching the actual distribution of wealth in the U.S, especially towards the very top. In the data, those at the bottom 60% of the wealth distribution only hold 5% of total wealth. The model generated share of the bottom 60% is 7%. The richest 20% in the US hold 83% of wealth. The model counterpart of this share is 80%. In addition, the calibrated benchmark economy generates the wealth shares held by the top 1%, 5%, and 10% that are close to the data. The Gini coefficient of wealth generated in the model is 0.78, reasonably close to its data counterpart.Footnote 15
Wealth distribution: benchmark economy vs data

Data source: Díaz-Giménez et al. (Reference Díaz-Giménez, Glover and Ríos-Rull2011)
Figure 2 displays the number of children per household across the wealth distribution in the model together with the data counterparts. In the benchmark model, the average number of children is 2.5 among the households in the 1st wealth quintile. This number declines as wealth increases, and the households in the 5th wealth quintile have 1.6 number of children on average. As shown in the same figure, the fertility rate-wealth relationship in the model matches the data counterparts reasonably well.Footnote 16
Fertility rate by wealth quintile: model vs data. Data source: 2014 HRS data. The fertility rates from the data sample are scaled so that the median value matches the model.

4. Decomposing factors contributing to wealth inequality
To understand the role of differential fertility and bequests in shaping the U.S. wealth inequality, we conduct three counter-factual computational exercises. In the first counter-factual exercise, we impose identical fertility across all income (ability) groups to show the effects of differential fertility on the distribution of wealth. In the second counter-factual exercise, we shut down the bequest motive to highlight the impact of bequests on wealth inequality. In the third experiment, we shut both the channels to see their combined impact on wealth inequality.
From these counter-factual exercises, two things become clear. We find that bequests contribute to the level of wealth inequality, and fertility differences between the rich and the poor amplify this effect, especially for the far right tail of the wealth distribution. Therefore, the interaction between differential fertility and bequests is quantitatively important for fully understanding wealth inequality in the US.
4.1 Counter-factual exercise I: identical fertility
To highlight the important role of how the fertility differences across the income groups amplify the impact of bequests on wealth inequality, we consider a counter-factual exercise in which fertility is assumed to be identical across the income distribution. That is, we force everyone in the model to have the same fertility choice, 1 child per parent, and re-run the model using exactly the same parameter values as in the benchmark model.
The main results from this counter-factual exercise are reported in Table 6 (in the third row). We see that overall wealth inequality, measured by Gini coefficient, declines from 0.78 in the benchmark model to 0.74 in the identical fertility experiment (approximately an 5% decline), signaling that differential fertility increases wealth inequality. Recall that the interaction between fertility and bequest motive is a key mechanism in our model. Since more bequests are left by the very rich in the US, one would expect that the impact of differential fertility on wealth inequality could be concentrated toward the top end of the distribution. This is precisely what we find through this experiment. Observe in Table 6 that, with identical fertility, the wealth share of top 1% declines from 28% to 24% and that of the top 10% declines from 66% to 60%, while the wealth share of the bottom 60% increases from 7% to 9%.
Wealth distribution: benchmark vs counter-factual exercises

The fundamental reason why the very rich hold less wealth at the steady state in this counter-factual exercise is that the artificial increase in fertility in the counter-factual experiment forces the very rich to share their parent’s wealth with significantly greater number of siblings. An important mechanism that contributes to wealth inequality in our benchmark model is that rich parents leave much bigger bequest compared to their poorer counterparts, but on top of that, the children of those rich parents also have less siblings to share that bequest with. In other words, children from rich households not only have a bigger pie to share, they have less siblings to share it with. Imposing counter-factual identical fertility to our model shuts down that channel, and we observe that has a quantitatively important impact, especially on the top 1%.
4.2 Counter-factual exercise II: no bequests
To highlight the role of bequests on wealth inequality, we now consider another counter-factual exercise in which we remove the bequest motive completely. That is, everything else is same as in the benchmark model except that the bequest motive is absent in this experiment. This allows us to parse out the effects of fertility and bequests. Specifically, we set $\phi _1$
equal to zero. Results from this counter-factual exercise are shown in the fifth row of Table 6. As can be seen, the bequest motive plays an important role in generating wealth inequality. When bequest motive is removed, the Gini coefficient declines further, dropping to 0.70 from 0.78 in the benchmark model. Consistent with the existing findings in the literature, the impact of bequests is larger towards the very top of the wealth distribution. The wealth share of the top 1% declines from 28% to 16% and that of the top 10% declines from 66% to 54%, while the wealth share of the bottom 60% increases from 7% to 11%. The reason why we see larger impact towards the top is that bequests are luxury goods in our model and thus the rich leave proportionally more bequests than the poor.
$\phi _1$
equal to zero. Results from this counter-factual exercise are shown in the fifth row of Table 6. As can be seen, the bequest motive plays an important role in generating wealth inequality. When bequest motive is removed, the Gini coefficient declines further, dropping to 0.70 from 0.78 in the benchmark model. Consistent with the existing findings in the literature, the impact of bequests is larger towards the very top of the wealth distribution. The wealth share of the top 1% declines from 28% to 16% and that of the top 10% declines from 66% to 54%, while the wealth share of the bottom 60% increases from 7% to 11%. The reason why we see larger impact towards the top is that bequests are luxury goods in our model and thus the rich leave proportionally more bequests than the poor.
4.3 Counter-factual exercise III: identical fertility and no bequests
We run another experiment in which we shut the differential fertility channel and bequest channel simultaneously. This allows us to examine the combined impact of the two channels in shaping wealth inequality. The sixth row of Table 6 presents the results, which show that when both the channels are shut, wealth inequality declines even further driven by a significant decline in the wealth share of the very rich. The Gini coefficient of wealth declines from 0.78 in the benchmark model to 0.69. The wealth share of the top 1% declines from 28% to 15% and that of the top 5% declines from 52% to 37%, while the wealth share of the bottom 60% increases from 7% to 11%. This experiment shows that the interaction between fertility and bequests is an important factor in explaining wealth concentration towards the top of the distribution in the US.
4.4 The role of children cost and accidental bequests
In our model, differential fertility affects wealth inequlity in two ways. First, it affects how much bequests children receive. Second, the number of children affects total children cost parents incur. We showed in the first counter-factual experiment that the former is an important factor. To assess the role of the latter, we run a counter-factual experiment in which we assign all parents the same childcare cost irrespective of the number of children they have. That is, everything else is same as in the benchmark model except that each parent now incurs the average childcare cost, independent of the number of children they have. This allows the children to continue splitting the bequests as in the benchmark model, but both rich and poor parents incur the same total children cost. As the last two of Table 6 shows, doing so reduces Gini coefficient from 0.78 in the benchmark model to 0.76 and the wealth share of top 1% from 28% to 26%. The wealth share of top 5% drops from 52% in the benchmark model to 49% in this experiment. This experiment shows that children cost is a reason why differential fertility explains wealth inequality in the US.
Since premature death is allowed in the model, some of the bequests are accidental. Even if the bequest motive is removed as in the counter-factual exercise II, accidental bequests could still affect wealth inequality. To assess the impact of this channel, we run a counter-factual experiment in which we remove bequest motive and equally distribute the accidental bequests to all alive population as a lump-sum payment. Doing so prevents the children of rich parents from inheriting larger accidental bequests than the children of the poorer parents. In the sixth row of Table 6, we see that the results are not much different from the results of the fourth row (“No Bequests” row), in which only bequest motive is removed from the benchmark model. Thus, this experiment shows that accidental bequests do not significantly change our results. On the other hand, if accidental bequests are distributed as lump-sum payment to newborns the wealth inequality declines further.
5. Conclusion
This paper contributes to the literature on the causes of wealth inequality by studying the impact from savings, intergenerational transfers, and fertility differences between the rich and the poor on the wealth distribution. Our results show that bequests increase the level of wealth inequality and that fertility differences between the rich and the poor amplify this relationship. Overall, we find that incorporating differential fertility significantly improves the model’s capability of matching wealth inequality in the US economy. In addition, we find that properly modeling the bequest motive and the bequest distribution is important for capturing the amplifying role of differential fertility.
We conclude the paper by drawing attention to a few potentially important issues from which this paper has abstracted. For instance, we have abstracted from means-tested social insurance programs as well as medical expenses, which can be relevant for saving and wealth accumulation decisions, especially for the relatively poor. In addition, we do not model the human capital investment in children, and thus do not capture the well-known quality-quantity tradeoff of children facing parents. We leave them for future research.
Acknowledgements
We would like to thank Francis Ahking, Mariacristina De Nardi, Dirk Krueger, Oliver Morand, Kanda Naknoi, Steve Ross, Fang Yang, and participants at the UConn Macro Seminar and the 2017 Spring Midwest Macro Meeting (LSU) for their valuable comments.
Disclaimer
The views represented are those of the author and not necessarily those of the United States Department of the Treasury or the United States Government.


 Open access