


Fuel subsidies have been an enduring but controversial policy in the political and economic history of Ecuador since its return to democracy. After the enactment of this policy in the mid-1970s, a time of economic expansion driven by an increase in oil revenues (Acosta Reference Acosta2001), several governments faced difficulties when making attempts at reform during the 1980s and 1990s. Indeed, most of them failed or even led to governance crises due to the loss of popular support (Carrillo-Maldonado, Díaz-Cassou, and Tejeda Reference Carrillo-Maldonado, Díaz-Cassou and Tejeda2018), which resulted in political leaders being reluctant to launch new reforms between 2000 and 2016 (Schaffitzel et al. Reference Schaffitzel, Michael Jakob, Vogt-Schilb and Ward2020). Consequently, as seen in other emerging economies, fuel subsidies became an important issue for Ecuador’s public finances (Ríos-Roca, Garrón, and Cisneros 2007; Mendoza, Reference Mendoza2014; Marchán, Espinasa, and Yépez-García Reference Marchán, Espinasa and Yépez-García2017).
However, as a response to the fiscal repercussions of the oil shock that the Ecuadorian economy suffered in 2015–2016, the government released tax and expenditure amends after 2017 (Camino-Mogro Reference Camino-Mogro2022). Despite fuel subsidies’ historically limited room for reform, two changes were made in 2018: a 40% reduction in subsidies for low-octane gasoline and the complete removal of those for the high-octane variety. Later, in October 2019, the government announced the liberalization of low-octane gasoline and diesel prices (hikes of 29% for low-octane gasoline and 131% for diesel), which was probably one of the riskiest moves made by a government in Ecuador’s recent decades (Ponce et al. Reference Ponce, Vasquez, Vivanco and Munck2022). This reform yielded a series of riots that motivated the government to concede by reinstating fuel subsidies and calling on policymakers to study new targeting mechanisms.
Since then, targeting diesel and gasoline subsidies has remained a pending and legal obligation for the Ecuadorian government. So far, four more changes have been launched in 2020–2022, but even if those reforms reduced fiscal pressures, fuel subsidies’ structural problems such as those identified by Jara and colleagues (Reference Jara, Chun Lee, Montesdeoca and Varela2018)—their regressive effect on income distribution and the trade-off with education, health, and public investment—continue to be unresolved matters. In fact, the most recent reform was declined after a new eighteen-day period of social unrest. Thus, policymakers do require an estimation of the effects of a targeting reform to fuel subsidies before conducting a reform that can fulfill the obligations acquired in October 2019.
To that end, and unlike most recent literature in Ecuador, this work uses a computable general equilibrium model to measure the macroeconomic effects of targeting alternatives for gasoline and diesel subsidies. The model is based on a small open economy with homogeneous production and perfect competition. It uses data from a social accounting matrix comprising twenty-one economic activities and five representative households. The model assumes rational economic agents according to the neoclassical microeconomic theory but also explores some short-run Keynesian macro closures to resemble the Ecuadorian economy more closely.
Literature review
Several international studies assess the impact of subsidy reforms on the economy. This literature can be classified into two groups: ex post and ex ante evaluations. Research conducted by Arze del Granado, Coady, and Gillingham (Reference Arze del Granado, Coady and Gillingham2010), Davis (Reference Davis2013), Andadari, Mulder, and Rietvield (Reference Andadari, Mulder and Rietvield2014), Coady, Flamini, and Sears (Reference Coady, Flamini and Sears2015), Ferraresi, Kotsogiannis, and Rizzo (Reference Ferraresi, Kotsogiannis and Rizzo2018) are some of the most relevant examples of ex post evaluations for developing economies. Nonetheless, the strength of these studies is qualitative, given the unavailability of enough data to undertake robust empirical assessments. Ex ante studies have focused their efforts on quantitative evaluation using mainly general equilibrium techniques as the global standard.
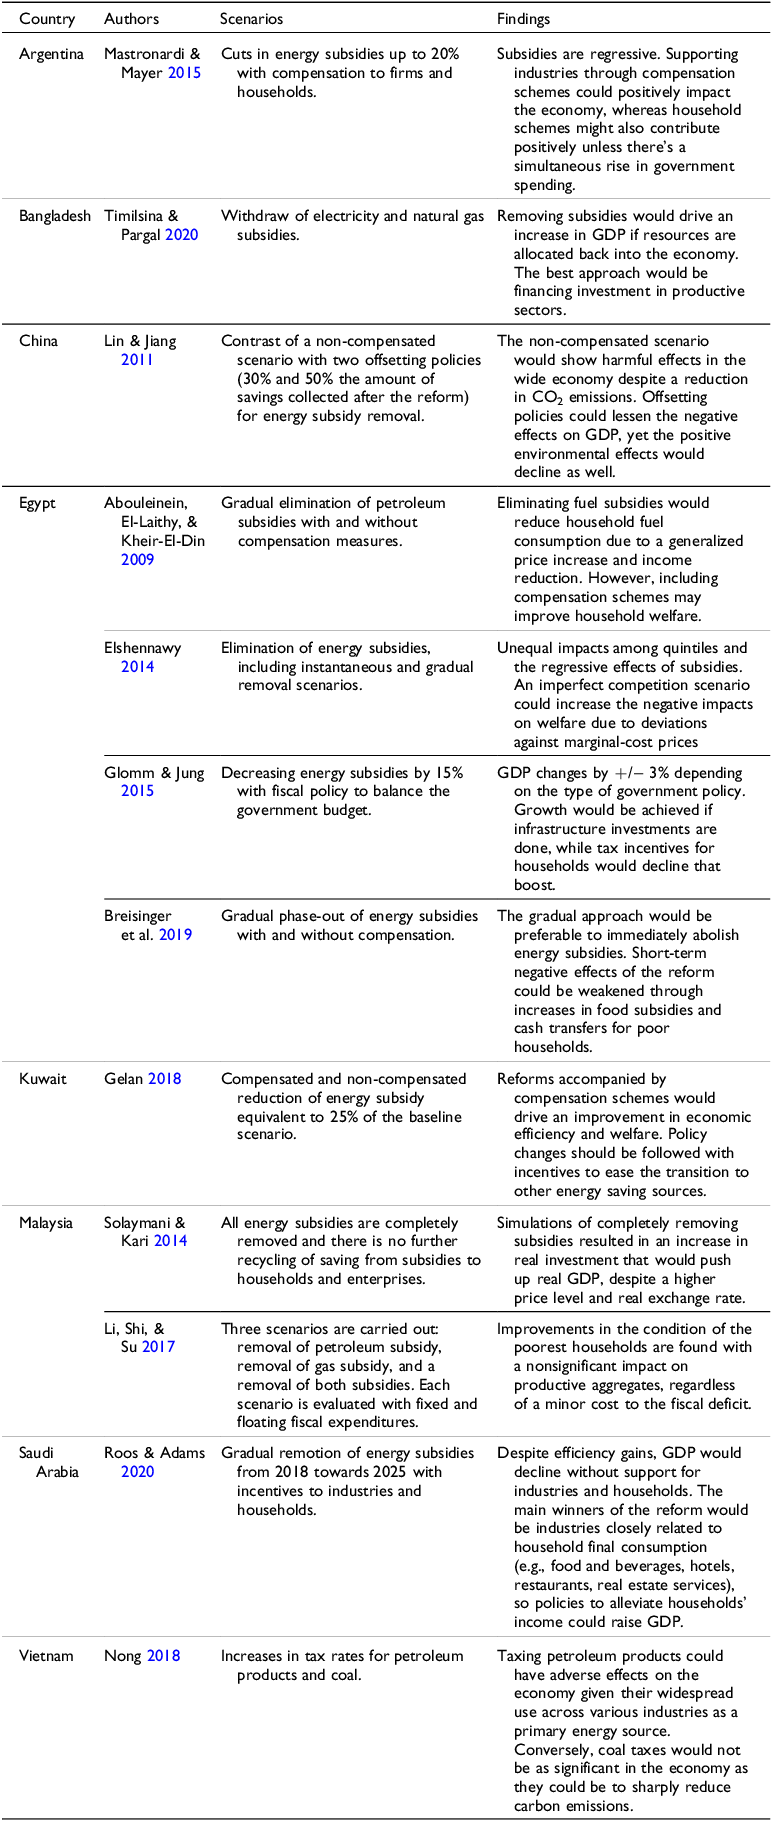
The use of computable general equilibrium (CGE) models has been shown to be a suitable approach to understanding policy changes’ effects before their application economy-wide. Among studies for emerging economies, examples include but are not limited to the cases of Argentina (Mastronardi and Mayer Reference Mastronardi and Mayer2015), Bangladesh (Timilsina and Pargal Reference Timilsina and Pargal2020), China (Lin and Jiang Reference Lin and Jiang2011), Egypt (Abouleinein, El-Laithy, and Kheir-El-Din Reference Abouleinein, El-Laithy and Kheir-El-Din2009; Elshennawy Reference Elshennawy2014; Glomm and Jung Reference Glomm and Jung2015; Breisinger et al. Reference Breisinger, Mukashov, Raouf and Wiebelt2019), Kuwait (Gelan Reference Gelan2018), Malaysia (Solaymani and Kari Reference Solaymani and Kari2014; Li, Shi, and Su Reference Li, Shi and Su2017), Saudi Arabia (Roos and Adams Reference Roos and Adams2020), and Vietnam (Nong Reference Nong2018). Those analyses are summarized in Table 1, which depicts CGE modeling as one of the most comprehensive approaches to evaluate the impacts of energy subsidy reforms. Also, it has brought the opportunity to explore offsetting alternatives to compensate vulnerable sectors and make socially acceptable reforms, and it has proved its robustness by producing analogous results despite changes in the model design for the same economy.
Energy CGE studies for emerging economies
Conversely to international studies, most literature in Ecuador on this topic has focused on evaluating the microeconomic effects by means of behavioral and nonbehavioral methodologies. The first works were carried out by Cuesta, Ponce, and León (Reference Cuesta, Ponce and León2003) and Cuesta and Ponce (Reference Cuesta and Ponce2007). These studies propose the partial and total elimination of subsidies for liquefied petroleum gas (LPG) and the introduction of a progressive cash-transfer program. Using data from a living conditions survey, they draw a nonbehavioral microsimulation tool that was later expanded by Yaselga (Reference Yaselga2014) to include behavioral households and labor supply. The results suggest that there are no significant differences in distributional terms after the elimination of the subsidy, yet the poverty rate increases by more than 3%. Instead, if subsidies are replaced with a cash transfer program, a 0.4 percent reduction in poverty and a 0.04-point reduction in the Gini coefficient are observed.
From other perspectives, there are studies in Ecuador that evaluate the subsidies’ impacts on the fiscal and real sectors. Castillo and Gómez (Reference Castillo and Gómez2019) use econometric tools (ARIMA models—autoregressive integrated moving average) to forecast the impact on the fiscal balance of the subsidy reforms proposed in the 2019 agreement between Ecuador and the International Monetary Fund (IMF). Estimations until 2021 suggested that fiscal revenues could increase by more than USD 2 billion by eliminating gasoline subsidies while more than USD 1.9 billion by reforming diesel schemes and almost USD 1.4 billion through the LPG change. Focusing on the real sector, Schaffitzel et al. (Reference Schaffitzel, Michael Jakob, Vogt-Schilb and Ward2020) evaluate the impact of redirecting the amount allocated to fuel subsidies towards a system of cash transfers for Ecuadorian households based on an input-output model. This article concludes that, because of better targeting, increasing cash transfers would be a socially acceptable proposal in the face of eliminated fuel subsidies. The results show that eliminating fuel subsidies and providing an increase equal to USD 50 in transfers to the most vulnerable households would generate a 10% improvement in the income of the poorest quintile.
Some limitations on the evaluation of subsidy reforms could be found in Ecuadorian literature. Although microsimulation methodologies provide the effects of subsidies on income distribution, they must be complemented by other studies about the impact on macroeconomic aggregates. On the other hand, econometric techniques could be helpful in forecasting the ex ante impacts of policy reforms; however, high-dimensional structural models with a large number of observations would be needed to preserve enough degrees of freedom to derive robust conclusions. Finally, recent developments that explore input-output models provide a first indication of the effects on macroeconomic linkages among industries. Nevertheless, they still miss behavioral relationships between other economic agents such as households, the government, and the external sector that could be crucial for evaluating policy implementation of subsidy reform in emerging economies.
Therefore, as a natural step toward using the most recent global standards, this work seeks to contribute to the current literature by developing a static CGE model for subsidy reform evaluation in Ecuador. We look forward to providing evidence that could be compared with and complemented by other studies of emerging economies.
Model
Features and assumptions
This model relies mostly on neoclassical microeconomics assumptions. First, the model assumes homogeneous production across firms, which means that industries produce a single good from their production process. Second, the model performs under a perfect competition environment, so in equilibrium, markets clear because of agents’ price-taking behavior. We also represent production and utility with homogeneous functions of degree to ensure constant-returns-to-scale technologies and homothetic consumer preferences. This results in industries’ production growing proportionally as the number of production factors increases. Similarly, households’ utility would change commensurate with the increase in final good consumption.
The model has other, less standard features suggested by previous research (see, e.g., Lysy and Taylor Reference Lysy, Taylor, Taylor, Bacha, Cardoso and Lysy1980; Dervis, De Melo, and Robinson Reference Dervis, De Melo and Robinson1982; Robinson Reference Robinson, de Janvry and Kanbur2006; Zalai and Révész Reference Zalai and Révész2016; Rada Reference Rada, Foster-McGregor, Alcorta, Szirmani and Verspagen2021). The model works under the small open economy assumption. This implies that this economy’s demand or supply cannot affect international prices. Furthermore, the model incorporates some short-run Keynesian closures (Robinson Reference Robinson, de Janvry and Kanbur2006; Zalai and Révész Reference Zalai and Révész2016; Rada Reference Rada, Foster-McGregor, Alcorta, Szirmani and Verspagen2021):
-
External sector: The nominal exchange rate is assumed to be exogenous and fixed due to the full dollarization of the Ecuadorian economy. Therefore, the adjustment occurs in external savings, which depend on the financing needs of the private and public sectors.
-
Government: Real government spending and tax rates are exogenous. Hence, the adjustment is made through an endogenous fiscal deficit.
-
Factors: Real payments are flexible and determined through the marginal product of each factor. Factors are assumed to be perfectly mobile across sectors.
-
Savings investment: The marginal propensities to saving of private institutions, the real investment and the capital endowment are kept fixed. Labor employment is left free to ensure the savings-investment balance.Footnote 1
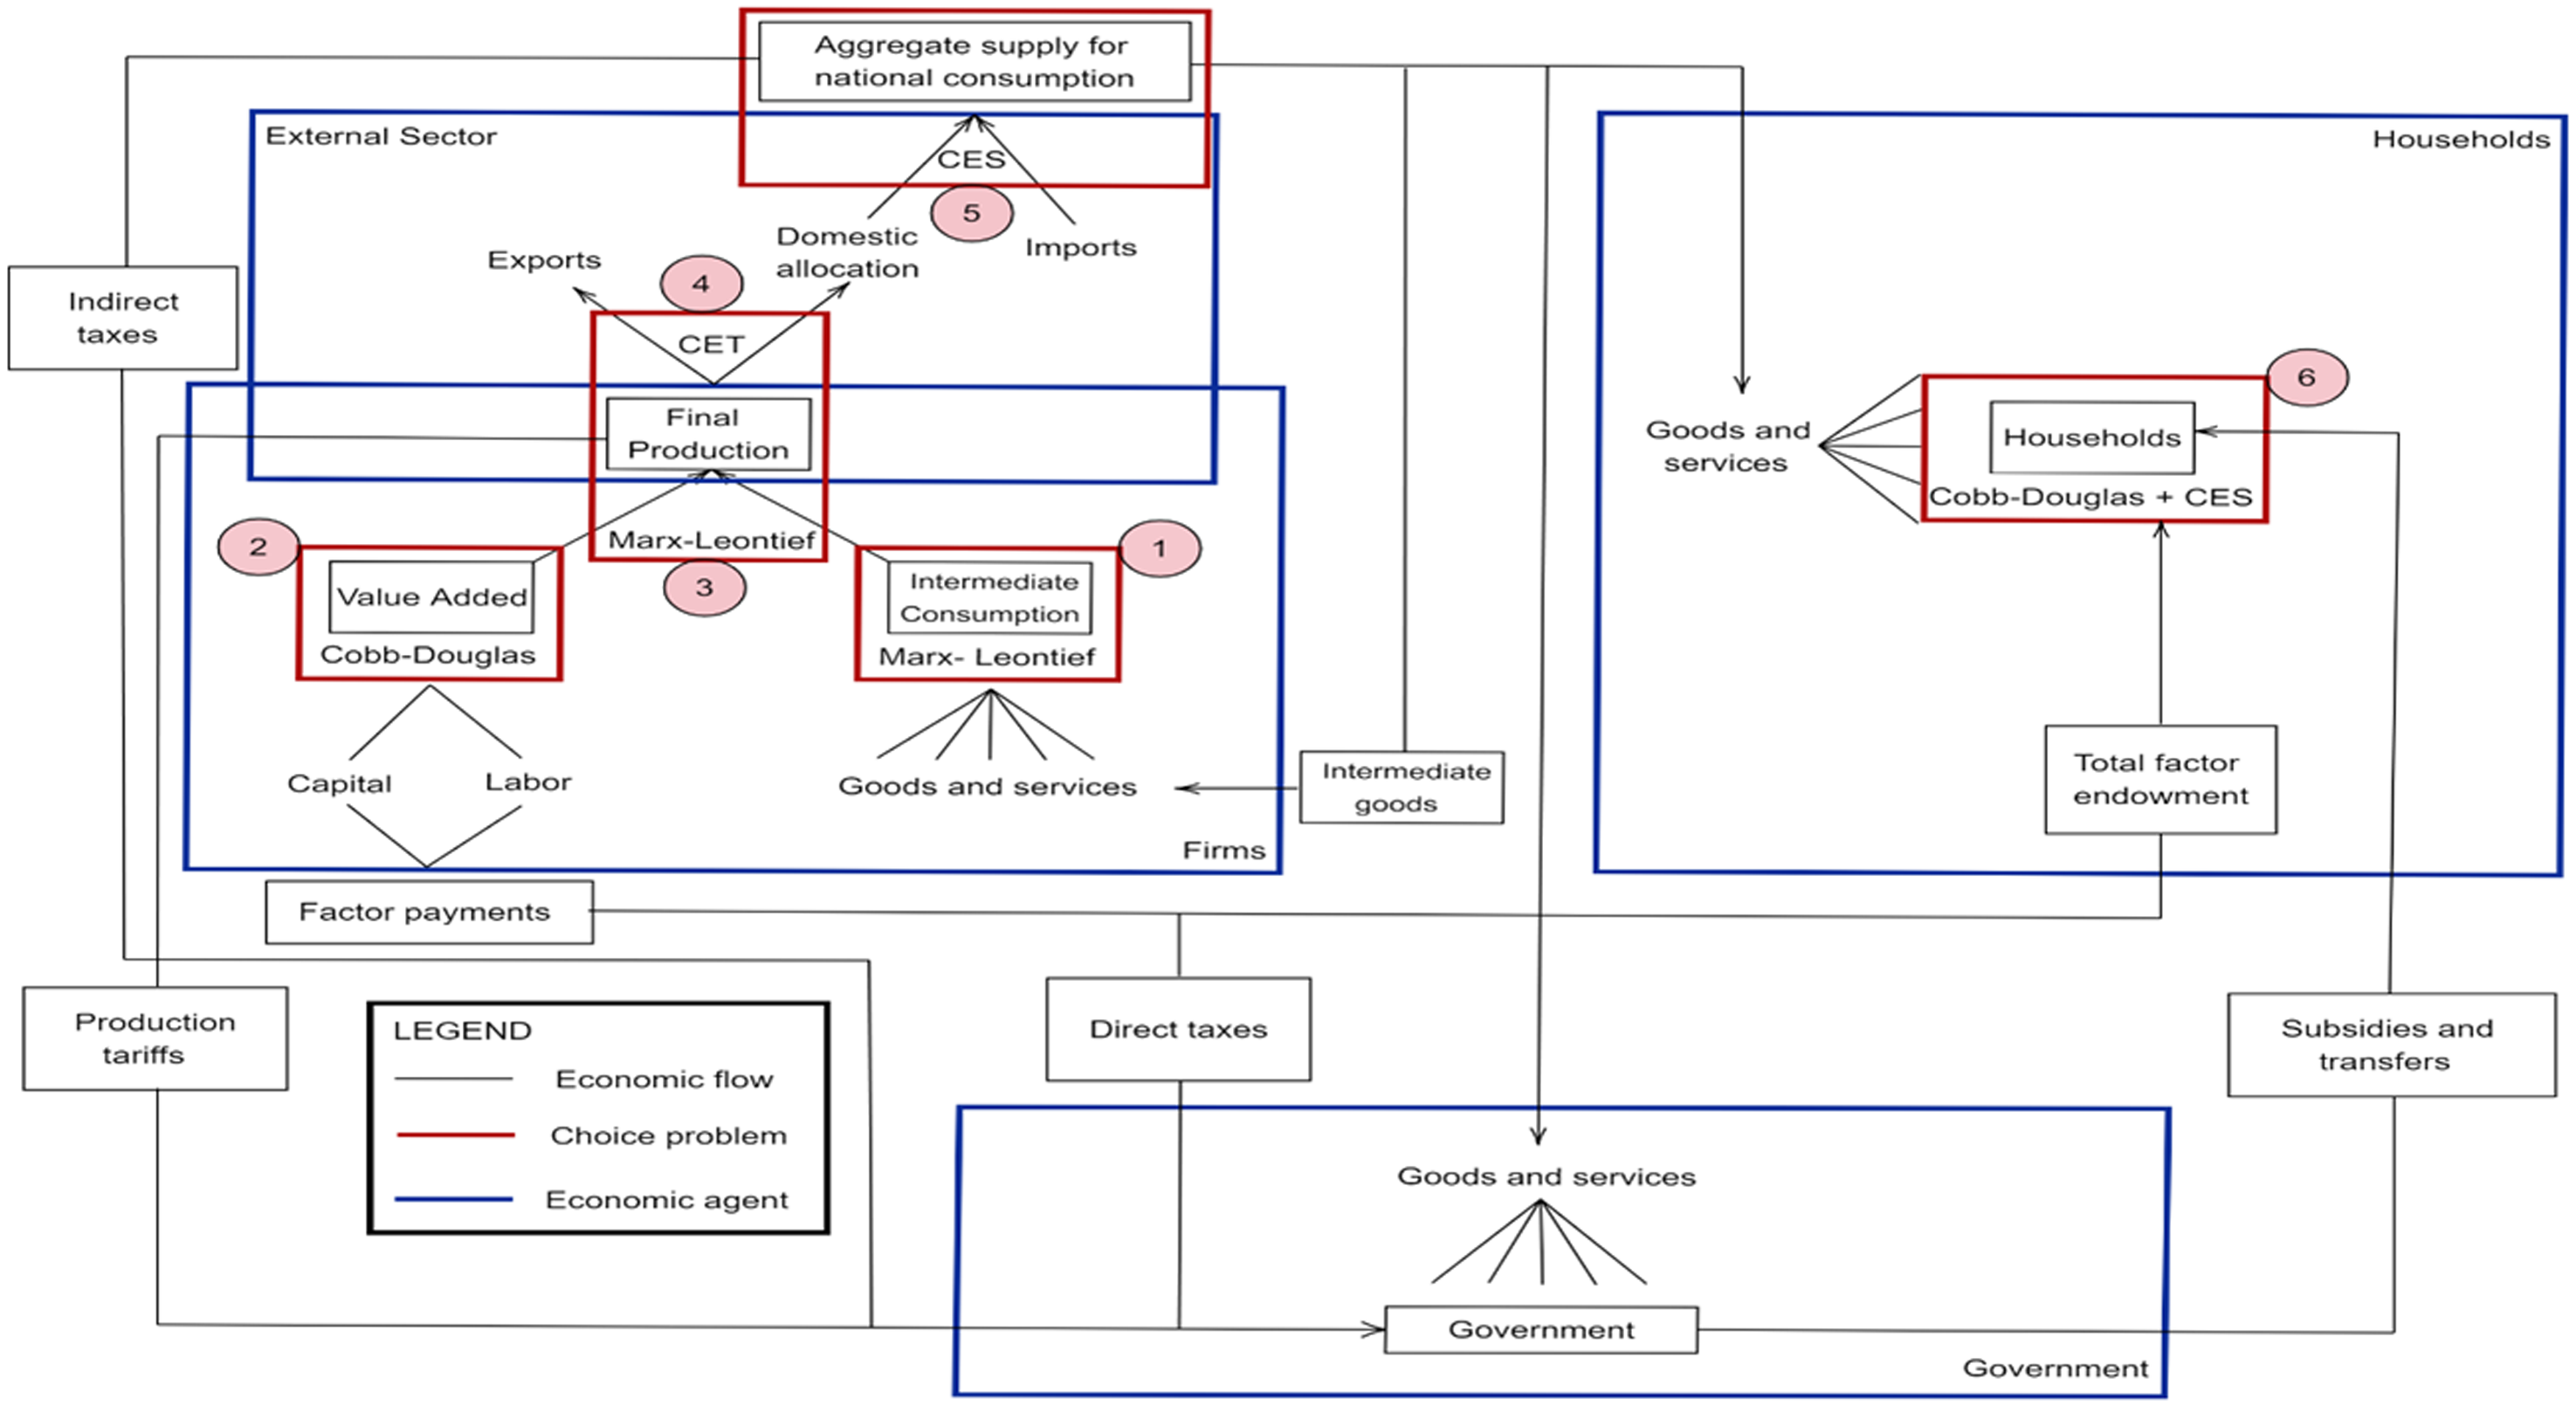
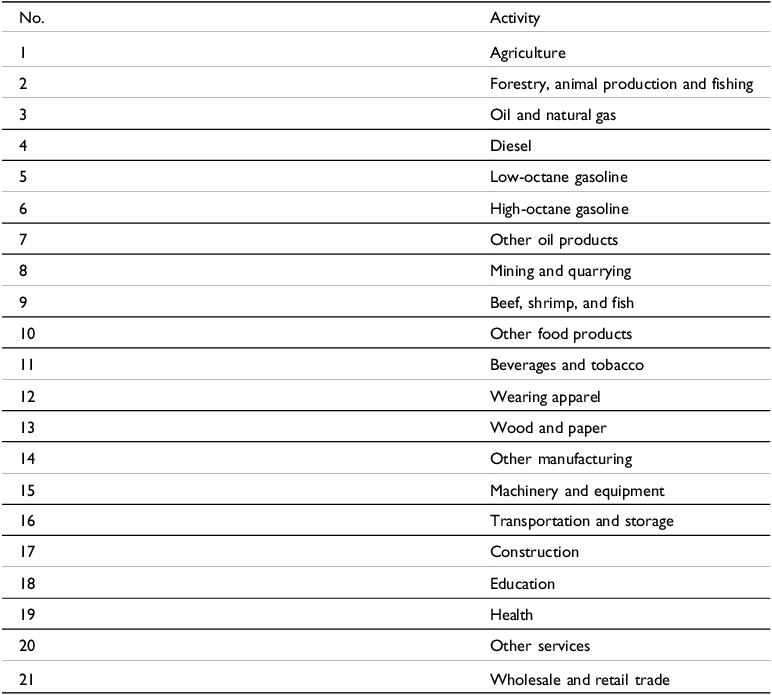
Figure 1 illustrates the economic flow assumed by the model. In this economy, the twenty-two firms listed in Table 2 make their optimal decisions for intermediate consumption, value-added, and production allocation. Households interact with the domestic and global markets to choose their good consumption. In the model, five households are representative of each income quintile in the Ecuadorian economy. For a more thorough revision of agents’ behavior, the mathematical development is explained in the following sections.
Ecuadorian economic flow assumed in the model. Blue boxes identify economic agents. Red boxes represent agents’ preferences and technologies. Arrows identify economic flows and interactions between agents.
Economic activities included in the model
Firms
Each firm pursues its own profit maximization by first minimizing its costs and following a zero-profit condition due to technologies with constant returns to scale. The technological restriction consists of a three-tier nesting: intermediate consumption, value-added, and final production.
Intermediate consumption (box 1 in Figure 1) assumes that intermediate goods are perfect complements, so one unit of a final good will require at least a fixed share of each intermediate good to be produced. A Marx-Leontief technology is used to model this behavior:
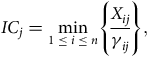 $${I{C_j} = \mathop {\min }\limits_{1 \le i \le n} \left\{ {{{{X_{ij}}} \over {{\gamma _{ij}}}}} \right\},\;}$$
where $I{C_j}$
is the aggregate intermediate consumption of firm
$I{C_j}$
is the aggregate intermediate consumption of firm $j$
,
$j$
, ${X_{ij}}$
is firm
${X_{ij}}$
is firm $j$
’s demand for intermediate good
$j$
’s demand for intermediate good $i$
, and
$i$
, and ${\gamma _{ij}}$
identifies its fixed share of
${\gamma _{ij}}$
identifies its fixed share of $I{C_j}$
.
$I{C_j}$
.
Value-added (box 2 in Figure 1) employs a classical production function of two inputs: capital and labor. A Cobb-Douglas function is used to model a fixed substitution equal to 1 for these factors of production:Footnote 2
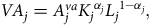 $${V{A_j} = A_j^{va}{K_j}^{{\alpha _j}}{L_j}^{1 - {\alpha _j}},}$$
where $V{A_j}$
is the aggregate value added of firm
$V{A_j}$
is the aggregate value added of firm $j$
,
$j$
, $A_j^{va}$
is its total factor productivity,
$A_j^{va}$
is its total factor productivity, ${K_j}$
and
${K_j}$
and ${L_j}$
identify its capital and labor demands, respectively, and
${L_j}$
identify its capital and labor demands, respectively, and ${\alpha _j}$
identifies its capital share of
${\alpha _j}$
identifies its capital share of $V{A_j}$
.
$V{A_j}$
.
Final production (box 3 in Figure 1) aggregates value-added and intermediate consumption. Again, we assume a Marx-Leontief functional form for this behavior to model a fixed share for each aggregate:
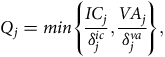 $${{Q_j} = min\left\{ {{{I{C_j}} \over {\delta _j^{ic}}},{{V{A_j}} \over {\delta _j^{va}}}} \right\},}$$
where ${Q_j}$
is the final production of firm
${Q_j}$
is the final production of firm $j$
,
$j$
, $\delta _j^{ic}$
and
$\delta _j^{ic}$
and $\delta _j^{va}\;$
are the intermediate consumption and value-added fixed shares of
$\delta _j^{va}\;$
are the intermediate consumption and value-added fixed shares of ${Q_j}$
, respectively.
${Q_j}$
, respectively.
External sector
The external sector is modeled as a single entity: rest of the world. There is no distinction by destination or origin.
Exports (box 4 in Figure 1) are modeled by a technology with constant elasticity of transformation (CET). Thus, each firm decides between selling its final production on the domestic market ( ${D_j}$
) or exporting it (
${D_j}$
) or exporting it ( ${E_j}$
) based on the following function:
${E_j}$
) based on the following function:
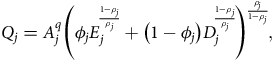 $${{Q_j} = A_j^q{{\left( {{\phi _j}E_j^{{{1 - {\rho _j}} \over {{\rho _j}}}} + \left( {1 - {\phi _j}} \right)D_j^{{{1 - {\rho _j}} \over {{\rho _j}}}}} \right)}^{{{{\rho _j}} \over {1 - {\rho _j}}}}},}$$
where, for each firm $j$
,
$j$
, $A_j^q$
is an efficiency parameter,
$A_j^q$
is an efficiency parameter, ${E_j}$
and
${E_j}$
and ${D_j}$
identify the final production allocated on foreign and domestic markets, respectively,
${D_j}$
identify the final production allocated on foreign and domestic markets, respectively, ${\phi _j}$
identifies the share of exports, and
${\phi _j}$
identifies the share of exports, and ${\rho _j}$
is the elasticity of transformation.
${\rho _j}$
is the elasticity of transformation.
On the other hand, imports (box 5 in Figure 1) are modeled using a technology with constant elasticity of substitution (CES). Hence, aggregate supply for national consumption of good $j$
(
$j$
( ${S_j}$
) equals the sum of the quantity of final production of firm
${S_j}$
) equals the sum of the quantity of final production of firm $j$
allocated to the domestic market (
$j$
allocated to the domestic market ( ${D_j}$
) and the imported quantity of this good (
${D_j}$
) and the imported quantity of this good ( ${M_j}$
), as shown in the following equation:
${M_j}$
), as shown in the following equation:
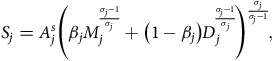 $${{S_j} = A_j^s{{\left( {{\beta _j}M_j^{{{{\sigma _j} - 1} \over {{\sigma _j}}}} + \left( {1 - {\beta _j}} \right)D_j^{{{{\sigma _j} - 1} \over {{\sigma _j}}}}} \right)}^{{{{\sigma _j}} \over {{\sigma _j} - 1}}}},}$$
where, for each good $j$
,
$j$
, $A_j^s$
is the efficiency parameter,
$A_j^s$
is the efficiency parameter, ${M_j}$
stands for imports,
${M_j}$
stands for imports, ${D_j}$
is the final production allocated to the domestic market,
${D_j}$
is the final production allocated to the domestic market, ${\beta _j}$
represents the share of imports, and
${\beta _j}$
represents the share of imports, and ${\sigma _j}$
is the elasticity of substitution.
${\sigma _j}$
is the elasticity of substitution.
Households
Households (box 6 in Figure 1) are classified by income quintiles. Each household selects its optimal basket for utility maximization, constrained by its disposable income. The utility function is a two-tier nested specification that follows a CES form for low and high-octane gasoline, and a Cobb-Douglas form for the rest of the goods. This nesting is used to capture the substitution between both types of gasoline available in Ecuador.
Formally, the representative household’s utility is stated as follows:
 $${{U_h} = \mathop \prod \limits_{i \notin O} C_{hi}^{{\theta _{hi}}}\;{{\left[ {\mathop \sum \limits_{k \in O} {\eta _{hk}}C_{hk}^{{{\omega - 1} \over \omega }}} \right]}^{{\omega \over {\omega - 1}}\;\overline {{\theta _h}} }},\;\mathop \sum \limits_{\rm{i}} {\theta _{hi}} + \overline {{\theta _h}} = 1,}$$
where ${U_h}$
represents the utility of household
${U_h}$
represents the utility of household $h$
,
$h$
, ${C_{hi}}$
identifies its final consumption of good
${C_{hi}}$
identifies its final consumption of good $i$
,
$i$
, ${\theta _{hi}}$
is the
${\theta _{hi}}$
is the $ith$
good’s share in final consumption (
$ith$
good’s share in final consumption ( $\overline {{\theta _h}} $
for gasoline),
$\overline {{\theta _h}} $
for gasoline), ${\eta _{hk}}$
is the share of the
${\eta _{hk}}$
is the share of the $kth$
octane gasoline in gasoline basket, ω is the elasticity of substitution for gasoline,
$kth$
octane gasoline in gasoline basket, ω is the elasticity of substitution for gasoline, $p_i^S$
is the consumer price of good
$p_i^S$
is the consumer price of good $i$
, and
$i$
, and $O$
is the gasoline basket (low and high-octane gasoline).
$O$
is the gasoline basket (low and high-octane gasoline).
The income constraint establishes that the total expenditure for each household is equal to the available income for consumption as follows:
 $${\mathop \sum \limits_k {p_k}{C_{hk}} = \;\varphi _h^{dsp}\left( {\varphi _h^L{w_L}L + \varphi _h^K{w_K}K + t{r_h}} \right),}$$
where, for each household $h$
,
$h$
, $\varphi _h^{dsp}$
is the marginal propensity of consumption,
$\varphi _h^{dsp}$
is the marginal propensity of consumption, $\varphi _h^L$
is the share of the compensation to the employees (
$\varphi _h^L$
is the share of the compensation to the employees ( ${w_L}L)$
,
${w_L}L)$
, $\varphi _h^K$
is the share of the gross capital returns (
$\varphi _h^K$
is the share of the gross capital returns ( ${w_K}K)$
, and
${w_K}K)$
, and $t{r_h}$
are the net cash transactions received from or paid to others private agents or government.
$t{r_h}$
are the net cash transactions received from or paid to others private agents or government.
Government
Government intervention is assumed exogenous and consists of two main activities: tax collection from direct and indirect rates and distribution of taxes through public consumption, investment, transfers, and subsidies.
Official data from the SAM identifies three main indirect tax rates which affect the price system: production tariffs ( $\tau _i^{tar}$
), import rates (
$\tau _i^{tar}$
), import rates ( $\tau _i^m\;$
) and value-added rates (
$\tau _i^m\;$
) and value-added rates ( $\tau _i^{va}$
). Also, prices are modified by specific subsidies (
$\tau _i^{va}$
). Also, prices are modified by specific subsidies ( ${\psi _i}$
). Therefore, the relationship between prices before and after fiscal intervention is described below:
${\psi _i}$
). Therefore, the relationship between prices before and after fiscal intervention is described below:
 $${p_i} = {\left( {1 + \tau _i^{va}} \right)}{\left( {1 + \tau _i^m\;} \right)}{\left( {1 + \tau _i^{tar}} \right)} {p_i^{'}} - {\psi _i},$$
where, $p_i^{'}$
is the price of the
$p_i^{'}$
is the price of the $ith$
good before fiscal intervention and
$ith$
good before fiscal intervention and ${p_i}$
is the price of the
${p_i}$
is the price of the $ith$
good after tax and subsidy policies.
$ith$
good after tax and subsidy policies.
Equilibrium
The economic system shown in Figure 1 has two equilibrium equations. The first one occurs in the goods market:
 $${S_i^* = \mathop \sum \limits_{j = 1}^n X_{ij}^* + \;\mathop \sum \limits_{h = 1}^m C_{hi}^* + {G_i} + {I_i},}$$
where, for each good $i$
,
$i$
, $S_i^*$
identifies its aggregate supply for national consumption,
$S_i^*$
identifies its aggregate supply for national consumption, $X_{ij}^*$
represents the aggregate intermediate consumption by firm
$X_{ij}^*$
represents the aggregate intermediate consumption by firm $j$
,
$j$
, $C_{hi}^*$
identifies the aggregate final consumption by household
$C_{hi}^*$
identifies the aggregate final consumption by household $h$
,
$h$
, ${G_i}$
represents the government consumption, and
${G_i}$
represents the government consumption, and ${I_i}$
is the investment.
${I_i}$
is the investment.
The second equilibrium equation occurs in the factors market:
 $${\mathop \sum \limits_{i = 1}^n {L_j} = \overline L,\;\;\mathop \sum \limits_{i = 1}^n {K_j} = \;\overline K,}$$
where $\overline L$
and
$\overline L$
and $\overline K$
are the fixed total factor endowments of labor and capital, respectively.
$\overline K$
are the fixed total factor endowments of labor and capital, respectively.
These equilibrium equations consider the behavior of all agents above, that is: households maximize their income-constrained utility, firms minimize their total cost and obtain zero-profits locally and abroad, and government spending equals tax collection plus public financing needs. The model solves only for relative prices, with the nominal wage serving as numéraire and being set as 1.
Calibration
The general equilibrium model was calibrated on a social accounting matrix (SAM) with data from 2014.Footnote 3 This matrix provides information about the real economy, which includes intermediate consumption, production, trade balance, value-added, income generation, distribution and allocation, taxes, and subsidies. Also, we used official information from the 2014 Supply and Use Tables, published by the Central Bank of Ecuador, to disaggregate diesel, gasoline, and other fuel products that was originally in one merged sector in the SAM. The consistency of the disaggregated matrix with official data was verified through the RAS technique, as proposed by Bacharat (Reference Bacharat1970).
Data limitations
Although the absence of recently updated official data is a challenge that cannot be readily surmounted, it is a limitation worth mentioning for the model calibration. Because liquid fuel subsidies were more strongly discussed after 2019, the 2014 SAM is not admittedly the most accurate approximation of the Ecuadorian economic context of these subsequent years. Between 2014 and 2019, the macroeconomic environment suffered from a collection of not-minor shocks, two of the most significant being the fall in oil prices in 2015 and the earthquake in 2016, whose implications may result in an overestimation of the effects of simulation scenarios, mainly on fiscal accounts.
In fact, during these years, the structure of the fiscal budget was drastically adjusted according to official data. The fall in Ecuadorian oil prices below USD 30 per barrel sharply reduced fiscal oil revenue by up to 38% in 2015. Consequently, the government adjusted its budget by getting unilateral credits, issuing sovereign bonds, and cutting public investment by almost 18%. The oil industry’s strong linkages with other sectors rapidly transmitted the shock to the whole economy, so gross domestic product (GDP) decelerated up to 3 percentage points. More importantly for the model, this complex environment affected subsidy spending because the fall in the oil price market also reduced the prices of oil derivatives. This caused a partial benefit for the fiscal budget due to the transitory reduction in more than half the amount of subsidy spending to USD 2.3 billion from USD 5.6 billion. Although oil prices started their recovery in 2016, the government was not able to fully take advantage since the public deficit reached up to 10% of GDP after that year’s earthquake in the country.
Therefore, the data used for calibration shows a stronger economic environment than the time when reforms started, and it obscures the real dimension of the 2015–2016 recession and its long-lasting repercussions in the subsequent years. If the official SAM is updated to more recent data, the contraction of oil revenue in 2015 and 2016 as well as its slow recovery until 2019 would likely result in a base scenario with a higher fiscal deficit and lower subsidy pressure in the government budget in comparison to the one seen in the 2014 SAM. Thus, it is crucial to acknowledge that the model results are just a reference level with a highly probable overestimation bias due to the dissimilitude in fiscal budget structures from 2014 to 2019.
Policy framework and reform scenarios
Background
Ecuador’s fuel subsidy policy was first implemented in 1974 with the main purpose of improving access for those who were not able to afford international market prices (Andrade Reference Andrade2011; Carrillo-Maldonado, Díaz-Cassou, and Tejeda Reference Carrillo-Maldonado, Díaz-Cassou and Tejeda2018; Jara et al. Reference Jara, Chun Lee, Montesdeoca and Varela2018). The policy framework for diesel, gasoline, and LPG consisted of fixed prices—established by presidential decrees—so that the difference between costs and returns of imported fuel resulted in the amount of government subsidy. In 1977, the first Ecuadorian oil refinery started the manufacturing of domestic fuel products that also were included in the subsidy scheme (Acosta Reference Acosta2001). Because of the lack of correlation with international prices, those subsidies started a fiscal gap that many administrations have tried to reform.
During the 1980s the Ecuadorian economy suffered the impacts of a collapse of its oil revenues; thus, some discretionary adjustments were made to gasoline and LPG subsidies. Nevertheless, those changes responded only to fiscal pressures, not to a systematic pass-through of international movements of prices (Carrillo-Maldonado, Díaz-Cassou, and Tejeda Reference Carrillo-Maldonado, Díaz-Cassou and Tejeda2018). The absence of compensation measures triggered some national mobilizations, which intensified in the 1990s, when more attempts at reform and the economic instability led to a governance crisis in which seven different presidents held office in ten years (1996–2006; most were overturned by riots due to fuel subsidy-related decisions).
Throughout the first five years of the decade 2010–2015, the Ecuadorian government sought an energy transition to hydro-oriented sources (Carrillo-Maldonado, Díaz-Cassou, and Tejeda Reference Carrillo-Maldonado, Díaz-Cassou and Tejeda2018). Although gasoline and diesel subsidies remained the same, a progressive elimination of LPG subsidy was planned to be executed as of 2016. For this purpose, the government designed the Efficient Cooking Program (PCE, in its Spanish acronym), which consisted of incentives for the manufacturing and purchasing of low-cost induction cooktops. The ultimate goal was to reduce LPG consumption so that its subsidy can be eliminated without harming vulnerable sectors and thus avoiding social reluctance (Chanatásig and Salazar Reference Chanatásig and Salazar2018). However, both supply and demand slowed due to the economic recession of 2015–2016; therefore, the reform to LPG subsidy was left behind to focus on diesel and gasoline subsidies in recent years.
Incentives to a gasoline and diesel subsidy reform
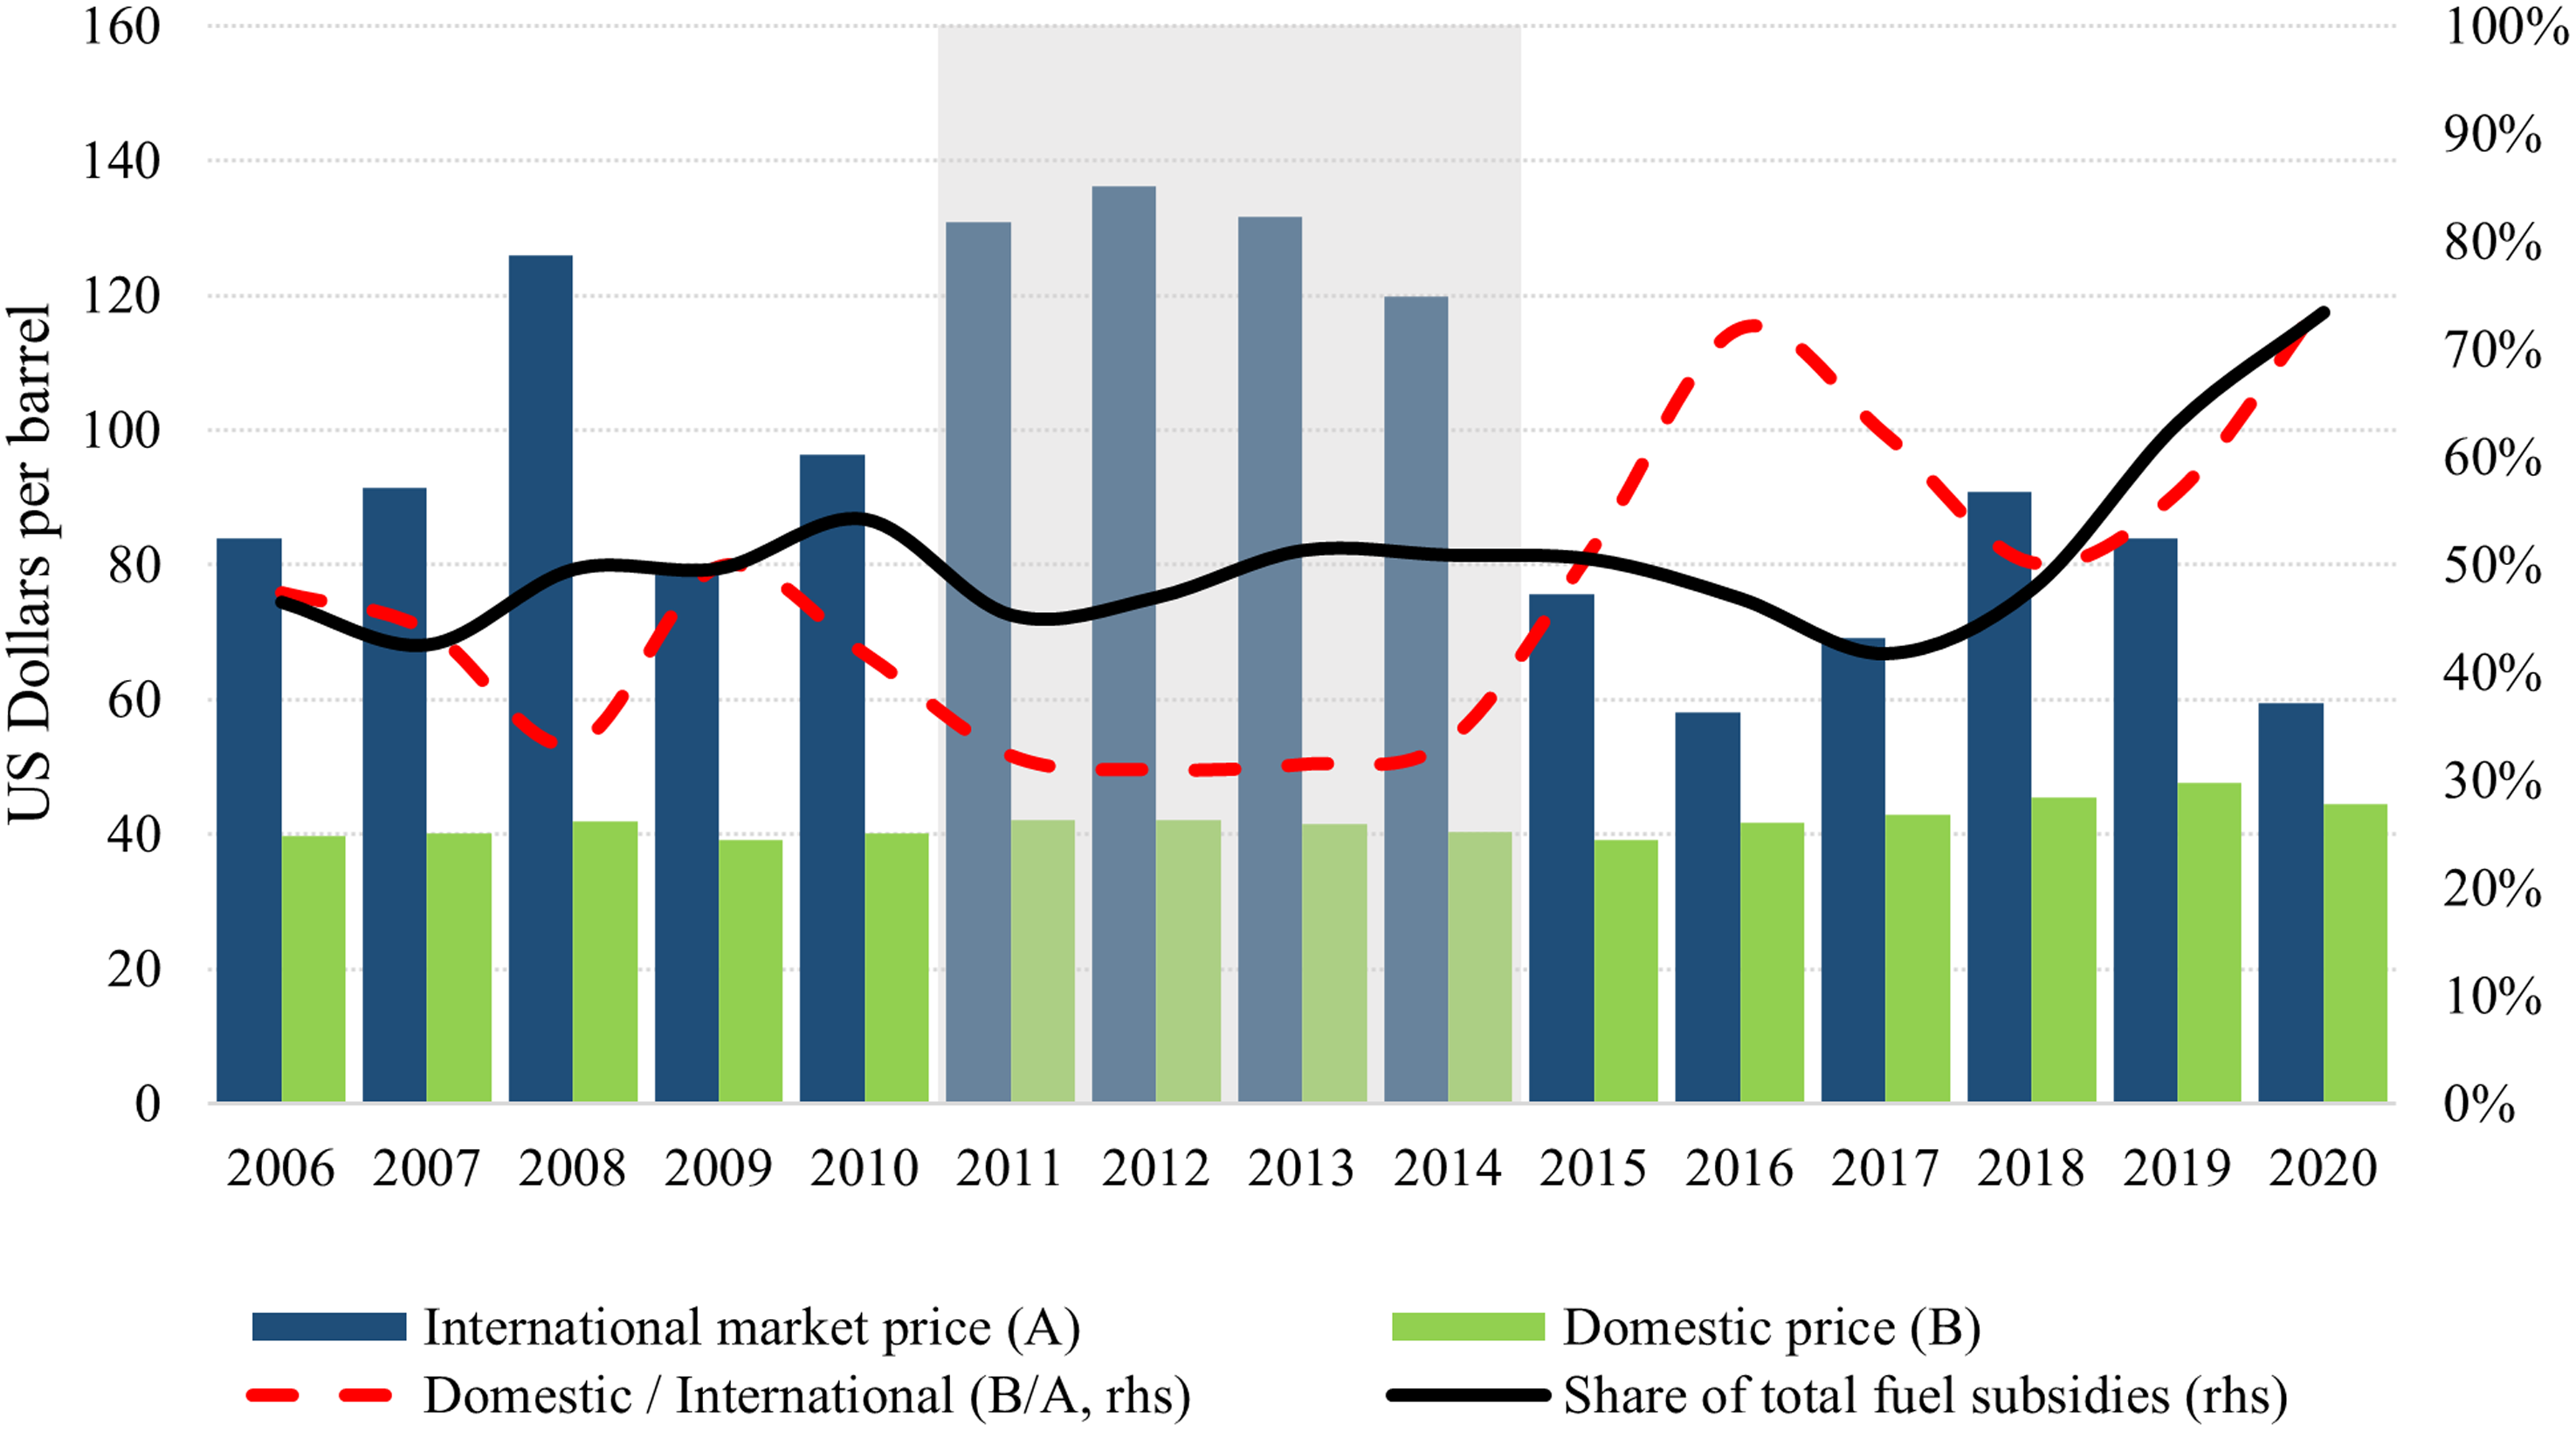
Ecuador is a full-dollarized, small, open economy with high level of subsidies (Ríos-Roca, Garrón, and Cisneros 2007; Mendoza Reference Mendoza2014; Marchán, Espinasa, and Yépez-García Reference Marchán, Espinasa and Yépez-García2017). During the last commodity boom between 2011 and 2014, the country spent yearly almost 4% of its GDP by fixing fuel prices while its fiscal deficit reached an average of 5%. Most pressures came from subsidizing diesel, which has been historically sold up to third the international market price and represented around of half the total amount of subsidies spending, as Figure 2 shows.
Diesel subsidy insights. Source: Central Bank of Ecuador. The shaded area between 2011 and 2014 underscores the commodity boom period.
Regarding gasoline, Ecuador had two types of subsidized products based on quality: high octane (super) and low octane (extra or ecopaís). While the first type has been mainly used by the richest quintiles, the low-octane gasoline has been widely consumed despite household income (Jara et al. Reference Jara, Chun Lee, Montesdeoca and Varela2018). Hence, there has been an unequal distribution of the direct benefits apparently biased in favor of the high-income households.
In 2015–2016, the Ecuadorian economy suffered several negative effects on its balance of payments. External shocks like the decline of its terms of trade (–31% annual in February 2015) mainly due to the fall of its oil revenues (–67% annual in February 2015), the appreciation of its real effective exchange rate (14% annual in August 2015) influenced by the sharp depreciation of the nominal exchange rate of Colombia and Perú (–37% and –13% annual in August 2015, respectively), and some materialized natural risks such as El Niño phenomenon and the magnitude 7.8 earthquake in April 2016 passed through the external and real accounts until the government balance.
After applying short-term fiscal and monetary impulses to alleviate the impacts on the real sector, the Ecuadorian economy shrank by –1.2% of GDP in 2016. As a result of the debt expansion to cover financial needs between 2014 and 2016, the external debt had increased almost 10 points to 27% of GDP, and the Central Bank’s liquid assets had reduced by 17 points to 50% of total assets. Therefore, some structural austerity measures started to be part of the economic agenda of the Ecuadorian government in the last months of 2017 in order to decrease sovereign risk.
Recent policy changes
Regarding the fuel subsidy policy, reforms began in 2018. Through the Presidential Decree 2018-490, the price of high-octane gasoline increased by 42%. Arguing that this type of gasoline is mostly consumed by expensive cars owned by the economic elite, the government was able to avoid the political risks of the reform, so it was successfully implemented. With the same argument, the second reform was launched a few months later in Presidential Decree 2018-619. However, this reform not only eliminated all the amount of subsidy for high-quality gasoline but also increased the price of low-octane gasoline (by up to 25%) and laid the path for upcoming social unrest.
In March 2019, Ecuador signed an Extended Fund Facility (EFF) agreement with the IMF to solve the government’s financial needs. The letter of intention claimed a reform had to be carried out in the same year. The reform was launched in October with Presidential Decree 2019-883, and it consisted of liberalizing diesel and gasoline prices. Due to the sudden elimination of subsidies, some riots against the change occurred. After eleven days of nationwide mobilizations, political leaders started conversations with the main groups against the reform. The bargaining process resulted in the Ecuadorian government not only derogating the reform but also replacing it with a new decree that called for further rationalization. The latter decree prompted policymakers to revisit and study new targeting mechanisms, and it stated that forthcoming cuts to fuel subsidies must mitigate the impact and focus their benefits on the most vulnerable sectors.
Throughout 2020–2022, the COVID-19 pandemic severely affected Ecuador’s financial accounts. The international shock in oil prices motivated more austerity measures and four new fuel subsidy reforms in less than three years. Among new policies, the government applied a transitory band system to low-octane gasoline and diesel prices so that subsidies activated only if their costs of production or import increase by a monthly rate greater than 5% (Executive Decree 2020-1054; later reduced to 3% for diesel in Executive Decree 2020-1222). The uncertainty surrounding the effects of this new, apparently complex scheme and the lockdown due to COVID-19 initially shut down any possibility of social mobilizations. However, as the international oil price gradually rose throughout 2021, the accumulated change in fuel prices reached more than 50%. After fourteen months with the band system, the government released Executive Decree 2021-231, by which it returned to the traditional fixed-price scheme. This reform was sustained for seven months until June 2022, when new riots urged political leaders for reducing prices. In the aftermath of eighteen days of social unrest, the Ecuadorian government yielded and cut USD 0.15 gasoline and diesel prices through the Executive Decree 2022-467. Again, this decree was launched with the compromise of studying new targeting mechanisms.
Scenario delimitation
Bearing in mind the context previously discussed, we chose four scenarios to carry out contrafactual assessments. Two of the scenarios involve government-adopted reforms aimed at the partial or total elimination of fuel subsidies, and the remaining scenarios assess two proposals for targeting.
Scenario 1: Decree 619, subsidy elimination for high-octane gasoline and reduction for low-octane gasoline. The first scenario aims to explore the current context of fuel subsidy policy.Footnote 4 It is based on the government’s decision launched in December 2018 in Executive Decree 619 (Table 3): a 40% reduction in low-octane gasoline subsidies (for a 25% increase in the final price) and the total elimination of high-octane gasoline subsidies. Footnote 5
Summary of the fuel subsidies reform in the Executive Decree No. 619
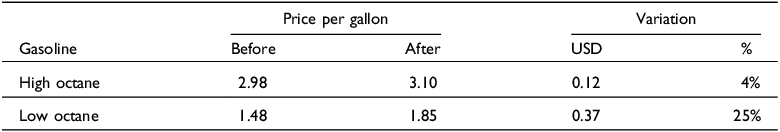
Source: Agency for Hydrocarbon Regulation and Control of Ecuador
Scenario 2: Decree 883, elimination of subsidies for gasoline and diesel. The second scenario seeks to estimate the upper-bound effects of eliminating fuel subsidies without any targeting or compensating measure. Therefore, it summarizes the attempt to liberalize low-octane gasoline and diesel prices through Executive Decree 883 (Table 4), which was subsequently repealed. With the subsidies’ removal, the diesel price increased by 121%, while gasoline prices rose by 29%.
Summary of fuel subsidies reform in the Executive Decree No. 883
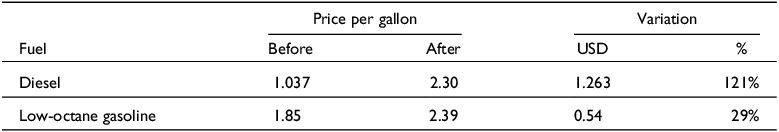
Source: Agency for Hydrocarbon Regulation and Control of Ecuador
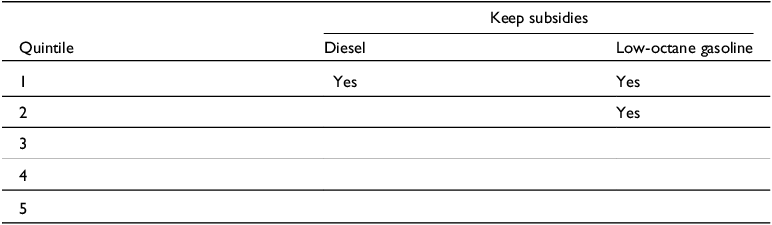
Scenario 3: Targeting household final consumption. This scenario seeks a targeting alternative that eliminates subsidies depending on the type of fuel and household income quintile. Targeting encompasses households in the poorest quintile for diesel and the two poorest quintiles for the low-octane gasoline (Table 5). The nontargeted quintiles suffer a 100% elimination of subsidies so that this scheme seeks to eliminate around 90% of subsidies’ benefits received by the richest quintiles.
Proposal for targeting household final consumption
Scenario 4: Targeting household final consumption and intermediate consumption. Scenario 4 targets household final consumption in the same way as scenario 3 but also incorporates firms’ intermediate consumption to the subsidies’ targeting. It keeps diesel subsidies for strong-linked economic activities, according to their Leontief multipliers; meanwhile, it considers a partial 50% reduction in diesel subsidies for weakly linked economic activities. This scheme is applied to avoid a systemic output contraction due to the higher costs of intermediate goods (Table 6).
Proposal for targeting intermediate consumption
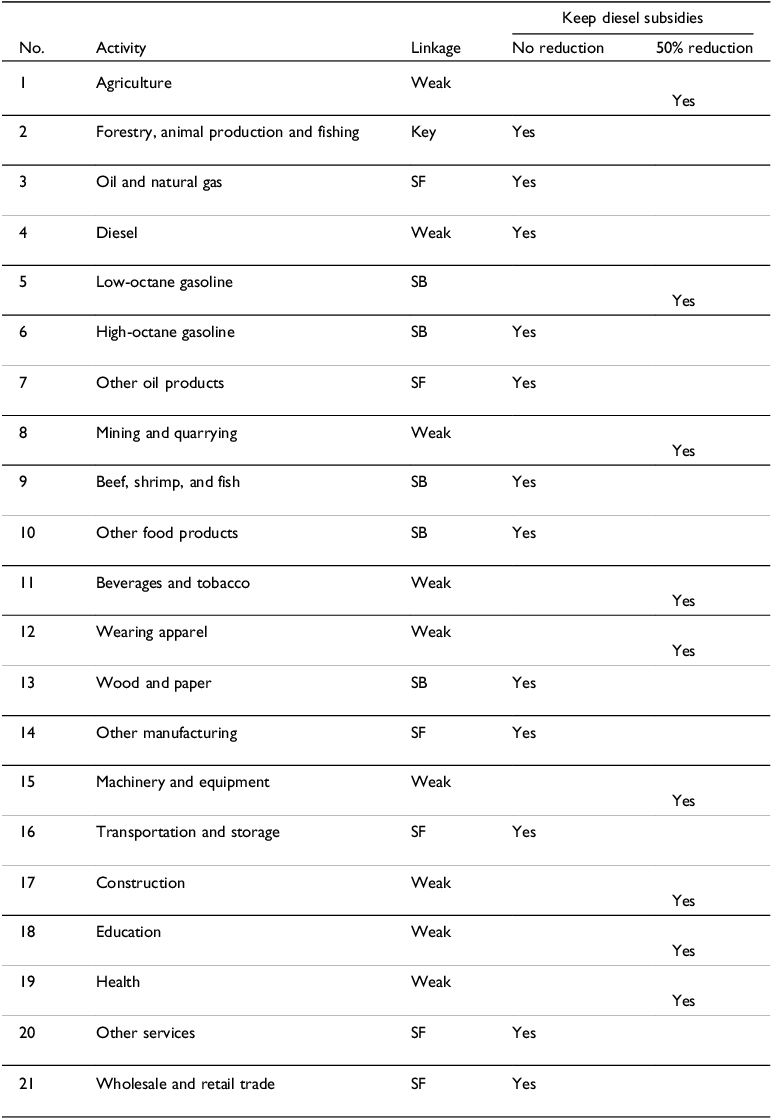
Note: SF: strong forward. SB: strong backward. Despite diesel’s weak linkage with the rest of activities, it is excluded from the reform to avoid spillover effects from self-consumption.
Results
This section evaluates the four previously described counterfactual scenarios of fuel subsidies to analyze their macroeconomic impact on Ecuador’s economy. Since the current policy concern of fuel subsidy reforms is reducing the fiscal deficit, the freed-up resources are accumulated as reserves in all scenarios.
Gross Domestic Product (GDP)
In the baseline scenario, household final consumption accounts for 58% of GDP, investment for 28%, government spending for around 15%, and the trade balance contributes –1% (as exports equal 28% and imports, 29%). From the income approach, GDP components are distributed into gross operating surplus and mixed income (58%), the compensation of employees (36%), and indirect taxes (6%).
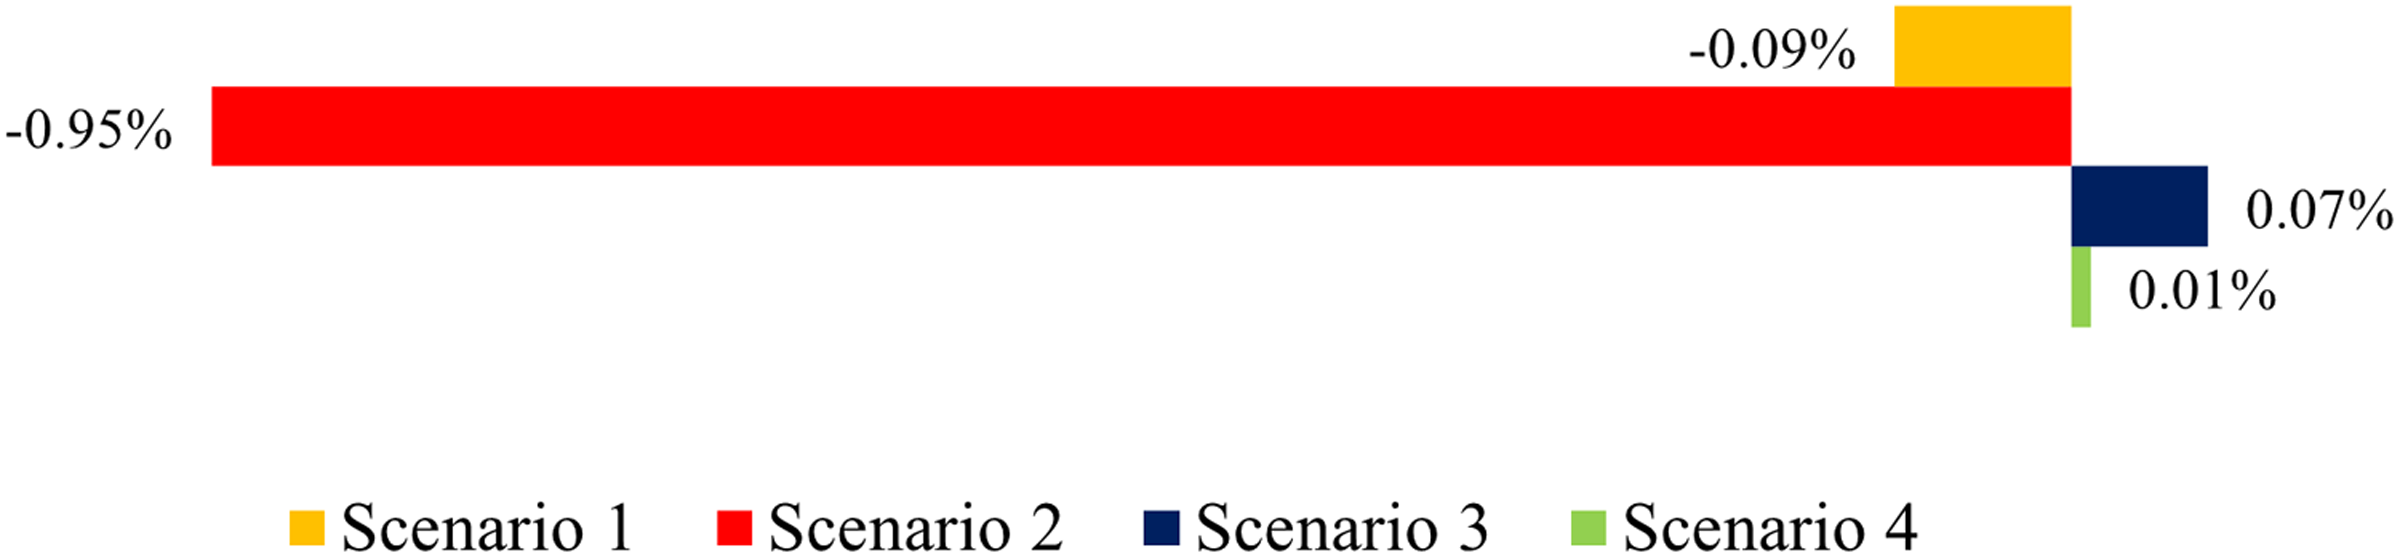
Figure 3 shows the impact of reforms on GDP. The evaluation suggests that the government-led scenarios reduce real GDP by 0.09% due to Decree 619 (scenario 1) and 0.95% with Decree 883 (scenario 2). Conversely, targeting evaluation shows that those effects could be mitigated with minor increases of 0.07% and 0.01% in scenarios 3 and 4, respectively.
Percentage variations in real GDP.
The results in the first two scenarios follow the expected short-term effects of nontargeted and noncompensated energy price increases discussed in previous literature (see, e.g., Lin and Jiang Reference Lin and Jiang2011; Glomm and Jung Reference Glomm and Jung2015; Gelan Reference Gelan2018; Nong Reference Nong2018; Breisinger et al. Reference Breisinger, Mukashov, Raouf and Wiebelt2019; Roos and Adams Reference Roos and Adams2020). Cutting fuel subsidies reduces incentives to consume those products regardless of their purpose (i.e., as either input or final good). Therefore, the impacts could be explored from the supply and demand side.
From the supply side, the discretionary increase in the price of intermediate goods (e.g., diesel) would increase costs of production and decrease output. Figure 4(A) shows that Ecuadorian firms would be motivated to shrink their final production after the shock. Less production demands fewer workers and less capital. Given our short-term assumptions, capital is perfectly mobile across sectors and fixed in aggregate utilization, so it would find other industries to be allocated. However, due to the developing state of the economy, workers would not be able to fully reinsert themselves in the labor market in the short run, as shown in Figure 4(B).
Percentage changes in real final production, labor demand, and household final consumption.
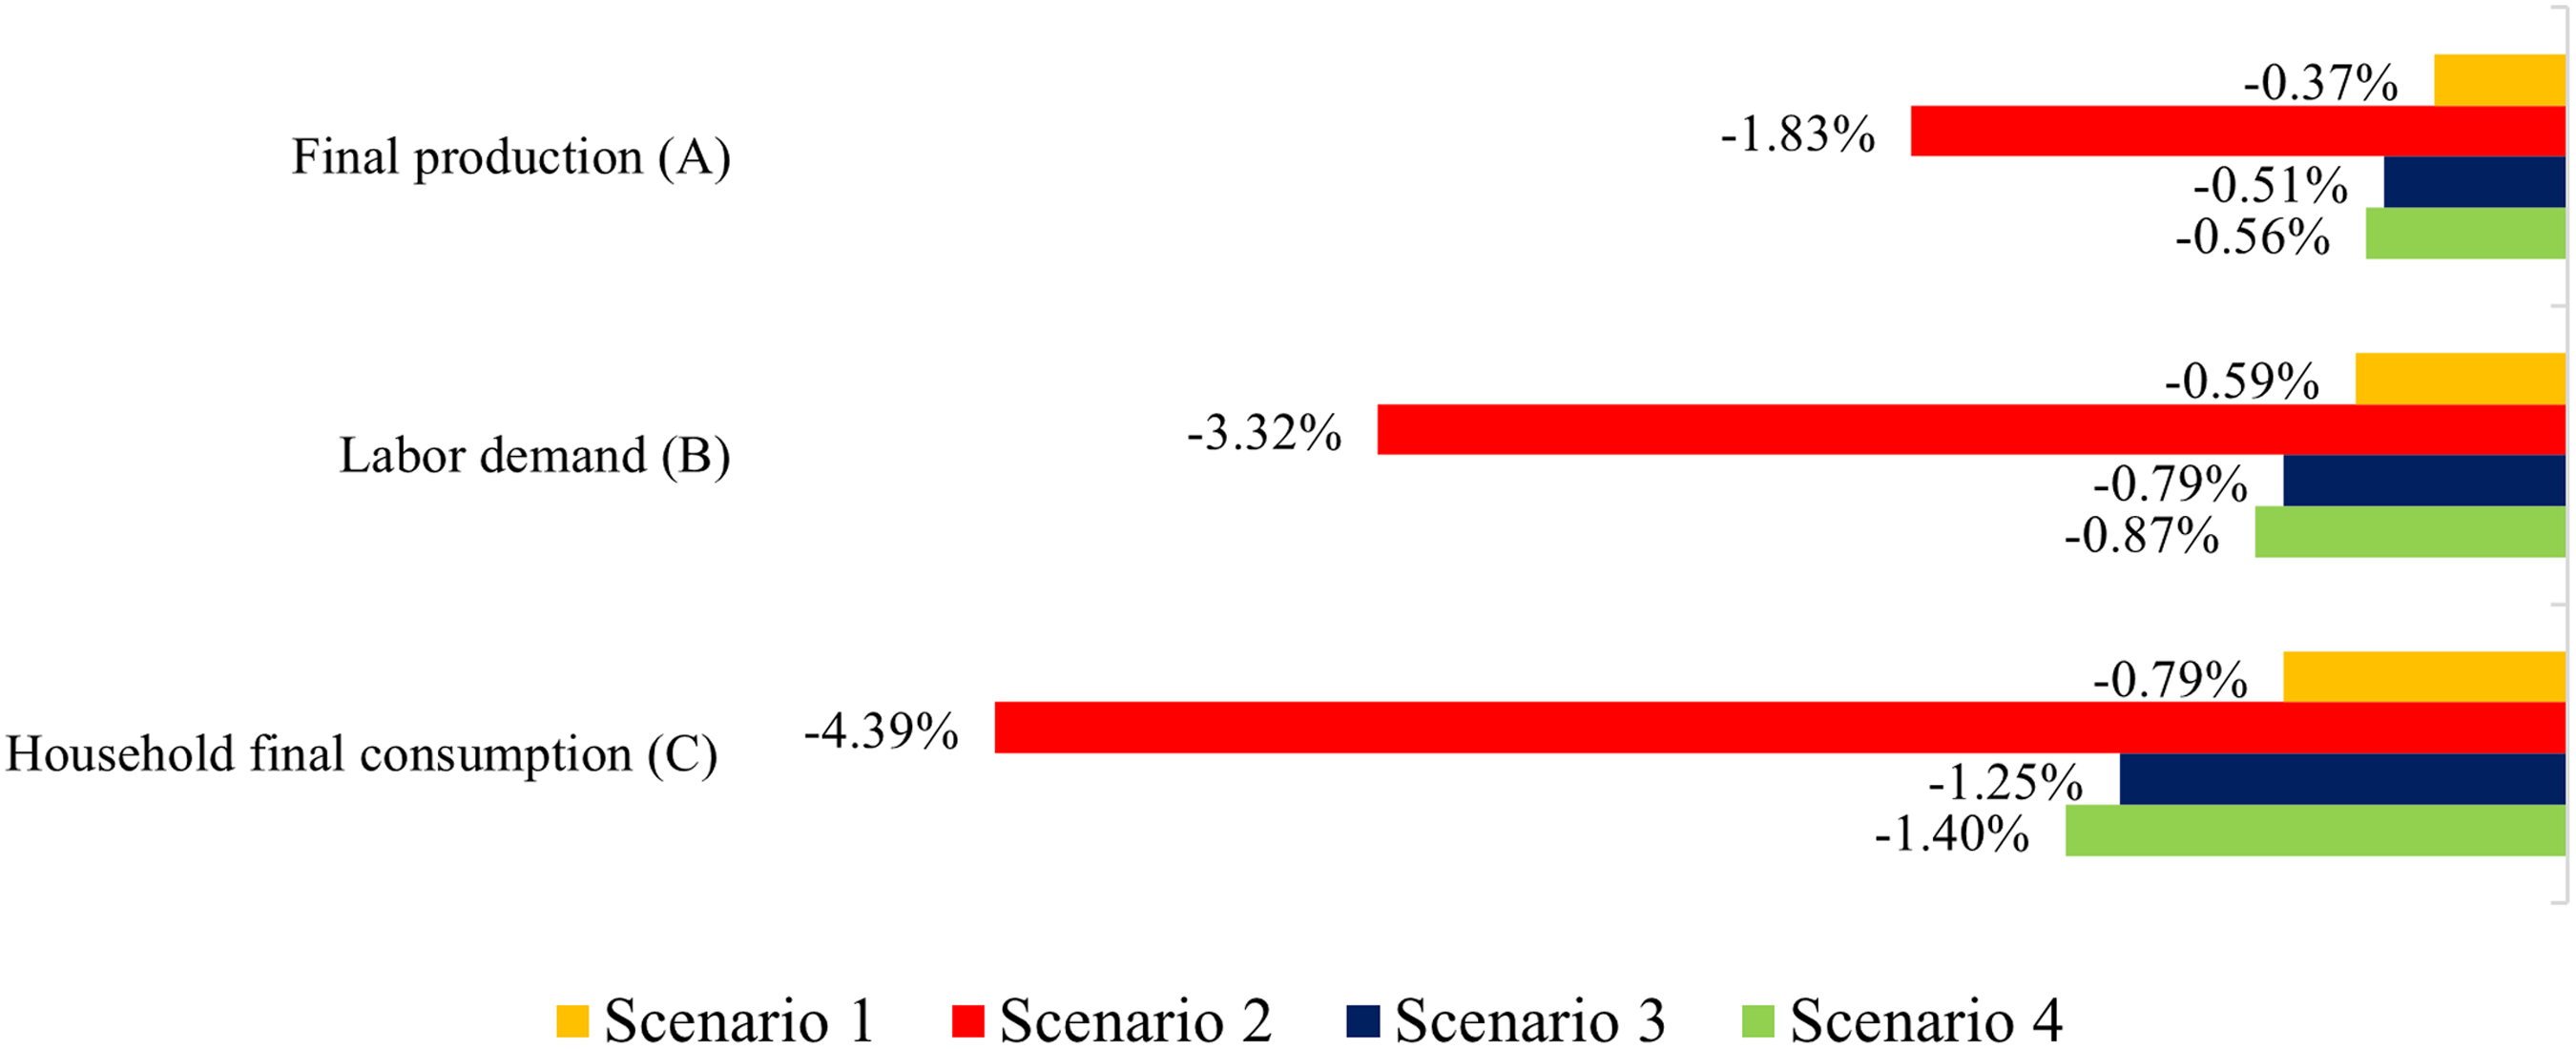
From the demand side, the reform affects both final prices and households’ budget constraints. On the one hand, the increase of the relative prices of final goods (due to higher production costs) would decrease their consumption. On the other hand, because of supply-side effects, a higher aggregate price level would pressure real wages to reduce. This income effect harms households’ purchasing power. At the same time, since household income varies contingent on the movements of firms’ demand for labor, the decrease in employment would result in less aggregate consumption capacity in the economy. The reduction in household final consumption is shown in Figure 4(C).
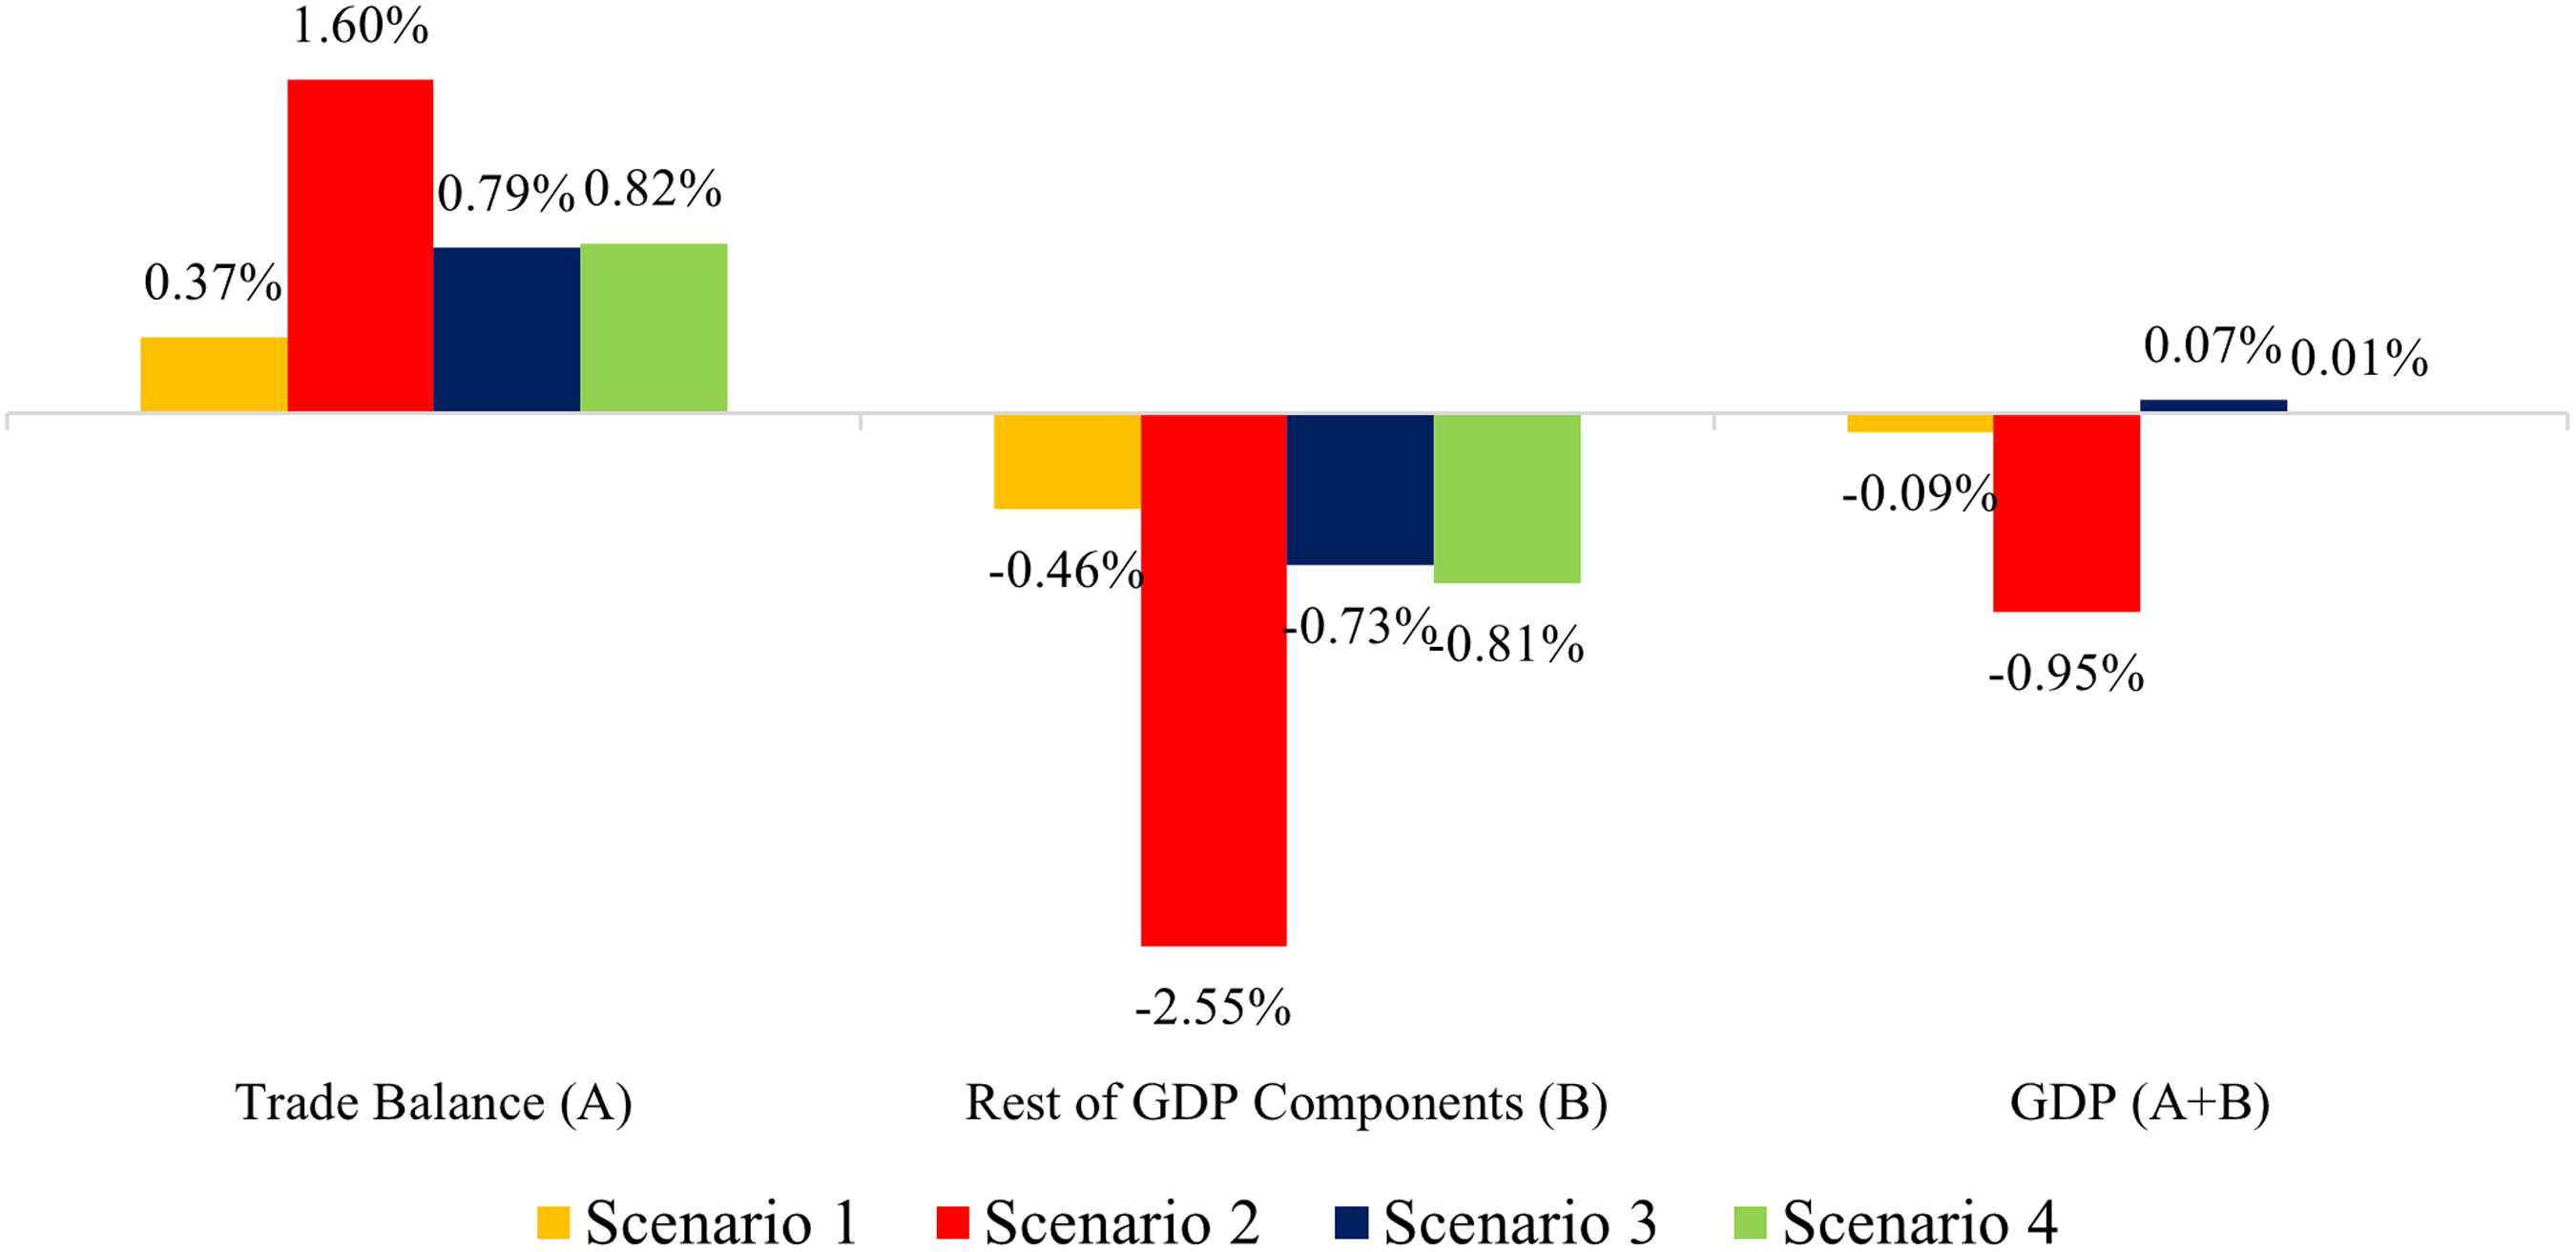
The explanation of the contrasting results between government-led and targeting reforms outstands with the external accounts. Due to the small open economy and fixed nominal exchange rate assumptions, a generalized income crunch would improve the trade balance by decreasing imports and motivating firms to allocate their production abroad. Therefore, economic gains (positive effects on GDP) could be reached by improving trade balance in a higher amount than the household final consumption decrease.
The policy approach to do so needs a focused reform on those households that have a higher imported component in their consumption. This is indeed the case of the two targeting reforms evaluated, as both keep fuel subsidies only for low-income households whose consumption encompasses mainly domestic goods. Figure 5 exhibits those results in which the trade balance offset the impact on the rest of GDP components in the two latter scenarios.
Changes in trade balance and the rest of GDP components (% of baseline GDP).
Sector output
The complementary effect assumed in the production function implies that a hike in prices in some intermediate goods would also deteriorate sectorial factor employment and outputs as is usually seen in subsidies studies (e.g., Li, Shi, and Su Reference Li, Shi and Su2017; Gelan Reference Gelan2018; Roos and Adams Reference Roos and Adams2020; Timilsina and Pargal Reference Timilsina and Pargal2020). Therefore, fuel subsidies reform shall reduce firms’ output as shown in Table 7.
Firms’ real gross value added
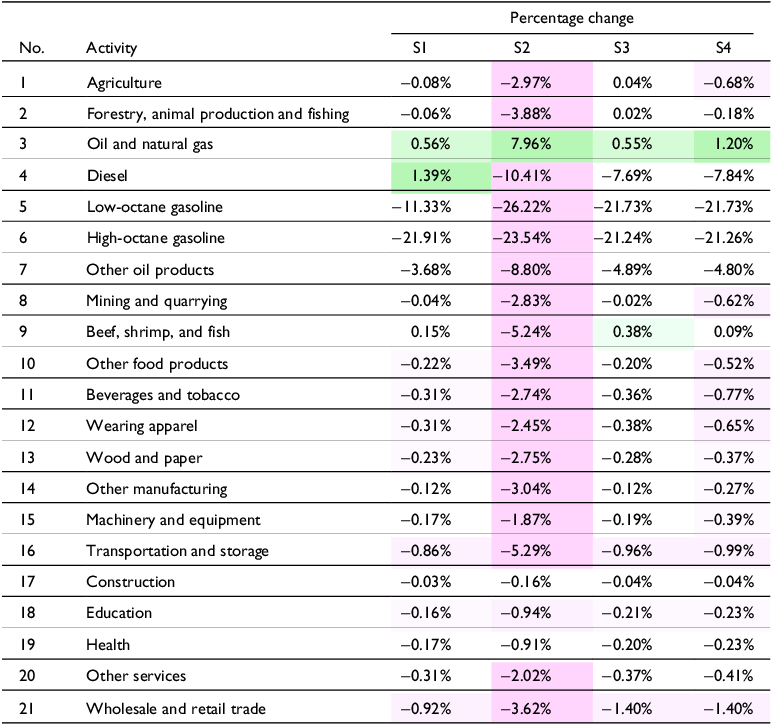
Among the government-led reforms, Decree 619 (scenario 1) has lesser effects than Decree 883 (scenario 2). In the first case, most industries reduce their gross value added by less than 1%. It is explained since the reform modifies only subsidies of gasoline, which has weak forward relationships with the rest of the economy. Then, efficiency effects reduce gasoline production, and the factor mobility assumption allows an increase in gross value added in other oil-related activities, such as diesel production and extraction of oil and natural gas.
On the contrary, Decree 883 (scenario 2, which eliminates diesel subsidies) effects spread more markedly throughout the rest of economic activities. Indeed, gross value added of many activities is reduced more than 2%, which is explained since most industries have an intensive use of diesel relative to other fuels. Data from the SAM reports that the six industries,Footnote 6 which demand the highest amounts of diesel have important strong forward linkages with the rest of the economy. Hence, there is a systemic risk of an output decline after a nontargeted price rise of diesel that is triggered after the removal of fuel subsidies in those six industries.
Among the targeting scenarios (scenarios 3 and 4), changes in non-oil activities remain less than 1% in most of the firms. Despite that targeting scenarios modify diesel subsidies, they show similar effects to scenario 1, which does not. This is a relevant fact that provides the first indication to consider targeting as a plausible alternative to alleviate contagion effects. Since the targeting keeps subsidies for strong-linked industries, the reform is almost innocuous for the direct cost of intermediate goods. Consequently, firms are more resilient and their adjustment on factor employment is lesser.
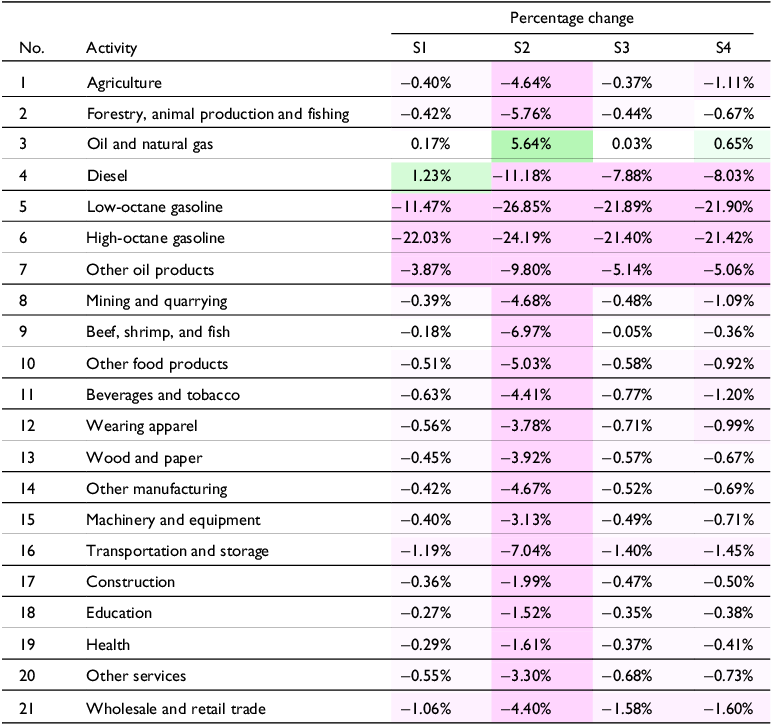
Furthermore, after decomposing the gross value added into the real amount of payment received by each factor of production (compensation of employees for labor in Table 8 and gross operating surplus for capital in Table 9), it is seen that compensation of employees is reduced comprehensively in all scenarios, while returns on capital exhibit a generalized drop only under Decree 883 (scenario 2). As previously discussed, labor turns into the main variable firms curb to ease the negative effect of the cost increases in intermediate goods.
Compensation of employees
Gross operating surplus
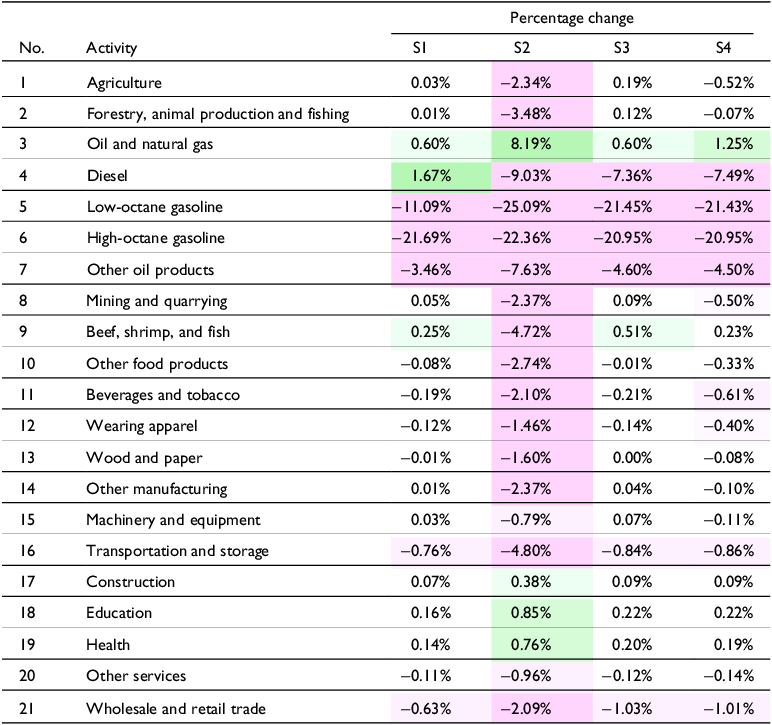
In this sense, it is possible to conclude that in scenarios 1, 3 and 4, a large fraction of firms can mitigate the impact of the reform by reducing their labor force. However, the impact of the complete elimination of subsidies (scenario 2) requires, in addition, a sharp change in their capital structure.Footnote 7
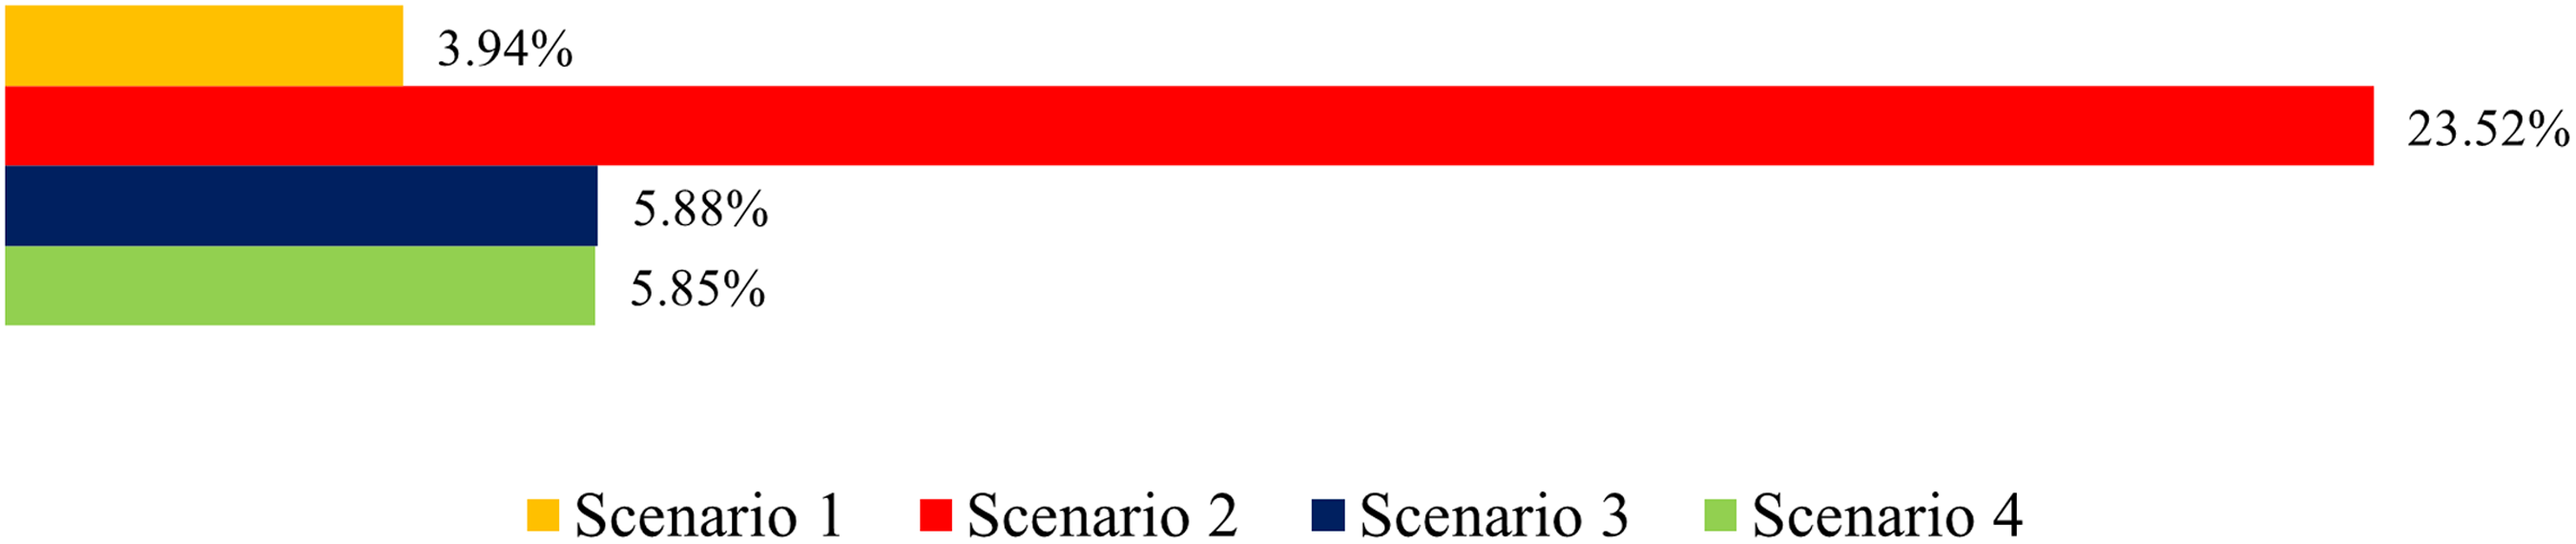
Net tax revenue
As shown in Figure 6, all scenarios improve net tax revenue. This is a coherent result of a sharp decrease in subsidies spending with fixed fiscal expenditure (Solaymani and Kari Reference Solaymani and Kari2014; Li, Shi, and Su Reference Li, Shi and Su2017; Timilsina and Pargal Reference Timilsina and Pargal2020). Figure 7 shows a small decrease in tax revenue from the collection of direct and indirect taxes, due to the economic slowdown.
Percentage changes in net tax revenue.
Percentage changes in direct and indirect tax revenue, and subsidies.
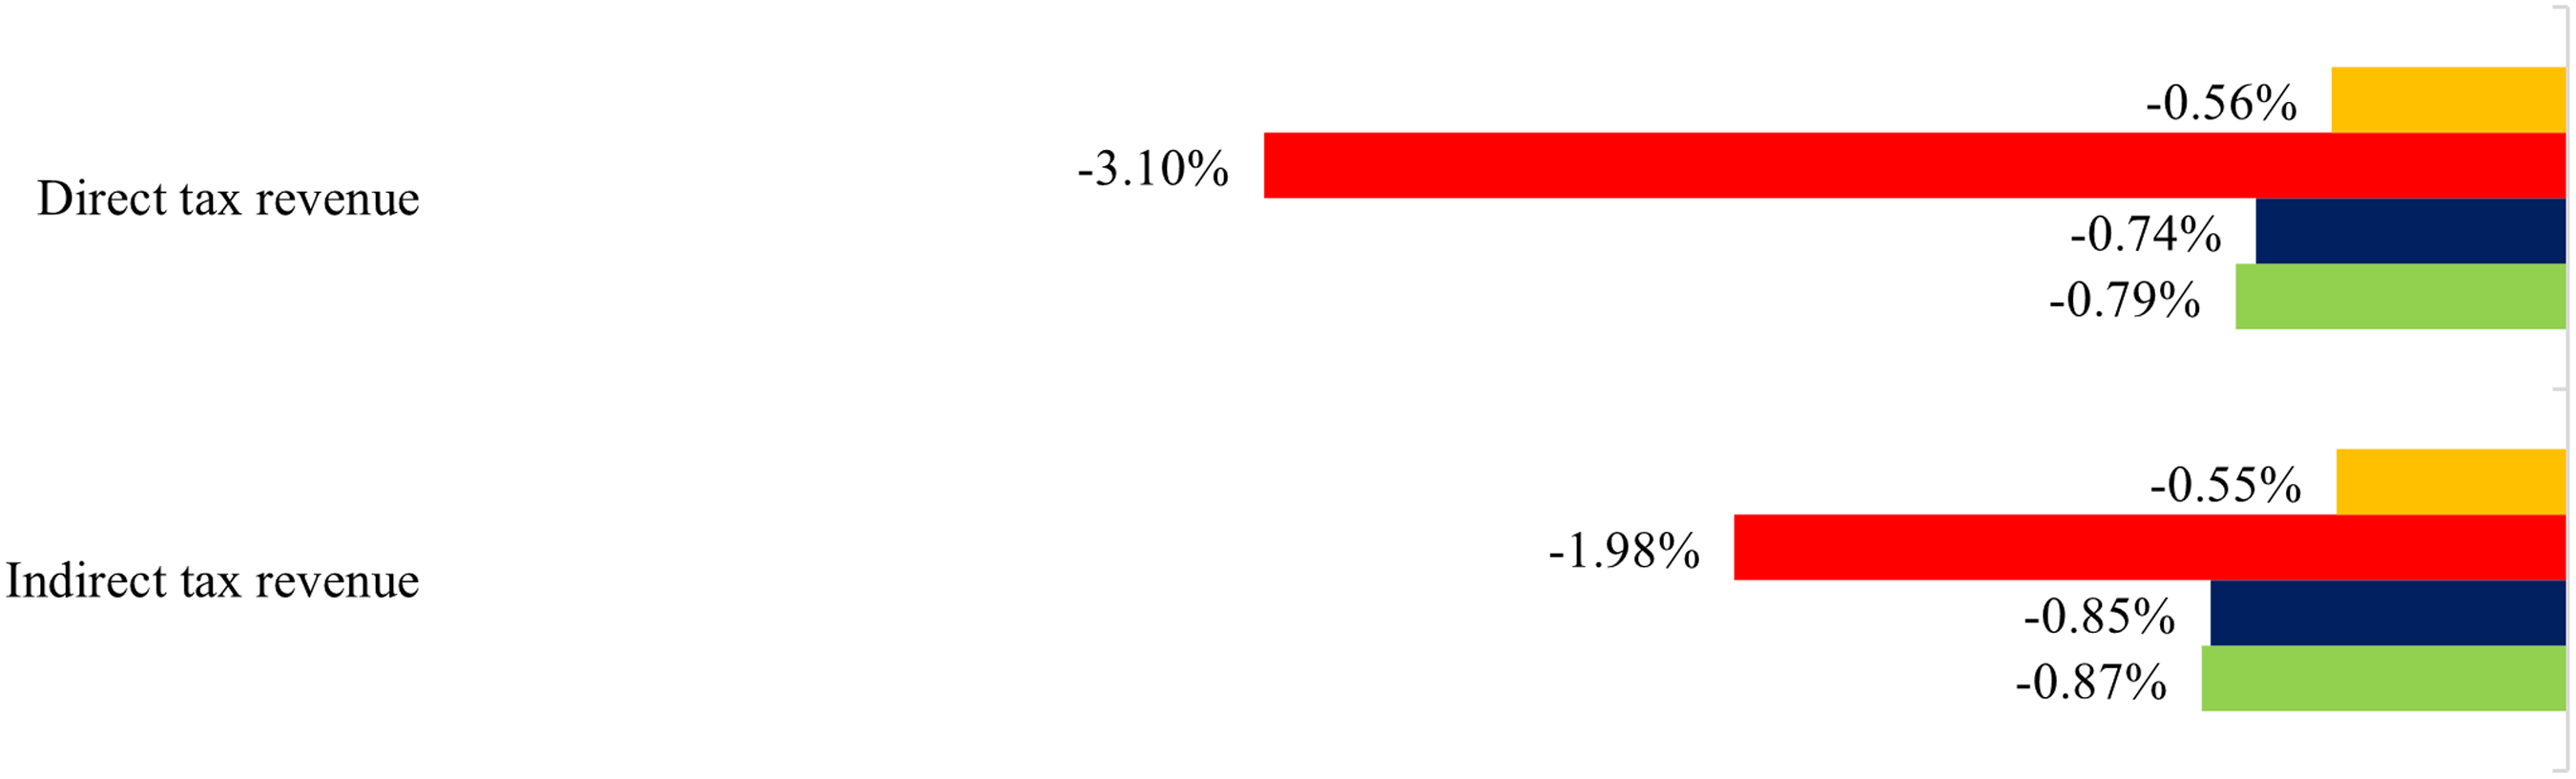
Among the government-proposed reforms, Decree 883 (scenario 2) exhibits the highest increase in fiscal revenue (23.52%), although a significant reduction in tax collection is also observed. The targeting scenarios show similar fiscal effects, with an increase of 5.88% and 5.85% in fiscal revenue, depending on whether households or both households and firms are targeted, respectively.
Household final consumption
Table 10 shows the percentage changes in household final consumption at constant prices. Under Decree 619 (scenario 1), it shrank by –0.79%. This negative variation is largely explained by a reduction of over 33% in the consumption of high-octane gasoline and 1.28% in the consumption of transportation services. Variations for the rest of the goods remain between –0.08% and –0.53%.
Real household final consumption
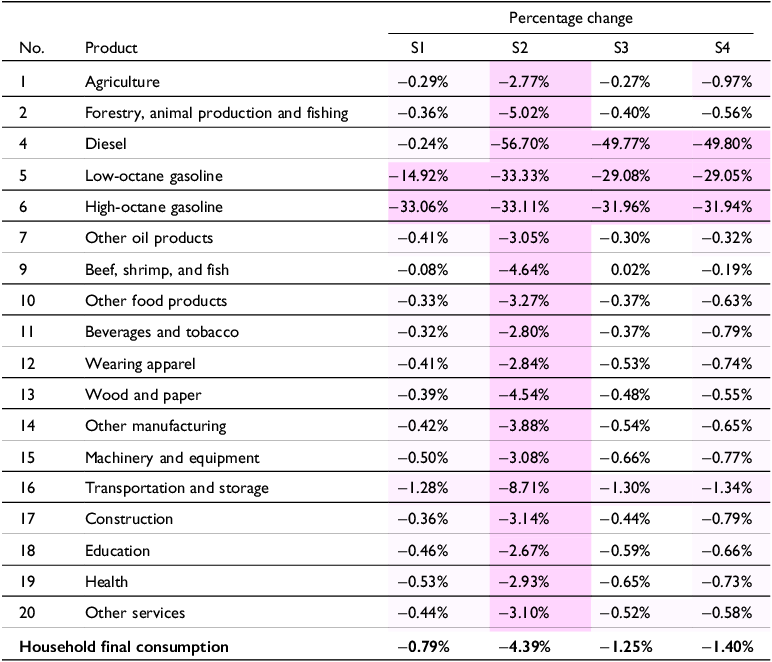
Note: Only goods included in the household basket are shown.
In the second scenario (Decree 883), the greatest decrease in consumption is an indirect result of the inclusion of diesel in the fuel subsidies reform, a generalized rise in consumer prices and a decline in the labor demand. Setting aside fuels and transportation services, the differences in final consumption fluctuate between –2.67% and –5.02% for the remaining goods.
The targeting scenarios present similar effects. The differences between both alternatives are explained by the final consumption (scenarios 3 and 4) and the intermediate consumption (scenario 4) approaches used to target diesel subsidies. When targeting is applied exclusively to households, consumption reduction is lesser than with a reform that also targets intermediate consumption. Despite this, the differences between both scenarios do not exceed 0.7%, suggesting that targeting intermediate consumption based on the productive linkages criteria could mitigate the impact on consumer prices. This is a consequence of applying the reform only to firms that do not have strong linkages with the rest of productive activities.
Welfare and income distribution
Given the social unrest that fuel subsidies reforms could enhance, we estimated the effects on welfare and income distribution to provide guidelines for further efforts to policymakers. Like other studies (Li, Shi, and Su Reference Li, Shi and Su2017; Nong Reference Nong2018; Breisinger et al. Reference Breisinger, Mukashov, Raouf and Wiebelt2019) we first approximated the effects on welfare with the equivalent variation (EV), which could provide an indication of the losses for each scenario in monetary terms. It estimates the amount by which household income must be reduced to reach the same welfare loss produced by the previously discussed scenarios.
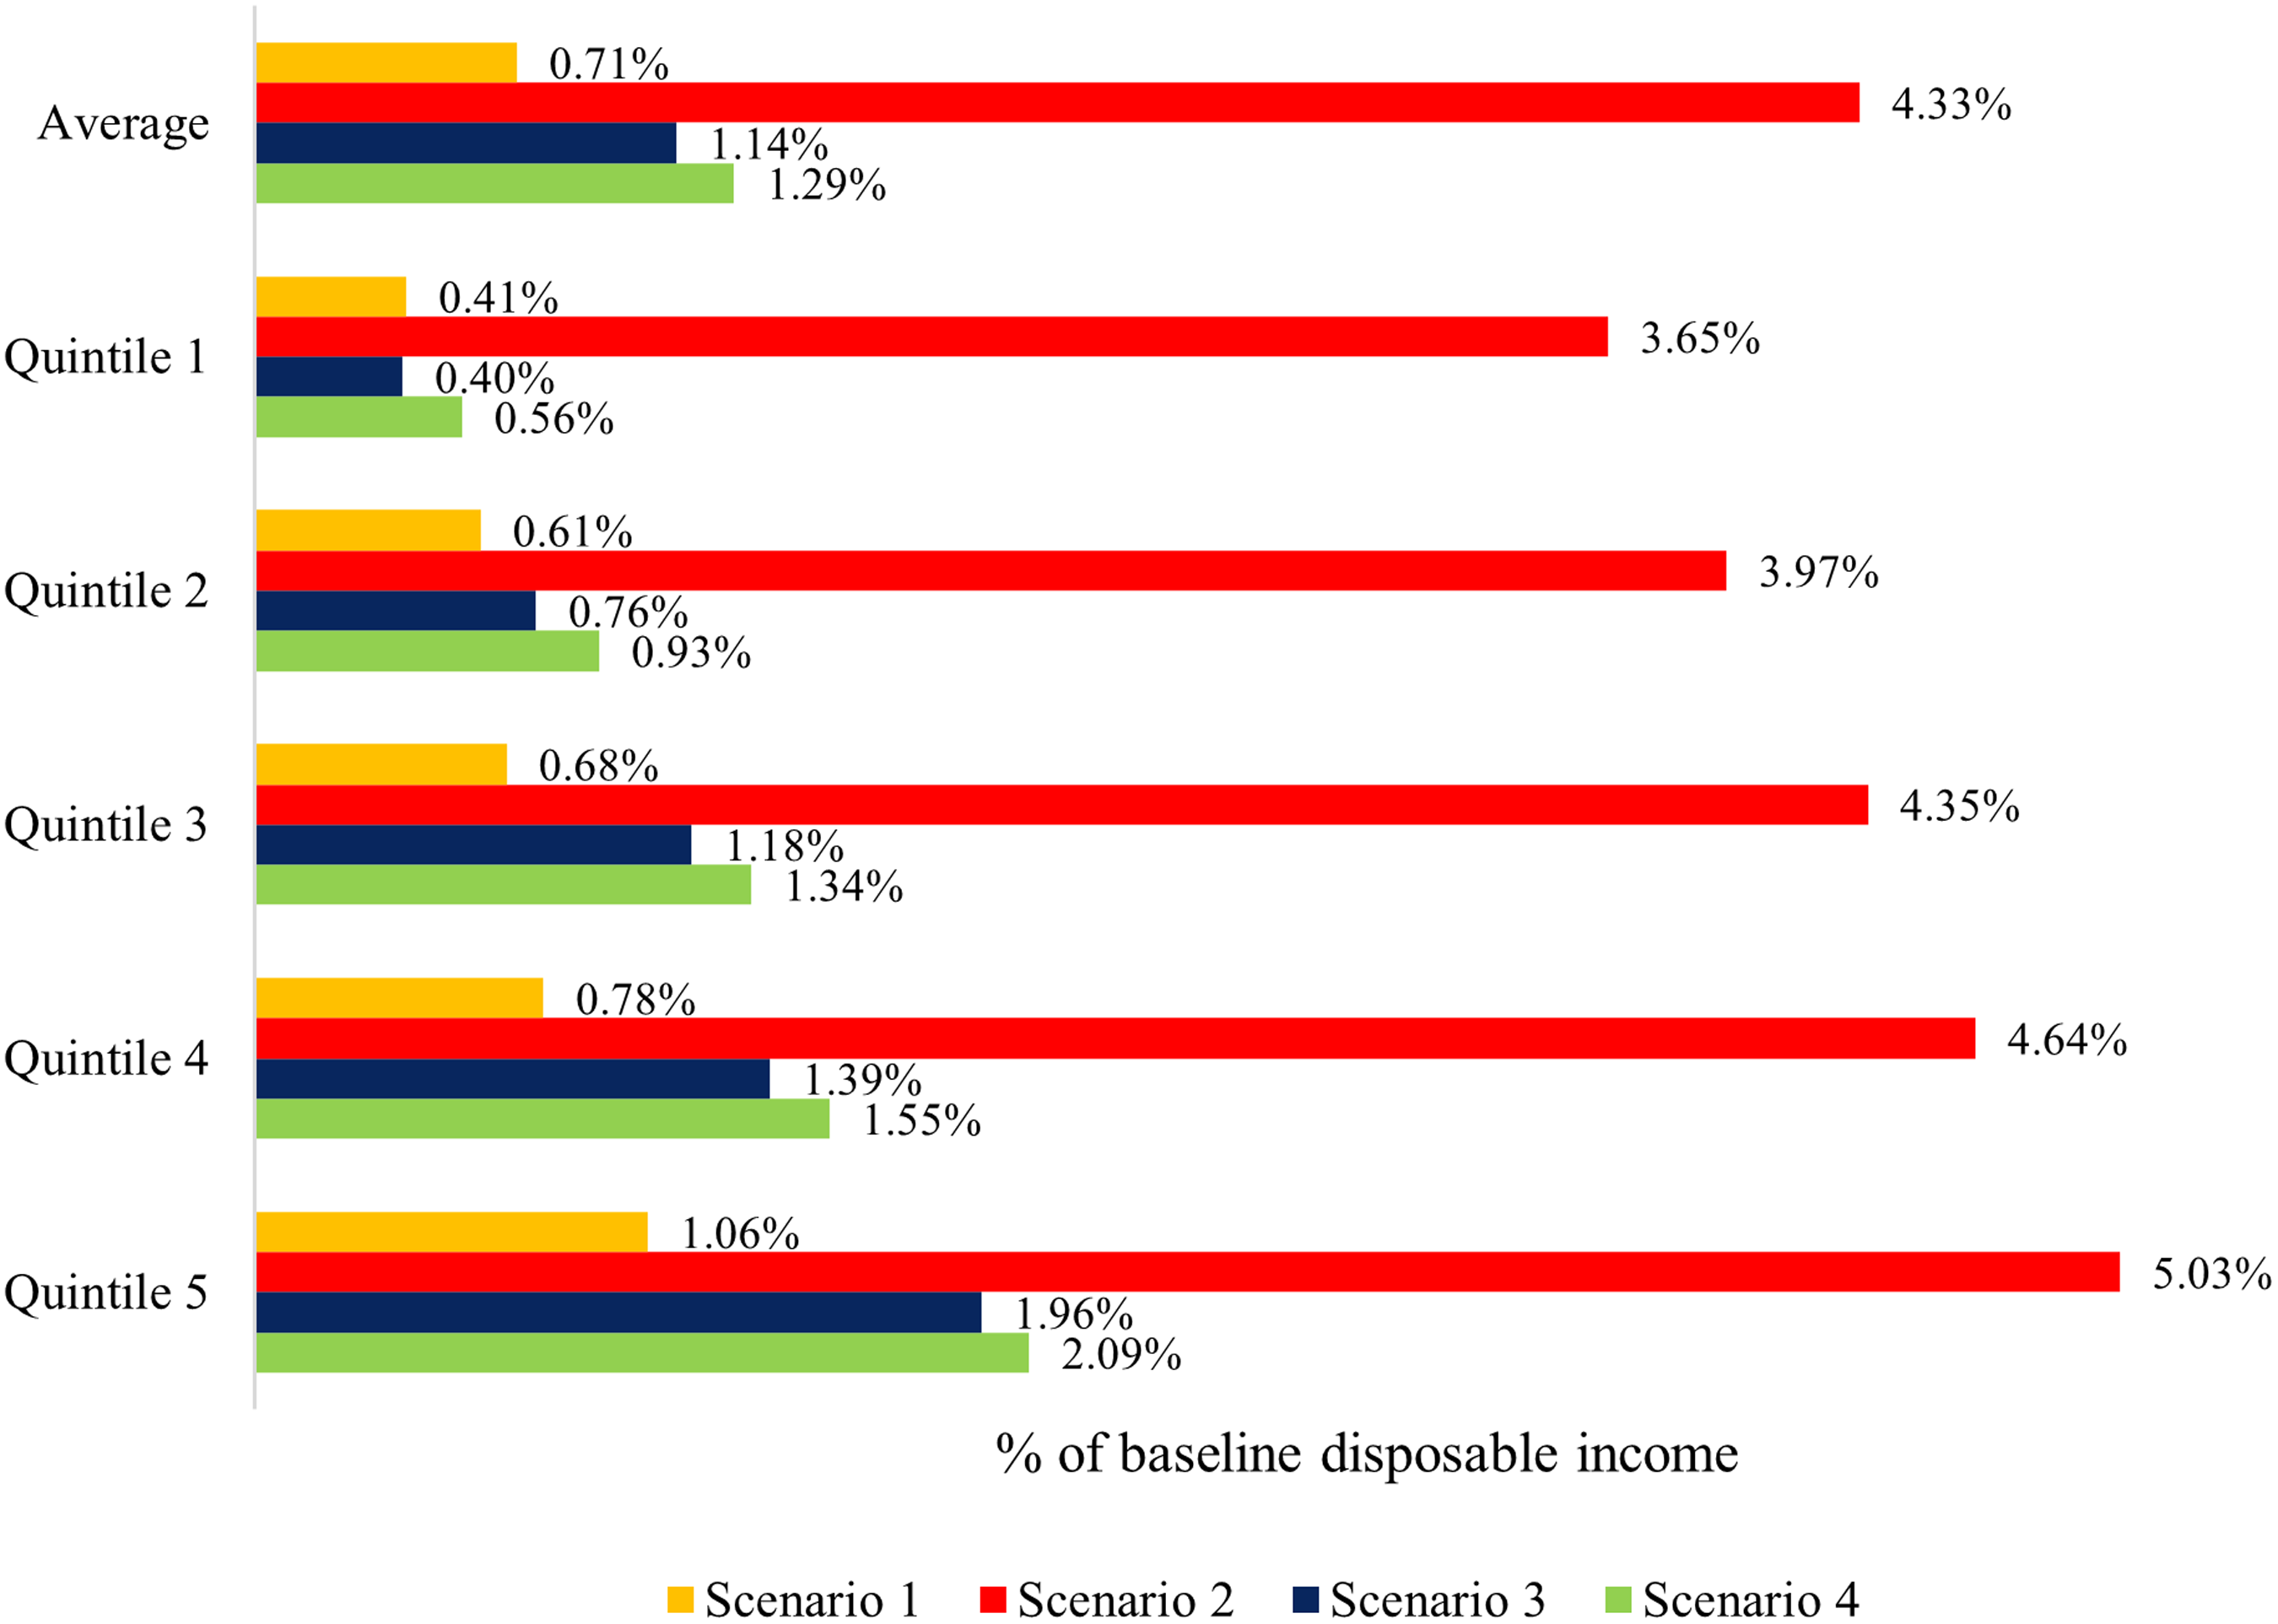
As seen in Figure 8, in terms of the baseline disposable income, the average monthly dropping per household according to EV equals 0.71% in the first scenario and reaches up to 4.33% when all subsidies are eliminated (scenario 2). Results by income quintile suggest that all losses would follow a progressive pattern since they monotonously increase as they reach the wealthiest quintile. The main explanation of this pattern is the regressive effects of gasoline and diesel subsidies in Ecuador –a hypothesis widely discussed in the Ecuadorian literature (see e.g., Jara et al. Reference Jara, Chun Lee, Montesdeoca and Varela2018; Schaffitzel et al. Reference Schaffitzel, Michael Jakob, Vogt-Schilb and Ward2020). Therefore, despite the intensity of the subsidy change, the main losers of the reform would be the richest. However, there is apparently no winners since the poorest households are worse off by the subsidy changes in all scenarios.
Equivalent variation (% of baseline disposable income).
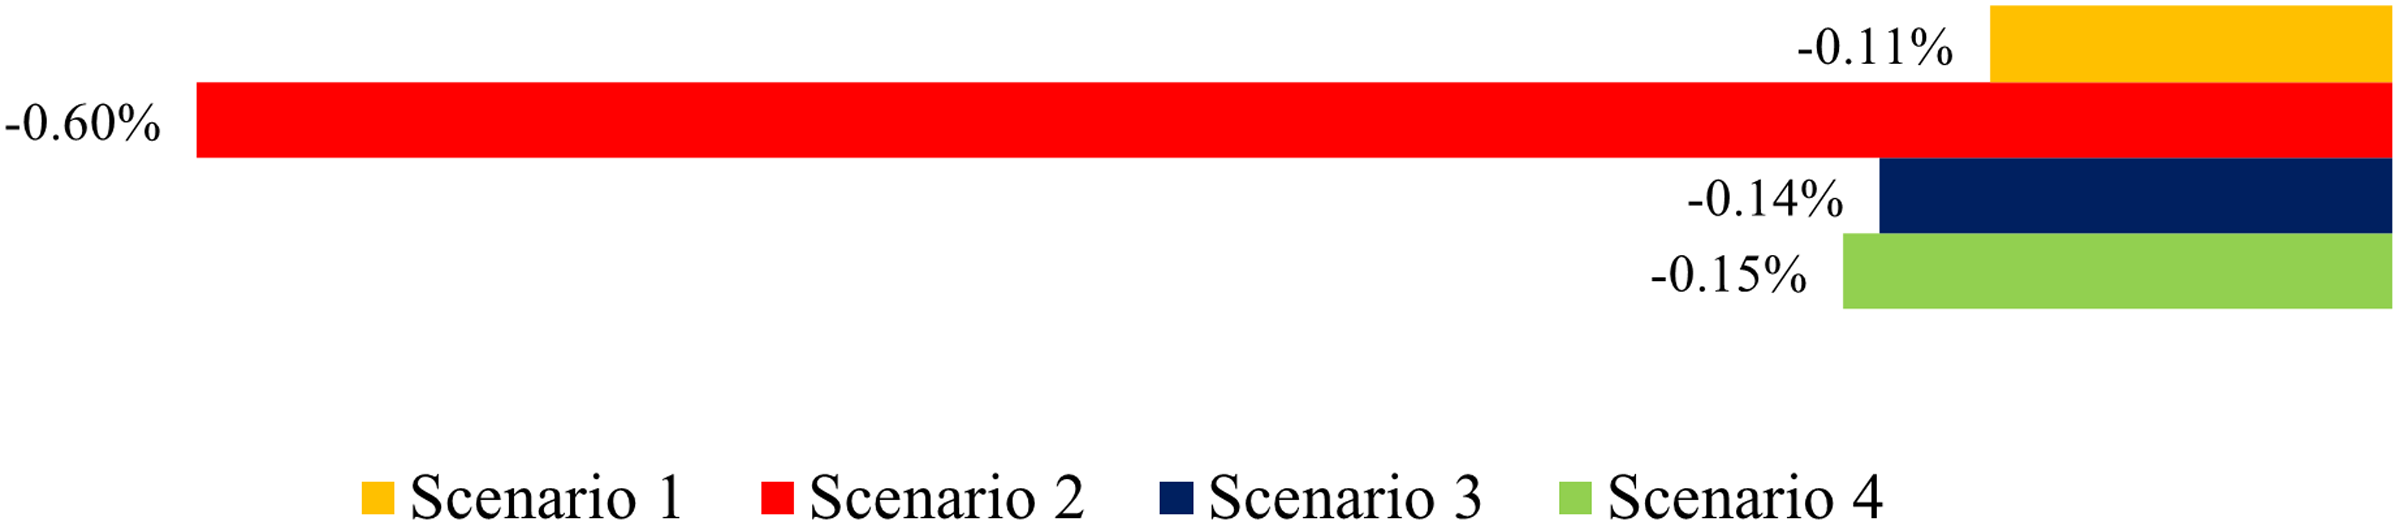
Considering the results on welfare, it would be expected a decline in inequality, so the effects are tested following the Gini approach. Footnote 8 The changes on the Gini coefficient show a more equitable distribution afterwards, with a much more marked impact on scenarios that eliminate a greater portion of the subsidies (Figure 9).
Percentage changes in the Gini coefficient.
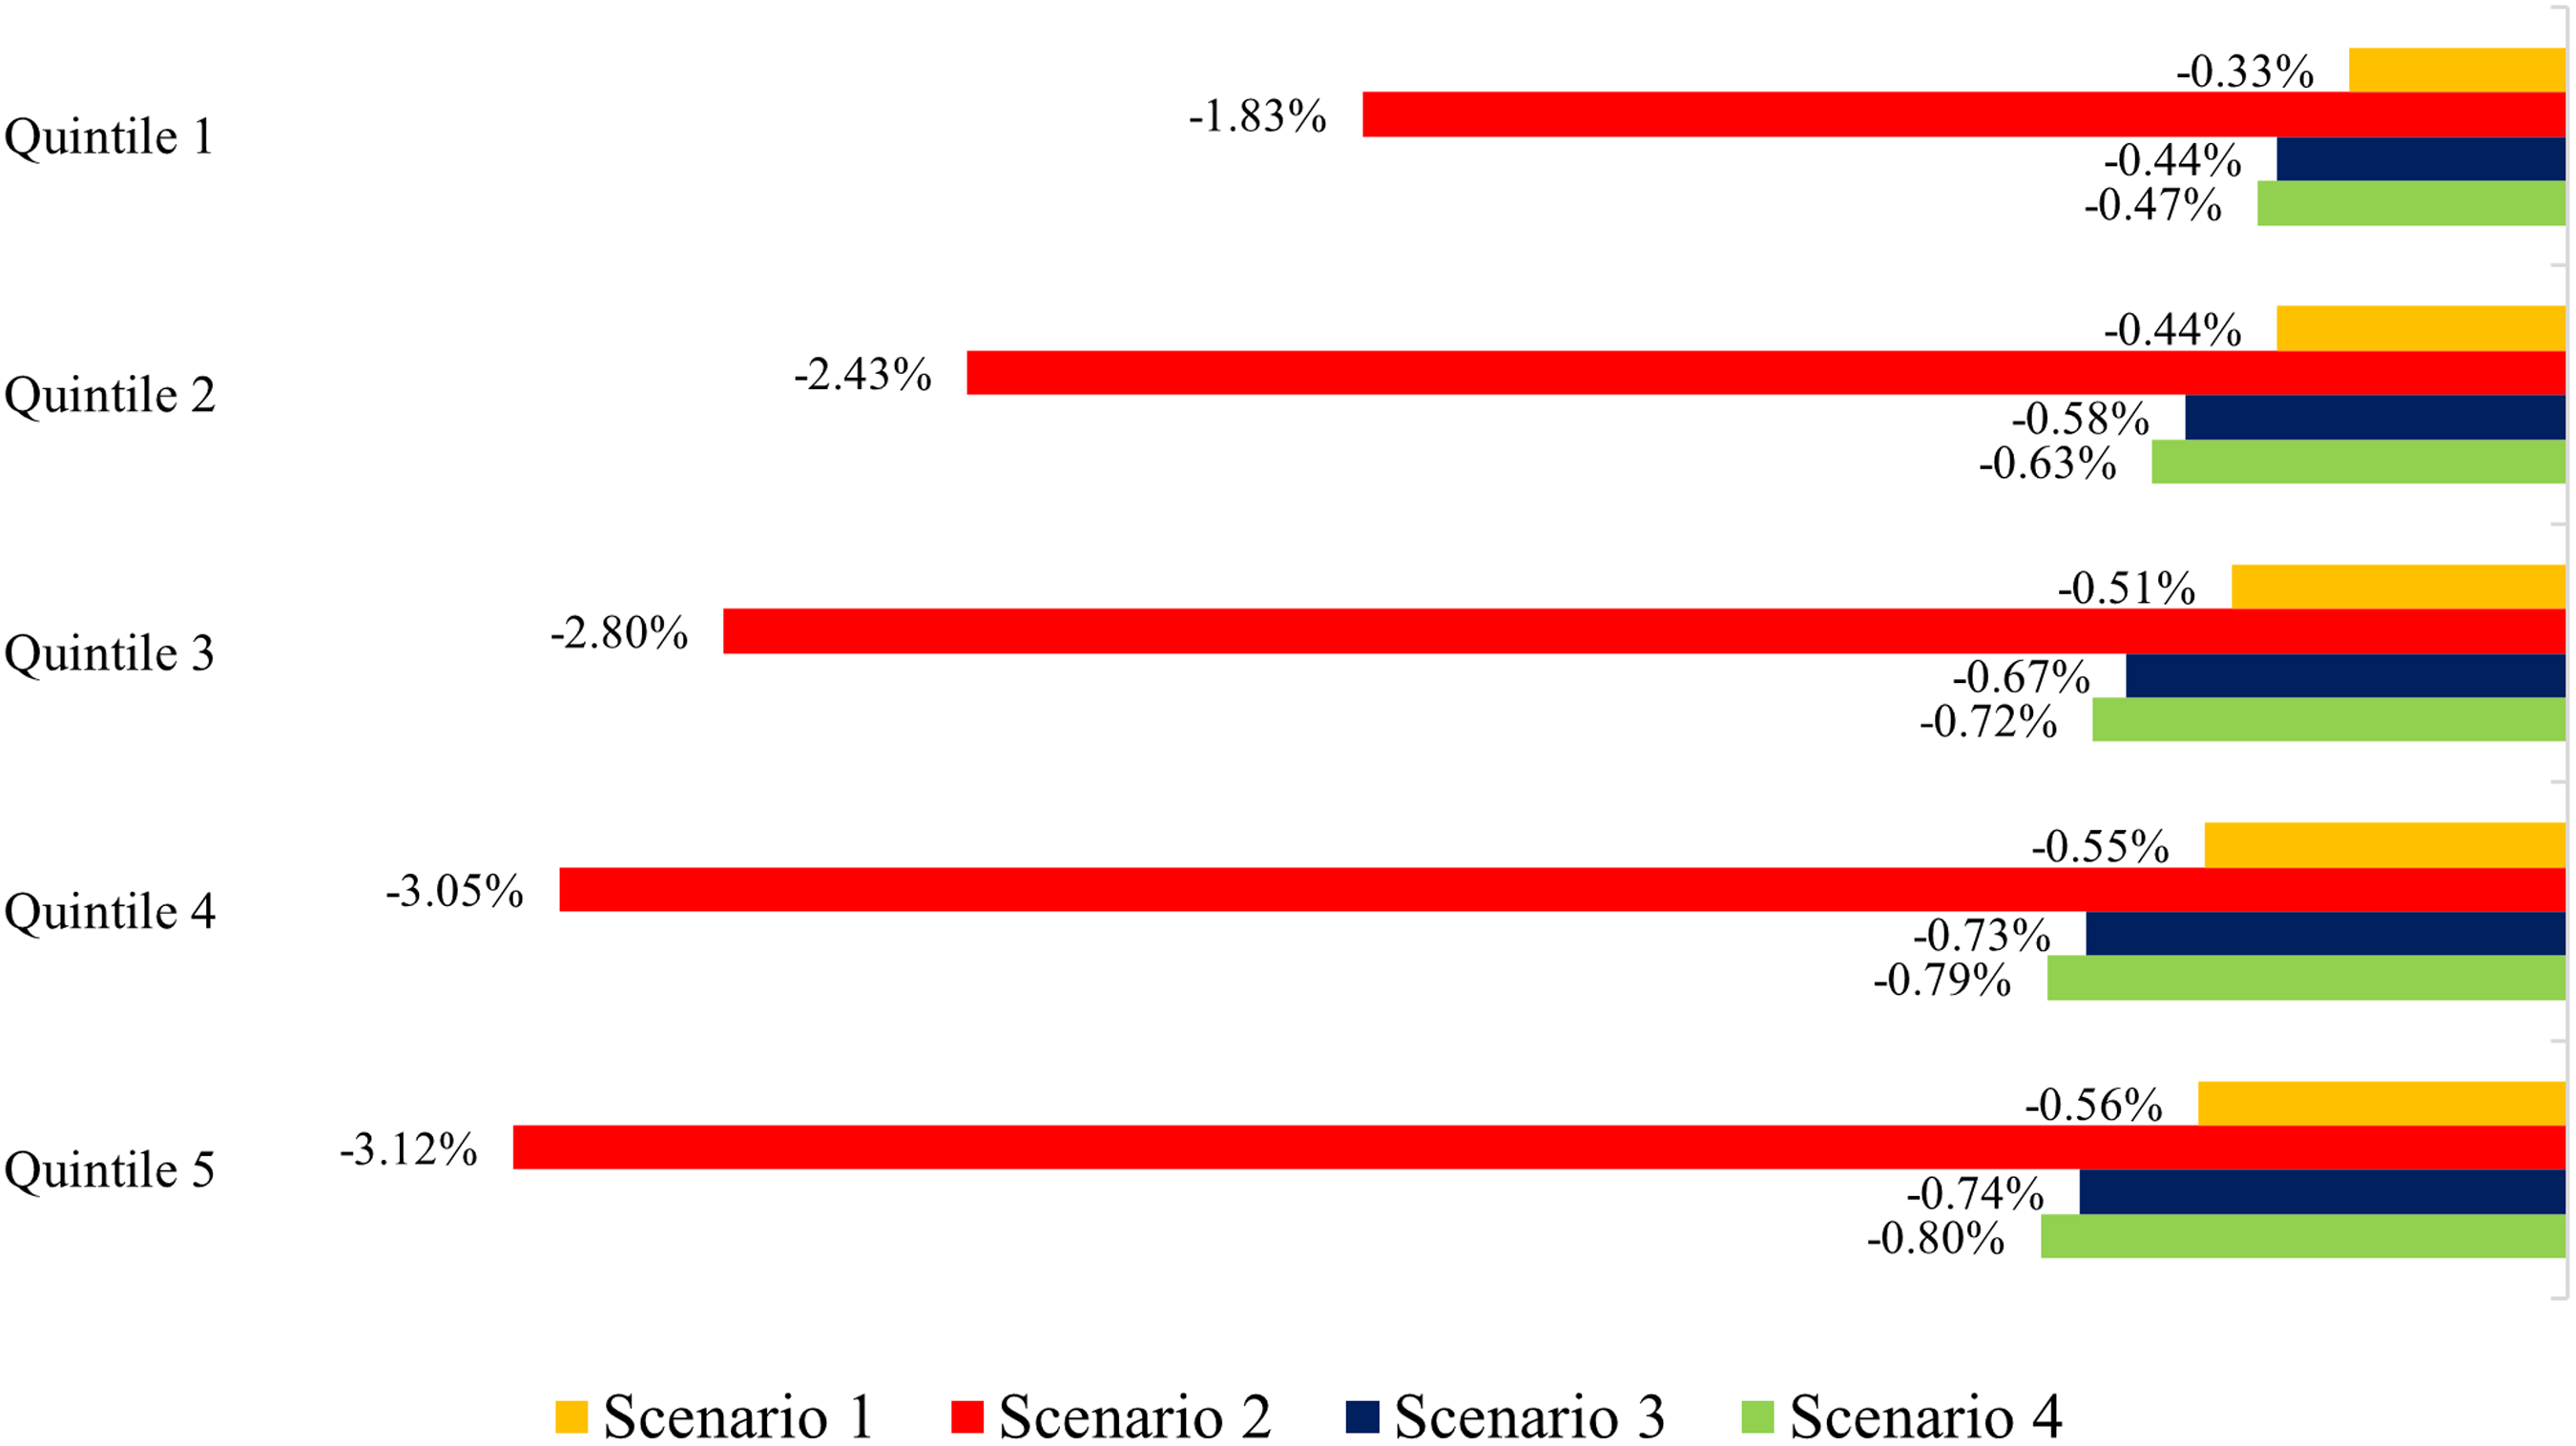
These variations on the Gini index could be explained by revisiting the effects on quintile’s income. Figure 10 shows that there would be a progressive decline among quintiles whose intensity depends directly on the extent of the reform –similar results to those found in Abouleinein, El-Laithy, and Kheir-El-Din (Reference Abouleinein, El-Laithy and Kheir-El-Din2009), Mastronardi and Mayer (Reference Mastronardi and Mayer2015), Elshennawy (Reference Elshennawy2014), Li, Shi, and Su (Reference Li, Shi and Su2017), Jara et al. (Reference Jara, Chun Lee, Montesdeoca and Varela2018), and Schaffitzel et al. (Reference Schaffitzel, Michael Jakob, Vogt-Schilb and Ward2020). These variations are mainly explained by the increase in the consumer price index (CPI) and the decrease in firms’ labor demand. Again, the most notorious effects correspond to scenario 2 (Decree 883), which negatively affects the disposable income of the poorest quintile by 1.83% and by 3.12% for the richest quintile. For scenarios 1, 3, and 4, the negative effects of the reforms on the poorest quintile do not surpass 0.5% (0.33%, 0.44% and 0.47%, respectively) and for the richest quintile they remain below 0.8 % (0.56%, 0.74% and 0.80%, respectively).
Percentage changes in household disposable income by quintile.
As it could be inferred, the improvement in income distribution is not the result of positive development in the situation of the poorest quintiles. On the contrary, but similar to the results on welfare, the effects show a generalized—albeit progressive—drop in the disposable income of all quintiles. Therefore, it is necessary to explore the impact on the vulnerability of the poorest household.
While the model cannot quantify the effects on microeconomic poverty indicators, it is possible to macroestimate it. Defining the vulnerability of the poorest household as the closeness of its disposable income to the poverty line, Footnote 9 we can estimate the changes given the CPI variations within each scenario. Footnote 10 Figure 11 shows these results.
Percentage changes in the vulnerability of the poorest household. As with the Gini coefficient, this is a macrodata approximation. More precise quantifications of poverty indicators would require microsimulation tools.
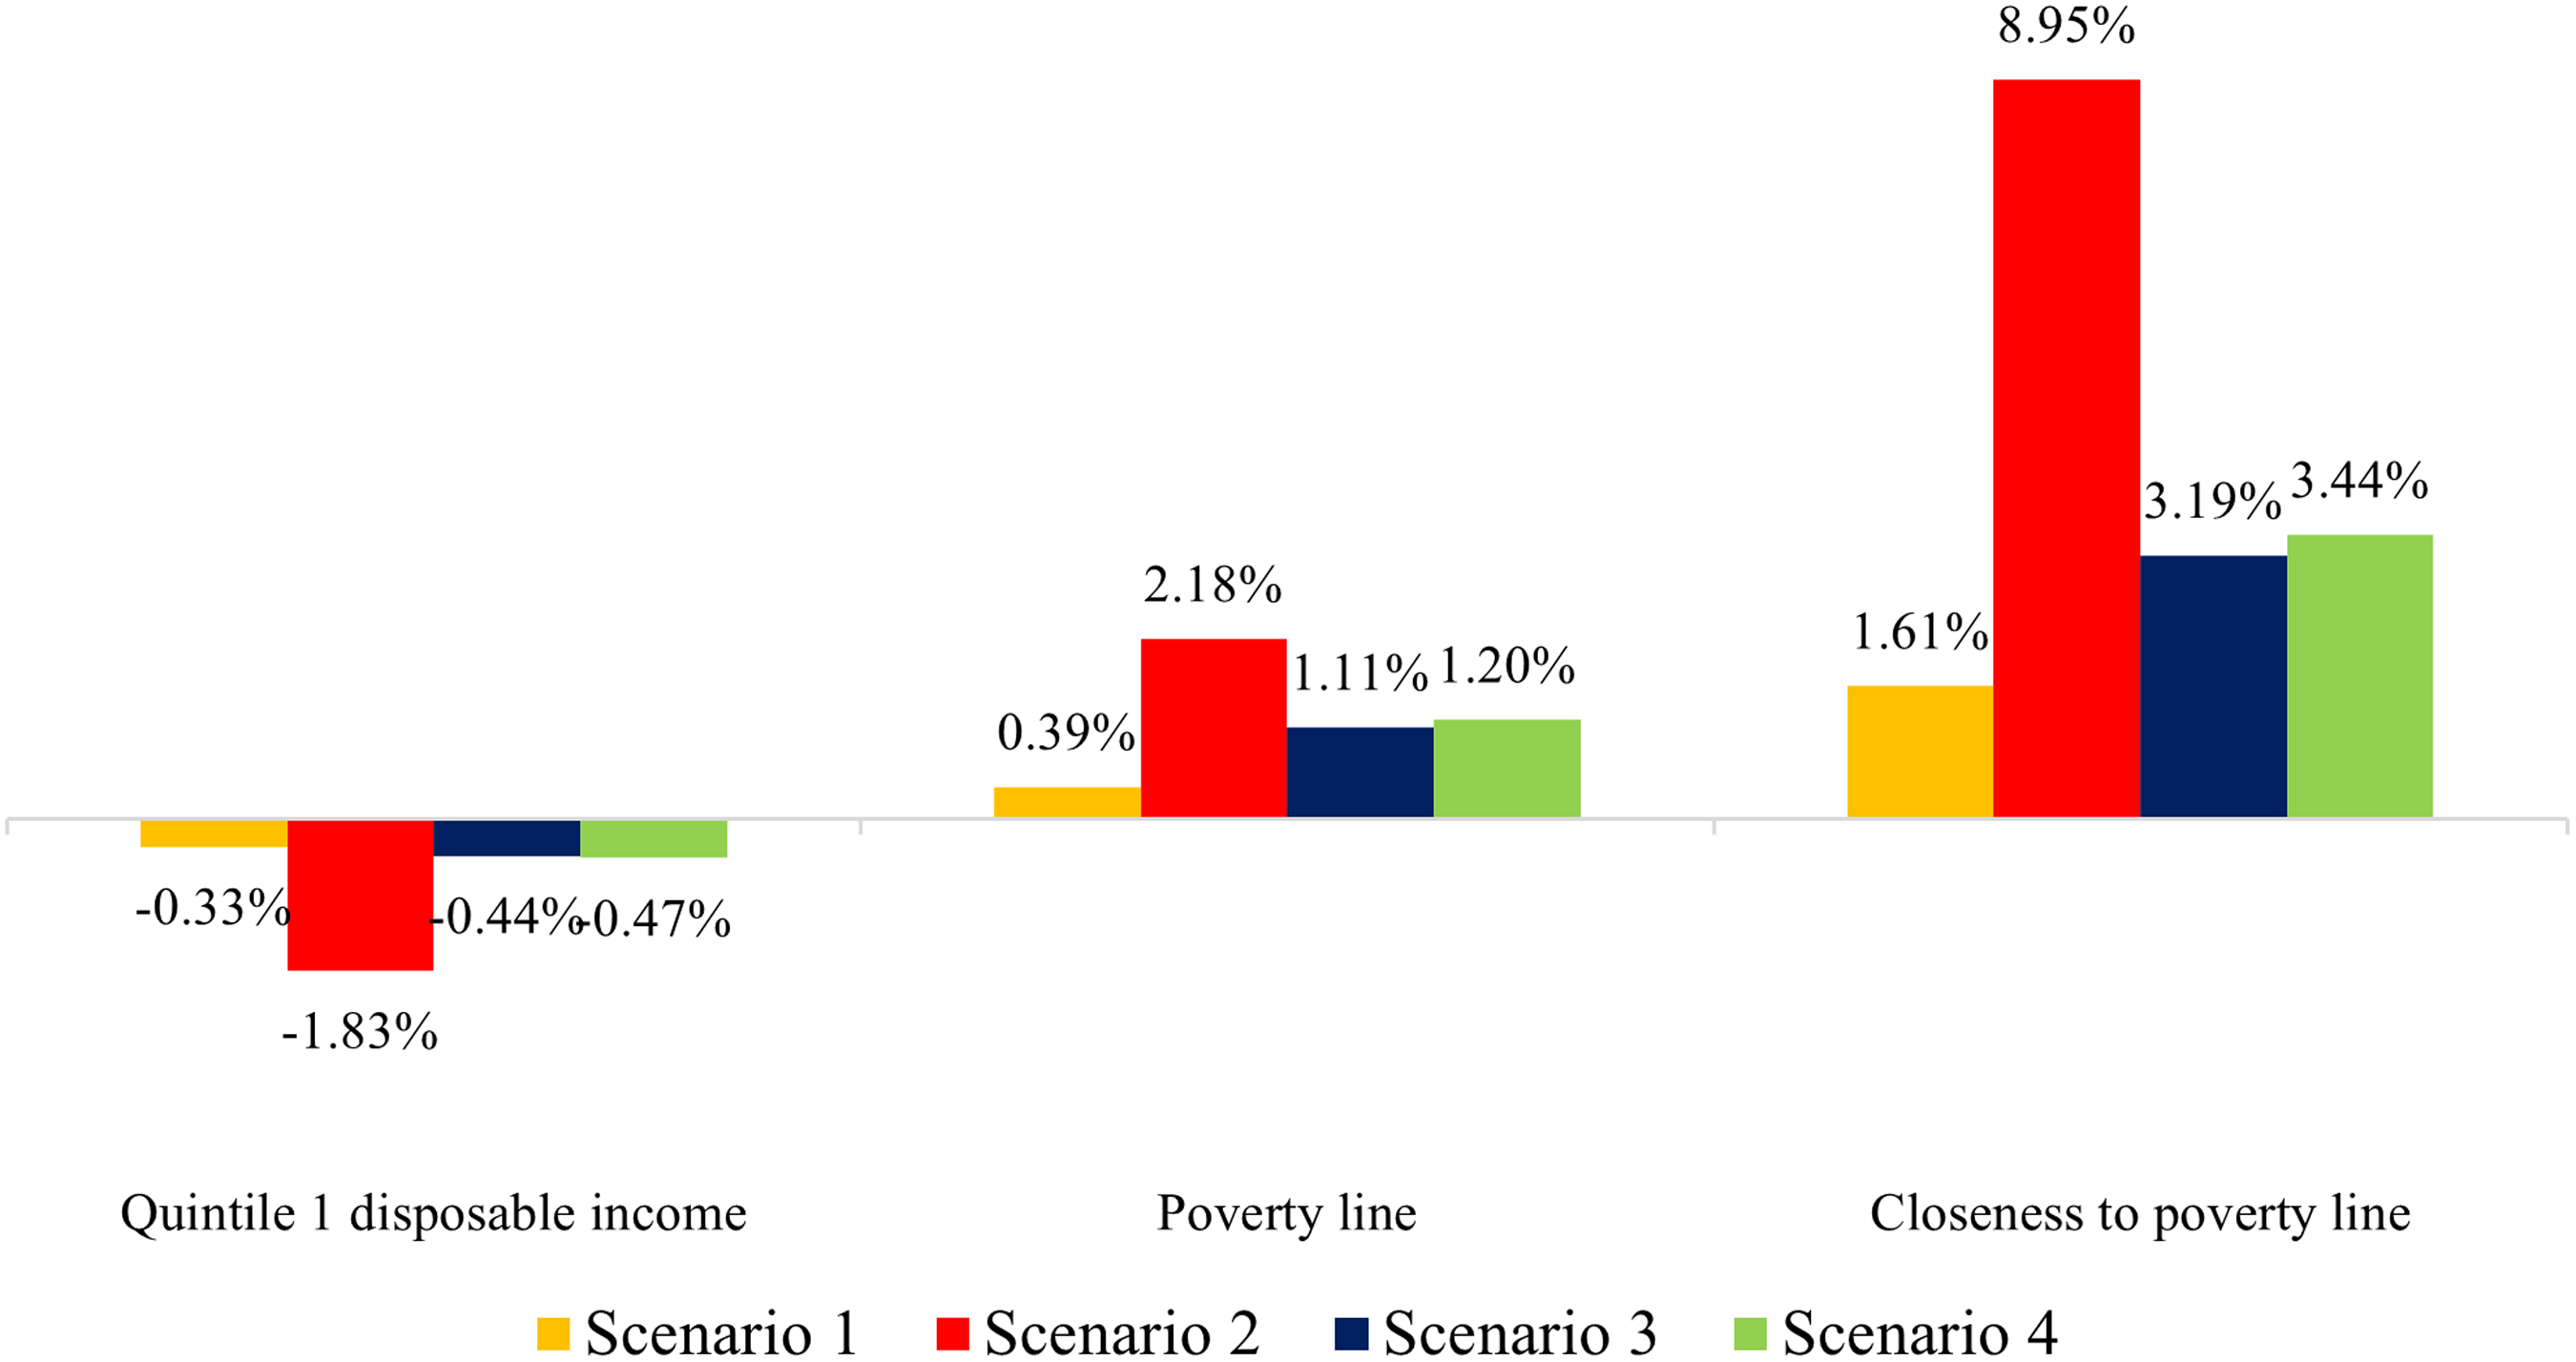
In scenario 2, which showed a 0.60% improvement in the Gini coefficient, the reduction in the disposable income of the poorest quintile is 1.83%, while the poverty line increases by 2.18%. These results imply that its income is 8.95% closer to poverty line. Although less pronounced, something similar occurs in the rest of the scenarios.
The analysis suggests that, even with targeting, the impact of fuel subsidies reform on the vulnerability of the poorest quintile cannot be alleviated, and may be summarized as follows:
-
Fuel subsidies reform improves income distribution but may lead to a decline in welfare or even aggravate the vulnerability of the poorest quintile.
-
Targeting is not enough to combat the negative effects on the disposable income of the poorest quintile; direct cash transfers would likely be required to achieve this.
Conclusions and policy implications
This article assessed the macroeconomic effects of new reforms to fuel subsidies policy that consider targeting mechanisms in Ecuador. The main contribution to the body of research on subsidies in Ecuador is the use of a quantitative general equilibrium approach.
First, two government-proposed reforms to modify fuel prices were evaluated, to later serve in illustrating the advantages of opting for targeting alternatives. The results were assessed in terms of GDP, net tax revenue, and several indicators corresponding to firms and households.
On the first evaluation scenario, Decree 619, reforming the gasoline subsidy causes a decrease in GDP. This effect is largely described by the firms’ response to the change through an adjustment in factor employment. The brunt of this adjustment is passed on to labor. Then, this response harms household income, and final consumption diminishes as a result. Consequently, aggregate demand is reduced. Last, although tax collection suffers negative variations because output and income decrease, fiscal revenue improves due to the drop in subsidy spending.
A 100% cut to fuel subsidies, Decree 883, exacerbates the negative impact on output. In this scenario, the reduction in firms’ labor demand is not enough to offset the effect; therefore, firms are forced to adjust the return on capital. Moreover, the resulting increase in the cost of intermediate goods causes a systemic effect on final goods prices that further decreases household consumption. The impact of the shock on tax collection is important. Still, the decrease in subsidies spending continues to be decisive for significant growth in fiscal revenue. Regarding income distribution, eliminating subsidies allows for a better outcome. However, the effect is a consequence of a generalized—albeit progressive—drop in welfare and disposable household income, as opposed to an improvement in the situation of the poorest quintiles.
Conversely, the assessment of the targeting alternatives toward households and firms suggests that those proposals could help mitigate the negative effects of subsidy reform. It is even conceivable to achieve a small level of growth, depending on the magnitude of the trade balance improvement. Both alternatives have similar effects because of properly incorporating progressiveness and productive linkages criteria. Nevertheless, since the second targeting option yields a very similar outcome as the first one, it could constitute the first step towards the use of more efficient energies in production, particularly if it could be accompanied by tax incentives. Still, even though targeting improves the outcome for the poorest quintile compared to the Decree 883, further studies should revisit compensation mechanisms for offsetting the negative effects on the welfare of this segment of the population.
Owing to the severity of untargeted alternatives, the recommendation is to opt for gradual reforms, especially if they are implemented in times of low economic growth and high political tension. Future research could explore the possibility of connecting this analysis to a microeconomic evaluation tool to accurately quantify the effects on relevant microvariables such as poverty, inequality, and employment. Our results constitute a first macroeconomic approximation to the possible effects on these indicators; however, they do have some limitations granted by limited up-to-date macrodata available (e.g., social accounting matrix), modeling assumptions (e.g., perfect competition or closure rules), and a more volatile context caused by events since the 2014 elaboration of the SAM (e.g., petroleum crisis, tax reforms, earthquake). Therefore, we must underscore the need for further studies—especially ones with greater focus on microeconomic and dynamic aspects—to complement these results, so that policy implications can be established from a much more multidimensional standpoint.
Finally, due to the adverse effects of the abrupt reduction in oil prices since 2015, the results here should be taken as an insightful but probably overestimated exploration of the reforms’ impact on the economic environment when the government started releasing of fuel subsidy reforms. The use of the 2014 SAM prevents the general equilibrium model from capturing the medium-term effects of the recession in the Ecuadorian economy after 2015. As a consequence, the aforementioned results may be higher than those that would be obtained with more updated data. Nevertheless, it is crucial to acknowledge that this limitation provides a valuable opportunity for future research and underscores the significance of our study in shedding light on the pressing issues at hand.
Appendices
Aggregated values of the model’s SAM, 2014 (millions of USD)
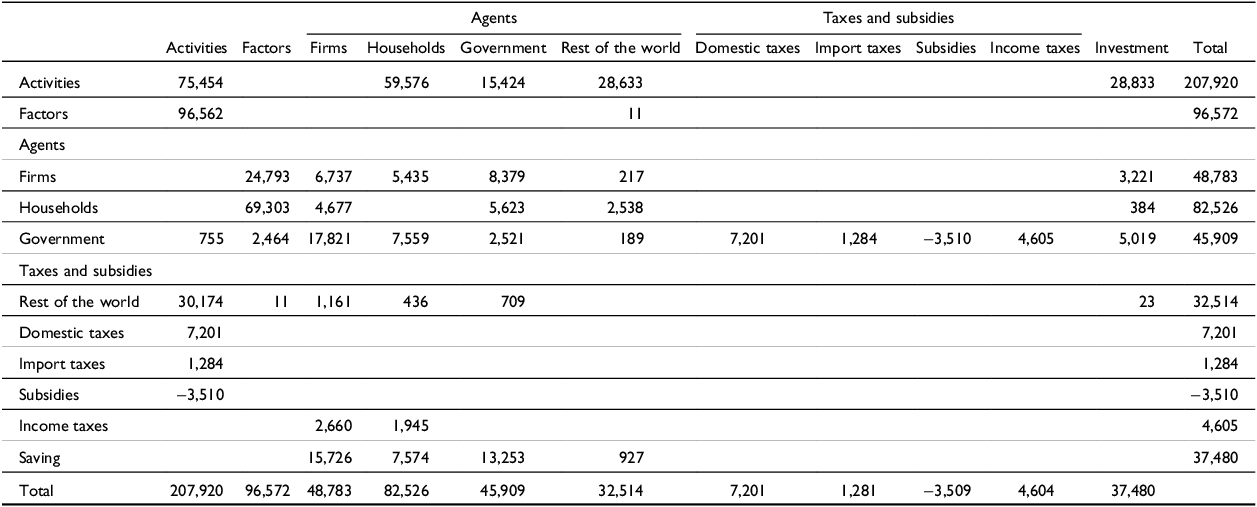
Source: Central Bank of Ecuador, National Institute of Statistics and Census, and author’s calculations.
Model’s elasticities
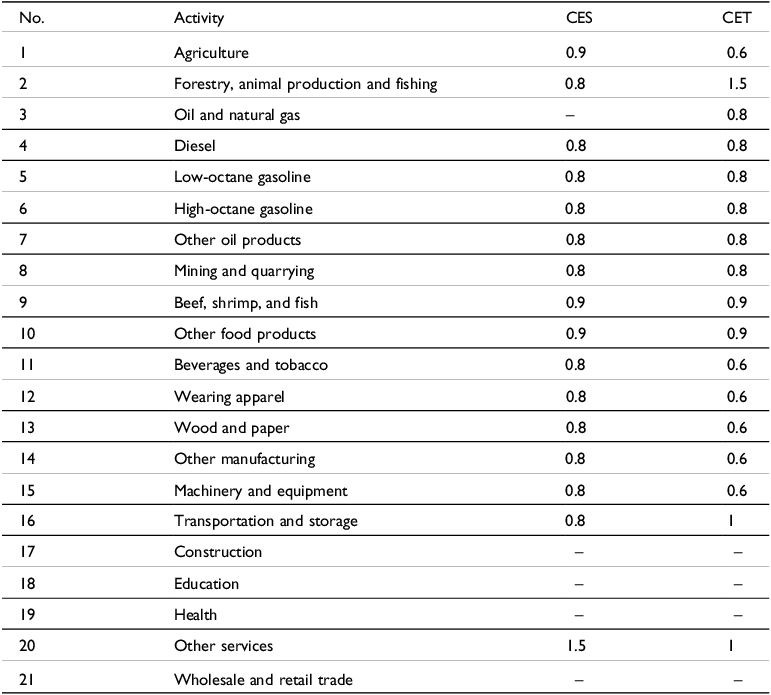
Source: Vos and León (Reference Vos and León2003); León, Rosero, and Vos (Reference León, Rosero and Vos2008).
Note: Blank cells refer to null values in the SAM.


 Open access