




Introduction
Recent research has highlighted the utility of using the same unit of analysis—house size—to compare wealth inequalities cross-culturally (Kohler and Smith Reference Kohler and Smith2018; Kohler et al. Reference Kohler, Smith, Bogaard, Feinman, Peterson, Betzenhauser, Pailes, Stone, Prentiss, Dennehy, Ellyson, Nicholas, Faulseit, Styring, Whitlam, Fochesato, Foor and Bowles2017). Although there are different dimensions and manifestations of inequality, house size (in the past and present) serves as a key indicator to assess patterned inequalities while yielding a material basis for comparison. Here, we build on foundational and global studies that have examined how sample size (Peterson and Drennan Reference Peterson, Drennan, Kohler and Smith2018), construction methods (Abbott et al. Reference Abbott, Craig, Zanotto, Judd and Kober2021), material culture (Feinman et al. Reference Feinman, Faulseit, Nicholas, Kohler and Smith2018; Hutson Reference Hutson2016; Munson and Scholnick Reference Munson and Scholnick2022), storage, and scale of community (Thompson et al. Reference Thompson, Feinman and Prufer2021a) affect inequality in specific cultural contexts using a Gini coefficient. As highlighted in this article and in this Compact Special Section of Ancient Mesoamerica, we find that assessments of wealth inequality using house size provide a robust empirical foundation for comprehensively evaluating ancient societies (Ames and Grier Reference Ames and Grier2020; Barnard Reference Barnard2021; Basri and Lawrence Reference Basri and Lawrence2020; Betzenhauser Reference Betzenhauser, Kohler and Smith2018; Bogaard et al. Reference Bogaard, Fochesato and Bowles2019; Brown et al. Reference Brown, Watson, Gravlin-Beman, Liebovitch and Braswell2012; Chase Reference Chase2017; Ellyson et al. Reference Ellyson, Kohler and Cameron2019; Feinman et al. Reference Feinman, Faulseit, Nicholas, Kohler and Smith2018; Hutson Reference Hutson2016; Hutson and Welch Reference Hutson and Welch2021; Kohler and Ellyson Reference Kohler, Ellyson, Kohler and Smith2018; Kohler and Higgins Reference Kohler and Higgins2016; Kohler et al. Reference Kohler, Smith, Bogaard, Feinman, Peterson, Betzenhauser, Pailes, Stone, Prentiss, Dennehy, Ellyson, Nicholas, Faulseit, Styring, Whitlam, Fochesato, Foor and Bowles2017; Pailes Reference Pailes, Kohler and Smith2018; Porčić Reference Porčić2012; Smith et al. Reference Smith, Dennehy, Kamp-Whittaker, Colon and Harkness2014; Stone Reference Stone, Kohler and Smith2018; Strawinska-Zanko et al. Reference Strawinska-Zanko, Liebovitch, Watson, Brown, Strawinska-Zanko and Liebovitch2018; Thompson et al. Reference Thompson, Feinman and Prufer2021a, Reference Thompson, Feinman, Lemly and Prufer2021b). However, because houses vary in form and complexity, exploring how the variations in analytical parameters of house size metrics and what is defined as a household impact our interpretations of wealth inequality in archaeological contexts are important considerations that can broaden understandings of residential inequality in the past (see also Munson et al. Reference Munson, Scholnick, Mejía Ramón and Aragon2023; Richards-Rissetto Reference Richards-Rissetto2023) and frame these data (and our findings), contextualizing them in ways that heighten their relevance for the present.
Inequality exists along spectra and is integral to many facets of life. One method to assess inequality is through wealth, which has been categorized into three basic forms: relational (personal connection and networks), embodied (physical health or stature), and material (land, labor, houses, and goods; see Borgerhoff Mulder et al. Reference Borgerhoff Mulder, Bowles, Hertz, Bell, Beise, Clark, Fazzio, Gurven, Hill, Hooper, Irons, Kaplan, Leonetti, Low, Marlowe, McElreath, Naidu, Nolin, Piraino, Quinlan, Schniter, Sear, Shenk, Smith, von Rueden and Wiessner2009; Chase et al. Reference Chase, Thompson, Walden and Feinman2023; Smith et al. Reference Smith, Mulder, Bowles, Gurven, Hertz and Shenk2010). In this article, we focus on differences in material wealth by using the Gini coefficient based on house size because house size often represents a large share of domestic wealth in ancient societies. Although there is a range of ways to assess material wealth, house size serves as an archaeological indicator that is applicable across many global contexts, including the Maya region. This allows for comparative assessments along multiple scales and dimensions.
The analytical sample employed here is drawn from nearly 2,000 residential structures, clustered into 716 plazuela groups among eight Classic Maya (a.d. 250/300–800) centers in southern Belize. Rather than asking why inequality developed, we explore how metrics of house size, including definitions of households, impact our interpretations of wealth inequality. To do so, we measure house size using area (m2) and volume (m3) for three definitions of households or units of analysis. Area provides insights into the total living space and is more readily available cross-culturally than measures of volume. Volume, however, provides potential insights into the labor efforts to construct ancient houses, which alludes to the power and authority of their occupants. But calculations of volume are more difficult to obtain in the absence of detailed survey, excavation, or lidar datasets.
We evaluate house size based on three units of analysis from two forms of households: individual structures and small clusters of structures around a central residential area, which we refer to as plazuelas. Among the plazuelas we measure the “total roofed area,” or the sum of all individual structures in the plazuela, and the built environment, including roofed and unroofed areas (Thompson et al. Reference Thompson, Feinman and Prufer2021a). Although a household represents the most basic economic and social unit (Wilk and Rathje Reference Wilk and Rathje1982), what constitutes a “household” remains debated in Maya archaeology. As defined by Hutson and colleagues (Reference Hutson, Hare, Stanton, Masson, Barth, Ardren and Magnoni2021:101362), “households are people who work together as minimal socio-economic groups, engaging in production, consumption, co-residence, and reproduction.” Archaeologically, the household as a social unit is represented by a group of buildings situated around a central plaza where daily activities occurred. In some parts of the Maya Lowlands, these architectural units are easily discernible on the ground. The sizes of domestic units (houses), which serve as an archaeological indicator of households, also represent a large share of domestic wealth visible in archaeological contexts.
To measure inequality, we calculate the Gini coefficient based on house size. The Gini coefficient assesses the unevenness of the distribution of units within a sample (Milanovic et al. Reference Milanovic, Lindert and Williamson2011; Peterson and Drennan Reference Peterson, Drennan, Kohler and Smith2018) and is frequently used as a metric for inequality. While the Gini coefficient measures the unevenness in the distribution of house size, the house size Gini coefficients are indices of the degree of inequality in those distributions, where Gini coefficients closer to 0 represent less variation in house size, while Gini coefficients closer to 1 often represent greater variations in house size.
We found that in southern Belize, the Gini coefficients of individual structures and the entire plazuela often parallel each other, but, in contrast, the Gini coefficients for all structures within a plazuela diverge from the results of the other two metrics. Our findings highlight the importance of defining the unit of analysis (see also Canuto et al. Reference Canuto, Auld-Thomas, Yagi and Barrientos Q.2023; Horn III et al. Reference Horn III, Tran and Ford2023), caution against direct comparisons of Gini coefficients for volume and area, and suggest that degree of inequality among individual residential structures largely parallels that of the entire plazuela, or the built environment of the household, making it possible to compare these two units of analysis in certain contexts.
Contextualizing southern Belize
Southern Belize is in the Eastern Lowlands, nearly 150 km from the Maya heartland, and is composed of four ecosystems rich in diverse resources. More than 20 Classic Maya centers are dispersed across southern Belize, primarily in the foothills, Maya Mountains, and cayes (small, sandy islands along reefs); few Classic period centers have been identified in the coastal plains (Figure 1). While other regions of the Maya Lowlands had sedentary communities and monumental architecture by the Middle Preclassic (Ebert et al. Reference Ebert, Peniche May, Culleton, Awe and Kennett2017; Horn III Reference Horn III2020:202; Inomata et al. Reference Inomata, MacLellan, Triadan, Munson, Burham, Aoyama, Nasu, Pinzón and Yonenobu2015), these features appear in southern Belize centuries later, around a.d. 100–200 (Braswell Reference Braswell2020; Prufer and Kennett Reference Prufer, Kennett, Houk, Arroyo and Powis2020; Thompson and Prufer Reference Thompson and Prufer2021). Initial occupation likely began centuries before the first permanent architecture, based on the long-term use of rock shelters as mortuary shrines (Prufer et al. Reference Prufer, Alsgaard, Robinson, Meredith, Culleton, Dennehy, Magee, Huckell, James Stemp, Awe, Capriles and Kennett2019) and the presence of cultigens by 2000 b.c. (Kennett et al. Reference Kennett, Prufer, Culleton, George, Robinson, Trask, Buckley, Moes, Kate, Harper, O'Donnell, Ray, Hill, Alsgaard, Merriman, Meredith, Edgar, Awe and Gutierrez2020). Uxbenká, Nim Li Punit, Ix Kuku'il, Kaq'ru’ Ha’, and Ek Xux dominated the regional landscape during the latter part of the Early Classic (a.d. 400–600), with the appearance of Lubaatun, Xnaheb, and Muklebal Tzul during the Late Classic (a.d. 600–800; Braswell and Prufer Reference Braswell and Prufer2009; Leventhal Reference Leventhal, Clancy and Harrison1990, Reference Leventhal, Danien and Sharer1992; Prufer Reference Prufer2002; Thompson and Prufer Reference Thompson and Prufer2019). Inland centers were largely abandoned during the Terminal Classic (a.d. 800–1000), as political disintegration swept across the Maya Lowlands (Ebert et al. Reference Ebert, Prufer, Macri, Winterhalder and Kennett2014). Coastal hamlets, including Ek Way Nal and Ta'ab Nuk Na, persisted well into the Terminal Classic (McKillop and Sills Reference McKillop and Sills2023) and Postclassic (McKillop Reference McKillop1996), and some small Maya communities continued to occupy inland southern Belize from a.d. 1000 to the 1880s (Prufer and Kennett Reference Prufer, Kennett, Houk, Arroyo and Powis2020; Thompson Reference Thompson2019), when Mopan and Q'eqchi’ Maya communities migrated from Guatemala (Wilk Reference Wilk1997).
Classic Maya centers in southern Belize (black points), with an emphasis on the eight centers used in this study (black triangles). Figure created by Thompson.

This study focuses on eight inland centers in southern Belize with robust settlement data (Thompson et al. Reference Thompson, Feinman, Lemly and Prufer2021b). Chronologic data for the centers of southern Belize are based on previously published ceramic, hieroglyphic, and radiocarbon data (see Thompson et al. Reference Thompson, Feinman, Lemly and Prufer2021b). Previous research indicates that approximately 95 percent of dated households at Uxbenká and Ix Kuku'il were occupied during the Late Classic, from a.d. 600–800 (Thompson and Prufer Reference Thompson, Prufer, Cervantes and Waldenin press), and research at other southern Belize centers indicates similar peak occupation dates (Prager et al. Reference Prager, Volta, Braswell and Braswell2014; Thompson et al. Reference Thompson, Feinman, Lemly and Prufer2021b; Thompson et al. Reference Thompson, Kosakowsky and Ploetz2023). Therefore, based on chronologies for each center in southern Belize, the Gini of house size data represent as a snapshot of wealth inequality just prior to the time of their abandonment, likely dating to around a.d. 700–800.
House size
Pedestrian survey was conducted at all eight Maya centers used in this study, including data from the lead author's doctoral research (Thompson Reference Thompson2019; see also Thompson et al. Reference Thompson, Feinman and Prufer2021a:S1 Table) and legacy data (Hammond Reference Hammond1975; Jamison Reference Jamison1993; Kindon Reference Kindon2002; Novotny Reference Novotny2015; see also Thompson et al. Reference Thompson, Feinman, Lemly and Prufer2021b:Appendix A). Most ancient Maya houses in southern Belize consist of small platforms, typically <0.5 m in height, composed of rocks and dirt likely topped with perishable superstructures (Figure 2). Pedestrian survey included documenting the size (length, width, and height), architectural complexity (elaborations such as staircases), location, and organization of ancient Maya houses and their larger patterns across the landscape. In total, this research analyzed 1,942 residential structures from more than 700 plazuela groups among eight Classic Maya centers (Table 1).
Units of analysis and units of measurement for house size data. Modified from Thompson et al. Reference Thompson, Feinman, Lemly and Prufer2021b:Figure 3.

Descriptive data for eight Classic Maya centers in southern Belize. Braswell Reference Braswell2020; Dunham Reference Dunham1990; Dunham et al. Reference Dunham, Jamison, Leventhal, McAnany and Isaac1989; Fauvelle Reference Fauvelle2012; Hammond Reference Hammond1975; Jamison Reference Jamison1993; Kindon Reference Kindon2002; Leventhal Reference Leventhal, Danien and Sharer1992; Novotny Reference Novotny2015; Prager and Braswell Reference Prager and Braswell2016; Prager et al. Reference Prager, Volta, Braswell and Braswell2014; Prufer Reference Prufer2002; Prufer et al. Reference Prufer, Moyes, Culleton, Kindon and Kennett2011, Reference Prufer, Thompson, Meredith, Jordan, Ebert, Culleton, Kalosky, Winterhalder and Kennett2017; Thompson Reference Thompson2019; Thompson and Prufer Reference Thompson and Prufer2019, Reference Thompson and Prufer2021).

Units of measurement
In our case study of southern Belize, area and volume data were (1) calculated from digitized survey maps for Uxbenká, Ix Kuku'il, and Lubaantun (Hammond Reference Hammond1975; Thompson Reference Thompson2019) in Esri's ArcGIS; (2) entered from tabular data for Ek Xux, Muklebal Tzul, Nim Li Punit, and Xnaheb (Jamison Reference Jamison1993; Kindon Reference Kindon2002); and (3) entered from data collected from figures and descriptions of Kaq'ru’ Ha’ (Novotny Reference Novotny2015). Previously, we reported volume data for Uxbenká and Ix Kuku'il (Thompson et al. Reference Thompson, Feinman and Prufer2021a) using a method derived from Ebert and colleagues (Reference Ebert, Hoggarth and Awe2016), which uses a triangulated irregular network model developed from a lidar-derived digital elevation model (DEM). Here, we update our assessment at Uxbenká and Ix Kuku'il, calculating new volumes using a lidar-derived DEM in ArcGIS, following methods outlined in Chase and colleagues (Reference Chase, Thompson, Walden and Feinman2023). Volume data were not obtained for Lubaantun because the legacy data lack detailed platform height.
Units of analysis
House size data were collected for three units of analysis (Figure 2): (1) individual residential structures; (2) all structures within a plazuela (i.e., all roofed areas); and (3) the entire plazuela (i.e., roofed and unroofed areas, including the built environment). Drawing on literature from Maya household archaeology in this region, we excluded residential platforms of less than 20 m2 (Ashmore Reference Ashmore and Ashmore1981; Hammond Reference Hammond1975) and greater than 275 m2 based on regional trends in southern Belize (Hammond Reference Hammond1975) from our Gini calculations for individual structures; these buildings were included when calculating Gini coefficients for all structures per plazuela and were included in the Gini calculates for the entire plazuela. In general, platforms less than 20 m2 were likely too small to be domiciles and probably functioned as ancillary buildings, such as turkey coops, storage areas, and so on (Webster and Gonlin Reference Webster and Gonlin1988). At Lubaantun, Hammond (Reference Hammond1975) noted that building platforms greater than 275 m2 were likely too large to function as domestic units. Therefore, we applied 275 m2 as the upper end of the spectrum of house sizes in southern Belize. Other articles in this Compact Special Section of Ancient Mesoamerica (and beyond) also use 20 m2 as the minimum house size, while the upper limit for house size varies based on regional contexts.
Results: Gini coefficients and Lorenz curves
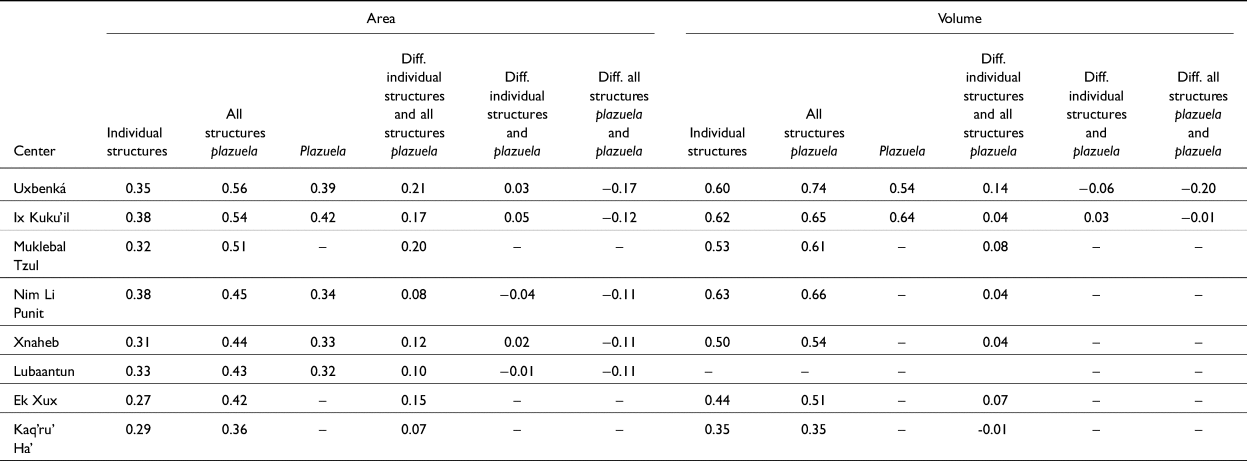
In southern Belize, house size and wealth inequalities vary among the centers in this study (Table 2; Supplementary Tables 1 and 2). Regardless of unit input parameters, Uxbenká, Ix Kuku'il, and Nim Li Punit have the highest Gini coefficients, ranging from 0.35 to 0.38 for individual structure area and from 0.62 to 0.63 for individual structure volume. Muklebal Tzul, Lubaantun, and Xnaheb have smaller variations in house size and slightly lower Gini coefficients, ranging from 0.31 to 0.33 for individual structure area and from 0.50 to 0.53 for individual structure volume. Ek Xux and Kaq'ru’ Ha’ have the lowest Gini, ranging from 0.27 to 0.29 for individual structure area and from 0.35 to 0.44 for individual structure volume. The differences in house size within each of these communities is amplified when assessing volume. Nonetheless, these Gini coefficients show variations in house size as only one measure of wealth inequality, highlighting the heterogeneity of ancient Maya communities even within a single subregion of the Maya Lowlands.
Results of Gini coefficients for the six metrics, including the upper and lower boundary, at a 95 percent confidence interval and the range of Ginis based on the confidence interval.
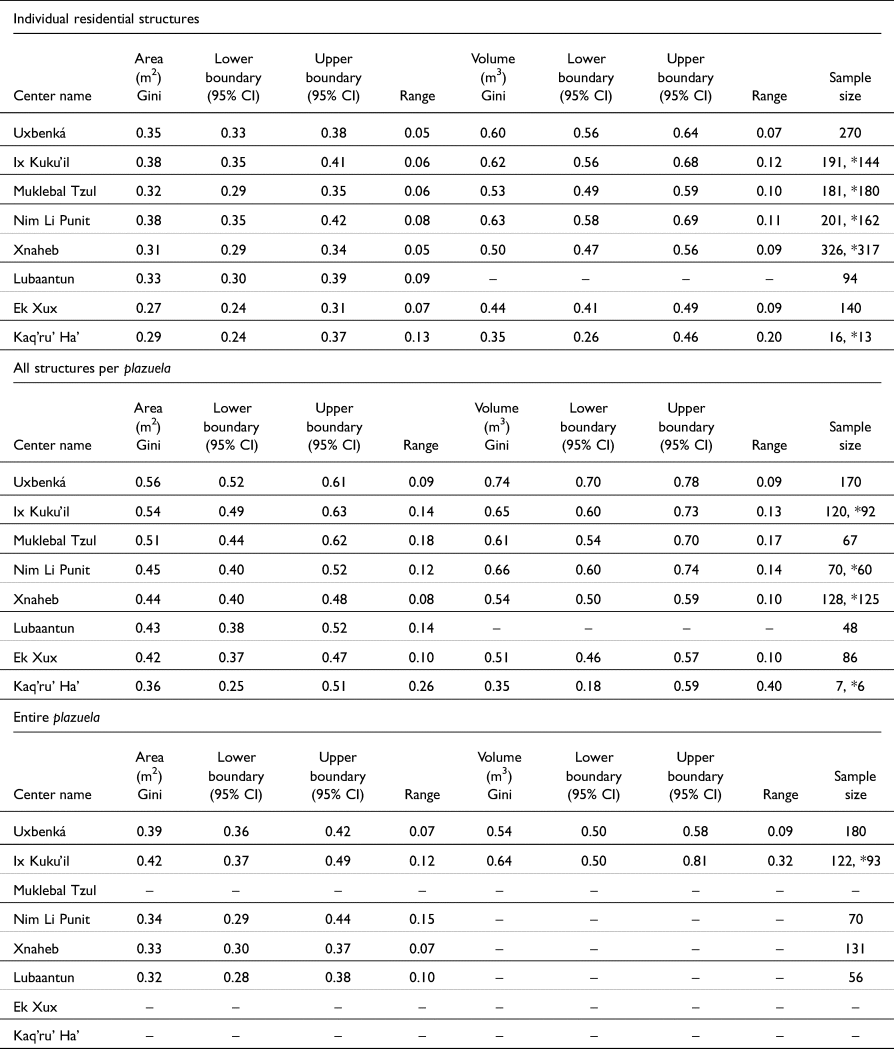
*indicates the sample size for volume if different than the area sample size.
Among the high-status (or elite) households and administrative areas of Uxbenká, Ix Kuku'il, Muklebal Tzul, Nim Li Punit, and Lubaantun there were elaborate, well-constructed tombs that contained prestige items such as jade, polychrome pottery, and chert eccentrics (Kindon Reference Kindon2002; Prager and Braswell Reference Prager and Braswell2016; Prufer et al. Reference Prufer, Moyes, Culleton, Kindon and Kennett2011; Thompson et al. Reference Thompson, Feinman and Prufer2021a); Furthermore, Uxbenká, Ix Kuku'il, Nim Li Punit, and Lubaantun had large temples, ballcourts, and carved monuments. Xnaheb and Ek Xux contain some of these features associated with power and authority, such as large temples, elite residential areas, and monuments, but ballcourts and elaborate tombs are yet to be documented at these centers. Finally, Kaq'ru’ Ha’ exhibits the least evidence for wealth inequality, both in regard to different architectural symbols of power and authority and in terms of house size variation. It is a small hamlet that contains lineage burials lacking elaborated tomb architecture, ballcourts, or carved monuments (Novotny Reference Novotny2015). The archaeological evidence often associated with power and authority parallel the Gini coefficients, where Uxbenká, Ix Kuku'il, Nim Li Punit, and Muklebal Tzul have higher Gini coefficients for both area and volume compared to Kaq'ru’ Ha'. The Gini coefficients for Lubaantun, Ek Xux, and Xnaheb are generally higher than Kaq'ru’ Ha’ and lower than Uxbenká, Ix Kuku'il, Nim Li Punit, and Muklebal Tzul, as may be expected for Ek Xux and Xnaheb, based on their lack of public displays of power and authority, such as ballcourts and elaborate tombs (Thompson et al. Reference Thompson, Feinman, Lemly and Prufer2021b).
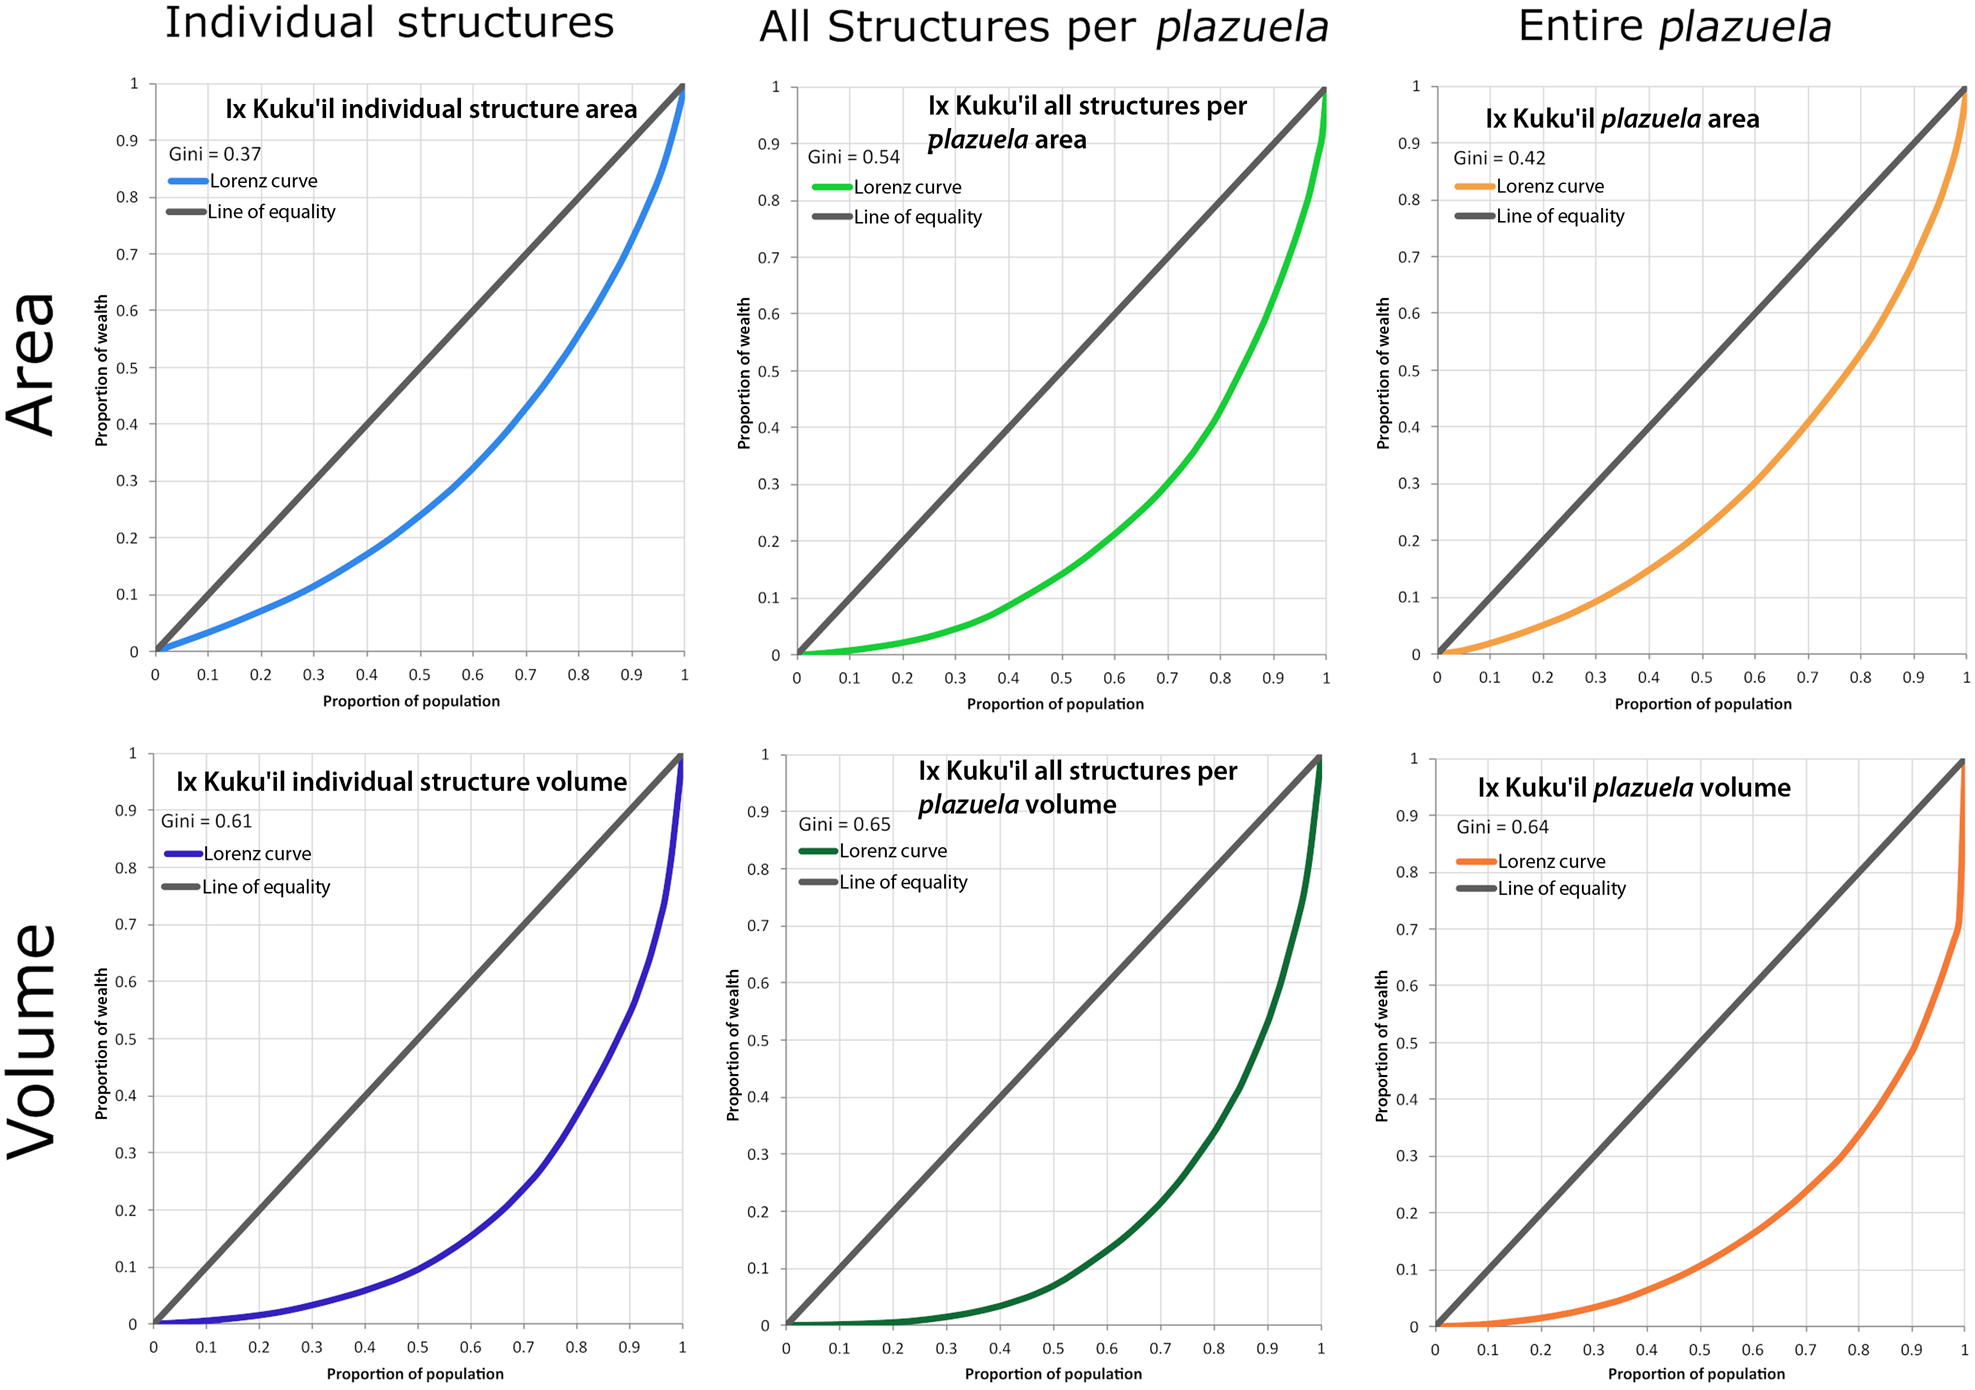
The degree of wealth inequality is assessed through the Gini as well as the Lorenz curve (see Chase et al. Reference Chase, Thompson, Walden and Feinman2023). The Gini coefficient is the numeric representation of the area under the curve, and the Lorenz curve visually displays the distribution of house sizes. The impact of a single large household on the Gini coefficient is visible in the Lorenz curve for the entire plazuela volume of Ix Kuku'il, where the largest house results in a steep rise in the Lorenz curve (Figure 3)—in this case, in a sample with a Gini of 0.64. The Lorenz curve shows that the top 10 percent of the population (0.90 on the x axis) has approximately 50 percent of the wealth (0.50 on the y axis) based on house size. In contrast, when visually assessing the Lorenz curve of the entire plazuela area, the top 10 percent of the population has approximately 30 percent of the wealth (Figure 3).
Lorenz curves for the six Gini coefficients at Ix Kuku'il, showing the difference in distribution of house size. A single large household on plazuela volume (dark orange, bottom right) results in a steep incline on the Lorenz curve. Figure created by Thompson.
Impacts of units of measurement: Area versus volume
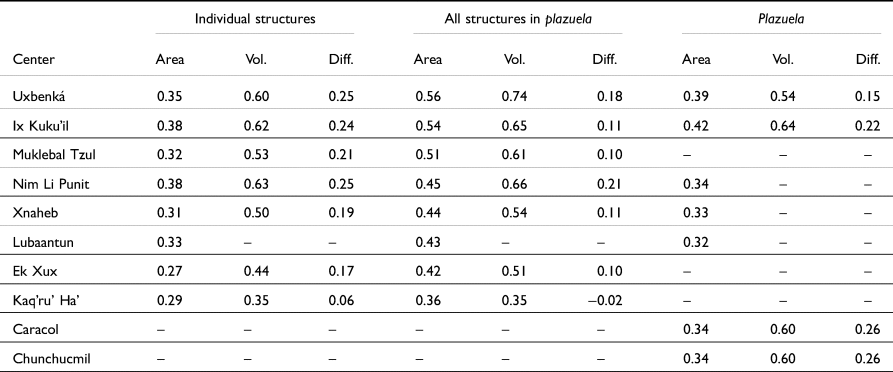
In the Maya region, household construction tended to accumulate over time, likely as a result of the intergenerational transmission of wealth and land tenure (Borgerhoff Mulder et al. Reference Borgerhoff Mulder, Bowles, Hertz, Bell, Beise, Clark, Fazzio, Gurven, Hill, Hooper, Irons, Kaplan, Leonetti, Low, Marlowe, McElreath, Naidu, Nolin, Piraino, Quinlan, Schniter, Sear, Shenk, Smith, von Rueden and Wiessner2009; LeCount et al. Reference LeCount, Walker, Blitz and Nelson2019; Munson and Scholnick Reference Munson and Scholnick2022; Thompson and Prufer Reference Thompson and Prufer2021). In our sample, the Gini coefficients for house size metrics of area versus volume generally parallel each other, but volume Ginis tend to be higher than area Ginis. For example, the Gini for entire plazuela area at Uxbenká is 0.39, while the Gini for entire plazuela volume is 0.54, with a difference of 0.15 (Table 3 and Figure 4). This trend was noted at other Maya centers as well, including Caracol, which has a plazuela area Gini of 0.34 and a plazuela volume Gini of 0.60, with a difference of 0.26 (Chase Reference Chase2017; Chase et al. Reference Chase, Thompson, Walden and Feinman2023), El Pilar (Horn III et al. Reference Horn III, Tran and Ford2023), La Corona (Canuto et al. Reference Canuto, Auld-Thomas, Yagi and Barrientos Q.2023), and Chunchucmil (Hutson and Welch Reference Hutson and Welch2021).
Differences (Diff.) in Gini coefficients between area (Area) and volume (Vol.) for the three units of analysis. Generally, volume Ginis are higher than area Ginis. Data from Caracol from Chase Reference Chase2017; data from Chunchucmil from Hutson and Welch Reference Hutson and Welch2021.
Box-and-whisker plots of Gini coefficients with 95 percent confidence intervals for the three units of analysis, comparing area and volume. These data are presented for (a) individual structures, (b) all structures per plazuela, and (c) the entire plazuela; see Figure 2. Cumulative range of Ginis with 95 percent CI for studied centers in southern Belize are shown at the bottom of the subfigure. Figure created by Thompson.

In southern Belize, excluding Kaq'ru’ Ha’, among individual residential structures, the difference between area and volume Ginis ranges from 0.17 to 0.25. Volume Ginis are higher than area Ginis. For example, at Nim Li Punit, if we report the area Gini of ~0.38, we may interpret lower degrees of inequality compared to if we report the volume Gini of ~0.63, which we may interpret as higher degrees of inequality based on differences in house size. This example highlights why we need to compare/contrast the same units of measurement (area or volume). When possible, we strongly caution against directly comparing volume and area Ginis, and recommend clearly stating which unit of measurement is evaluated. This finding shows why using the same unit of measurement—area or volume—for comparative studies of the Maya region is crucial to our interpretations.
Impacts of units of analysis: Individual structure versus all structures in the plazuela versus entire plazuela
Clear differences in Gini coefficients exist, based on our definitions of a household—that is, individual residential structures or the plazuela as the fundamental household unit (Table 4 and Figure 5). The difference between all structures within a plazuela and the entire plazuela highlights different uses of space in the past and analysts’ selection of data—that is, whether to include the total space that a household maintains or only the clearly delineated roofed spaces. In southern Belize, area Gini coefficients for individual residential structures and the entire plazuelas largely mirror each other, with plazuela Gini coefficients ±0.04 than individual structure Gini coefficients, but the 95 percent confidence intervals increase this difference. The same trend is visible for the volume Gini coefficients of individual residential structures and the entire plazuelas as well (Table 4). The parallels between Gini coefficients for individual residential structures and the entire plazuela extend beyond southern Belize. At Mayapan, the difference in area Gini coefficients for individual structures (0.32) and plazuelas (0.41) is 0.09 (Brown et al. Reference Brown, Watson, Gravlin-Beman, Liebovitch and Braswell2012; Kohler et al. Reference Kohler, Smith, Bogaard, Peterson, Betzenhauser, Feinman, Oka, Pailes, Prentiss, Stone, Dennehy, Ellyson, Kohler and Smith2018; Strawinska-Zanko et al. Reference Strawinska-Zanko, Liebovitch, Watson, Brown, Strawinska-Zanko and Liebovitch2018). At Chunchucmil, individual structure volume Ginis (0.63) are 0.03 greater than plazuela volume Ginis (0.60; Hutson Reference Hutson2016; Thompson et al. Reference Thompson, Feinman and Prufer2021a).
Differences in Gini coefficients between area and volume for the three units of analysis.
Box and whisker plots of Gini coefficients with 95 percent confidence intervals for area (m2) data for the three units of analysis at each southern Belize center. Cumulative range of Ginis with 95 percent CI for studied centers in southern Belize shown at the bottom of the figure. Blue = individual structures; green = all structures per plazuela; orange = entire plazuela. Figure created by Thompson.
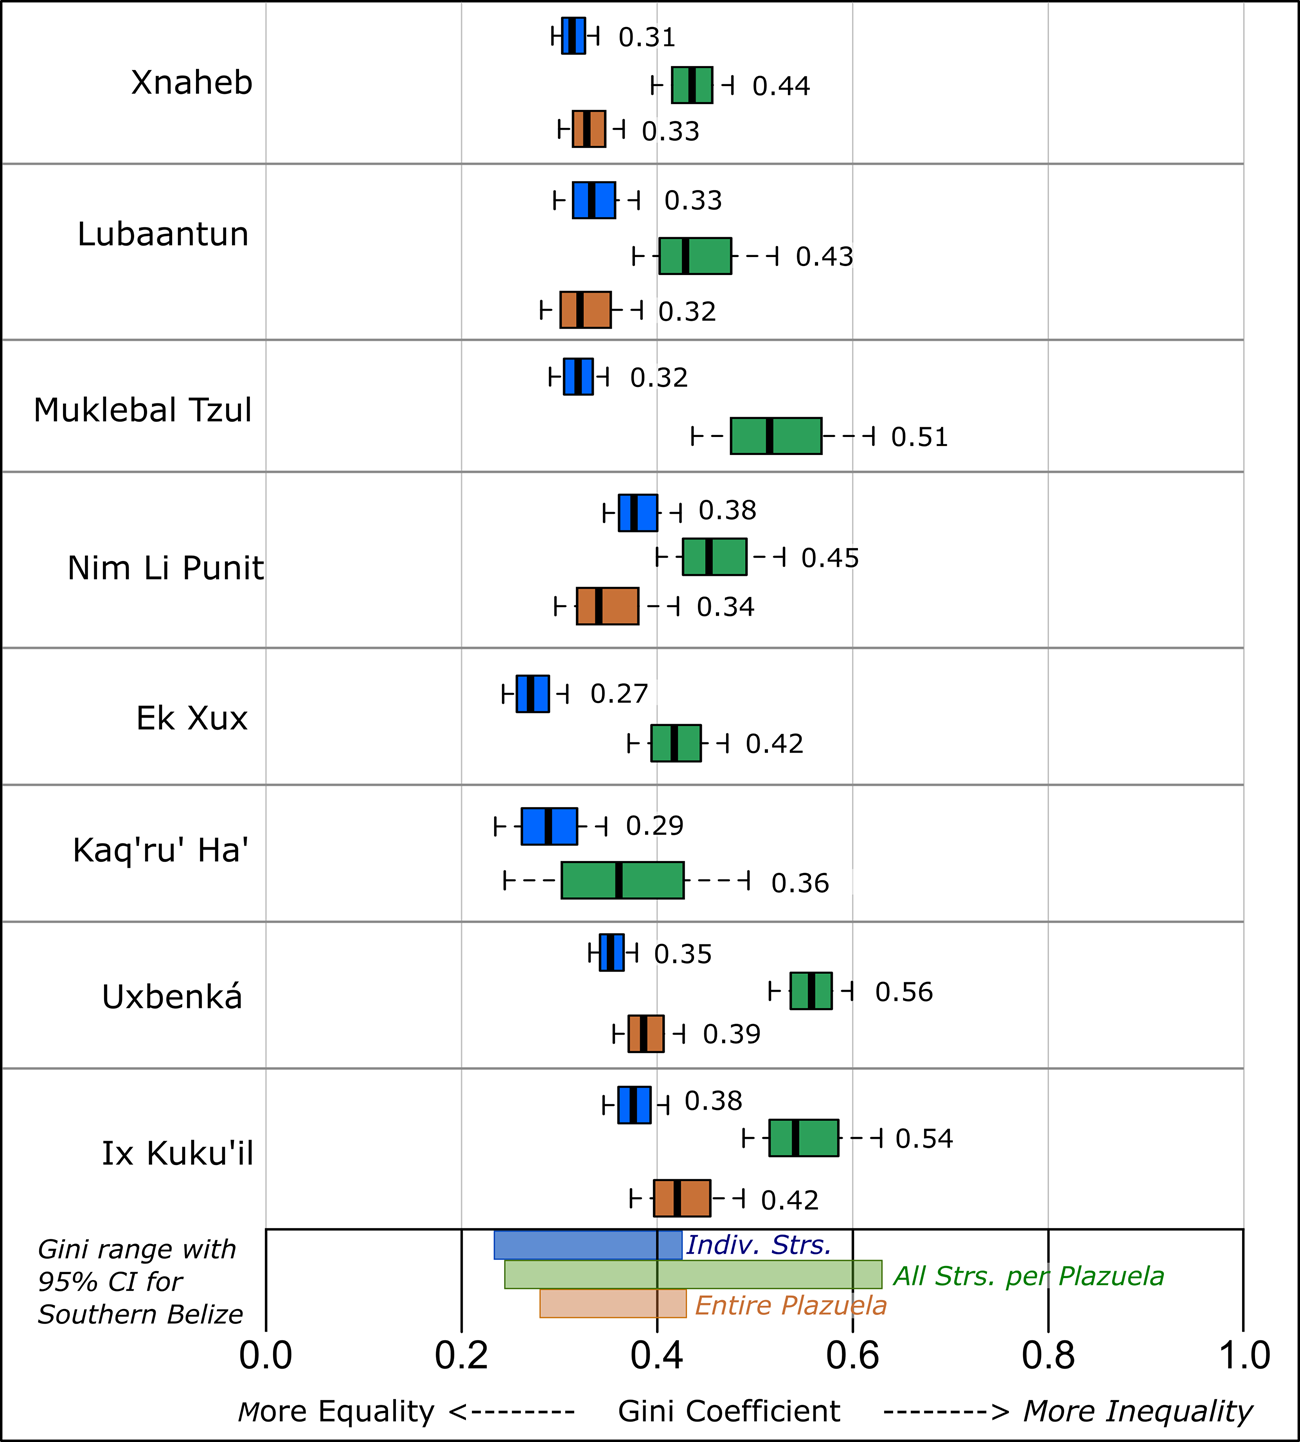
However, the Gini for all structures in a plazuela group, which includes outbuildings, storage buildings, and buildings of other functions, such as temples and shrines, is higher compared to the Gini for individual residential structures and the entire plazuela group. For example, for house size areas at Uxbenká, the Gini for individual residential structures is 0.35, 0.39 for the entire plazuela, and 0.56 for all structures per plazuela. In southern Belize, the difference between individual residential structures and all structures in a plazuela area Gini coefficient ranged from 0.07 to 0.20 (Table 4). The same trend is present among the house size volume Gini coefficients for all structures per plazuela group compared to the Gini coefficient for individual residential structures at the same center.
Likewise, comparing the area Gini for all structures in a plazuela to the area Gini for the entire plazuela shows a difference of Gini of 0.10–0.17, with all structures in a plazuela exhibiting higher Ginis. This trend holds true for the volume Ginis as well, although the sample size is low and the confidence intervals are wider. These findings highlight why clearly stating which unit of analysis was measured is important in our interpretations of inequality (see Canuto et al. Reference Canuto, Auld-Thomas, Yagi and Barrientos Q.2023) and that comparing Gini coefficients of individual residential structures with those from all residential structures in a plazuela can skew our interpretations.
Discussion and conclusion
We highlight how sample size, units of measurement, and units of analysis impact our interpretations of inequality based on house size metrics among the Classic Maya. Concerns with sample sizes are largely diminished due to bootstrapping and confidence intervals of the Ginis, but nonetheless, small sample sizes result in wide confidence interval ranges (see Deltas Reference Deltas2003). For example, Kaq'ru’ Ha’ has the largest ranges in Ginis, varying from 0.13 (individual structure area) to 0.40 (all structures per plazuela volume; Table 1). We show that area and volume are not comparable units of measurement, resulting in disparate Gini coefficients in places with similar construction methods. Finally, in our dataset there is more overlap between individual structures and the entire plazuela than with all structures (roofed areas) in the plazuela. There is a wider range in the 95 percent confidence interval for all structures within a plazuela likely because it includes non-residential components of house groups, leading us to favor using the entire plazuela when possible.
Here, variations in wealth inequalities are assessed using multiple house size metrics. The centers of southern Belize show variation in inequality along a spectrum, but seem to group together in small clusters based on the 95 percent confidence interval overlap in their Ginis and the presence of archaeological indicators of power and authority. Uxbenká, Ix Kuku'il, and Nim Li Punit have the highest Gini coefficients, suggesting high degrees of inequality, especially for volume metrics; Muklebal Tzul, Xnaheb, and Lubaantun have lower Gini coefficients compared to the previous group, suggesting the inequality is present, but to a lesser degree, based on house size metrics alone. Kaq'ru’ Ha’ and, to some degree, Ek Xux, have the lowest Gini coefficients, suggesting lower degrees of inequality based on house size. Comparing the Gini coefficients to other aspects of power and authority, such as carved stelae, ballcourts, E-groups, causeways, and elaborate tombs, higher degrees of inequality are present at centers with more political trappings (Thompson et al. Reference Thompson, Feinman, Lemly and Prufer2021b:Table 2).
Wealth inequalities are present in nearly all human societies. For more holistic and comprehensive comparatives, it is important to assess multiple lines of evidence to study inequality (Munson and Scholnick Reference Munson and Scholnick2022). Furthermore, we strive to compare and contrast “like with like” to avoid the parameters of our analysis affecting our interpretations. By incorporating confidence interval into comparisons, we can alleviate some issues of sample size; this also provides differing perspectives on which data are more/less similar. Our results from southern Belize do suggest a strong overlap between individual structure Ginis and entire plazuela Ginis, and this pattern should be tested in other regions.
Supplementary materials
To view supplementary material for this article, please visit https://doi.org/10.1017/S0956536123000135.
Supplementary Table 1. Descriptive statistics for area (m2) Gini calculations for individual structure, all structures per plazuela group, and entire plazuelas group for the eight Classic Maya centers discussed in this study.
Supplementary Table 2. Descriptive statistics for volume (m3) Gini calculations for individual structure, all structures per plazuela group, and entire plazuelas group for the eight Classic Maya centers discussed in this study.
Acknowledgments
Field research was conducted under permits issued by the Belizean Institute of Archaeology and the National Institute of Culture and History, and in collaboration with Mopan Maya communities of Santa Cruz and San Jose in southern Belize. We thank these institutions and communities for their ongoing support. We also thank Drs. Norman Hammond, Thomas Jamison, Claire Novotny, and Keith Prufer for their archaeological insights for some of the centers discussed in this article. The insightful feedback from three reviewers improved our manuscript, and we thank them for their detailed comments. This article was originally presented in a symposium on Maya Inequality at the 2022 Society for American Archaeology (SAA) annual meetings, and we thank the SAA for providing a venue to discuss this research.
Competing interests declaration
The authors declare no competing interests.
Data availability statement
All relevant data are provided in the manuscript or supplementary materials.
Funding statement
The results of this research were supported by numerous funding agencies, including the Bass Postdoctoral Fellowship at the Field Museum; National Science Foundation (BCS–DDIG-1649080, Keith M. Prufer and AET; BCS-0620445, Keith M. Prufer; HSD-0827305, Keith M. Prufer); the Explorer's Club of New York Exploration Fund (AET); the UNM Roger's Research Award (AET); and the Alphawood Foundation (Keith M. Prufer).


 Open access

